")
Back to Journals » Drug Design, Development and Therapy » Volume 12
Sustained curcumin release from PLGA microspheres improves bone formation under diabetic conditions by inhibiting the reactive oxygen species production
Received 17 October 2017
Accepted for publication 9 February 2018
Published 24 May 2018 Volume 2018:12 Pages 1453—1466
DOI https://doi.org/10.2147/DDDT.S154334
Checked for plagiarism Yes
Review by Single anonymous peer review
Peer reviewer comments 2
Editor who approved publication: Dr Georgios Panos

Yu Li,1 Zhan-Zhao Zhang1,2
1Department of Plastic and Reconstructive Surgery, Shanghai Key Laboratory of Tissue Engineering, Shanghai Ninth People’s Hospital, Shanghai Jiao Tong University School of Medicine, Shanghai 200011, People’s Republic of China; 2Department of Aesthetic Surgery, Hangzhou Raily Aesthetic Plastic Hospital, Hangzhou 310003, People’s Republic of China
Background: Excessive reactive oxygen species production caused by type 2 diabetes conditions can disrupt normal bone metabolism and greatly impair bone regeneration.
Materials and methods: In the present study, curcumin (Cur)-loaded microspheres were incorporated into a fish collagen nano-hydroxyapatite scaffold to promote bone repair under diabetic conditions by inhibiting the reactive oxygen species production.
Results: The drug release kinetic study showed that the Cur release from the composite scaffolds lasted up to 30 days. The sustained curcumin release from the scaffold significantly inhibited the overproduction of reactive oxygen species in mesenchymal stem cells caused by diabetic serum. Moreover, the Cur-loaded scaffold also remarkedly alleviated the negative effects of diabetic serum on the proliferation, migration, and osteogenic differentiation of mesenchymal stem cells. When implanted into bone defects in type 2 diabetic rats, the Cur-loaded scaffold also showed a greater bone formation capability compared to the pure scaffold.
Conclusion: The results of this study suggested that the novel controlled Cur release system may provide a promising route to improve bone regeneration in type 2 diabetic patients.
Keywords: curcumin, PLGA, drug delivery system, type 2 diabetes mellitus, bone repair
Introduction
Type 2 diabetes mellitus is a metabolic disease characterized by abnormal carbohydrate metabolism resulting from decreased insulin sensitivity and/or insulin deficiency.1 Impaired bone regeneration is often observed in type 2 diabetic patients, and they also have a greater incidence of bone fracture compared with unaffected people.2 Previous studies using an experimental diabetes model also showed that there is evidence for decreased progenitor activity, increased collagen degradation, and abnormal calcium metabolism.3 Thus, type 2 diabetes has been regarded as a major risk factor for clinical failure with delayed union or nonunion. The traditional method of promoting bone repair in type 2 diabetes mellitus is administration of insulin to lower blood glucose levels, but its therapeutic effect is unsatisfactory.4 Reconstruction of bone defects in type 2 diabetes mellitus remains a difficult problem in orthopedic surgery.
Recent studies showed that the abnormal reactive oxygen species (ROS) level in type 2 diabetes mellitus may be the chief cause of impaired bone formation.5,6 ROS are a spontaneously produced metabolic by-product in healthy cells and have local and distant pathophysiological effects under pathological conditions. The glycation products in the hyperglycemia condition of diabetes can trigger cellular innate immune response, and activate mitochondrial electron transport chain pathways, leading to the overproduction of ROS.7,8 The increased oxidative stress resulting from excessive ROS causes damage to macromolecular substances (nucleic acids and lipids), induces mesenchymal stem cells (MSCs) apoptosis, and delays their osteogenic differentiation.9,10 In line with these findings, scavenging ROS with antioxidant remarkably can protect MSCs from oxidative injury and reverse the negative effect of type 2 diabetes mellitus on bone formation.11
Curcumin (Cur) is a polyphenolic pigment which isolated from the rhizome of turmeric (Curcuma longa) and has been widely used for the treatment of inflammation-associated diseases.12,13 Recently, curcumin was reported to boost antioxidant defenses of microvascular endothelial cells by increasing HO-1 level and protect against the oxidative injury caused by H2O2 to the proliferation and osteogenic differentiation of human adipose-derived MSCs.14,15 However, the clinical application of curcumin is limited by its fast metabolism and poor water solubility. One cost-effective method to prolong the pharmacological activity of curcumin is to encapsulate it into controlled-release systems, such as polymeric particles, lipid nanoparticles, and liposome. Among these drug carriers, poly-lactic-co-glycolic acid (PLGA) microspheres become a preferred choice for its favorable stability, low toxicity, and high encapsulation efficiency for hydrophobic agents.16
The aim of our study was to assess if introduction of curcumin to bone graft materials would lead to more bone formation in type 2 diabetic rats. With this in mind, Cur-loaded PLGA microspheres were incorporated into a composite collagen/hydroxyapatite scaffold, in order to deliver a controlled and prolonged release of curcumin. We first investigated the effects of a curcumin-loaded/collagen nano-hydroxyapatite (Cur/CHA) on the proliferation, migration, and osteogenic differentiation of bone marrow-derived mesenchymal stem cells (BMSCs) cultured with diabetic serum. Furthermore, the Cur-loaded scaffold was implanted into a critical-sized rat calvarial defect to assess its capability of enhancing bone regeneration in vivo. To explore the possible mechanism of the beneficial action, the impacts of Cur-loaded scaffold on the ROS production, and mitochondrial status and Keap1/Nrf2/HO-1 signaling pathway are also evaluated.
Materials and methods
Microsphere and scaffold fabrication
Cur-loaded and unloaded microspheres were fabricated using the single emulsion solvent evaporation method. Briefly, 500 mg of PLGA was dissolved in 6 mL of dichloromethane (Aladdin, Shanghai, China) without or with Cur (25 mg; Sigma-Aldrich, St Louis, MO, USA) and sonicated for 30 s. The solution was then slowly dropped into 30 mL of 3% (w/v) aqueous polyvinyl acetate (PVA) solution (Sigma-Aldrich). After that, the emulsion was magnetic-stirred (200 rpm) for 6 h at room temperature to volatilize the solvent, and then the microspheres were isolated by centrifugation (500× g, 5 min). The obtained microspheres were washed three times with distilled water to remove residual PVA and lyophilized in a freeze-dryer (YiBei, Shanghai, China) for 48 h. The fish CHA scaffolds were prepared by utilizing freeze-drying technology. In brief, 400 mg of hydroxyapatite (HA; Sigma-Aldrich) powder with an average particle size less than 200 nm were dissolved in 10 mL of deionized water and sonicated for 10 min. Next, 200 mg of fish collagen (Taki Chemical, Hyogo, Japan) was added to the above suspension and thoroughly stirred. Then, the CHA slurry was degassed and added into plastic molds. The mixture in the plastic molds was pre-frozen at −80°C for 2 h and freeze-dried for 48 h. To incorporate the PLGA microspheres into the CHA scaffolds, 60 mg of PLGA microspheres were mixed well with 10 mL of CHA slurry and freeze-dried as above. After freeze-drying, the scaffolds were crosslinked by ultraviolet light (365 nm λ) for 15 min and sterilized with epoxyethane.
Morphology observation
The morphology of the microspheres and the scaffolds were examined by scanning electron microscopy (SEM; Hitachi, Ibaraki, Japan). Samples were attached to metallic studs using carbon glue and then sputter coated with a thin layer of gold. The SEM images were captured at an accelerating voltage of 10 kV. The average pore size was calculated according to the SEM images.
Encapsulation efficiency
To study the content of Cur encapsulated in the PLGA microspheres, 1 mg of PLGA microspheres was suspended in 10 mL of acetonitrile (Sigma-Aldrich) and thoroughly mixed. The amount of Cur in the solution was quantified by using a UV spectrophotometer (Beckman Coulter, Brea, CA, USA) at a wavelength of 240 nm.
Release properties
To examine the release profile of Cur from the PLGA microspheres and Cur/CHA scaffold, the samples were placed in 10 mL tubes and immersed in 2 mL of PBS and placed in a shaking water bath at 37°C. At the pre-set time points, the supernatant was collected and replaced with fresh PBS solution. The supernatant was analyzed for Cur content using a UV spectrophotometer at 240 nm.
Mechanical property test
Compressive testing was conducted on an Instron 5542 universal tester (Instron Corp., Norwood, MA, USA) with a 5-N load cell. In brief, samples with a diameter of 10 mm and a height of 3 mm were hydrated in PBS for 30 min prior to mechanical testing. After that, the hydrated samples were tested in unconfined compression at a loading rate of 0.5 mm/min to 40% strain. The slope of the initial linear elastic region of stress–strain curves was used to calculate the compressive modulus.
Porosity
The porosity of the scaffolds was measured using an ethanol infiltration method previously described by Kanimozhi et al.17 The sample was slowly immersed into a known volume (V1) of absolute alcohol solution (Aladdin) inside a measuring cylinder. After 1 h, the total volume of alcohol and sample was regarded as V2. After the sample was carefully removed, the residual volume of alcohol solution was measured as V3. The results were determined from the following formula:
|
Type 2 diabetic rat model
All animal experiments were conducted according to the protocols approved by the Animal Care and Use Committee of the Shanghai Ninth People’s Hospital (Shanghai, China). Fifty 8-week-old male Sprague Dawley rats, weighing a mean 200±17 g, were used in this study, and all rats were randomly divided into the diabetic group (n=25) and the normal group (n=25). The rats in the diabetic group were fed a diet consisting of 20% fat, 45% carbohydrate, and 22% protein until termination of the experiment. The rats in the normal group were fed a standard diet consisting of 5% fat, 52% carbohydrate, and 20% protein. After 4 weeks, the rats of the diabetic group were injected intraperitoneally with a single low dose (35 mg/kg body weight) of streptozotocin (Sigma-Aldrich) dissolved in citrate buffer (0.01M, pH 4.4). The rats whose blood glucose concentrations were higher than 16.7 mmol/L were regarded as type 2 diabetic rats. Body weight and blood glucose concentration of rats in both the diabetic and normal groups were measured at 1, 4, 5, and 8 weeks. An iodine [125I] insulin radioimmunoassay kit (Shanghai Ruiqi, China) was used to detect the blood insulin concentration at 8 weeks.
Isolation and culture of bone marrow mesenchymal stem cells
BMSCs were collected from the bone marrow of the rats. Briefly, both ends of the femurs were cut off by sterile operation scissors, and the bone marrow was rinsed thoroughly by PBS containing 1% penicillin-streptomycin (Invitrogen, Carlsbad, CA, USA). After that, the mixture was centrifuged at 500× g for 20 min, and the cell pellet was diluted with Dulbecco’s Modified Eagle’s Media (Hyclone, Logan, UT, USA) containing 10% fetal bovine serum (Gibco, Carlsbad, CA, USA) and 1% penicillin-streptomycin. The cells were cultured in T-75 flasks (BD Biosciences, San Jose, CA, USA) at 37°C in a humidified incubator containing 5% CO2, and the culture media were changed twice a week. The BMSCs were passaged when they were confluent, and the cells obtained at the end of the third passage were used for the experiments.
Determination of supernatant H2O2 and TBARS contents
The scaffolds seeded with BMSCs were divided into a NS group (normal serum+blank scaffold), a DS group (diabetic serum+blank scaffold), and a DS+Cur group (diabetic serum+Cur-loaded scaffold). The concentrations of H2O2 and thiobarbituric acid reactive substances (TBARS) in the cell culture supernatants were detected by TBARS assay kit (Cell Biolabs, San Diego, CA, USA) and Amplex Red assay kit (Invitrogen) following manufacturers’ instructions.
Determination of cytosolic ROS
BMSCs were digested from the scaffolds and incubated with 10 mM 2′,7′-dichlorofluorescein diacetate (DCF; Sigma-Aldrich) for 30 min in the dark. The fluorescence intensity of BMSCs was evaluated using a FACSCalibur flow cytometer (BD Biosciences). Results were expressed as the mean fluorescence intensity of 1×10⁵ BMSCs in each group.
Western blot
The protein was obtained with radio-immunoprecipitation assay (RIPA) lysis buffer containing 1% protease inhibitors, and the protein concentration was determined using an Enhanced BCA Protein Assay Kit (Beyotime). Equal amounts of protein were resolved on sodium dodecyl sulfate–polyacrylamide gel electrophoresis and transferred onto polyvinylidene fluoride membranes. The blocked membranes were incubated with primary antibody (Santa Cruz Biotechnology, Santa Cruz, CA, USA) overnight at 4°C. Membranes were washed with PBS-Tween® 20 (PBS-T) and incubated with a secondary antibody at room temperature for 1 h. Protein bands were visualized by ECL-Plus reagent (GE Healthcare, Piscataway, NJ, USA), and the relative ratio to β-actin expression was calculated for each sample.
mRNA extraction and real-time polymerase chain reaction (PCR)
BMSCs were washed three times with PBS, and total RNA was extracted using Trizol reagent (Beyotime). cDNA was synthesized from the total RNA using a commercial reverse transcription kit (Invitrogen). The human-specific primers for PCR amplification are listed in Table 1. The reaction conditions for PCR analysis included 40 cycles of denaturation at 95°C for 30 s, annealing at 58°C for 30 s, and extension at 72°C for 45 s. PCR amplified products were normalized with β-actin cDNA content.
 | Table 1 Primer sequences for RT-qPCR |
Cell viability and proliferation
The scaffolds were divided into a NS group, a DS group, and a DS+Cur group. For the cell proliferation assay, 3×10⁴ BMSCs in 100 μL of culture media were seeded on each scaffold and incubated for 4 h at 37°C in a humidified atmosphere of 5% CO2 and 95% air. Then, the samples were transferred to 6-well culture plates and 2 mL of culture media were added to each well. Three days after cell seeding, the scaffolds were washed with PBS for 5 min and stained using a live/dead cell imaging kit (Invitrogen) according to the manufacturer’s instructions. After that, the stained cells were examined with an inverted fluorescence microscope (Carl Zeiss Meditec, Jena, Germany). For cell proliferation evaluation, the culture media were changed every 3 days. At set time points, the scaffolds were transferred to a new culture plate, and the cell activity was investigated using the Cell Counting Kit-8 (CCK-8; Dojindo, Kumamoto, Japan). The absorbance was measured at 450 nm using a microplate reader.
Cell migration
The cell migration was evaluated using a scratch-wound assay. In brief, BMSCs were seeded in 6-well culture plates at a density of 6×10⁵ cells/well. After confluence, a line-shaped wound was made on the BMSCs by using a standard 200-μL pipette tip, and 0.8-μm-pore membrane covered inserts along with different scaffolds were added to the wells of the culture plates. At 24 h, images were acquired under an inverted microscope (Nikon Optiphot, Japan) and analyzed by ImageJ software (NIH, Bethesda, MD, USA).
In vitro osteogenesis study
In order to analyze osteogenesis of the scaffolds, BMSCs were seeded in culture plates and incubated in osteogenic culture media supplemented with 50 mg/mL of ascorbic acid, 10 mM β-glycerophosphate, and 10 nM dexamethasone (all Sigma-Aldrich). Then, 0.8-μm-pore membrane covered inserts, along with different scaffolds, were added to the wells of the culture plates.
Alkaline phosphatase enzyme activity
At 14 days after cell seeding, cells were fixed in 4% paraformaldehyde for 20 min and stained in alkaline phosphatase (ALP) staining solution (Beyotime) for 10 min in the dark. The ALP staining was extracted with 10% (w/v) cetylpyridinium chloride (Aladdin), and the absorbance was measured at 562 nm using a microplate reader.
Alizarin Red staining
The mineralized matrix nodules formed by BMSCs were evaluated using Alizarin Red staining. At days 21, the cells were washed three times with PBS, fixed in 4% paraformaldehyde for 30 min, and incubated with Alizarin Red solution (Beyotime) for 10 min at room temperature. After that, the nonspecific Alizarin Red staining was removed by washing three times with distilled water. Then, 10% (w/v) cetylpyridinium chloride was added to the culture plate, and the absorbance was measured at 450 nm using a microplate reader.
Animal surgical procedures
Animal experiments were approved by the Animal Care and Use Committee of the Shanghai Ninth People’s Hospital (Shanghai, China) and performed in accordance with the National Institutes of Health Guidelines for the Use of Laboratory Animals. The rats were divided into a control group (normal rats+blank scaffold), a diabetes group (type 2 diabetic rats+blank scaffold), and a diabetes+Cur group (type 2 diabetic rats+Cur-loaded scaffold). The rats were anesthetized with intraperitoneal injections of a ketamine (80 mg/kg; Bayer Korea, Seoul, Korea)–xylazine (8 mg/kg; Bayer Korea) mixture. After anesthetic procedure, a longitudinal skin incision was made on the scalp and parietal bones were separated from the muscles by blunt dissection. Then, a circular calvarial defect of 5 mm was created using a trephine drill, and scaffold materials were implanted into the defects. Eight weeks after surgery, rats were sacrificed for Micro-CT measurement and histological analysis.
Micro-CT measurement
The specimens were examined using a micro-CT scanning system (GEe Xplore Locus SP Micro-CT; GE Healthcare, Milwaukee, WI, USA), which was operated at 45 kV and 80 mA with a resolution of 20 μm. 3D images of the specimens were reconstructed from 2D slices and the morphometric parameter of bone volume per total volume (BV/TV) was analyzed using the CTAn software (Bruker Corporation, Kontich, Belgium).
Histological analysis
Specimens from bone defect sites were fixed in 10% formalin for 48 h, decalcified in 10% ethylene diamine tetraacetic acid (EDTA; Sigma-Aldrich) for 21 days, and embedded in paraffin wax (Aladdin). Sections of 5 μm thickness were sectioned using a histotome, stained with H&E (Beyotime), and examined by light microscopy.
The protein level of PECAM-1 and VEGF
The tissues in the defect area were cut down and grinded in liquid nitrogen and then lysed in radioimmunoprecipitation assay (RIPA) buffer for 30 min. The lysate was centrifuged at 4°C and 10,000 rpm for 10 min. The supernatant was carefully collected to obtain total protein. After that, Western blot was performed as above.
Statistical analysis
All the presented data are expressed as the mean±standard deviation. The normality of our data was confirmed by Shapiro–Wilk test using SPSS 22.0 software (IBM Inc., Armonk, NY, USA). All the data fitted the normal distribution (the P-value of the Shapiro–Wilk test was higher than 0.05). The differences were statistically evaluated by Student’s t-test or analysis of variance (ANOVA) with Tukey’s post-hoc, using GraphPad Prism 6 (GraphPad Software Inc., San Diego, CA, USA). t-test was used to test the significance between two groups, while, for the comparison of three groups, we used ANOVA. A P-value less than 0.05 was accepted as a statistically significant difference. Power analyses were performed using PASS 11 software (NCSS Inc., Kaysville, UT, USA). The power of all statistical tests used in the study was greater than 0.8.
Results
The morphology of PLGA microspheres and scaffolds
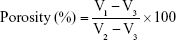
As shown in SEM images (Figure 1A and B), the blank PLGA microspheres exhibited fine and round morphology, and their particle size distribution was in the range of 2–18 μm. There was no difference in morphology or particle size between the blank PLGA microspheres and Cur-loaded PLGA microspheres. Figure 1C and D showed the SEM images of cross-sections of CHA and Cur/CHA scaffolds. The CHA scaffolds showed an interconnected porous structure, and the PLGA microspheres were uniformly distributed in the scaffold. The incorporation of PLGA microspheres into the scaffolds did not remarkedly change the morphology of the CHA scaffold.
 | Figure 1 SEM micrographs of (A) blank PLGA microspheres, (B) Cur-loaded PLGA microspheres, (C) CHA scaffold, and (D) Cur/CHA scaffold. |
Release profile of curcumin from free microspheres and scaffolds
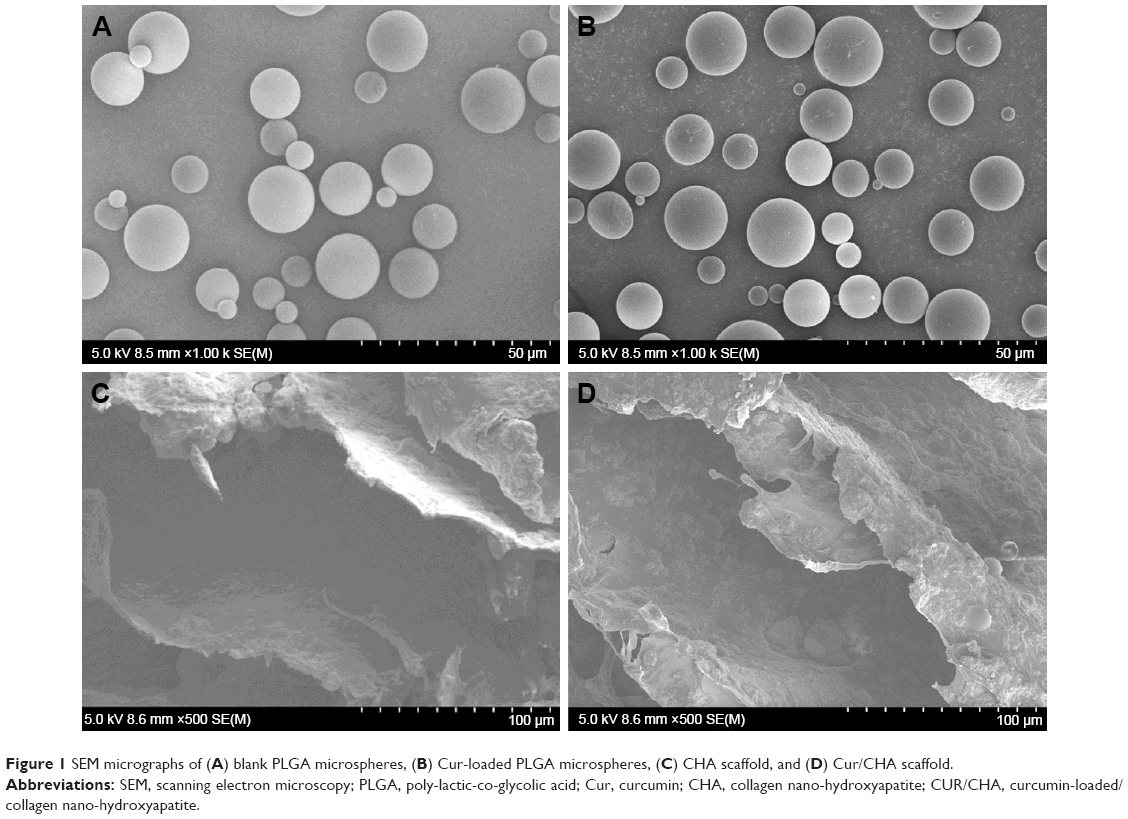
The in vitro release profile of the Cur from the microspheres was analyzed by UV spectrophotometry (Figure 2A). The Cur-loaded PLGA microspheres exhibited a sharp initial burst, of which approximately 40% of the loaded Cur was released over the first 3 days. After that, the remaining Cur was released in a sustained manner between day 3 and day 30. The average release rate of Cur was over 90% after 30 days. The incorporation of PLGA microspheres into the scaffolds changed the Cur release process from two stages to three stages (Figure 2B). In addition, it also significantly reduced the burst release, and only 20% of the loaded Cur was released from the scaffold over the first 3 days. After a high burst release within the first 3 days, a sustained and controlled release was observed in the next 27 days. The cumulative Cur release from the Cur/CHA scaffold was about 67% at the end-point of the study.
 | Figure 2 Cumulative Cur release from (A) PLGA microspheres and (B) Cur/CHA scaffold. (C) Pore diameter, porosity, and compressive modulus of CHA and Cur/CHA scaffolds. |
Physical properties of scaffolds
As shown in Figure 2C, the CHA scaffold had a mean pore size of 121.3 μm and a porosity of 86.8%, and the incorporation of PLGA microspheres into the scaffolds slightly reduced the pore size (112.5 μm) (t-test, P=0.877) and the porosity (82.1%) (t-test, P=0.802), but the pore structure of the Cur/CHA scaffold was still suitable for bone regeneration.18 In contrast, the compressive modulus of the Cur/CHA scaffold (16.9 kPa) was higher than that of the CHA scaffold (14.5 kPa) (t-test, P=0.831).
Type 2 diabetic rat model
During the whole feeding process, no difference in body weight was found between the type 2 diabetic and normal groups (Figure 3A). Four weeks after injection of streptozotocin, the blood glucose of rats in the type 2 diabetic group was three times higher than that of rats in the normal group (Figure 3B) (t-test, P<0.001). In addition, streptozotocin also significantly decreased the serum insulin concentration of rats in the type 2 diabetic group (Figure 3C) (t-test, P<0.001).
 | Figure 3 Changes in (A) body weight, (B) blood glucose, and (C) insulin concentration of the type 2 diabetic group and the normal group during the feeding period. The ROS in the supernatant was determined by measuring (D) H2O2 and (E) TBARS level. (F) The intracellular ROS was evaluated by DCF fluorescence. The mitochondrial status was evaluated by Western blot of (G) MnSOD and (H) NOX4 expression. |
ROS production
Seven days after cell seeding, diabetic serum obviously promoted the production of H2O2 (one-way ANOVA, P<0.001), TBARS (one-way ANOVA, P<0.001), and DCF fluorescence (one-way ANOVA, P<0.001) compared with normal serum (Figure 3D–F). However, the Cur-loaded scaffolds significantly decreased the H2O2 (one-way ANOVA, P<0.001) and TBARS level (one-way ANOVA, P<0.01), and the intensity of DCF fluorescence (one-way ANOVA, P<0.01). In addition, the production of H2O2 (one-way ANOVA, P=0.221), TBARS (one-way ANOVA, P=0.143), and DCF fluorescence (one-way ANOVA, P=0.193) in the DS+Cur group was close to that in the NS group.
Mitochondrial status
To evaluate the mitochondrial status of different groups, Western blot was performed to determine the protein expression of MnSOD and NOX4. As shown in Figure 3G and H, diabetic serum significantly promoted the expression of NOX4 (one-way ANOVA, P<0.001), but inhibited the expression of MnSOD (one-way ANOVA, P<0.001), while Cur reversed the effect of diabetic serum on the protein expression of NOX4 (one-way ANOVA, P<0.01) and MnSOD (one-way ANOVA, P<0.001).
Keap1/Nrf2/HO-1 signaling pathway
Keap1/Nrf2/HO-1 signaling is well known to protect cells from hostile stimulations of oxidative stress or inflammation response. After a 12-h incubation, the BMSCs treated with diabetic serum displayed the decreased total Nrf2 (both Western blot and PCR, one-way ANOVA, P<0.001), HO-1 expression (both Western blot and PCR, one-way ANOVA, P<0.001), and increased Keap1 expression (both Western blot and PCR, one-way ANOVA, P<0.001) at both protein (Figure 4A–D) and mRNA level (Figure 4E–G) compared to the BMSCs incubated with normal serum. However, Cur released from the scaffold downregulated Keap1 level (both Western blot and PCR, one-way ANOVA, P<0.001), but upregulated total Nrf2 (Western blot, one-way ANOVA, P<0.01; PCR, one-way ANOVA, P<0.001) and HO-1 expressions (Western blot, one-way ANOVA, P=0.015; PCR, one-way ANOVA, P<0.01) at both protein and mRNA level in the BMSCs treated with diabetic serum.
 | Figure 4 (A) Represented blots showing the protein expressions of Keap1, Nrf2, and HO-1. Bar graph showing the relative protein level of (B) Keap1, (C) Nrf2, and (D) HO-1. The mRNA levels of Keap1 (E), Nrf2 (F), and HO-1 (G) were detected with real-time PCR. |
Cell viability and proliferation
The effects of diabetic serum and Cur/CHA scaffold on cell viability were assessed by live–dead cell staining. After 3 days of incubation, diabetic serum remarkedly reduced the number of viable cells (green), but increased the number of apoptotic cells (red), compared to the normal serum (Figure 5A). The Cur/CHA scaffold obviously reversed the adverse impact of diabetic serum on cell viability, and the proportion of the viable cells of the DS+Cur group was similar to that of the NS group. In addition, a CCK-8 assay was performed to determine the effects of diabetic serum and Cur/CHA scaffold on the proliferation of BMSCs. As shown in Figure 5B, the optical density value of all groups gradually increased as the culture time prolonged. The optical density value of the NS group was significantly higher than that of the DS group from the third day to the seventh day (day 3, two-way ANOVA, P<0.01; day 5, two-way ANOVA, P<0.01; day 7, two-way ANOVA, P<0.001). During the entire process of the experiment, no significant difference in cell number was found between the NS group and the DS+Cur group (day 3, two-way ANOVA, P=0.232; day 5, two-way ANOVA, P=0.188; day 7, two-way ANOVA, P=0.160).
 | Figure 5 (A) Fluorescence microscopy images of BMSCs at 3 days post-seeding (green points: live cells, red points: dead cells). (B) Cell proliferation of BMSCs cultured on different scaffolds was measured by CCK-8 assay at 1, 3, 5, and 7 days post-seeding. |
Cell migration
The migration of BMSCs was largely suppressed under diabetic condition, and only a few cells migrated into the wound area after a 24-h incubation. Both the NS and DS+Cur groups had a much smaller blank area than the DS group (Figure 6A). As shown in Figure 6B, the quantitative analysis also indicated that the migration area of the DS+Cur group was much bigger than that of the DS group (one-way ANOVA, P<0.01). However, the migration area of the DS+Cur group was still lower than that of the NS group (one-way ANOVA, P=0.018).
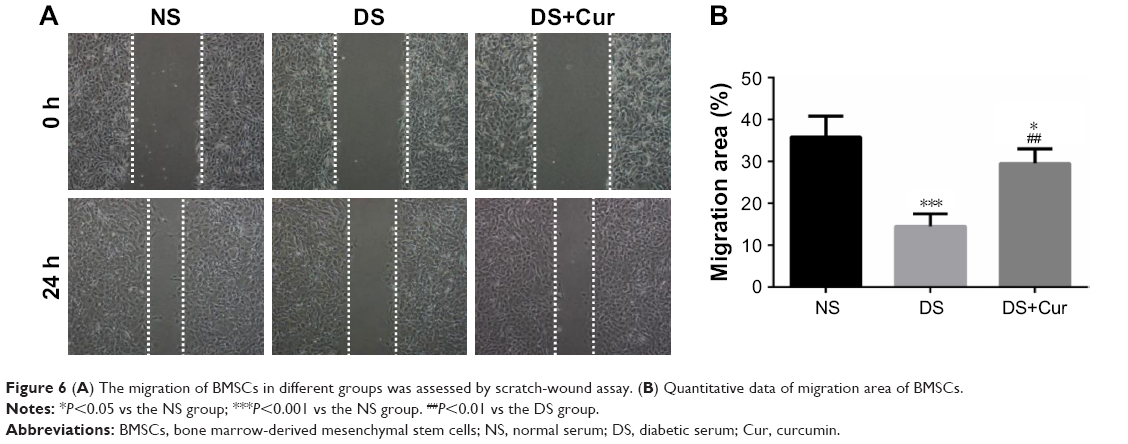 | Figure 6 (A) The migration of BMSCs in different groups was assessed by scratch-wound assay. (B) Quantitative data of migration area of BMSCs. |
Alkaline phosphatase activity and calcium deposition
The ALP activity and calcium deposition were determined by ALP staining and Alizarin Red staining, respectively. As shown Figure 7A and C, the ALP activity and calcium deposition level of the DS+Cur group was much higher than that of the DS group (both ALP activity and calcium deposition, one-way ANOVA, P<0.01). Quantitative analysis showed that the NS group exhibited significantly more calcium deposition than the DS+Cur group (Figure 7D) (one-way ANOVA, P=0.017). However, the ALP activity of the NS and DS+Cur groups did not differ significantly (Figure 7B) (one-way ANOVA, P=0.158).
 | Figure 7 (A) ALP activity of different groups was evaluated by ALP staining. (B) The semi-quantitative result of ALP staining. (C) Calcium deposition of different groups was evaluated by Alizarin Red staining. (D) The semi-quantitative result of Alizarin Red staining. The mRNA expression levels of (E) OCN, (F) RUNX2, and (G) OPN in BMSCs in different groups after 14 days of incubation. The results are represented as relative ratio to the NS group. |
Osteogenic gene expression
The mRNA expression levels of OCN, RUNX 2, and OPN in BMSCs cultured in different groups were examined by quantitative real-time RT-PCR, and are shown in Figure 7E–G. The expression level of OCN (one-way ANOVA, P<0.001), RUNX 2 (one-way ANOVA, P<0.001), and OPN (one-way ANOVA, P<0.001) of the DS+Cur group was significantly higher than that of the DS group. The expression of OPN in the NS group was remarkedly higher than that in the DS+Cur group (one-way ANOVA, P=0.013), whereas no significant difference in the expression of OCN (one-way ANOVA, P=0.162) and RUNX 2 (one-way ANOVA, P=0.204) was found between the two groups.
Micro-CT measurement
The amount of new bone formation within the calvarial defect was evaluated using Micro-CT. At 8 weeks postoperatively, increased bone formation was observed in the control and diabetes+Cur groups, when compared to the diabetes group (Figure 8A). The quantitative analysis indicated that the BV/TV value of the diabetes+Cur group was significantly higher than that of the DS group (one-way ANOVA, P<0.01), and did not differ remarkedly with that of the control group (Figure 8B) (one-way ANOVA, P=0.089).
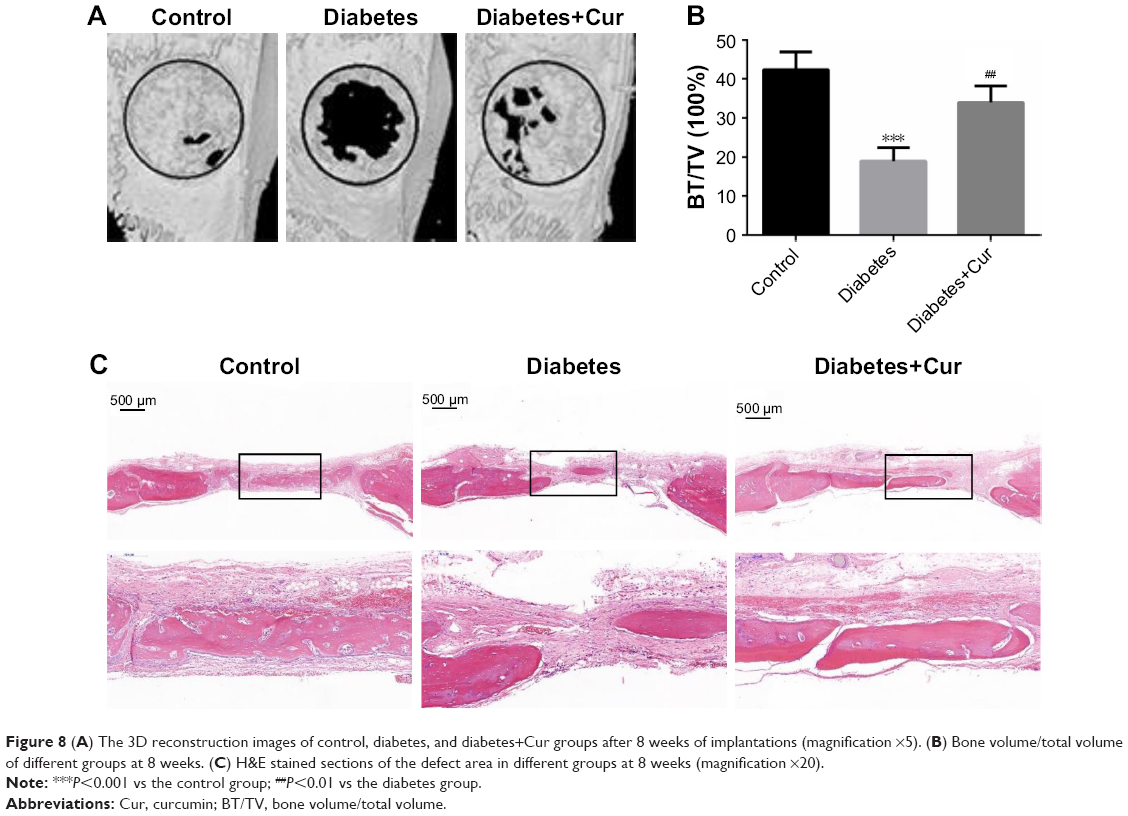 | Figure 8 (A) The 3D reconstruction images of control, diabetes, and diabetes+Cur groups after 8 weeks of implantations (magnification ×5). (B) Bone volume/total volume of different groups at 8 weeks. (C) H&E stained sections of the defect area in different groups at 8 weeks (magnification ×20). |
Histological examination
Representative sections of H&E staining are shown in Figure 8C. Consistent with the micro-CT results, diabetic condition greatly impaired the bone regeneration. While some newly formed bone tissue can be found at the defect edges, most of the defect area in the diabetic group was occupied with fibrous connective tissues. However, the Cur-loaded scaffold demonstrated robust osteogenic activity in diabetic condition, and a large amount of eosin-stained newly formed bone tissue could be found at the defect area of the diabetes+Cur group.
The protein level of PECAM-1 and VEGF
The protein expression of PECAM-1 and VEGF was assessed by Western blot to determine the vascular recruitment condition in each group. PECAM-1 protein expression decreased significantly in the diabetes group compared with the control group (Figure 9A and B) (one-way ANOVA, P<0.001). However, Cur-loaded scaffold significantly increased the PECAM-1 expression in the diabetes rats (one-way ANOVA, P=0.014). In line with the result of PECAM-1, the VEGF expression of the diabetes groups was also significantly lower than that of the diabetes+Cur group (Figure 9C) (one-way ANOVA, P<0.01).
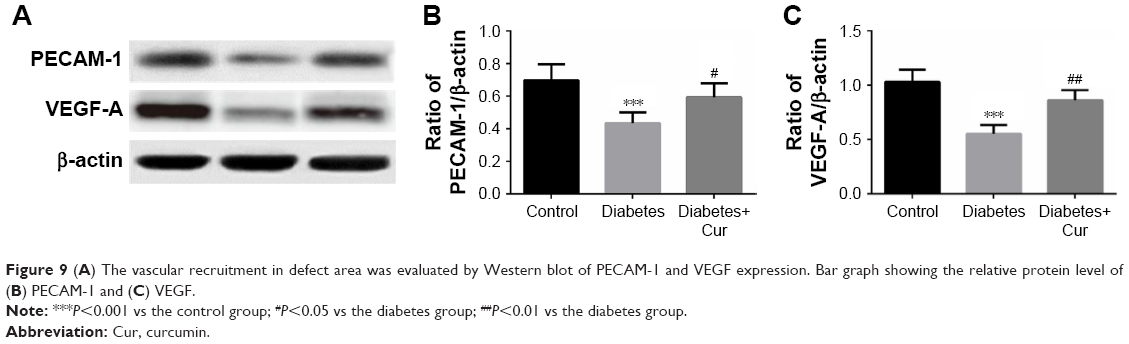 | Figure 9 (A) The vascular recruitment in defect area was evaluated by Western blot of PECAM-1 and VEGF expression. Bar graph showing the relative protein level of (B) PECAM-1 and (C) VEGF. |
Discussion
With the rapid developments of materials science and biotechnology, the role of bone tissue engineering scaffolds is gradually evolving from simple support materials for cell adhesion and growth to bio-active matrices, which can improve bone regeneration microenvironment by sustained release of biomolecules.19,20 In the present study, the CHA scaffold was functionalized with Cur-loaded PLGA microspheres, in order to inhibit the overproduction of reactive oxygen species in type 2 diabetic condition. It was documented that the Cur-releasing functionalized CHA scaffold obviously alleviated the negative impacts of diabetic serum on the proliferation, migration, and osteogenic differentiation of BMSCs. Furthermore, the superior osteogenesis potential of the Cur/CHA scaffold was also confirmed by a rat critical-size calvarial defect model.
Over the last decades, composite materials made from hydroxyapatite and collagen have attracted a great deal of attention for their good biocompatibility and excellent ability of promoting bone regeneration.21,22 Currently, most of the collagen materials used for fabricating bone grafts are extracted from mammals, such as cattle, pigs, and rats. However, the use of mammalian-derived collagen may transmit zoonotic diseases, such as bovine spongiform encephalopathy and foot-and-mouth disease, and is limited by religious affiliation.23 Recently, fish collagen has been suggested as an alternative to mammalian collagen because it did not transmit zoonotic and is not restricted by religious dogma.24 In addition, fish collagen also has the advantages of abundance in resources, low cost, and easy synthesis.25 Although fish collagen has been widely used as food and cosmetic materials, its application in bone tissue engineering was rarely reported.
In the present study, we encapsulated Cur into PLGA microspheres using a single emulsion-solvent evaporation method, which is a proven method to produce small-diameter microspheres with high lipophilic drug encapsulation efficiency. The release profile of Cur-loaded PLGA microspheres showed a sharp initial burst release for 3 days, followed by a slowly sustained release for over 27 days. The burst phase may be caused by the rapid diffusion of surface-bound drug, whereas the lag phase may be determined by the dissolution of PLGA materials and release of the drug from the inner part of the microspheres.26,27 When incorporated into the CHA scaffold, the release of Cur showed a slower release pattern to free Cur-loaded PLGA microspheres, which may be due to the additional diffusive barrier provided by the scaffold. In addition, the PLGA microspheres were uniformly distributed within the CHA scaffold and did not significantly change the scaffold micro-architecture. The mean pore size of the Cur/CHA scaffold was about 112.5 μm, and its porosity value was over 80%, which can provide an appropriate pore space to facilitate cell infiltration, vascular ingrowth, and nutrition supply.28
Consistent with the previous reports of excessive ROS in type 2 diabetic condition, our result showed that diabetic serum can elevate the H2O2 and TBARS levels, and the intracellular ROS production in BMSC. In addition, the Cur encapsulated in the scaffold retained antioxidant activity and significantly decreased the production of H2O2, TBARS, and intracellular ROS in BMSCs. The Keap1–Nrf2 system is a vital member of protecting cells from oxidative damage. In the absence of oxidative stress, Keap1 bonds to Nrf2 and retains its low levels in the cytoplasm. When exposed to oxidative stress, Nrf2 is dissociated from Keap1 and subsequently regulates the induction of the induction of various antioxidant genes including HO-1.29 Our results found that Cur released from the scaffold significantly increased the expression of Nrf2 and HO-1 in BMSCs treated with diabetic serum, but decreased the Keap1 expression in them, which may be part of the reason for the decreased ROS production.
The adverse effect of diabetic serum on cell proliferation was also remarkedly relieved by the Cur, which indirectly indicated that the excessive ROS are a primary cause of impaired MSCs activity in type 2 diabetes mellitus. In the process of bone regeneration, lots of MSCs migrate from the neighboring stem cell niches and peripheral circulation to injury area, which is a prerequisite for MSCs to play their roles. It has been reported that a high intracellular ROS level can cause the over-polymerization of F-actin cytoskeleton, impairing the migration capacity of MSCs.30 In our study, the BMSCs treated with diabetic serum migrated much slower than the BMSCs treated with normal serum, but curcumin significantly alleviated the inhibitory effect of diabetic serum on cell migration. In line with our study, Peng et al31 reported that genetically modified MSCs with antioxidant enzyme reversed the impaired migration capacity of MSCs in type 2 diabetic mice.
While excessive ROS inhibit osteogenic differentiation in MSCs and osteoblast precursors, a basal level of ROS is required for calcification and osteogenesis.32 Thus, the antioxidant agents should be released in a continuous and steady manner for bone regeneration. In our study, the DS+Cur group showed a marked increase in different osteogenesis-related markers, such as ALP activity, OCN, and OPN, compared with the NS and DS groups. It indicated that the Cur released from the scaffold can maintain the oxidative stress within the physiological range for a long time. The in vivo osteogenesis potential of the functionalized scaffold was assessed using a rat critical-sized calvarial defect model, in which the bone defect cannot heal without medical intervention. During the entire process of the experiment, no rats showed any post-operative complications, which confirmed the safety of the scaffolds. Radiological and histopathological evaluations were made to investigate the in vivo bone repair effect. At 8 weeks, micro-CT measurement showed that the diabetes+Cur group demonstrated significantly greater bone regeneration in the defect compared with the diabetes group. H&E stained sections indicated that all scaffolds did not induce excessive inflammation response. Since vascular recruitment is basic to bone regeneration, the tissues in the defect area were cut down to perform the immunoblotting of PECAM-1 and VEGF, which were highly expressed in vascular cells such as endothelial cells and blood-borne cells. The protein expression of PECAM-1 and VEGF in the diabetes+Cur group was also significantly higher than that in the diabetes group, suggesting more active vascular recruitment in the diabetes+Cur group. In previous studies, researchers reported that curcumin can attenuate cardiovascular dysfunction and endothelial senescence caused by oxidative stress.33,34 This may be part of the reason for the more vascular recruitment in the curcumin-treated group. Taken all together, our in vivo experiments confirmed the beneficial effect of Cur on promoting bone regeneration and new vascular formation in type 2 diabetic condition, and the superior osteogenic capacity of the Cur/CHA scaffold.
Limitations
The present work may be limited by the difficulty of detecting the release process of Cur from the scaffold in the defect area. The exact drug concentrations at different time points are unknown, and the effects of different drug concentrations on bone regeneration are unclear. In addition, most patients with type 2 diabetes mellitus are older people, and age is also an important factor affecting bone regeneration. We only investigated the therapeutic effect of Cur-loaded scaffold in young rats. Thus, experiments on old rats with type 2 diabetes mellitus are needed.
Conclusion
Our study demonstrated that the Cur-loaded PLGA microspheres can inhibit diabetes mellitus-induced ROS production by mitigating the mitochondrial dysfunction and modulating the Keap1/Nrf2/HO-1 signaling pathway. As a result, the negative effects of diabetes mellitus on the proliferation, migration, and osteogenic differentiation of BMSCs were also significantly alleviated. The beneficial effect of Cur-loaded PLGA microspheres was further confirmed by the increased bone formation in type diabetic rats. The results of this study suggested that incorporation of Cur-loaded PLGA microspheres into bone implants is a promising method to promote bone repair under diabetic conditions.
Disclosure
The authors report no conflicts of interest in this work.
References
Zhang N, Du SM, Ma GS. Current lifestyle factors that increase risk of T2DM in China. Eur J Clin Nutr. 2017;71(7):832–838. | ||
Shanbhogue VV, Hansen S, Frost M, Brixen K, Hermann AP. Bone disease in diabetes: another manifestation of microvascular disease? Lancet Diabetes. 2017;5(10):827–838. | ||
Lin DPL, Dass CR. Weak bones in diabetes mellitus – an update on pharmaceutical treatment options. J Pharm Pharmacol. 2018;70(1):1–17. | ||
Aeimlapa R, Charoenphandhu N, Suntornsaratoon P, et al. Insulin does not rescue cortical and trabecular bone loss in type 2 diabetic Goto-Kakizaki rats. J Physiol Sci. Epub July 8, 2017. | ||
Sato Y, Ishihara N, Nagayama D, Saiki A, Tatsuno I. 7-ketocholesterol induces apoptosis of MC3T3-E1 cells associated with reactive oxygen species generation, endoplasmic reticulum stress and caspase-3/7 dependent pathway. Mol Genet Metab Rep. 2017;10:56–60. | ||
Wang L, Hu X, Ma X, et al. Promotion of osteointegration under diabetic conditions by tantalum coating-based surface modification on 3-dimensional printed porous titanium implants. Colloids Surf B Biointerfaces. 2016;148:440–452. | ||
Fakhruddin S, Alanazi W, Jackson KE. Diabetes-induced reactive oxygen species: mechanism of their generation and role in renal injury. J Diabetes Res. 2017;2017:8379327. | ||
Ashe S, Nayak D, Kumari M, Nayak B. Ameliorating effects of green synthesized silver nanoparticles on glycated end product induced reactive oxygen species production and cellular toxicity in osteogenic Saos-2 cells. ACS Appl Mater Interfaces. 2016;8(44):30005–30016. | ||
Elizabeth MM, Alarcon-Aquilar JF, Clara OC, Escobar-Villanueva, Del Carmen M. Pancreatic β-cells and type 2 diabetes development. Curr Diabetes Rev. 2017;13(2):108–121. | ||
Fonteneau G, Bony C, Goulabchand R, et al. Serum-mediated oxidative stress from systemic sclerosis patients affects mesenchymal stem cell function. Front Immunol. 2017;8:988. | ||
Hu XF, Wang L, Lu YZ, et al. Adiponectin improves the osteointegration of titanium implant under diabetic conditions by reversing mitochondrial dysfunction via the AMPK pathway in vivo and in vitro. Acta Biomater. 2017;61:233–248. | ||
Theodoro LH, Ferro-Alves ML, Longo M, et al. Curcumin photodynamic effect in the treatment of the induced periodontitis in rats. Lasers Med Sci. 2017;32(8):1783–1791. | ||
Fadus MC, Lau C, Bikhchandani J, Lynch HT. Curcumin: An age-old anti-inflammatory and anti-neoplastic agent. J Tradit Complement Med. 2016;7(3):339–346. | ||
Wang N, Wang F, Gao Y, et al. Curcumin protects human adipose-derived mesenchymal stem cells against oxidative stress-induced inhibition of osteogenesis. J Pharmacol Sci. 2016;132(3):192–200. | ||
Ahmad W, Ijaz B, Shabbiri K, Ahmed F, Rehman S. Oxidative toxicity in diabetes and Alzheimer’s disease: mechanisms behind ROS/RNS generation. J Biomed Sci. 2017;24(1):76. | ||
Busari ZA, Dauda KA, Morenikeji OA, et al. Antiplasmodial activity and toxicological assessment of curcumin PLGA-encapsulated nanoparticles. Front Pharmacol. 2017;8:622. | ||
Kanimozhi K, Khaleel Basha S, Sugantha Kumari V. Processing and characterization of chitosan/PVA and methylcellulose porous scaffolds for tissue engineering. Mater Sci Eng C Mater Biol Appl. 2016;61:484–491. | ||
Quinlan E, Lopez-Noriega A, Thompson E, Kelly HM, Cryan SA, O’Brien FJ. Development of collagen-hydroxyapatite scaffolds incorporating PLGA and alginate microparticles for the controlled delivery of rhBMP-2 for bone tissue engineering. J Control Release. 2015;198:71–79. | ||
Decambron A, Fournet A, Bensidhoum M, et al. Low-dose BMP-2 and MSC dual delivery onto coral scaffold for critical-size bone defect regeneration in sheep. J Orthop Res. 2017;35(12):2637–2645. | ||
Kim SY, Kim YK, Park YH, et al. Evaluation of the healing potential of demineralized dentin matrix fixed with recombinant human bone morphogenetic protein-2 in bone grafts. Materials. 2017;10(9):E1049. | ||
Masaoka T, Yamada T, Yuasa M, et al. Biomechanical evaluation of the rabbit tibia after implantation of porous hydroxyapatite/collagen in a rabbit model. J Orthop Sci. 2016;21(2):230–236. | ||
Rong ZJ, Yang LJ, Cai BT, et al. Porous nano-hydroxyapatite/collagen scaffold containing drug-loaded ADM-PLGA microspheres for bone cancer treatment. J Mater Sci Mater Med. 2016;27(5):89. | ||
Santosh Kumar BB, Aruna DR, Gowda SV, Galagali RS. Evaluation of a bioresorbable collagen membrane of fish origin in the treatment of periodontal intrabony defects: a prospective clinical study. Dent Res J. 2013;10(2):225–231. | ||
Terada M, Izumi K, Ohnuki H, et al. Construction and characterization of a tissue-engineered oral mucosa equivalent based on a chitosan-fish scale collagen composite. J Biomed Mater Res B Appl Biomater. 2012;100(7):1792–1802. | ||
Matsumoto R, Uemura T, Xu Z, Yamaguchi I, Ikoma T, Tanaka J. Rapid oriented fibril formation of fish scale collagen facilitates early osteoblastic differentiation of human mesenchymal stem cells. J Biomed Mater Res A. 2015;103(8):2531–2539. | ||
Hickey T, Kreutzer D, Burgess DJ, Moussy F. Dexamethasone/PLGA microspheres for continuous delivery of an anti-inflammatory drug for implantable medical devices. Biomaterials. 2002;23(7):1649–1656. | ||
Dawes GJ, Fratila-Apachitei LE, Necula BS, et al. Effects of dexamethasone-loaded PLGA microspheres on human fetal osteoblasts. J Biomater Appl. 2012;27(4):477–483. | ||
Murphy CM, Duffy GP, Schindeler A, O’Brien FJ. Effect of collagen-glycosaminoglycan scaffold pore size on matrix mineralization and cellular behavior in different cell types. J Biomed Mater Res A. 2016;104(1):291–304. | ||
Deshmukh P, Unni S, Krishnappa G, Padmanabhan B. The Keap1–Nrf2 pathway: promising therapeutic target to counteract ROS-mediated damage in cancers and neurodegenerative diseases. Biophys Rev. 2017;9(1):41–56. | ||
Shi D, Li X, Chen H, et al. High level of reactive oxygen species impaired mesenchymal stem cell migration via overpolymerization of F-actin cytoskeleton in systemic lupus erythematosus. Pathol Biol. 2014;62(6):382–390. | ||
Peng Z, Yang X, Qin J, et al. Glyoxalase-1 overexpression reverses defective proangiogenic function of diabetic adipose-derived stem cells in atreptozotocin-induced diabetic mice model of critical limb ischemia. Stem Cells Transl Med. 2017;6(1):261–271. | ||
Denu RA, Hematti P. Effects of oxidative stress on mesenchymal stem cell biology. Oxid Med Cell Longev. 2016;2016:2989076. | ||
Sun Y, Hu X, Hu G, Xu C, Jiang H. Curcumin attenuates hydrogen peroxide-induced premature senescence via the activation of SIRT1 in human umbilical vein endothelial cells. Biol Pharm Bull. 2015;38(8):1134–1141. | ||
Kukongviriyapan U, Apaijit K, Kukongviriyapan V. Oxidative stress and cardiovascular dysfunction associated with cadmium exposure: beneficial effects of curcumin and tetrahydrocurcumin. Tohoku J Exp Med. 2016;239(1):25–38. |
 © 2018 The Author(s). This work is published and licensed by Dove Medical Press Limited. The full terms of this license are available at https://www.dovepress.com/terms.php and incorporate the Creative Commons Attribution - Non Commercial (unported, v3.0) License.
By accessing the work you hereby accept the Terms. Non-commercial uses of the work are permitted without any further permission from Dove Medical Press Limited, provided the work is properly attributed. For permission for commercial use of this work, please see paragraphs 4.2 and 5 of our Terms.
© 2018 The Author(s). This work is published and licensed by Dove Medical Press Limited. The full terms of this license are available at https://www.dovepress.com/terms.php and incorporate the Creative Commons Attribution - Non Commercial (unported, v3.0) License.
By accessing the work you hereby accept the Terms. Non-commercial uses of the work are permitted without any further permission from Dove Medical Press Limited, provided the work is properly attributed. For permission for commercial use of this work, please see paragraphs 4.2 and 5 of our Terms.