")
Back to Journals » Drug Design, Development and Therapy » Volume 10
Statistical modeling methods to analyze the impacts of multiunit process variability on critical quality attributes of Chinese herbal medicine tablets
Authors Sun F, Xu B, Zhang Y, Dai SY, Yang C, Cui XL, Shi XY, Qiao YJ
Received 5 August 2016
Accepted for publication 22 October 2016
Published 28 November 2016 Volume 2016:10 Pages 3909—3924
DOI https://doi.org/10.2147/DDDT.S119122
Checked for plagiarism Yes
Review by Single anonymous peer review
Peer reviewer comments 4
Editor who approved publication: Professor Anastasios Lymperopoulos
Fei Sun,1 Bing Xu,1,2 Yi Zhang,1 Shengyun Dai,1 Chan Yang,1 Xianglong Cui,1 Xinyuan Shi,1,2 Yanjiang Qiao1,2
1Research Center of Traditional Chinese Medicine Information Engineering, School of Chinese Materia Medica, Beijing University of Chinese Medicine, 2Key Laboratory of Manufacture Process Control and Quality Evaluation of Chinese Medicine, Beijing, People’s Republic of China
Abstract: The quality of Chinese herbal medicine tablets suffers from batch-to-batch variability due to a lack of manufacturing process understanding. In this paper, the Panax notoginseng saponins (PNS) immediate release tablet was taken as the research subject. By defining the dissolution of five active pharmaceutical ingredients and the tablet tensile strength as critical quality attributes (CQAs), influences of both the manipulated process parameters introduced by an orthogonal experiment design and the intermediate granules’ properties on the CQAs were fully investigated by different chemometric methods, such as the partial least squares, the orthogonal projection to latent structures, and the multiblock partial least squares (MBPLS). By analyzing the loadings plots and variable importance in the projection indexes, the granule particle sizes and the minimal punch tip separation distance in tableting were identified as critical process parameters. Additionally, the MBPLS model suggested that the lubrication time in the final blending was also important in predicting tablet quality attributes. From the calculated block importance in the projection indexes, the tableting unit was confirmed to be the critical process unit of the manufacturing line. The results demonstrated that the combinatorial use of different multivariate modeling methods could help in understanding the complex process relationships as a whole. The output of this study can then be used to define a control strategy to improve the quality of the PNS immediate release tablet.
Keywords: Panax notoginseng saponins, PNS immediate release tablet, pharmaceutical process understanding, partial least squares, orthogonal projections to latent structures, multiblock partial least squares, quality by design
Introduction
Chinese medicine preparations (CMPs) have been widely used in clinics for thousands of years and have made great contributions to human health. Conventionally, CMPs were usually used in the form of decoction, which was troublesome for preparation and carrying.1 In the last two decades, more modernized dosage forms of CMPs, such as granule,2 tablet,3 capsule,4 etc., have been developed and manufactured. A tablet is the most preferred oral solid dosage form of patients, because it has advantages in taking and carrying.5 In the Chinese Pharmacopeia (ChP), there are about 309 kinds of tablets.6 Panax notoginseng saponins (PNS) immediate release tablet, which is included in the enlarged edition of the ChP 2015, is widely used to treat coronary heart disease, angina, and cerebral thrombosis.7
The main components in the PNS immediate release tablet formulation are PNS extracts, in which there are five active pharmaceutical ingredients (APIs), that is, Notoginsenoside R1, Ginsenoside Rg1, Ginsenoside Re, Ginsenoside Rb1, and Ginsenoside Rd. For oral administration, the total amount of the five APIs in PNS extracts should not be <75% according to the ChP.6 The pharmaceutical process of PNS immediate release tablet is complex and involves several unit operations, which are mixing, wet granulation, milling, drying, blending, and tableting. Currently, the adjustment and control of the manufacturing process of PNS immediate release tablet is performed mainly based on experience. And the mechanical properties and release behavior of the product are at high risk of suffering from batch-to-batch variability. Therefore, there is an urgent need to investigate the relationship between the manipulated variables and the critical quality attributes (CQAs) of the PNS immediate release tablet to improve the process performance and consistently produce products with predefined quality.
Recently, quality by design (QbD) principles for pharmaceutical development are strongly encouraged by the International Conference on Harmonization and the US Food and Drug Administration.8 QbD is a systematic approach to the development that begins with predefined objectives and emphasizes product and process understandings and process control, based on sound science and quality risk management. The objective of QbD is the achievement of a scientific understanding of how input materials and process parameters affect the product quality. Generally, a pharmaceutical process is considered to be well understood when 1) all critical sources of variability are identified and explained, 2) the variability is managed by the process, and 3) the product quality can be accurately and reliably predicted.9,10 A variety of tools can be used to fulfill the aim of QbD and to improve the process understanding.11–13 For example, by using the design of experiment,14–16 specific process parameters or intermediate quality attributes are used to collect process information.
For a pharmaceutical process system including multiple unit operations, it is difficult to establish a deterministic model to describe the process comprehensively. Therefore, the process understanding is usually realized by the application of multivariate analysis (MVA) techniques to the legacy or experimental data.17–19 In MVA methods, the low-dimensional latent variables space are usually designed to summarize the process variability captured by the high-dimensional independent variables or quality attributes space of the pharmaceutical process system.9 For example, Soh et al20 applied principle component analysis (PCA) and partial least squares (PLS) to understand the impacts of different grades of lactose and microcrystalline cellulose and process parameters on the granule and ribbon properties obtained in a roller compaction process. In the work of Maltesen et al,21 PCA was used to identify the critical process parameters (CPPs) and to find correlations between the dependent and independent variables in the spray-drying of insulin. Polizzi and García-Muñoz22 proposed a novel modeling method, namely weighted PLS, to predict the properties of a powder blend. Westerhuis and Conengracht23 pioneered the application of multiblock partial least squares (MBPLS)24 to improve the interpretability and understanding of a two-step process, including wet granulation and tableting. Tomba et al25 proposed a procedure for the application of MBPLS to support the development of a continuous pharmaceutical process from earlier stage using an industrial case. Extensive multivariate modeling applications for process understanding and control are described in a number of studies.26–34
In this study, multiple statistical modeling methods, such as PLS, orthogonal projection to latent structures (OPLS), and MBPLS, are used to improve the interpretability of the manufacturing line of PNS immediate release tablet. The CPPs, the CQAs of intermediate, and the critical process units (CPUs) are determined. The effects of process parameters and granule properties on CQAs of product are also explored. To the best of our knowledge, this is the first study that applies different latent variables modeling methods to gain process knowledge for the multiunit pharmaceutical process of Chinese herbal medicine tablets. The advantages and the limitations of different chemometric methods are also summarized in the present work.
Materials and methods
Materials
PNS extracts (lot number ZL20150524) were purchased from Nanjing Zelang Pharmaceutical Co., Ltd (Nanjing, People’s Republic of China). The total content of Notoginsenoside R1, Ginsenoside Rg1, Ginsenoside Re, Ginsenoside Rb1, and Ginsenoside Rd in PNS extracts were 78.03%. The microcrystalline cellulose (Vivapur® 101, lot number 2610141813) was purchased from J. Rettenmaier & Söhne GmbH + Co KG (Rosenberg, Germany). The crospovidone (XL-10, lot number 20160119) was purchased from Anhui Shanhe Medicinal Material Co., Ltd (Huainan, People’s Republic of China). The magnesium stearate (lot number 20121010) was purchased from Sinopharm Chemical Reagent Co, Ltd (Shanghai, People’s Republic of China). Notoginsenoside R1 (lot number 110703–201530, purity ≥98%), Ginsenoside Rg1 (lot number 110704–201424, purity ≥98%), Ginsenoside Re (lot number 110754–201525, purity ≥98%), Ginsenoside Rb1 (lot number 111818–201302, purity ≥98%), and Ginsenoside Rd (lot number 110745–201318, purity ≥94.2%) reference standards were purchased from the National Institute for the Control of Pharmaceutical and Biological Products. Other reagents were of analytical grade.
Design of experiment
Ten process parameters including mixing time, impeller rate, binder amount, granulation liquid addition rate (addition rate), chopper rate, granulation time, sieve, drying time, lubrication time, and minimal punch tip separation distance (MPTSD) from five operation units were chosen to perform the experimental design and three levels were designated for each process parameter. The L27 orthogonal experimental design is used and a total of 27 runs are conducted, as shown in Table 1. The tensile strength (TS) of tablet and the in vitro dissolution of Notoginsenoside R1, Ginsenoside Rg1, Ginsenoside Re, Ginsenoside Rb1, and Ginsenoside Rd at 30 minutes (min) were identified as CQAs of the PNS immediate release tablet since the TS reflects the mechanical properties of tablets and the dissolution is related to the efficacy of the medicine.
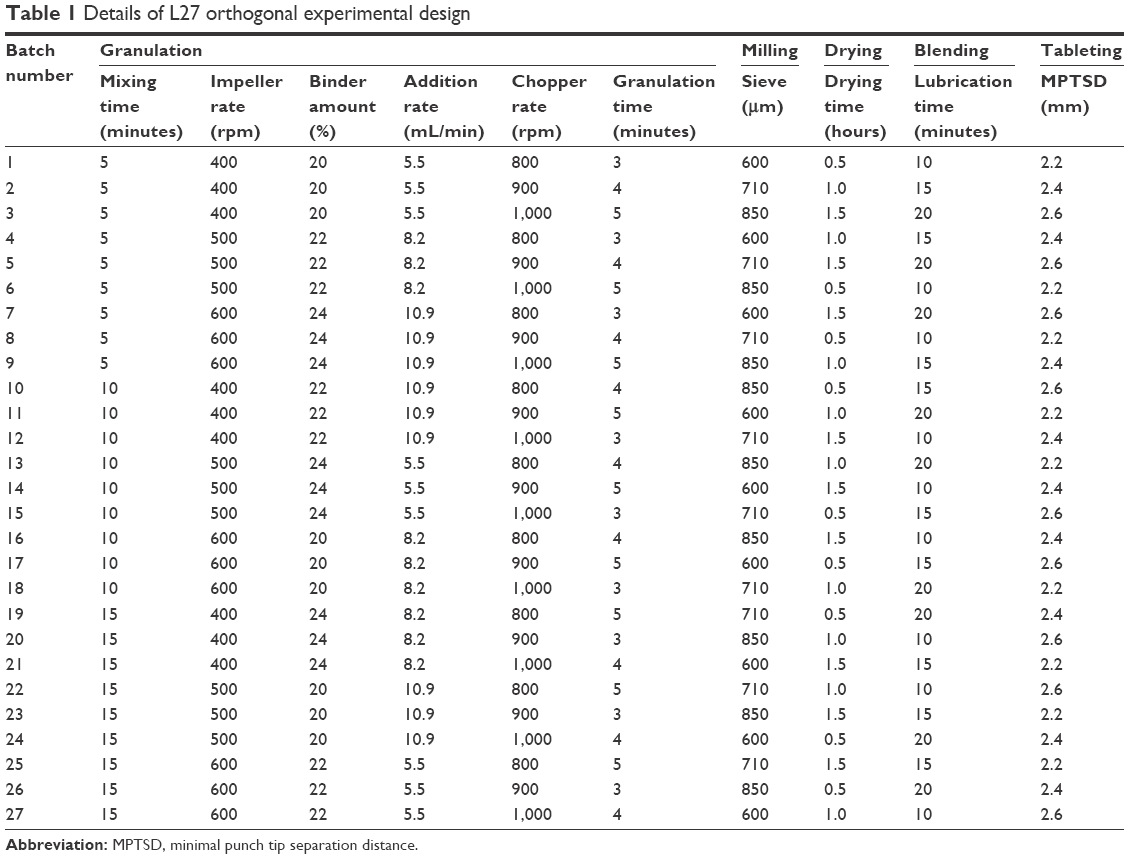 | Table 1 Details of L27 orthogonal experimental design |
Preparation of tablet
The formulation of PNS immediate release tablet consists of PNS extracts (33.5%, w/w), microcrystalline cellulose (60%, w/w), crospovidone (6%, w/w), and magnesium stearate (0.5%, w/w). First, PNS extract powders, the microcrystalline cellulose, and the crospovidone were weighed; 67, 120, and 12 g, respectively. These powders were premixed in a high shear wet granulator with the volume of 2 L (SHK-4A; Xi’an Run Tian Pharmaceutical Machinery Co., Ltd, Xi’an, People’s Republic of China), the volume fill of premixed powders was ~40%. Then, the mixed powders were granulated with 95% alcohol, which was added by a peristaltic pump. The wet granules were milled through a sieve manually and dried in a tray dryer (temperature at 80°C). After that, the dried granules were lubricated with 1 g magnesium stearate in a three-dimensional blender with 1 L volume (ZNW-10, Beijing Xing Shi Li He Technology Co., Ltd). Lastly, the final blend was compressed into tablets using a rotary tablet press (ZP10, Xing Shi Li He Technology Co., Ltd). The diameter of the convex unscored punches was 11 mm, and the target tablet weight was 0.44 g.
Analytical methods
Density of granule
The bulk density (Db) and the tapped density (Dt) of granules were measured in a 250 mL cylinder according to the method described in the USP 39-NF34,35 and each batch of the sample was tested in triplicate.
Granule size distribution
Statistical parameters of the granule size distribution including D10, D50, and D90 were measured by the laser diffraction instrument (BT 2001; Dandong Bettersize Instrument Ltd., Dandong, People’s Republic of China) three times. The width of granule size distribution (ie, span) was calculated by the following equation.
|

where D10, D50, and D90 were particle size for 10%, 50%, and 90% of granules, respectively.
Angle of repose of granule
The angle of repose (α) of granule was measured with the powder flow ability tester (Copley BEP2; Copley Scientific Limited, Nottingham, UK). The samples were poured through a vibrating metal funnel onto a platform until a stable and height-fixed heap was formed. The angle of repose was measured as the angle made by the inclined plane of the heap with the horizontal. Each batch of sample was tested in triplicate.
Moisture content of granule
The moisture content of granule was tested using the Sartorius MA35 instrument (Sartorius AG, Goettingen, Germany). The sample was placed on the pan and heated to 105°C. The percentage of moisture content was recorded until the weight was constant. Each sample batch was tested in triplicate.
TS of tablet
The hardness of tablet was evaluated with the HC 97 instrument (Kraemer Elektronik GmbH, Darmstadt, Germany). The tablet diameter and thickness were measured by the digimatic indicator (ID-C112X/1012X; Mitutoyo Corporation, Kawaskai, Japan). With these obtained data, the tablet TS was calculated according to the equation described by Fell and Newton.36
|

where F refers to the hardness of tablet (N), d refers to tablet diameter (mm), and t refers to tablet thickness (mm). Each batch of the sample was tested 10 times.
Dissolution of tablet
The dissolution test was conducted by the basket method at 100 rpm in 500 mL of water at 37°C±0.1°C.36 The dissolved APIs were assayed by the high performance liquid chromatography (HPLC) method,38 which was briefly described as follows. A Waters Alliance e2695 system (Waters Corporation, Milford, MA, USA) coupled with a Zorbax SB-C18 column (4.6×250 mm, 5 μm) was used. The mobile phase consisted of water (A) and acetonitrile (B). The separation of samples was achieved using the gradient elution program as follows: 20% B at 0–20 min, 20%–47% B at 20–50 min. The flow rate was 1.0 mL/min and the temperature of column was kept at 23°C. Each batch of sample was measured in triplicate.
Multivariate statistical analysis
The details of theories on PLS, OPLS, and MBPLS methods are available in the Supplementary materials. Matlab 7.0 software (MathWorks, Natick, MA, USA) was used to construct PLS, OPLS, and MBPLS models. PLS Toolbox 2.1 (Eigenvector Research Inc., Manson, WA, USA) was used to perform the PLS regression. The MBPLS toolbox was downloaded from http://www.models.life.ku.dk/~courses/MBtoolbox/mbtmain.htm. The OPLS code was downloaded from http://www.mathworks.com/matlabcentral/fileexchange/47767-libpls-1-95-zip/content/libPLS_1.95/opls.m. Prior to the analysis, all data were unit variance scaled.
Results and discussion
Measurements of granule properties and tablet quality attributes
For the purpose of process modeling, the independent variables were systematically chosen to cover the whole area of the manufacturing line and several batches were tested according to the experimental design. In this study, 10 process parameters and eight intermediate product (ie, granules) properties were denoted as the independent variables (). The TS and dissolution of Notoginsenoside R1, Ginsenoside Rg1, Ginsenoside Re, Ginsenoside Rb1, and Ginsenoside Rd at 30 min (ie, R1-DIS30, Rg1-DIS30, Re-DIS30, Rb1-DIS39, and Rd-DIS30) are designed to be response variables. The results of TS and dissolution test are listed in Table 3, and the measurement results of granule properties are shown in Table S1. The HPLC chromatograms of the PNS standard and the sample (eg, Batch 17) from the dissolution test are displayed in Figure 1. The results clearly showed that the release behavior of tablets from different batches was sensitive to process variations. However, for tablets from the same batch, the dissolution of R1, Rg1, Re, Rb1, and Rd at 30 min were negatively correlated with TS as expectations.
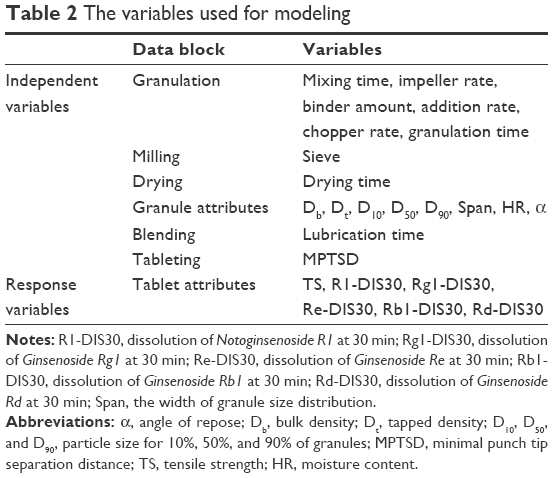 | Table 2 The variables used for modeling |
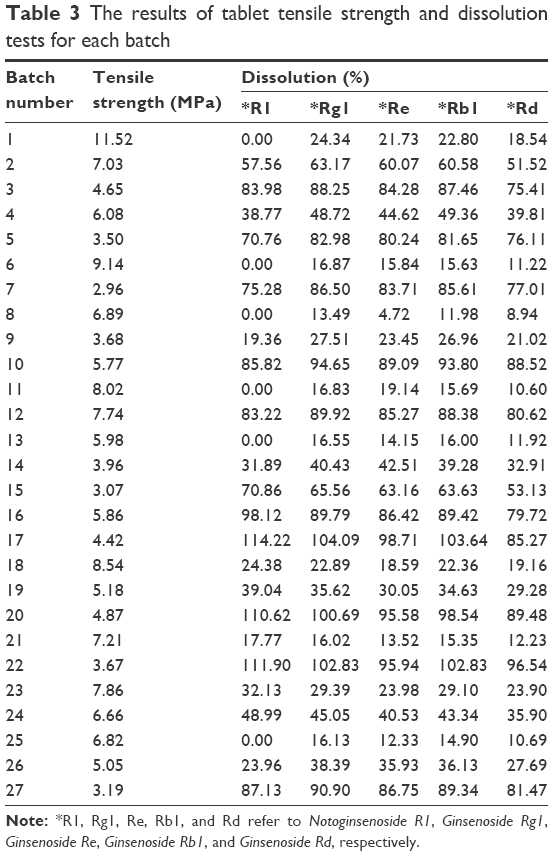 | Table 3 The results of tablet tensile strength and dissolution tests for each batch |
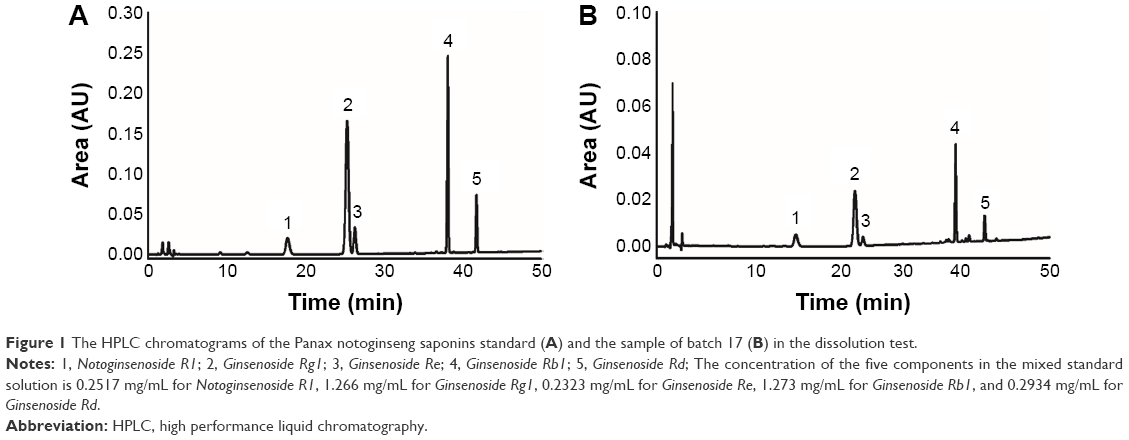 | Figure 1 The HPLC chromatograms of the Panax notoginseng saponins standard (A) and the sample of batch 17 (B) in the dissolution test. |
PLS Regression model
The relationship between independent variables and response variables was first investigated by the PLS regression method. The diagnostics of the PLS model are reported in Table 4. Four predicted components explaining 94.2% of the CQAs variations were optimized, and the predictive ability of the model was good (Q2Ycum =80.6%).
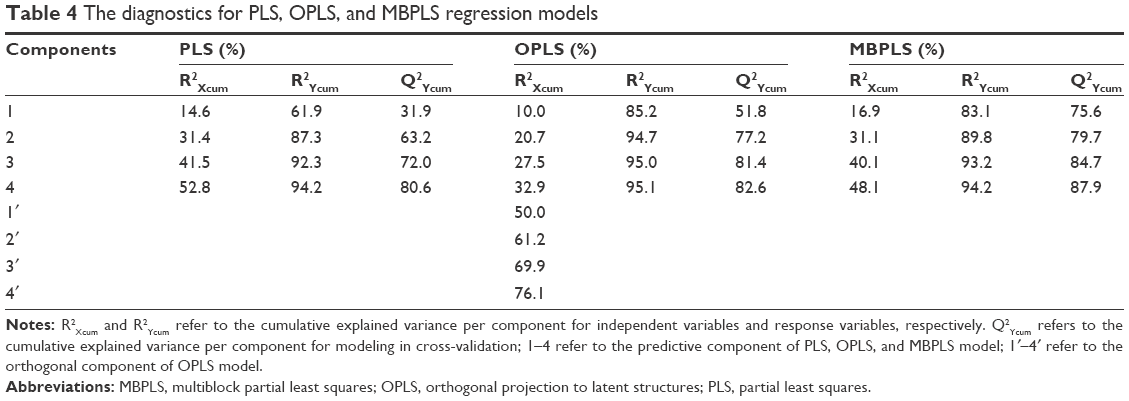 | Table 4 The diagnostics for PLS, OPLS, and MBPLS regression models |
Figure 2 shows the relationships between independent variables and response variables under the projected latent structures. The loading bar plots are displayed in Figure 3. The loadings of PLS model indicated which process parameters or granule properties affected product quality and estimated their relative contribution to quality.25,30 The first of the four predictive components in the PLS regression model explained 61.9% of CQAs variations. Its loadings indicated that granules with lower density and smaller granule size resulted in faster tablet dissolving.38 The MPTSD had a significant effect on the dissolution and it was positively correlated with dissolution. It indicated that a smaller MPTSD led to a harder tablet that dissolved at a slower rate. The second component explained 25.4% of variations. Its loadings indicated that the impeller rate and the MPTSD were negatively correlated with the TS and granules with lower density and smaller particle size could result in higher TS. As we know, the thickness has a significant effect on the TS of tablets.36 Setting a smaller MPTSD resulted in tablets with smaller thickness and higher TS. Decreasing granule size increased the specific surface area of granule and inter granule electrostatic adsorption, which led to high TS. The impeller rate had effects on growth behavior of granules in wet granulation process. Higher impeller rate resulted in larger size granules, which decreased the tablet TS. The third component explained 5.0% of variances, and its loadings indicated that the binder amount also had slight impacts on the TS. This result suggested that granulation with more binder resulted in larger size granules, which decreased the tablet TS.
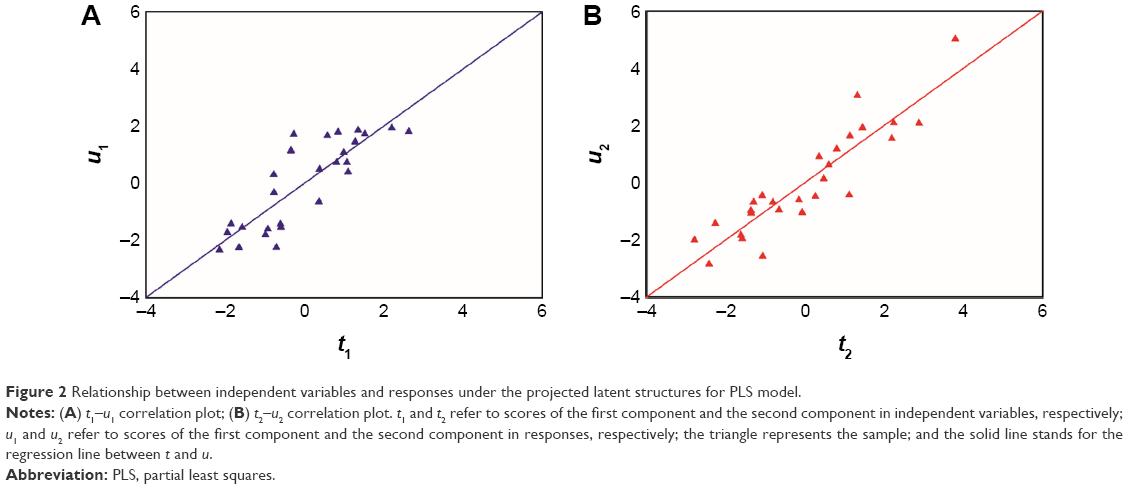 | Figure 2 Relationship between independent variables and responses under the projected latent structures for PLS model. |
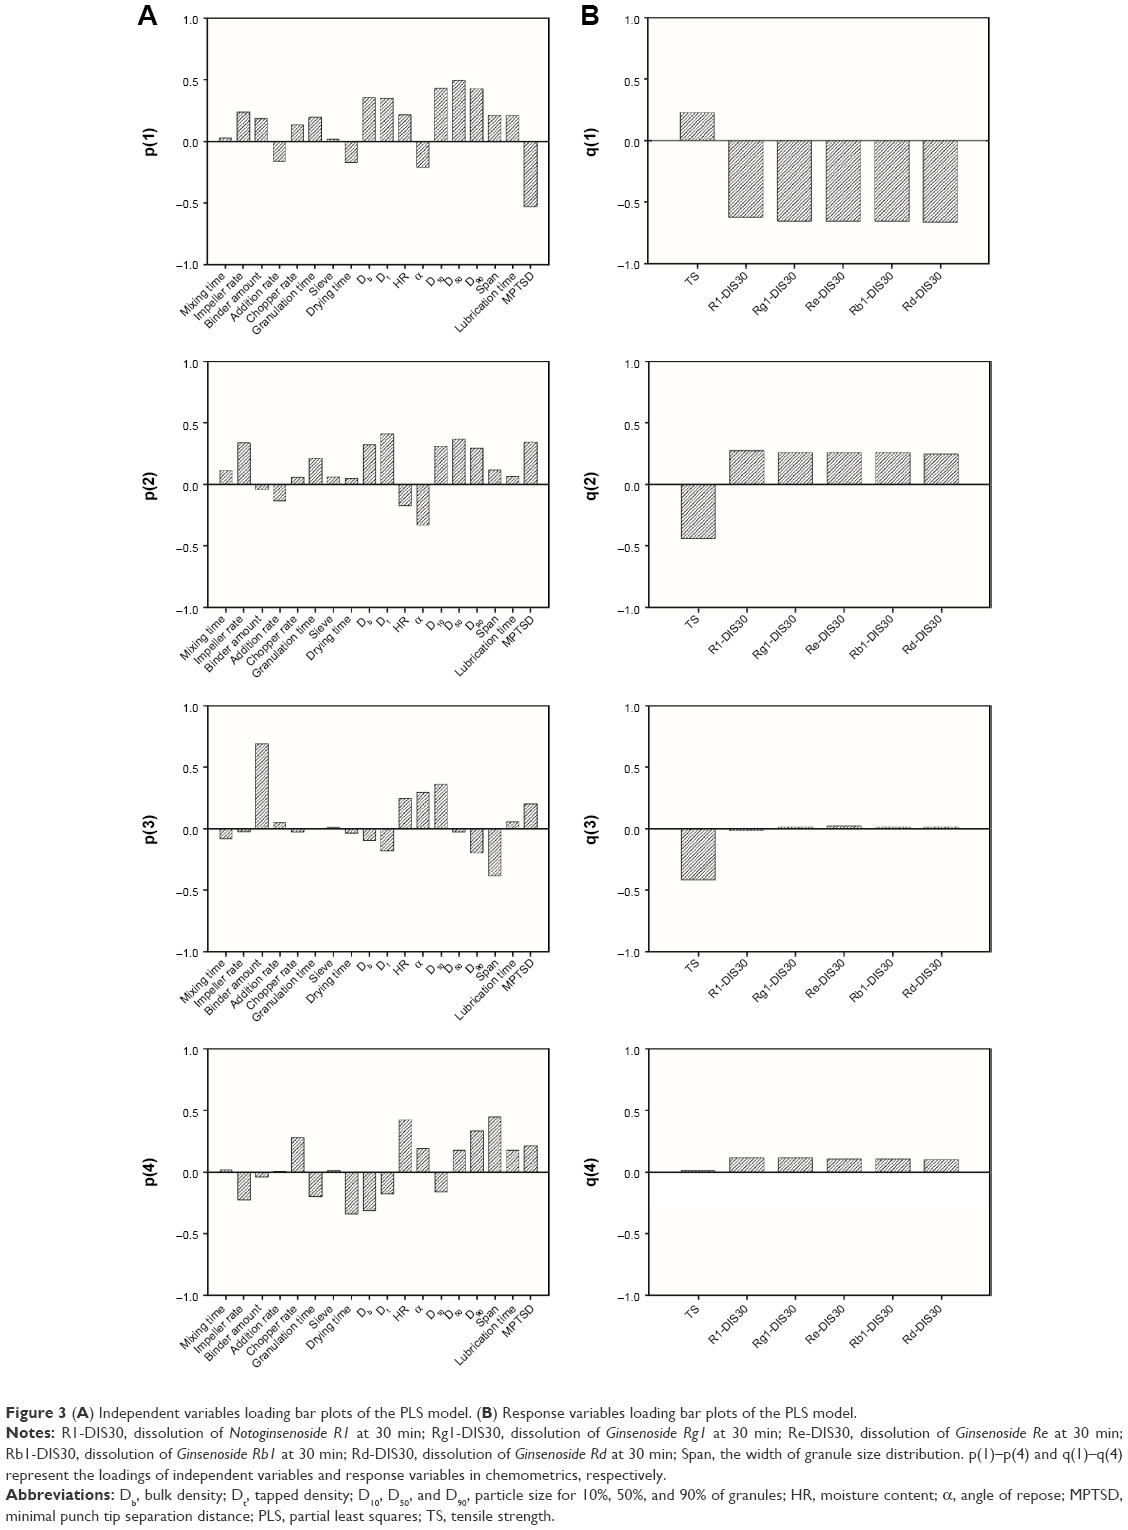 |
Figure 3(A) Independent variables loading bar plots of the PLS model. (B) Response variables loading bar plots of the PLS model. |
Although the PLS model was simple and useful to analyze the relationship between the input data and the response, there was a risk that the input data contained systematic variations, which was not correlated with the response.
OPLS Regression model
In order to gain more understanding about the pharmaceutical process, an OPLS model was used. The diagnostics of OPLS model are available in Table 4. Both the fitness (R2Ycum =95.1%) and the predictive ability (Q2Ycum =82.6%) of the model were good. The first two predicted components were adequate enough to model the CQAs, and the additional two predicted components only explained 0.4% of variations. The third and fourth components were selected in the OPLS model in order to increase the predictive ability. The model revealed that a small fraction of independent variables variation (R2Xcum =33.0%) were sufficient to describe the CQAs. Compared with the PLS model, as seen in Table 4, the amount of variance explained in response variables was relatively large in the first component of the OPLS model. The amount of explained variation in independent variables, R2Xcum, was relatively small. In addition, four orthogonal components explained 43.1% variances in the independent variables. This implied that orthogonal variation with regard to the response variables exists in the dependent variables.
The relationships between independent variables and responses under the projected latent structure for the OPLS model are shown in Figure S1. Figure S2 shows the loadings of the OPLS model. The first predictive component explained 85.2% of the CQAs variations. Its loadings indicated that smaller granule size and higher MPTSD in tableting resulted in tablets dissolving faster. This observation was consistent with the results obtained in the PLS model. However, in contrast with the first component of the PLS model, Db, Dt, and D90 contributed less to the variability of CQAs in the first predictive component of the OPLS model, which implied that the variability of these variables might not correlate with the CQAs. This result confirmed that the OPLS model could reduce the model complexity in comparison with the PLS model. The second predictive component explained 9.51% of the CQAs variations and the loading profile indicated that granules with lower D10 resulted in higher TS. The reason could be that granules with lower D10 values contained more fines. Increasing the binder amount and the MPTSD could also decrease the TS.
MBPLS Regression model
In PLS and OPLS models, all input variables were organized in one data block, which ignored the fact that the pharmaceutical process consisted of multiple units. Therefore, an MBPLS model was introduced. The independent variables are divided into six data blocks as seen in Table 2. The MBPLS model was used to understand the intrablock and inter-block relations. Table 4 shows the diagnostics of the MBPLS model. Two components were sufficient to model the CQAs. The additional components were used to increase the performance of the model. Four components were used to build the model, explaining 94.2% of the CQAs variance. The predictive ability of the model was good (Q2Ycum =87.9%).
Figure S3 displays the relationships between independent variables and responses for the MBPLS model. The bar plots of loadings of independent variables are reported in Figure S4A, whereas the bar plots of loadings of responses are reported in Figure S4B. The first component explaining 83.1% of the CQAs variations mainly described the correlations between the MPTSD and the CQAs. The MPTSD appeared to be positively related with the dissolution and negatively related with TS, which was consistent with the PLS or OPLS modeling results. The second component explaining 6.7% of the CQAs variations mainly described the relationships between the lubrication time and the TS. The loadings indicated that the lubrication time was negatively related with the TS. Before tableting, the dry granules were mixed with the magnesium stearate. As lubrication time was increased, the magnesium stearate was distributed uniformly on the surface of granules. The inter-granule cohesion strength might have decreased when granule was compressed into the tablet. Therefore, increasing the lubrication time may result in lower tablet TS.
In order to identify the critical independent variables, the variable importance in the projection (VIP) index could be calculated for each variable. The function of VIP is defined below.40
|

In the above equation, n is the total number of variables considered,  is the variance of responses explained by the kth component of the model, and wi,k is the weight of ith variable on the kth component calculated from the model.
Figure 4 reports the VIP index of each variable in PLS, OPLS, and MBPLS models, respectively. Usually, a threshold equal to 1 was assigned to evaluate whether a variable was important in the prediction of CQAs.40 In Figure 4A, MPTSD, D10, and D50 are identified to be the most important variables in the PLS model, while other variables including the binder amount, the granule density, and D90 were near the threshold. Figure 4B shows VIP indexes of variables in the OPLS model, and MPTSD and D10 are identified to be significant in prediction of CQAs. D50 was no longer significant in OPLS models. It indicated that the variability of D50 of granules contributed less to the CQAs of the tablet. Both PLS and OPLS methods confirmed D10 and MPTSD were key variables. Figure 4C shows that MPTSD was identified as the most important variable in the MBPLS model, and the lubrication time that was nonsignificant in PLS or OPLS model also contributed largely to the variability in CQAs.
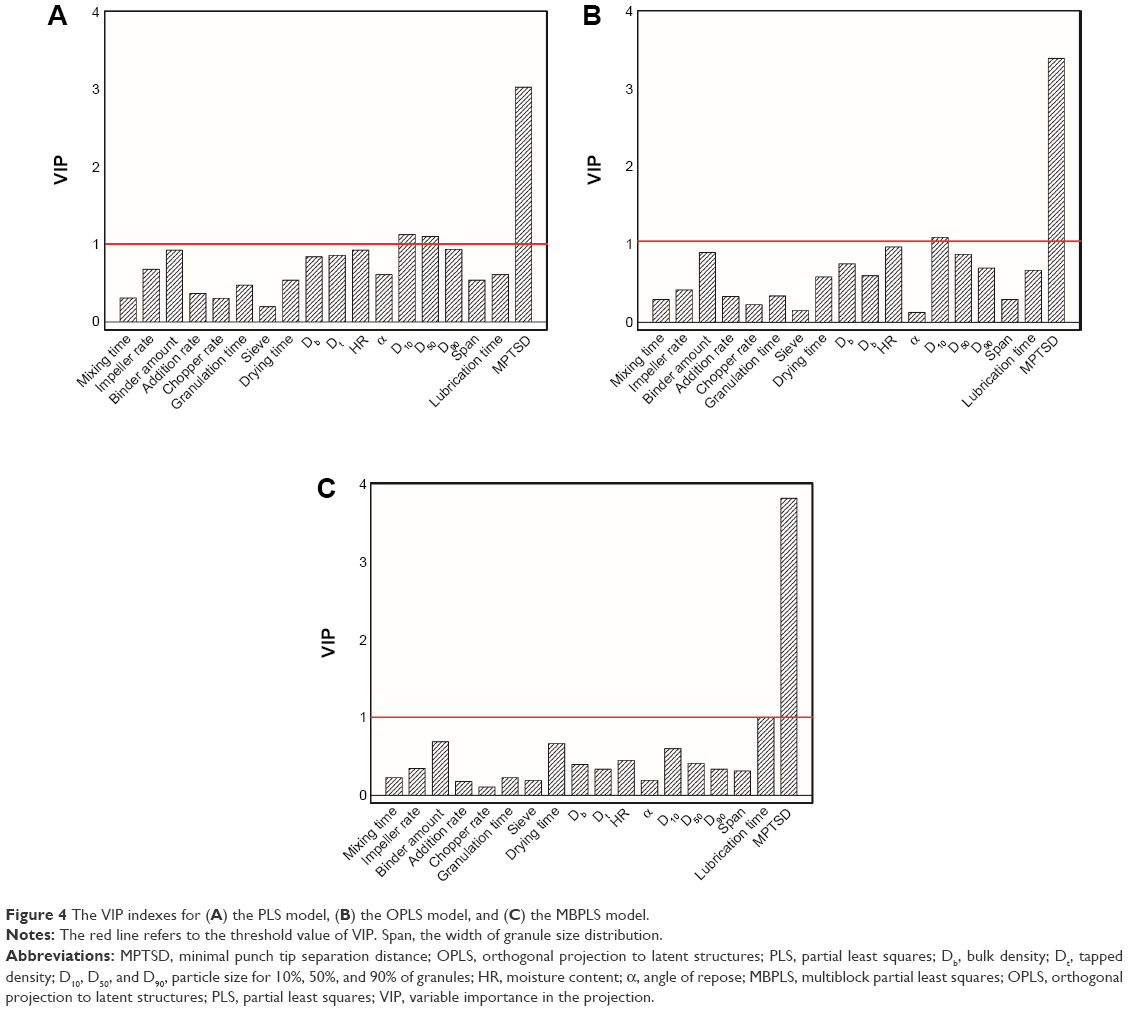 | Figure 4 The VIP indexes for (A) the PLS model, (B) the OPLS model, and (C) the MBPLS model. |
In the MBPLS model, the CPU in the manufacturing line could be identified by calculating the block importance in the projection (BIP) index.41
|

where m is the number of blocks in the model, , is the variance of responses explained by the kth component of the model and  is the weight of ith block on the kth component calculated from the MBPLS model.
A threshold equal to 1 was also used to assess whether a block was important to predict the CQAs. Figure 5 reports BIP indexes of six data blocks shown in Table 2. The results suggested that the tableting unit was the CPU determining the product CQAs.
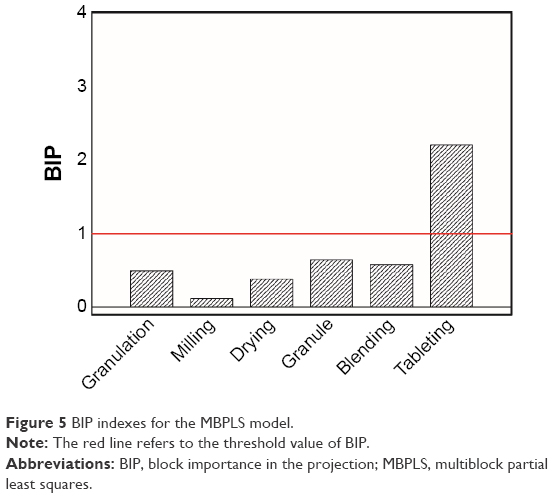 | Figure 5 BIP indexes for the MBPLS model. |
Real time release testing prediction model for CQAs
Based on the results obtained from the three latent variable models, real-time release testing (RTRT) for CQAs of the PNS immediate release tablet could be performed based on the prediction formula using parameters of not only “granule attribute” such as the D10 of granules (A) but also “process parameters” such as the lubrication time (B) and the MPTSD (C) as shown below:
|

where TS, R1-DIS30, Rg1-DIS30, Re-DIS30, Rb1-DIS30, and Rd-DIS30 refer to the TS and the dissolution of Notoginsenoside R1, Ginsenoside Rg1, Ginsenoside Re, Ginsenoside Rb1, and Ginsenoside Rd at 30 min, respectively. R2 refers to the coefficient of determination. R2adj represents the adjusted coefficient of determination.
Both R2 and R2adj were larger than 0.8, and it indicated the relationship between critical independent variables and the CQAs were well fitted using the ordinary least squares regression method. Process control strategies can also be performed by controlling the significant variables in the RTRT prediction models so that the desired quality of product will be achieved.
Conclusion
Traditionally, the quality control of Chinese herbal medicine preparations was mainly based on extensive end product testing and acceptance criteria due to inadequate understanding of the impacts of CMAs and CPPs on the drug product. And it was often time consuming to determine the source of variability when faulty product occurred. In this paper, with the help of PLS, OPLS, and MBPLS modeling methods, comprehensive process knowledge was gained from the process data. Identification of key process variables simplified the input–output relationships to control the product quality. Such enhanced QbD approaches could be applied not only in the pharmaceutical development stage to control the potential risk but also in the manufacturing stage to monitor and control CQAs with a high level of assurance.
Acknowledgments
The authors are thankful to the National Natural Science Foundation of China (number 81403112) and the Scientific Research Programme of Beijing University of Chinese Medicine (number 2016-JYB-XS-091) for their a generous financial support. They also acknowledge the help of the Special Project for Beijing Key Laboratory of Traditional Chinese Medicine Manufacturing Process Control and Quality Evaluation supported by Beijing Municipal Science & Technology Commission (number Z151100001615065).
Disclosure
The authors report no conflicts of interest in this work.
References
Yuan R, Lin Y. Traditional Chinese medicine: an approach to scientific proof and clinical validation. Pharmacol Ther. 2000;86(2):191–198. | ||
Yu K, Wang YW, Cheng YY. Determination of paeonol and paeoniflorin in Chinese medicine Cortex Moutan and ‘Shuangdan’granule by micellar electrokinetic capillary chromatography. J Pharm Biomed Anal. 2006;40(5):1257–1262. | ||
Li XD, Nie SF, Wu LJ. Studies on controlled release effervescent osmotic pump tablets from Traditional Chinese Medicine Compound Recipe. J Control Release. 2004;96(3):359–367. | ||
Zhao X, Zhang Y, Meng X, et al. Effect of a traditional Chinese medicine preparation Xindi soft capsule on rat model of acute blood stasis: a urinary metabonomics study based on liquid chromatography–mass spectrometry. J Chromatogr B Analyt Technol Biomed Life Sci. 2008;873(2):151–158. | ||
Lieberman HH, Lachman L, Schwartz JB, editors. Pharmaceutical dosage forms: tablets. New York: Marcel Dekker; 1989. | ||
Chinese Pharmacopoeia Commission. Chinese Pharmacopoeia. 9th ed. Beijing, China: Chemical Industry Press; 2015, Vol. I. | ||
Feng H, Chen W, Zhu C. Pharmacokinetics study of bio-adhesive tablet of Panax notoginseng saponins. Int Arch Med. 2011;4(1):18. | ||
ICH Expert Working Group. International Conference on Harmonisation of Technical Requirements for Registration of Pharmaceuticals for Human Use. ICH Harmonised Tripartite Guideline; Pharmaceutical Development; Q8 Guideline. Geneva, Switzerland; 2009: Available from: http://www.ich.org/fileadmin/Public_Web_Site/ICH_Products/Guidelines/Quality/Q8_R1/Step4/Q8_R2_Guideline.pdf/. Accessed November 17, 2016. | ||
Tomba E, Facco P, Bezzo F, Barolo M. Latent variable modeling to assist the implementation of quality-by-design paradigms in pharmaceutical development and manufacturing: a review. Int J Pharm. 2013;457(1):283–297. | ||
Lawrence XY. Pharmaceutical quality by design: product and process development, understanding, and control. Pharm Res. 2008;25(4):781–791. | ||
Hamad ML, Bowman K, Smith N, Sheng X, Morris KR. Multi-scale pharmaceutical process understanding: from particle to powder to dosage form. Chem Eng Sci. 2010;65(21):5625–5638. | ||
Katherine AB, editor. Process analytical technology: spectroscopic tools and implementation strategies for the chemical and pharmaceutical industries. Oxford: Blackwell Publishing Ltd.; 2005. | ||
De Beer T, Burggraeve A, Fonteyne M, Saerens L, Remon JP, Vervaet C. Near infrared and Raman spectroscopy for the in-process monitoring of pharmaceutical production processes. Int J Pharm. 2011;417(1):32–47. | ||
Wu H, White M, Khan MA. Quality-by-design (QbD): an integrated process analytical technology (PAT) approach for a dynamic pharmaceutical co-precipitation process characterization and process design space development. Int J Pharm. 2011;405(1):63–78. | ||
De Beer T, Wiggenhorn M, Hawe A, et al. Optimization of a pharmaceutical freeze-dried product and its process using an experimental design approach and innovative process analyzers. Talanta. 2011;83(5):1623–1633. | ||
Boukouvala F, Muzzio FJ, Ierapetritou MG. Design space of pharmaceutical processes using data-driven-based methods. J Pharma Innova. 2010;5(3):119–137. | ||
Gernaey KV, Gani R. A model-based systems approach to pharmaceutical product-process design and analysis. Chem Eng Sci. 2010;65(21):5757–5769. | ||
Manager GS. Statistical experimental design and its application to pharmaceutical development problems. Drug Dev Ind Pharm. 1986;12(8–9):1109–1123. | ||
Haware RV, Tho I, Bauer-Brandl A. Multivariate analysis of relationships between material properties, process parameters and tablet tensile strength for α-lactose monohydrates. Eur J Pharm Biopharm. 2009;73(3):424–431. | ||
Soh JLP, Wang F, Boersen N, et al. Utility of multivariate analysis in modeling the effects of raw material properties and operating parameters on granule and ribbon properties prepared in roller compaction. Drug Dev Ind Pharm. 2008;34(10):1022–1035. | ||
Maltesen MJ, Bjerregaard S, Hovgaard L, Havelund S, Van de Weert M. Quality by design–Spray drying of insulin intended for inhalation. Eur J Pharm Biopharm. 2008;70(3):828–838. | ||
Polizzi MA, García-Muñoz S. A framework for in-silico formulation design using multivariate latent variable regression methods. Int J Pharm. 2011;418(2):235–242. | ||
Westerhuis JA, Coenegracht PMJ. Multivariate modelling of the pharmaceutical two-step process of wet granulation and tableting with multiblock partial least squares. J Chemometr. 1997;11(5):379–392. | ||
MacGregor JF, Jaeckle C, Kiparissides C, Koutoudi M. Process monitoring and diagnosis by multiblock PLS methods. AIChE J. 1994;40(5):826–838. | ||
Tomba E, De Martin M, Facco P, et al. General procedure to aid the development of continuous pharmaceutical processes using multivariate statistical modeling – an industrial case study. Int J Pharm. 2013;444(1):25–39. | ||
Dumarey M, Wikström H, Fransson M, et al. Combining experimental design and orthogonal projections to latent structures to study the influence of microcrystalline cellulose properties on roll compaction. Int J Pharm. 2011;416(1):110–119. | ||
Trygg J, Wold S. Orthogonal projections to latent structures (O-PLS). J Chemometr. 2002;16(3):119–128. | ||
Trygg J. Prediction and spectral profile estimation in multivariate calibration. J Chemometr. 2004;18(3–4):166–172. | ||
Kourti T. Process analytical technology beyond real-time analyzers: the role of multivariate analysis. Crit Rev Anal Chem. 2006;36(3–4):257–278. | ||
Kourti T. QbD-quality by design in the pharmaceutical industry: the role of multivariate analysis. Am Pharm Rev. 2009;12(4):118. | ||
Kourti T. Pharmaceutical manufacturing: the role of multivariate analysis in design space, control strategy, process understanding, troubleshooting, and optimization. In: am Ende DJ, editors. Chemical Engineering in the Pharmaceutical Industry: R&D to Manufacturing. Hoboken, NJ: John Wiley & Sons, Inc; 2010. | ||
Verma S, Lan Y, Gokhale R, Burgess DJ. Quality by design approach to understand the process of nanosupsension preparation. Int J Pharm. 2009;377(1):185–198. | ||
Norioka T, Kikuchi S, Onuki Y, Takayama K, Imai K. Optimization of the manufacturing process for oral formulations using multivariate statistical methods. J Pharm Innov. 2011;6(3):157–169. | ||
Souihi N, Dumarey M, Wikstrom H, et al. A quality by design approach to investigate the effect of mannitol and dicalcium phosphate qualities on roll compaction. Int J Pharm. 2013;447(1):47–61. | ||
Pharmacopeia of USA. USP Chapter 616: Bulk Density and Tapped Density. Rockville, MD: USP; 2012:255–258. | ||
Fell JT, Newton JM. Determination of tablet strength by the diametral-compression test. J Pharm Sci. 1970;59(5):688–691. | ||
Pharmacopeia of USA. USP Chapter 711: Dissolution. Rockville, MD: USP; 2012:295–301. | ||
Dai S, Xu B, Zhang Y, et al. Robust design space development for HPLC analysis of five chemical components in Panax notoginseng saponins. J Liq Chromatogr R T. 2016;39(10):504–512. | ||
Dumarey M, Goodwin DJ, Davison C. Multivariate modelling to study the effect of the manufacturing process on the complete tablet dissolution profile. Int J Pharm. 2015;486(1):112–120. | ||
Chong IG, Jun CH. Performance of some variable selection methods when multi-collinearity is present. Chemometr Intell Lab. 2005;78(1):103–112. | ||
Liu Z, Bruwer MJ, MacGregor JF, Rathore SSS, Reed DE, Champagne MJ. Modeling and optimization of a tablet manufacturing line. J Pharm Innova. 2011;6(3):170–180. |
Supplementary materials
Theories
Partial least squares regression
Partial least squares regression applies to the two data blocks (eg, X and Y) regression problem, which uses X to construct a model of Y.1 This leads to two equations:
|

here, T is the score matrix of X; P is the loading matrix of X; and E is the residual matrix of X. U is the score matrix of Y; Q is the loading matrix of Y; and F is the residual matrix of Y.
Orthogonal projection to latent structures regression
In application of partial least squares (PLS) model, there is a risk that systematic variation may reside in X, which is not linearly correlated with Y. In order to avoid this, orthogonal projection to latent structures regression is proposed.2 Orthogonal projection to latent structures (OPLS) uses information in Y to decompose the X data into two parts. One part is linearly related to Y and the other is orthogonal to Y, as seen in the following equations:
|

here, Tp denotes the correlated score matrix of X and Pp denotes the correlated loading matrix of X. To denotes the corresponding score matrix of Y-uncorrelated components and Po denotes the corresponding Y-uncorrelated loading matrix. Further details of the OPLS algorithm are described by Tyggy.2,3
Multiblock partial least squares regression
Multiblock partial least squares regression is also an extension to the standard PLS.4 The main difference between multiblock partial least squares (MBPLS) and PLS is that two or more data blocks (X1, X2, …, Xk) are used to model Y in MBPLS.5 Two varieties of MBPLS algorithms had been reported in the literature.6 One uses the block scores to calculate the loadings and residuals,7 while the other uses the super scores.8 The algorithm used in this paper was based on the later version due to the inferior prediction of the former version.9 Two blocks (X1 and X2) are used here to illustrate the model:
|

|

here, Ts refers to the super score matrix of X; P1 refers to the loading matrix of X1; P2 refers to the loading matrix of X2; E1 refers to the residual matrix of X1; and E2 refers to the residual matrix of X2.
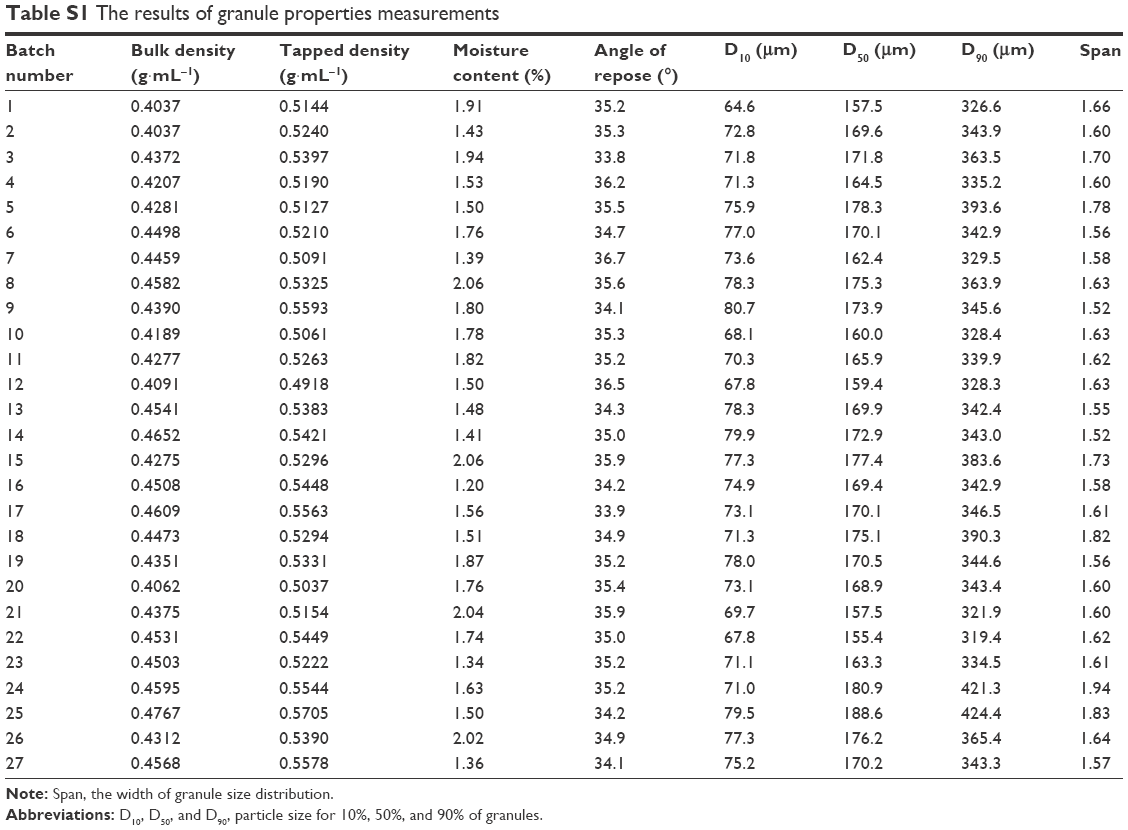 | Table S1 The results of granule properties measurements |
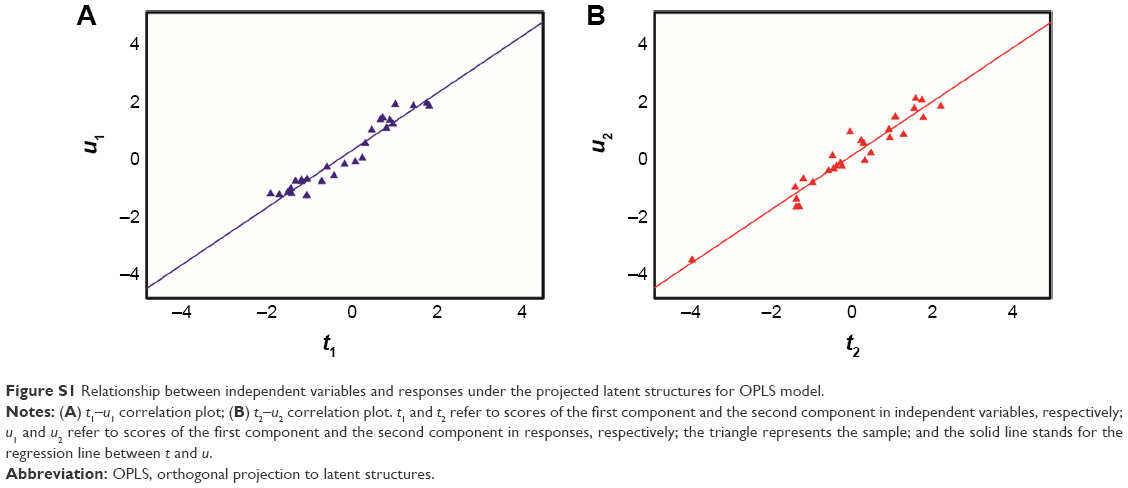 | Figure S1 Relationship between independent variables and responses under the projected latent structures for OPLS model. |
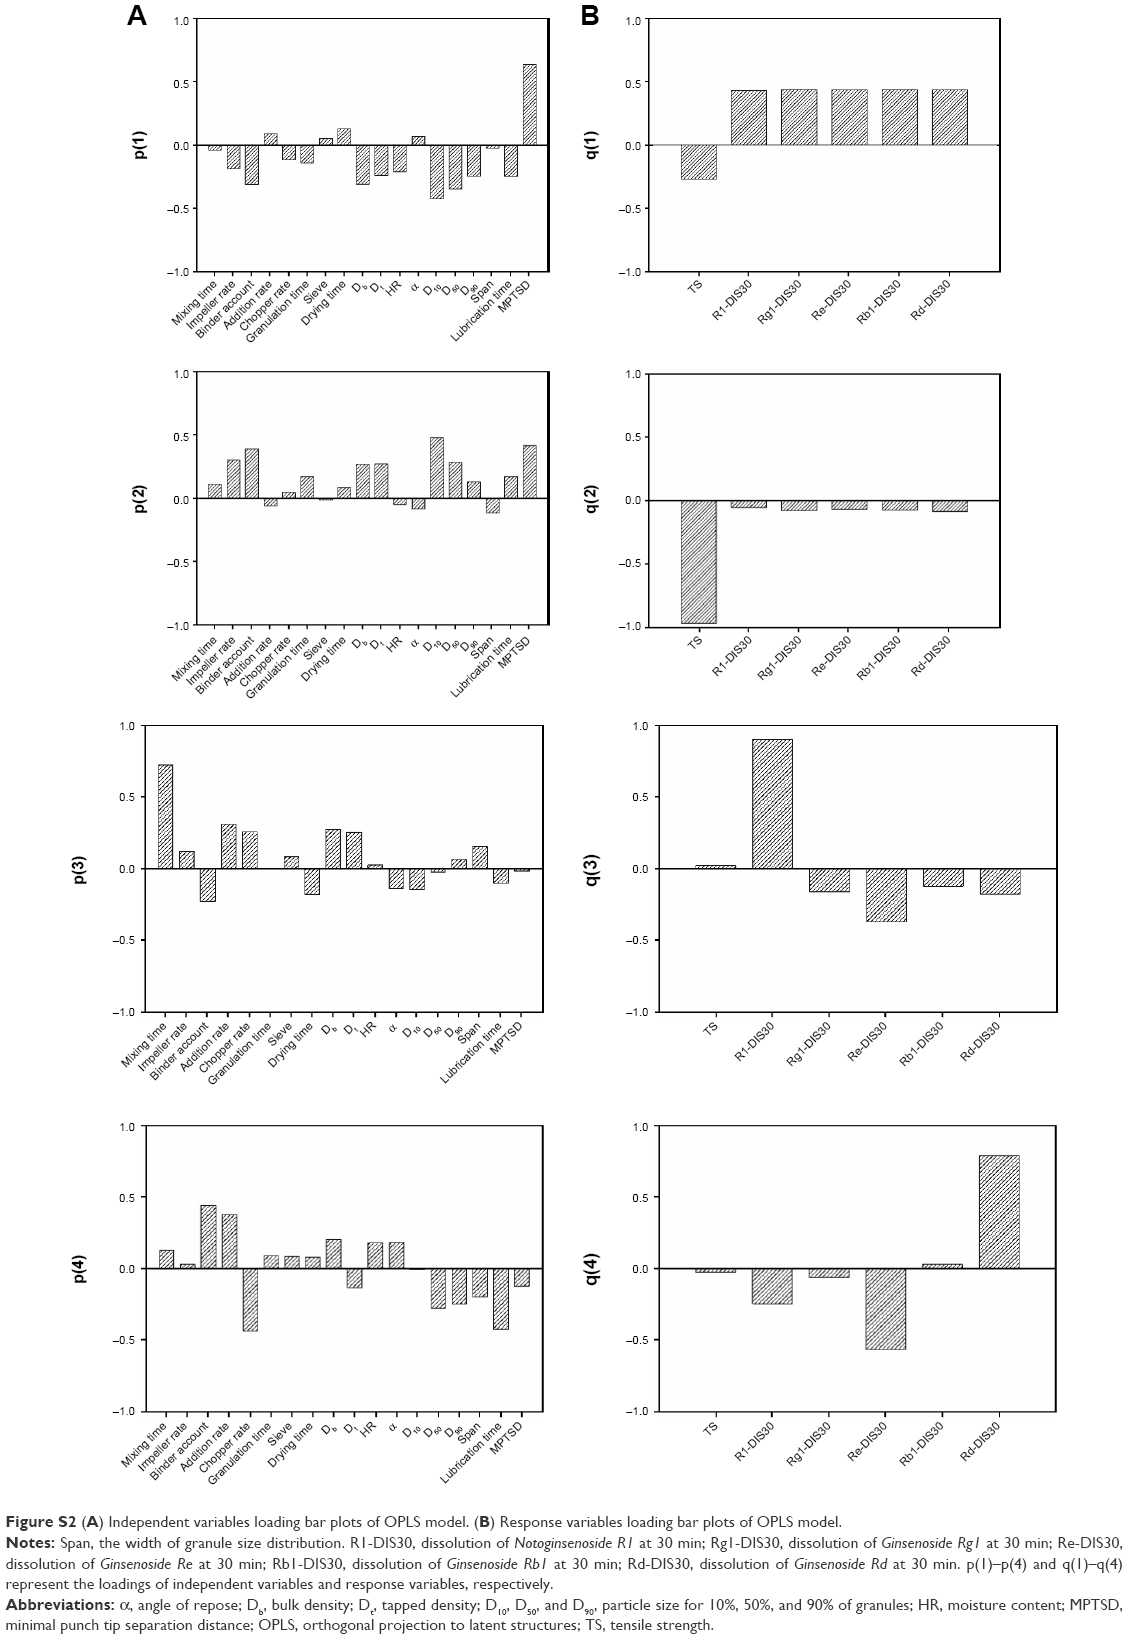 | Figure S2(A) Independent variables loading bar plots of OPLS model. (B) Response variables loading bar plots of OPLS model. |
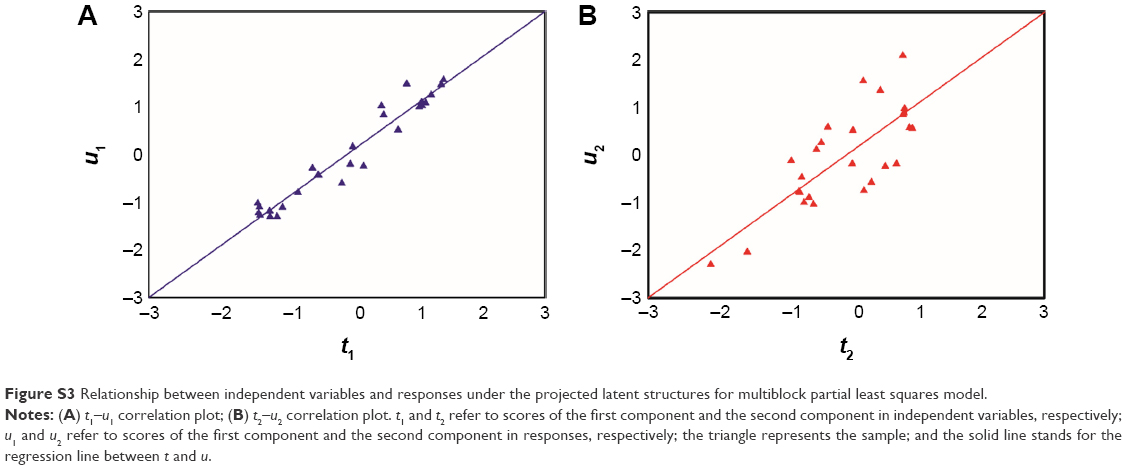 | Figure S3 Relationship between independent variables and responses under the projected latent structures for multiblock partial least squares model. |
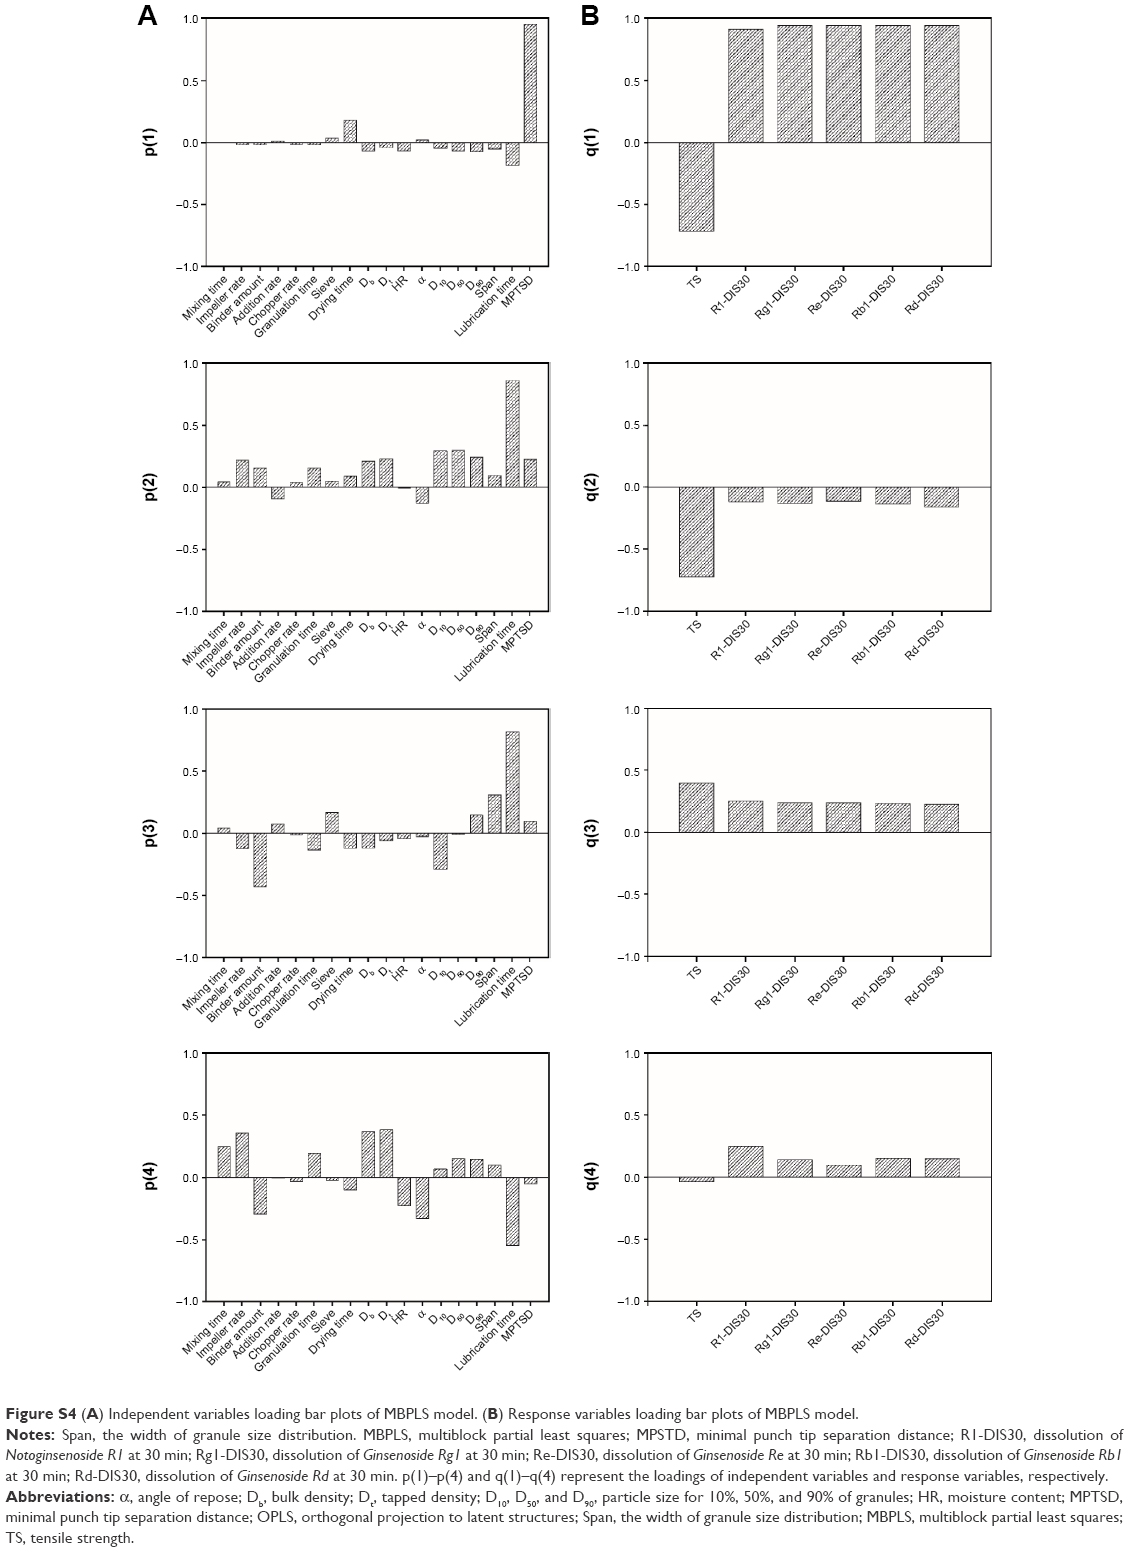 | Figure S4(A) Independent variables loading bar plots of MBPLS model. (B) Response variables loading bar plots of MBPLS model. |
References
Geladi P, Kowalski BR. Partial least-squares regression: a tutorial. Anal Chim Acta. 1986;185:1–17. | ||
Trygg J, Wold S. Orthogonal projections to latent structures (O-PLS). J Chemometr. 2002;16(3):119–128. | ||
Trygg J. Prediction and spectral profile estimation in multivariate calibration. J Chemometr. 2004;18(3–4):166–172. | ||
Frank I, Kowalski BR. Prediction of wine quality and geographic origin from chemical measurements by parital least-squares regression modeling. Anal Chim Acta. 1984;162:241–251. | ||
Yaroshchyk P, Death DL, Spencer SJ. Comparison of principal components regression, partial least squares regression, multi-block partial least squares regression, and serial partial least squares regression algorithms for the analysis of Fe in iron ore using LIBS. J Anal Atom Spectrom. 2012;27(1):92–98. | ||
Westerhuis JA, Kourti T, MacGregor JF. Analysis of multiblock and hierarchical PCA and PLS models. J Chemometr. 1998;12(5):301–321. | ||
Wangen LE, Kowalski BR. A multiblock partial least squares algorithm for investigating complex chemical systems. J Chemometr. 1989;3(1):3–20. | ||
Frank IE, Kowalski BR. A multivariate method for relating groups of measurements connected by a causal pathway. Anal Chim Acta. 1985;167:51–63. | ||
Westerhuis JA, Smilde AK. Deflation in multiblock PLS. J Chemometr. 2001;15(5):485–493. |
 © 2016 The Author(s). This work is published and licensed by Dove Medical Press Limited. The full terms of this license are available at https://www.dovepress.com/terms.php and incorporate the Creative Commons Attribution - Non Commercial (unported, v3.0) License.
By accessing the work you hereby accept the Terms. Non-commercial uses of the work are permitted without any further permission from Dove Medical Press Limited, provided the work is properly attributed. For permission for commercial use of this work, please see paragraphs 4.2 and 5 of our Terms.
© 2016 The Author(s). This work is published and licensed by Dove Medical Press Limited. The full terms of this license are available at https://www.dovepress.com/terms.php and incorporate the Creative Commons Attribution - Non Commercial (unported, v3.0) License.
By accessing the work you hereby accept the Terms. Non-commercial uses of the work are permitted without any further permission from Dove Medical Press Limited, provided the work is properly attributed. For permission for commercial use of this work, please see paragraphs 4.2 and 5 of our Terms.