")
Back to Archived Journals » Research and Reports in Nuclear Medicine » Volume 5
Standardization of dual time point [18F] 2-Deoxy-2-fluoro-D-glucose-positron emission tomography performed with different positron emission tomography scanners using partial volume correction
Authors Mikasa S, Akamatsu G, Taniguchi T, Kidera D, Kihara K, Matsuoka K, Amakusa S, Yoshida T, Sasaki M
Received 28 August 2014
Accepted for publication 2 December 2014
Published 9 February 2015 Volume 2015:5 Pages 1—7
DOI https://doi.org/10.2147/RRNM.S73413
Checked for plagiarism Yes
Review by Single anonymous peer review
Peer reviewer comments 4
Editor who approved publication: Professor Tarik Massoud
Shohei Mikasa,1 Go Akamatsu,1 Takafumi Taniguchi,1 Daisuke Kidera,1 Ken Kihara,1 Kohki Matsuoka,2 Shinji Amakusa,2 Tsuyoshi Yoshida,2 Masayuki Sasaki1
1Department of Health Sciences, Graduate School of Medical Sciences, Kyushu University, Fukuoka, Japan; 2PET Imaging Center, Koga Hospital 21, Kurume, Japan
Introduction: The aim of this study was to examine the possibility of using the partial volume correction (PVC) to standardize dual time point [18F] 2-Deoxy-2-fluoro-D-glucose (FDG)-positron emission tomography (PET) studies with two PET scanners.
Materials and methods: One hundred and thirteen lesions from 96 breast cancer patients were examined. FDG-PET scans were performed at both 60 and 120 minutes after FDG injection using different PET scanners. The maximum standardized uptake values (SUVmaxs) were measured at both time points (SUVmax1 and SUVmax2) and the percent change in the SUVmax (∆%SUVmax) between the two time points was calculated. PVC was performed using a look-up table generated based on the recovery coefficient curves and point spread function of each scanner.
Results: The SUVmax1, the SUVmax2, and the ∆%SUVmax were 5.67±4.45, 5.15±4.29, and -9.30%±20.54%, respectively. After PVC, all parameters significantly increased to 10.44±5.55, 10.23±5.77, and -1.15%±21.66%, respectively. In addition, the number of lesions with a positive ∆%SUVmax increased after PVC, from 26.5% to 40.7%.
Conclusion: PVC of the SUVmax is considered to be useful for standardizing dual time point FDG-PET studies in patients with breast cancer performed using different PET scanners. This method is also expected to be useful for standardizing multicenter PET studies.
Keywords: FDG-PET, SUV, standardization, partial volume correction, breast cancer, dual time point imaging
Introduction
[18F] 2-Deoxy-2-fluoro-D-glucose (FDG) positron emission tomography (PET) is useful for diagnosis, staging, restaging and monitoring of therapy in patients with malignant tumors.1 It is well known that the uptake of FDG in malignant tumors continues to increase steadily for several hours after FDG injection.2–5 In addition, the same trend has also been reported in malignant breast lesions. The increasing uptake of FDG over time in breast malignancies has been suggested to be helpful in enhancing the diagnostic accuracy of FDG-PET studies.6 Several studies have reported that dual time point FDG-PET examinations with relative changes in uptake improve the sensitivity and accuracy of diagnosing breast cancer.2,3,6–11
The standardized uptake value (SUV) is widely used for quantitative evaluation in FDG-PET studies. However, the SUV varies depending on the PET image quality, including the performance of the PET systems, the acquisition parameters, the patient preparation procedures and so on.12,13 The partial volume effect (PVE) is the underestimation of the radioactivity due to the image blurring introduced by the finite inherent spatial resolution of the imaging system.14 In some institutions, different PET scanners are installed for clinical examinations. Furthermore, the management of the examination efficiency constrains to perform dual time point FDG-PET examinations with different PET scanners. Because the bias introduced by PVE is device-dependent, this is a serious problem in the standardization of PET studies performed using different PET scanners. Correcting the PVE of each device is expected to improve the quantitative differences and to standardize FDG-PET studies. Although several methods of performing partial volume correction (PVC) have been proposed,15–18 we previously developed a simple table lookup method for PVC.19,20 This method is easily applicable to different PET scanners and protocols. However, the application of this method in clinical examinations has not been performed using different PET scanners.
The purpose of this study was to examine the possibility of standardizing dual time point FDG-PET studies performed with different PET scanners in patients with breast cancer using PVC.
Materials and methods
Phantoms
We used a body phantom of the National Electrical Manufacturers Association 2001 International Electrotechnical Commission consisting of seven hot spheres. These spheres were 37, 28, 22, 17, 13, 10, and 5 mm in inner diameter, with a wall thickness of 1 mm. The background radioactivity was 2.58 kBq/mL, and every sphere phantom was filled with high concentration 18F solution. We prepared four phantoms whose sphere to background (SB) ratios were 8:1, 4:1, 2:1, and 1.25:1.
Patients
FDG-PET was performed in 101 consecutive patients with breast cancer between January 5, 2011 and March 16, 2012. Four patients with a fasting blood sugar level higher than 150 mg/dL and one patient who did not complete FDG-PET were excluded. Accordingly, 96 patients were analyzed in this study. One hundred and thirteen lesions in these patients were examined. The lesions consisted of 74 primary tumors, 31 metastatic lymph nodes and eight distant metastases. The short-axis diameter of the lesions measured on the computed tomography (CT) images ranged from 4 to 57 mm. This clinical study was approved by the ethics committee of our institution (no 24–64).
PET scanners
The features of the two PET devices are shown in Table 1. The ADVANCE NXi (PET1; GE Healthcare, Milwaukee, WI, USA) comprises 18 rings of 672 bismuth germanate (BGO) crystals (size: 4.0×8.0×30 mm), covering a transaxial field of view (FOV) of 550 mm and an axial FOV of 152 mm in diameter. The total detector number is 12,096. The transaxial full width at half maximum (FWHM) at 1 mm is 4.8 mm. The True Point Biograph 40 (PET2, Siemens, Knoxville, TN, USA) is comprised of 39 rings of 624 lutetium oxyorthosilicate (LSO) crystals (size: 4.0×4.0×20 mm), covering a transaxial FOV of 605 mm and an axial FOV of 162 mm in diameter. The total detector number is 24,336. The transaxial FWHM at 1 mm is 5.9 mm.
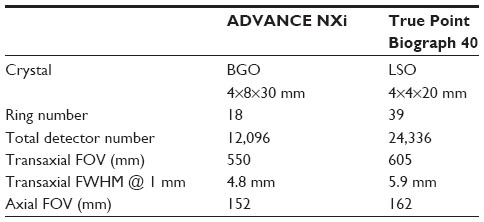 | Table 1 Comparison of device performances |
Data acquisition and image reconstruction
In the phantom study, PET data acquisition with the PET1 was performed in the 2D static mode for 10 minutes per bed position. The images were reconstructed with a 2D ordered subsets expectation maximization algorithm (two iterations; 21 subsets; the FWHM of the Gaussian filter was 8 mm). The image matrix was 128×128 (4.3×4.3×4.25 mm pixels). Transmission scans for the attenuation correction were performed with 68Ge-68Ga sources. PET data acquisition with the PET2 was performed in the 3D static mode for 10 minutes per bed position. The image matrix was 168×168 (4.07×4.07×5.00 mm pixels). The CT scan protocol for the PET2 was performed using the following parameters: tube voltage: 120 kV, effective tube current: 80 mA, 0.5 s tube rotation. The CT data were used for attenuation correction. The images were reconstructed using the Fourier rebinning-2D ordered subsets expectation maximization algorithm (two iterations; eight subsets and the FWHM was 6 mm).
In the clinical study, all patients fasted for at least 4 hours before the injection of 3.7 MBq/kg of FDG. The first scans obtained at 60 minutes were performed with the PET1, and the second scans obtained at 120 minutes were performed with the PET2 in all patients. The acquisition time per bed position was 2 minutes at both time points. The protocol for data acquisition in the clinical examination was the same as that used in the phantom study, except for the acquisition time.
Generation of lookup table for PVC
For PVC, lookup tables for each PET scanner were generated. The details of this method have been previously described.19,20 Based on the phantom studies, recovery coefficient (RC) curves for each device were first generated. The RC of each sphere was expressed as the ratio of the maximum radioactivity of each sphere to that of the 37 mm sphere for each SB ratio. The RC curves were considered to be an integral of the Gaussian weighting function because the point-spread function is essentially Gaussian and we approximated these curves using Equation 1:19–21
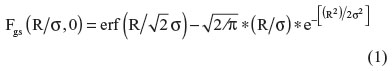
where R represents the radius of the hot sphere and σ is the standard deviation of the Gaussian function (σ = FWHM/2.35). Furthermore, the FWHM of the PET system is also thought to be influenced by the SB ratio. We developed two functions to obtain the FWHM in response to the SB ratio (Equations 2 and 3) and inserted each equation into Equation 1.
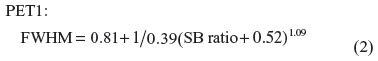
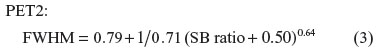
Then, two lookup tables for each PET scanner were created to find the true SB ratio based on Equations 1, 2, and 3. Using these tables, the radius and the measured SB ratios of the lesions are required in order to find the true SB ratio.
Data analysis
In the clinical FDG-PET study, a circular region-of-interest (ROI) for the lesion with the same size as the lesion was placed on the PET images. A circular ROI with the same size as the lesion ROI was placed on the contralateral normal breast for the background. The maximum SUVs (SUVmaxs) of the lesion were measured on both the first and second scans (SUVmax1 and SUVmax2, respectively). We also measured the average SUV in the background (BG) on both images (BG1 and BG2). In addition, we measured the short-axis diameters of the lesions on the CT images of the second scan.
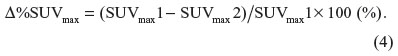
The Δ%SUVmax represents the percent change of SUVmax between the two time points (Equation 4):
Using PVC, we obtained corrected SUVmax1 (cSUVmax1) and corrected SUVmax2 (cSUVmax2). We also calculated corrected Δ%SUVmax (Δ%cSUVmax).
Statistical analysis
The relationship between the short-axis diameter and the SUVmax of the lesions was analyzed using Spearman’s correlation coefficient rank test. The differences between SUVmax and cSUVmax and between Δ%SUVmax and Δ%cSUVmax were analyzed using Wilcoxon signed-ranks test. P-values of less than 0.05 were considered to be statistically significant.
Results
Phantom studies
The PET images of the phantoms are shown in Figure 1. On the images obtained with the PET1, spheres larger than 10 mm could be recognized at an SB ratio of 8. The number of visible spheres decreased along with a decrease in the SB ratio. On the other hand, the images obtained with the PET2 showed relatively better image quality. All spheres, including 5 mm diameter sphere, could be recognized at an SB ratio of 8. However, the number of visible spheres decreased along with a decrease in the SB ratio. The RCs, background activities and approximated RC curves yielded by Equation 1 for each SB ratio are shown in Figure 2. The patterns of the RC curves were different among the SB ratios and scanners.
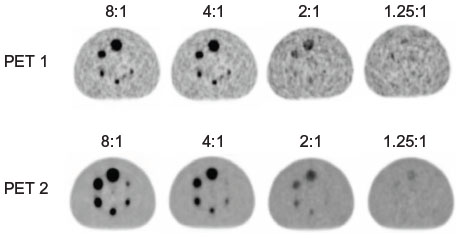 | Figure 1 PET images of the National Electrical Manufacturers Association 2001 International Electrotechnical Commission Body phantoms. |
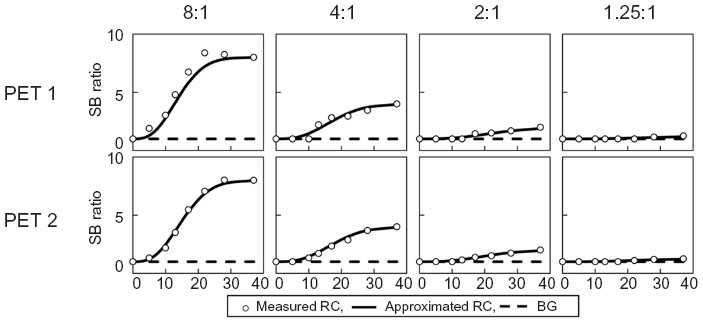 | Figure 2 RC curves for each PET scanner. |
Clinical studies
The relationships between the short-axis diameters and the SUVmax1, and between the short-axis diameters and the SUVmax2 of the breast lesions are shown in Figure 3. The mean SUVmax1 increased from 5.67±4.45 to 10.44±5.55 after PVC. This difference was significant (P<0.05). Before PVC, a positive correlation was observed between the diameter and the SUVmax1 (r=0.649, P<0.05). However, this relationship disappeared after PVC (r=−0.118, P=0.211). The mean SUVmax2 increased from 5.15±4.29 to 10.23±5.77 after PVC. This difference was significant (P<0.05). The positive correlation between the diameter and the SUVmax2 (r=0.655, P<0.05) also disappeared after PVC (r=-0.112, P=0.235).
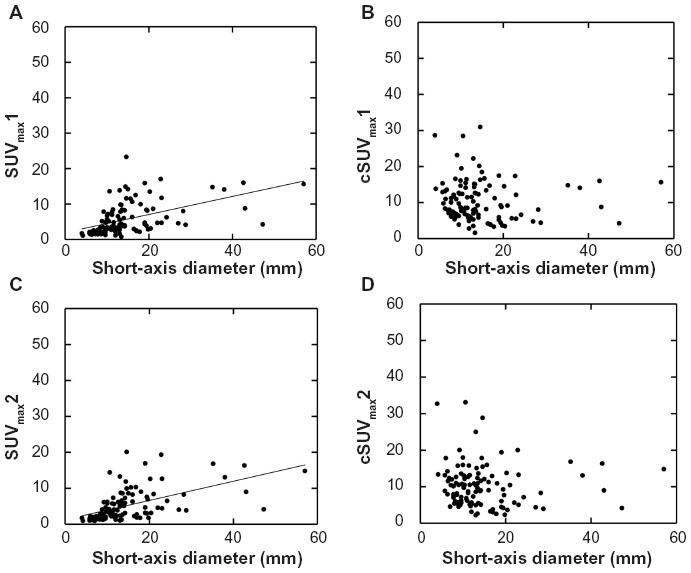 | Figure 3 Relationships between the diameter and the SUV of the breast lesions. |
The relationships between the short-axis diameters of the lesions and the Δ%SUVmax are shown in Figure 4. The mean Δ%SUVmax increased from −9.30±20.54 to −1.15±21.66 after PVC. This difference was significant (P<0.05). In addition, the Δ%SUVmax increased in 89.4% of the lesions. Before correction, especially in small lesions with a short-axis diameter of less than 20 mm, the Δ%SUVmaxs were negative. In contrast, the number of lesions with a positive Δ%SUVmax increased after PVC, from 30 lesions (26.5%) to 46 lesions (40.7%).
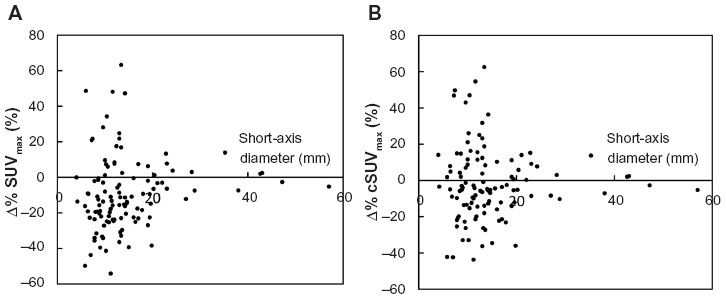 | Figure 4 Relationship between the diameter and Δ%SUVmax. |
Figure 5 shows an example of the clinical images. The PET images obtained at both the first and second time points exhibited abnormally high FDG uptake in the right breast (SUVmax1 =1.92 and SUVmax2 =1.91, respectively). After PVC, the SUVmax increased (cSUVmax1 =6.38 and cSUVmax2 =7.84, respectively). The Δ%SUVmax also increased from -0.52% to 14.78% after PVC.
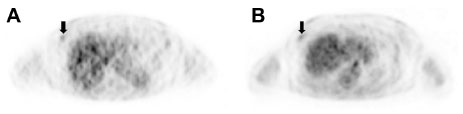 | Figure 5 Dual time point FDG-PET images of a 60 year-old female patient. |
Discussion
There are several factors that can give rise to bias in SUV measurements. In our study, we examined the possibility of standardizing dual time point FDG-PET studies in patients with breast cancer performed with different PET scanners using PVC. The positive correlations between the short-axis diameters and SUVmaxs observed at both time points disappeared after PVC. In addition, the number of lesions with a positive Δ%SUVmax increased after PVC, while the Δ%SUVmax significantly increased after PVC.
After PVC, the positive correlations between the diameter and the SUVmax at both time points disappeared. This result shows that the underestimation of the radioactivity due to PVE was improved by our PVC method. In other words, we were able to evaluate the SUVs by eliminating the PVE of different PET scanners. Vesselle et al22 reported that a relationship between the tumor stage and the SUVmax of FDG disappeared after applying their PVC method. In addition, Hicks et al23 reported that performing tumor staging with FDG-PET study provides more accurate prognostic stratification than did staging based on conventional investigations. These reports suggest that FDG accumulation reflects a mechanism other than tumor size. Therefore, the improvement of underestimation due to the PVE will result in more accurate quantitative evaluation of glucose metabolism.
In our study, PVC significantly increased the Δ%SUVmax, and the number of lesions with a positive Δ%SUVmax also increased. Many studies have reported positive Δ%SUVmax in malignant tumors on dual time point PET. Therefore, the significant increase of Δ%SUVmax observed in our dual time points FDG-PET studies performed with different PET scanners indicate that our method largely eliminated the differences in the performance of the PET scanners. Therefore, we can consider that the PVC enables us to evaluate multiple studies performed using different PET scanners with the same criteria. This method is thus considered to be useful for standardizing multicenter PET studies.
Our study has some limitations. The PVE of each PET device is one of the major factors resulting in bias of the SUV. The use of additional methods to correct the other factors, such as the parameters for acquisition and iterative reconstruction protocols, is considered to further improve the results. Several studies have examined the standardization of data acquisition, image reconstruction, data analyses and SUV and so on.12,13 These trials are still under consideration and no regular methods have yet been proposed. Further studies are required to examine the possibility of standardizing FDG-PET examinations taking these points into account. Second, our PVC method corrects the SUVmax. Because the SUVmax is strongly affected by image noise,24 future studies should examine the standardization of SUVmean. Several other metrics, such as the SUV50 and metabolic tumor volume, should also be examined. Third, our correction method was developed for refined, spherical lesions. Although many breast cancer lesions have an irregular shape and heterogeneous FDG distribution, most small lesions can be considered to be spherical and homogeneous.
Conclusion
The PVC is considered to be one of the useful methods for standardizing dual time point PET studies performed using different PET scanners. Although the quantitative differences among PET scanners are caused by many factors, this method is also expected to be one of the useful methods for standardizing multicenter PET studies.
Acknowledgment
We thank the staff of the PET Imaging Center at Koga Hospital 21 for their valuable clinical support.
Disclosure
The authors declare that they have no conflicts of interest in this work.
References
Poeppel TD, Krause BJ, Heusner TA, Boy C, Bockisch A, Antoch G. PET/CT for staging and follow-up of patients with malignancies. Eur J Radiol. 2009;70(3):382–392. | |
Cheng G, Torigian DA, Zhung H, Alavi A. When should we recommend use of dual time-point and delayed time-point imaging techniques in FDG PET? Eur J Nucl Med Mol Imaging. 2013;40(5):779–787. | |
Schillaci O. Use of dual-point fluorodeoxyglucose imaging to enhance sensitivity and specificity. Semin Nucl Med. 2012;42(4):267–280. | |
Demura Y, Tsuchida T, Ishizaki T, et al. 18F-FDG accumulation with PET for differentiation between benign and malignant lesions in the thorax. J Nucl Med. 2003;44(4):540–548. | |
Matthies A, Hickeson M, Cuchiara A, Alavi A. Dual time point 18F-FDG PET for the evaluation of pulmonary nodules. J Nucl Med. 2002;43(7):871–875. | |
Zytoon AA, Murakami K, El-Kholy MR, El-Shorbagy E. Dual point FDG-PET/CT imaging… Potential tool for diagnosis of breast cancer. Clin Radiol. 2008;63(11):1213–1227. | |
Kumar R, Loving VA, Chauhan A, Zhuang H, Mitchell S, Alavi A. Potential of dual-time-point imaging to improve breast cancer diagnosis with 18F-FDG PET. J Nucl Med. 2005;46(11):1819–1824. | |
Mavi A, Urhan M, Yu JQ, et al. Dual time point 18F-FDG PET imaging detects breast cancer with high sensitivity and correlates well with histologic subtypes. J Nucl Med. 2006;47(9):1440–1446. | |
Zytoon AA, Murakami K, El-Kholy MR, El-Shorbagy E, Ebied O. Breast cancer with low FDG uptake: characterization by means of dual-time point FDG-PET/CT. Eur J Radiol. 2009;70(3):530–538. | |
Hahn S, Hecktor J, Grabellus F, et al. Diagnostic accuracy of dual-time-point 18F-FDG PET/CT for the detection of axillary lymph node metastases in breast cancer patients. Acta Radiol. 2012;53(5):518–523. | |
Caprio MG, Cangiano A, Imbriaco M, et al. Dual-time-point [18F]-FDG PET/CT in the diagnostic evaluation of suspicious breast lesions. Radiol Med. 2010;115(2):215–224. | |
Boellaard R. Standards for PET image acquisition and quantitative data analysis. J Nucl Med. 2009;50 Suppl 1:11S–20S. | |
Boellaard R. Need for standardization of 18F-FDG PET/CT for treatment response assessments. J Nucl Med. 2011;52 Suppl 2:93S–100S. | |
Soret M, Bacharach SL, Buvat I. Partial-volume effect in PET tumor imaging. J Nucl Med. 2007;48(6):932–945. | |
Rousset OG, Ma Y, Evans AC. Correction for partial volume effects in PET: principle and validation. J Nucl Med. 1998;39(5):904–911. | |
Rousset OG, Collins DL, Rahmim A, Wong DF. Design and implementation of an automated partial volume correction in PET: application to dopamine receptor quantification in the normal human striatum. J Nucl Med. 2008;49(7):1097–1106. | |
Chen CH, Muzic RF Jr, Nelson AD, Adler LP. Simultaneous recovery of size and radioactivity concentration of small spheroids with PET data. J Nucl Med. 1999;40(1):118–130. | |
Adler LP, Crowe JP, Al-Kaisi NK, Sunshine JL. Evaluation of breast masses and axillary lymph nodes with [F-18] 2-deoxy-2-fluoro-D-glucose PET. Radiology. 1993;187(3):743–750. | |
Sakaguchi Y, Mizoguchi N, Mitsumoto T, et al. A simple table lookup method for PET/CT partial volume correction using a point-spread function in diagnosing lymph node metastasis. Ann Nucl Med. 2010;24(8):585–591. | |
Maruoka Y, Abe K, Baba S, et al. Usefulness of partial volume effect-corrected F-18 FDG PET/CT for predicting I-131 accumulation in the metastatic lymph nodes of patients with thyroid carcinoma. Ann Nucl Med. 2013;27(10):873–879. | |
Kessler RM, Ellis JR Jr, Eden M. Analysis of emission tomographic scan data: limitations imposed by resolution and background. J Comput Assist Tomogr. 1984;8(3):514–522. | |
Vesselle H, Turcotte E, Wiens L, et al. Relationship between non-small cell lung cancer fluorodeoxyglucose uptake at positron emission tomography and surgical stage with relevance to patient prognosis. Clin Cancer Res. 2004;10(14):4709–4716. | |
Hicks RJ, Kalff V, MacManus MP, et al. 18F-FDG PET provides high-impact and powerful prognostic stratification in staging newly diagnosed non-small cell lung cancer. J Nucl Med. 2001;42(11):1596–1604. | |
Boellaard R, Krak NC, Hoekstra OS, Lammertsma AA. Effects of noise, image resolution, and ROI definition on the accuracy of standard uptake values: a simulation study. J Nucl Med. 2004;45(9):1519–1527. |
 © 2015 The Author(s). This work is published and licensed by Dove Medical Press Limited. The full terms of this license are available at https://www.dovepress.com/terms.php and incorporate the Creative Commons Attribution - Non Commercial (unported, v3.0) License.
By accessing the work you hereby accept the Terms. Non-commercial uses of the work are permitted without any further permission from Dove Medical Press Limited, provided the work is properly attributed. For permission for commercial use of this work, please see paragraphs 4.2 and 5 of our Terms.
© 2015 The Author(s). This work is published and licensed by Dove Medical Press Limited. The full terms of this license are available at https://www.dovepress.com/terms.php and incorporate the Creative Commons Attribution - Non Commercial (unported, v3.0) License.
By accessing the work you hereby accept the Terms. Non-commercial uses of the work are permitted without any further permission from Dove Medical Press Limited, provided the work is properly attributed. For permission for commercial use of this work, please see paragraphs 4.2 and 5 of our Terms.