")
Back to Journals » Drug Design, Development and Therapy » Volume 10
Solubility enhancement of simvastatin by arginine: thermodynamics, solute–solvent interactions, and spectral analysis
Authors Meor Mohd Affandi M, Tripathy M, Ali Shah SA, Abdul Majeed AB
Received 18 August 2015
Accepted for publication 2 December 2015
Published 2 March 2016 Volume 2016:10 Pages 959—969
DOI https://doi.org/10.2147/DDDT.S94701
Checked for plagiarism Yes
Review by Single anonymous peer review
Peer reviewer comments 2
Editor who approved publication: Prof. Dr. Wei Duan
MMR Meor Mohd Affandi,1,2 Minaketan Tripathy,1,3 Syed Adnan Ali Shah,3,4 ABA Majeed1,3
1Laboratory of Fundamental Pharmaceutics, Faculty of Pharmacy, Universiti Teknologi MARA (UiTM), Bandar Puncak Alam, Selangor, Malaysia; 2DDH Core, Universiti Teknologi MARA (UiTM), Shah Alam, Selangor Darul Ehsan, Malaysia; 3Pharmaceutical and Life Sciences Core, Universiti Teknologi MARA (UiTM), Shah Alam, Selangor Darul Ehsan, Malaysia; 4Atta-ur-Rahman Institute for Natural Products Discovery (AuRIns), Faculty of Pharmacy, Universiti Teknologi MARA (UiTM), Bandar Puncak Alam, Selangor, Malaysia
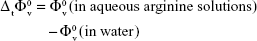
Abstract: We examined the solubility of simvastatin in water in 0.01 mol·dm-3, 0.02 mol·dm-3, 0.04 mol·dm-3, 0.09 mol·dm-3, 0.18 mol·dm-3, 0.36 mol·dm-3, and 0.73 mol·dm-3 arginine (ARG) solutions. The investigated drug is termed the solute, whereas ARG the cosolute. Phase solubility studies illustrated a higher extent of solubility enhancement for simvastatin. The aforementioned system was subjected to conductometric and volumetric measurements at temperatures (T) of 298.15 K, 303.15 K, 308.15 K, and 313.15 K to illustrate the thermodynamics involved and related solute–solvent interactions. The conductance values were used to evaluate the limiting molar conductance and association constants. Thermodynamic parameters (ΔG0, ΔH0, ΔS0, and Es) for the association process of the solute in the aqueous solutions of ARG were calculated. Limiting partial molar volumes and expansibilities were evaluated from the density values. These values are discussed in terms of the solute–solvent and solute–cosolute interactions. Further, these systems were analyzed using ultraviolet–visible analysis, Fourier-transform infrared spectroscopy, and 13C, 1H, and two-dimensional nuclear overhauser effect spectroscopy nuclear magnetic resonance to complement thermophysical explanation.
Keywords: simvastatin–arginine complex, solubility, volumetric, conductometric, spectroscopy
Introduction
In the last 2 decades, there has been an increasing interest in the solubility enhancement of active pharmaceutical ingredients, particularly on those belonging to class II of the Biopharmaceutics Classification System. In this context, statin molecules, the well-known competitive and potent inhibitors of 3-hydroxy-3-methlyglutaryl-coenzyme A reductase, are classified as class II drugs.1 Clinically, statins possess a potent cholesterol-lowering effect and could reduce the risk of mortality and morbidity associated with coronary heart disease.2,3 Among the various statins available, simvastatin (SMV) is the most commonly used lipid-lowering agents prescribed and studied by medical practitioners and researchers.4 SMV has a very low bioavailability. It was reported that only 5% of the dosed SMV reached the systemic circulation resulting in a plasma concentration, typically only at the nanogram per milliliter level.5 Hence, the enhancement of the aqueous solubility in such a case shall lead to increased therapeutic efficacy and bioavailability.6
Numerous techniques and methods have been reported on how the solubility of SMV can be enhanced. These include particle size reduction,7 drug–dendrimer conjugates,8 mesoporous carriers,9 the solid dispersion method,10–12 inclusion complexes,13–15 and surfactant-based approaches.16,17 Despite numerous solubility enhancement methods and techniques that have been discussed in detail, the fundamental properties of the molecular interaction involved are still rather scarce. Data such as conductometric and volumetric measurements at different temperatures are crucial to illustrate the thermodynamics involved and related solute–solvent interactions.18 Therefore, in this article, we investigated the feasibility of arginine (ARG), which had been reported as a solubility enhancer,19,20 in improving the solubility of SMV. This comprised the investigation on the phase solubility study, densities, and conductivities for several concentrations of SMV–ARG binary solution mixture at T of 298.15 K, 303.15 K, 308.15 K, and 313.15 K. The parameters related to this study such as the Gibbs free energy of transfer ( ), limiting molar conductance (Λ0), association constants (KA), and related thermodynamic parameters (ΔG0, ΔH0, ΔS0, and Es) were calculated. These parameters were used to discuss the solubility enhancement phenomenon; possible solute–solvent, solute–cosolute, and solvent–solvent interactions; the behavior of liquid systems; structure making and structure breaking phenomena; and related structural changes.21,22 Further, these binary solution systems were analyzed using ultraviolet (UV)–visible spectrophotometer, Fourier-transform infrared (FTIR) spectroscopy, and 13C, 1H, and two-dimensional (2D) nuclear overhauser effect spectroscopy (NOESY) nuclear magnetic resonance (NMR) to complement thermophysical explanation.
Materials and methods
Materials
SMV was kindly donated by Hovid Berhad (Ipoh, Malaysia). ARG was purchased from Sigma-Aldrich Co. (St Louis, MO, USA), while ethanol and methanol were procured from HmbG Chemical (Hamburg, Germany). The water used was obtained from Select Bio O Purite (Oxfordshire, UK) water system. All other chemicals used were of analytical grade unless otherwise stated.
Phase solubility study
Solubility studies of SMV in the presence of ARG were carried out by the methods described elsewhere.23 Briefly, different concentrations of ARG solutions, ranging from 0.01 mol·dm−3 to 0.73 mol·dm−3, were prepared in the 100 mL conical flask. An excess amount of drug (SMV) was added to each flask containing the specified molar solutions of the ARG, which was denoted as S1–S7, respectively. Separately, the excess amount of drug was added only to distilled water to determine the respective intrinsic solubilities, which was denoted as S0. All conical flasks were placed in a mechanical water bath shaker at the temperature of 308.15 K±0.02 K and shaken for a maximum period of 72 hours. At the end of the incubation period, the suspensions were filtered through a 0.5 μm membrane filter. Aliquots of the filtrates were estimated for the drug concentration by UV–visible spectroscopy at 238 nm, with suitable dilution and against the respective molar solutions of ARG as blank. Results of the solubility obtained were used to calculate the solubility efficiency. Further, these filtrates along with their corresponding blanks were subjected to the estimation of thermophysicochemical parameters.
Conductometric studies
A cyber scan conductivity meter with an accuracy of ±0.5% and a conductivity cell (Model PC-510; Eutech Instruments, Singapore) were used for the measurement of conductivity of each sample. The conductance cell was equipped with a water circulating jacket, and the temperature was controlled within ±0.02 K with a water thermostat. The cell constant is 1.01 cm−1 that was calculated by repeated measurements of KCl solutions. All data were corrected with specific conductivity of pure water at the experimental temperatures of 298.15 K and 313.15 K. For each sample, six data points were recorded to calculate the average. Further, these data were used to determine the equivalent conductance of the samples.
Volumetric studies
An Anton Paar digital density meter (Model DMA 60/602) was used to measure the density of solutions (both blank and solutions containing saturated concentrations of SMV at four different temperatures ranging from 298.15 K to 313.15 K). An efficient constant temperature bath with stability within ±0.02 K was used to control the temperature of water around the density meter cell. The density meter was calibrated using pure water and dry air. All density measurements of the solutions were made relative to pure water. Densities of pure water at the experimental temperatures were taken from the literature.24
UV–visible analysis
The UV–visible spectroscopic analysis was carried out by GENESYS™ 10S UV–visible spectrophotometer (Thermo Fisher Scientific, Waltham, MA, USA). The spectrum scan was performed between 900 nm and 200 nm. The investigated ARG test system containing saturated SMV (S7) was subjected to UV analysis against the corresponding ARG system as the blank. SMV solution in ethanol at a concentration of 10 μg/mL was spectrum scanned for comparison.
FTIR spectroscopic analysis
The S7 solution system was also subjected to Varian FTIR 600 series spectroscopic analysis (Agilent Technologies, Santa Clara, CA, USA) at room temperature from 400 cm−1 to 4,000 cm−1. The scanning rate of 20 scans was performed at a resolution of 4 cm−1.
NMR spectrometer
The ARG system (S7/7.34 mol·dm−3) and its counterpart that is the ARG saturated with SMV along with deuterated methanol-solubilized SMV were subjected to the NMR spectroscopic analysis. NMR experiments were performed on a Bruker Ascend™ 600 spectrometer at a proton resonance 1H of 600 MHz, equipped with a Z-gradient 5 mm broadband observe probe using standard pulse sequences and pulse cycling. Each sample was calibrated at 90° high-power pulse for 1H. The sample temperature was set at 300 K. A 2D NOESY spectrum was recorded with 440 increments (64 scans each) in t1 time domain and 2,000 complex points in t2 time domain using a spectral width of 8,500 Hz in both dimensions with the 1H carrier on water. The NMR spectrum of SMV was recorded using deuterated methanol as solvent, whereas SMV–ARG complex was recorded in deuterated water.
Results and discussion
Phase solubility study
The results of the solubility measurements of SMV in different molar concentrations of ARG (S1–S7) along with that in laboratory grade pure water are given in Table 1 at only 308.15 K. The intrinsic solubility of SMV in water was observed to be 0.003164 mmol/mL indicating their poor aqueous solubility. An enhancement of solubility is observed with the increase in cosolute concentration. There has been a massive enhancement of solubility of SMV by 12,781-fold. These massive differences in solubility enhancement can be attributed to the different extent of cosolute (ARG) interaction with SMV, by altering its extent of solvation.
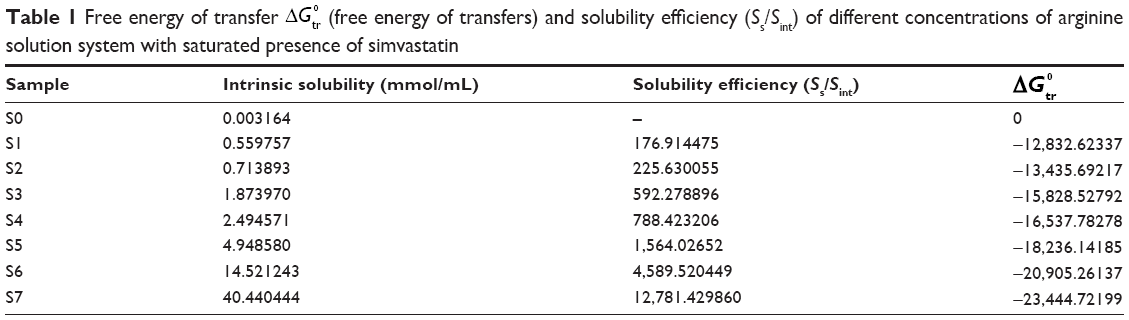 | Table 1 Free energy of transfer |
The dissolution of SMV in the presence of ARG in water (ie, in ternary solutions) may be explained in the light of 1) hydrophilic–ionic interactions between the hydrophilic sites (keto and hydroxyl) of SMV and the ions of ARG and 2) hydrophobic–ionic interactions between the hydrophobic sites (aromatic rings) of the SMV molecule and the ions of the ARG, the cosolute. According to the cosphere overlap model,24 type 1) interactions favor the dissolution of SMV to that of type 2). The Gibbs free energy of transfer () of SMV from pure water to aqueous solutions of ARG was calculated using the following equation:
|
|
where [Sc/S0] is the ratio of molar solubility of the investigated drugs in aqueous ARG solutions to that of pure water.
The Gibbs free energy change indicates the process of transfer from pure water to aqueous ARG solutions, which otherwise reflects the extent of favorability with regard to the solubility enhancement. Values of are shown in Table 1. Negative values in SMV indicate a favorable condition. However, it is interesting to note that at S1 (0.1 mol·dm−3 ARG), SMV achieved a 176-fold increase in solubility enhancement. This result is consistent with the corresponding value of -12,832.62. Further, as we move from S1 to S7, the values are observed to decrease with an increase in the ARG molar concentration. This observation can be explained by the fact that solution environment becomes more favorable with an increase in the presence of ARG, thus enhancing the accommodation of SMV in water.
Conductometric studies
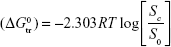
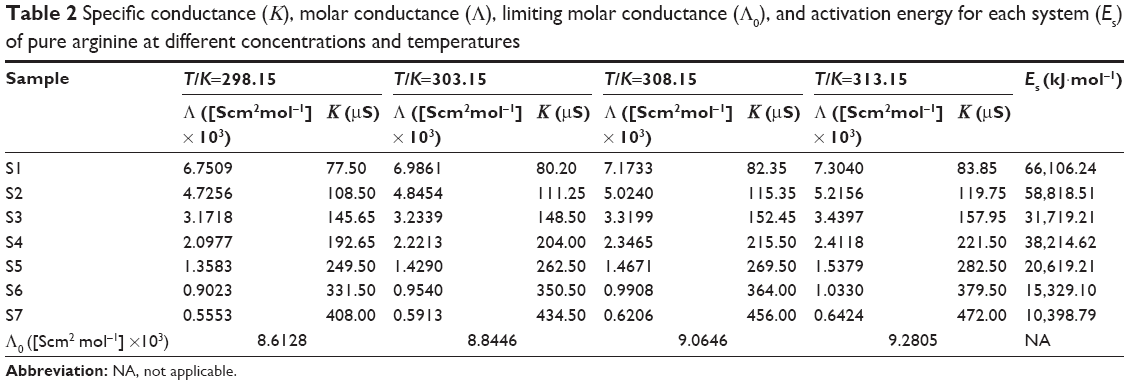
The specific conductance (Κ, μS cm−1) of the solutions of ARG (with and without SMV) under investigation with a concentration range of 0.1–7.34 mol·dm−3 at various temperatures of 298.15 K, 303.15 K, 308.15 K, and 313.15 K was measured. The molar conductance (Λ, Scm2 mol−1) for all studied systems was calculated by applying the following equation:
Λ =1,000 K/C | (2) |
where C is the molar concentration and Κ is the measured specific conductance of the studied systems after solvent correction.
The molar conductance for all studied systems was recorded in Tables 2 and 3. The limiting molar conductance (Λ0) of the ARG system in the presence of SMV was obtained by Equation 3 least-square fitting the experimental data given in the table according to the Kohlrausch expression.25
 | Table 2 Specific conductance (Κ), molar conductance (Λ), limiting molar conductance (Λ0), and activation energy for each system (Es) of pure arginine at different concentrations and temperatures |
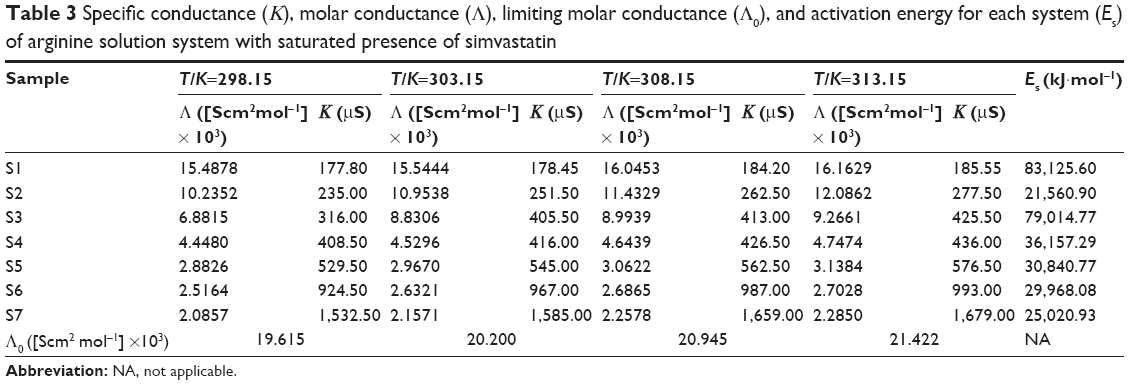 | Table 3 Specific conductance (Κ), molar conductance (Λ), limiting molar conductance (Λ0), and activation energy for each system (Es) of arginine solution system with saturated presence of simvastatin |
|
|

where b is a constant.
The limiting molar conductance values are summarized in Tables 2 and 3. The values of molar conductance and limiting molar conductance were used to calculate the degree of dissociation (α), which was incorporated into the mass action law for the ion association (KA) as given in the following equation:26
|
|
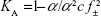
where f± is the mean activity coefficient. The values of KA are summarized in Tables 4 and 5 for 298.15 K.
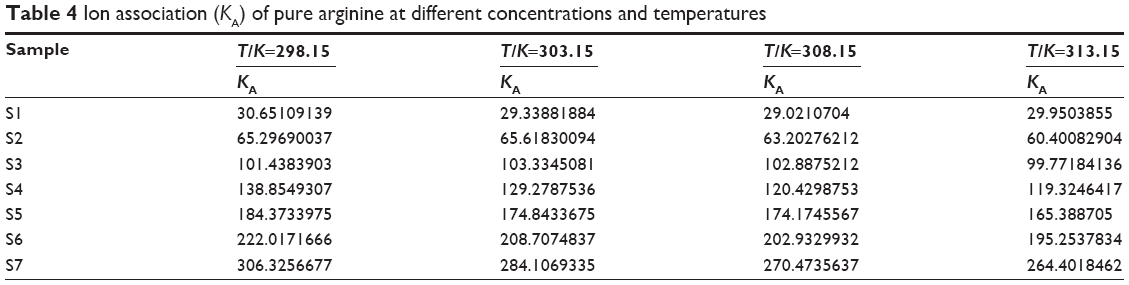 | Table 4 Ion association (KA) of pure arginine at different concentrations and temperatures |
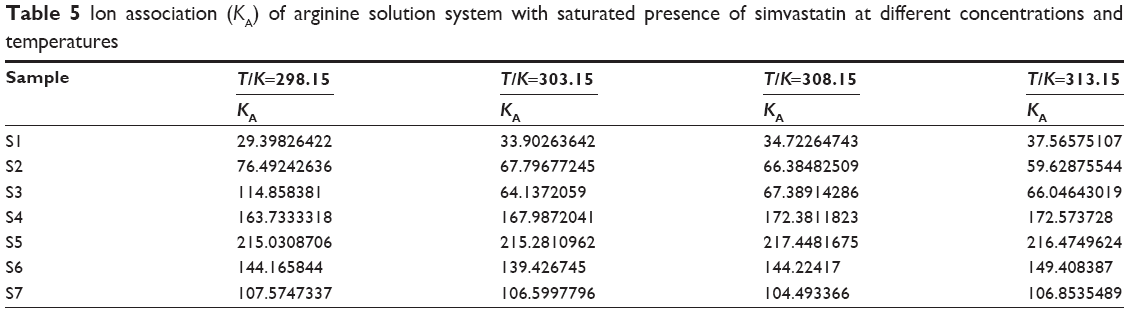 | Table 5 Ion association (KA) of arginine solution system with saturated presence of simvastatin at different concentrations and temperatures |
It can be seen from Tables 2 and 3 that the calculated molar conductivities Λ of aqueous molar solutions of ARG in the absence and saturated presence of SMV decrease with increasing ARG concentration. The increase in ARG concentration causes the formation of ion pairs in the dilute region and possibly stronger ion association, decreasing molar conductivity. Further, the increase in amino acid concentration causes a strong interaction between the ions of water molecule and NH2 charge end group of amino acids thus decreasing the molar conductivity. However, in saturated presence of SMV, the molar conductivity values increased as compared with their counterparts without SMV. The aforementioned observation can be ascribed to the fact that reduced microscopic viscosity decreases the frictional coefficient of the medium enhancing the mobility of the species because of a preferential interaction between the solute SMV and cosolute ARG in water hence increasing the solubility of the former. Moreover, the preferential attraction between ARG and SMV reduces the attraction between the ions of the ARG and water molecules causing a decrease in hydrodynamic radii of the ions and an increase in their mobility.
It can be seen from Tables 2 and 3 that the values of Λ0 of SMV are high in the aqueous solutions of ARG. The higher Λ0 value of SMV can be ascribed to the similar point of analogy as in the case of the molar conductivities.27 It is evident from Table 3 that Λ0 of SMV increases with an increase in temperature in the aqueous solutions of ARG. A similar trend is seen in the case of the ARG solutions only (Table 2). The increased Λ0 values with an increase in temperature indicate less solvation or higher mobility of ions, which can be attributed to the fact that the increased thermal energy results in greater bond breaking and variation in vibrational, rotational, and translational energy of the molecules that lead to higher frequency and higher mobility of the ions.28
Tables 4 and 5 show that the association constant (KA) values of ARG in the absence and saturated presence of SMV increase at almost all experimental concentrations. This was parallel with the earlier argument which stated that the increase in ARG concentration caused the formation of ion pairs in the dilute region and possibly resulted in an increase in ion association. Moreover, it is interesting to note that at higher concentrations of ARG (S5 and S6) with saturated presence of SMV, the KA values decrease with the increased concentration of ARG. This phenomenon can be explained by the fact that at higher concentrations of ARG more and more SMV will be bound with ARG that reduces the attraction between the ions of the ARG and water molecules resulting in less ion association.29 Since the conductance measurements of an ion depend upon mobility,30 it is quite reasonable to treat the conductance data similar to the one employed for the rate process taking place with the change of temperature as given in the following equation:
|
|

where A is the frequency factor, R is the gas constant, and Es is the Arrhenius activation energy of the transport process.
From the plot of log Λ0 vs 1/T, the Es values were computed from the slope (= -Es/2.303R) and given in Tables 2 and 3.
The free energy change, ΔG0, for the association process is calculated from the following equation:
ΔG0 = −RT In KA | (6) |
The heat of association, ΔH0, is calculated from the slope of the plot of ln KA vs 1/T, and the entropy change, ΔS0, is from Gibbs–Helmholtz equation as shown in the following equation:
ΔG0 = ΔH0 – TΔS0 | (7) |
The values of ΔG0, ΔH0, and ΔS0 at 298.15–313.15 K are given in Tables 6 and 7.
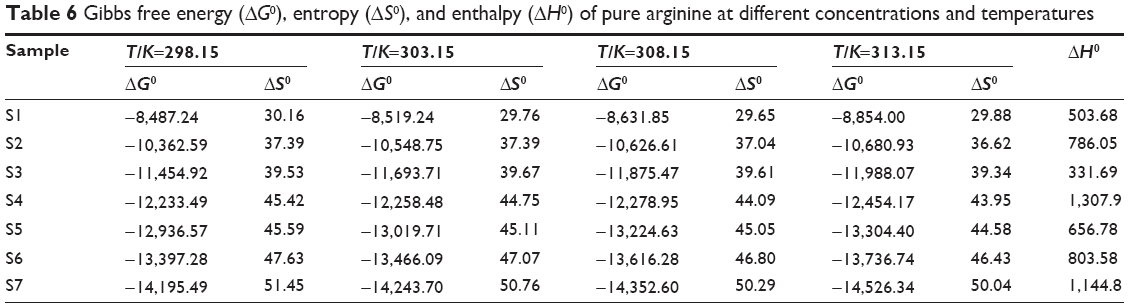 | Table 6 Gibbs free energy (ΔG0), entropy (ΔS0), and enthalpy (ΔH0) of pure arginine at different concentrations and temperatures |
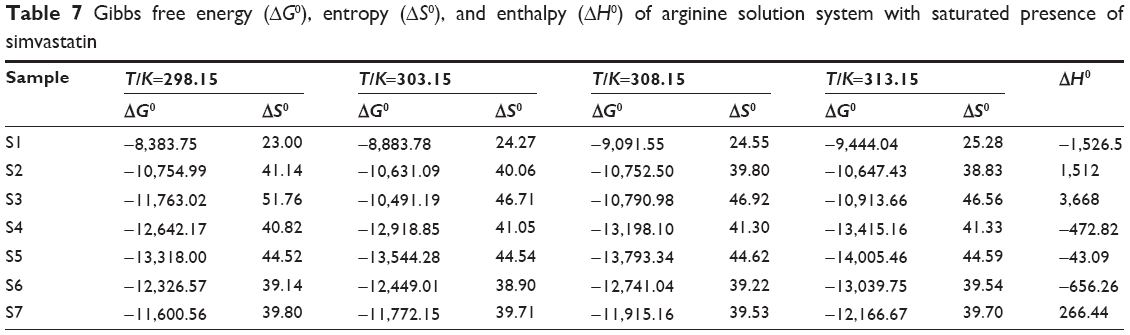 | Table 7 Gibbs free energy (ΔG0), entropy (ΔS0), and enthalpy (ΔH0) of arginine solution system with saturated presence of simvastatin |
It can be seen from Tables 2 and 3 that the values of ES are positive. The negative ΔG0 values for the systems of ARG with and without SMV indicate that the association process predominates over the dissociation process. It is interesting to note that for the system of ARG, the association is endothermic for all concentrations, whereas for ARG system with SMV, there is no specific trend observed. The association process is either endothermic or exothermic depending on the concentration of ARG in the system. Values of ΔS0 are found to be positive indicating the disorderedness of the solubilized species and its highly hydrated nature.
Volumetric studies
Results of the density measurements are given in Table 8 along with the values of limiting apparent molar volume ( ) and limiting apparent molar expansibility (
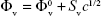
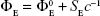
 ) of the ARG system in the absence and saturated presence of SMV in water at T=298.15, 303.15, 308.15, and 313.15 K. Values of and were determined from the intercept of the plot of Φv vs C1/2 and of ΦE vs C−1, respectively, which was in turn derived from the experimentally measured densities as shown in the following equations:
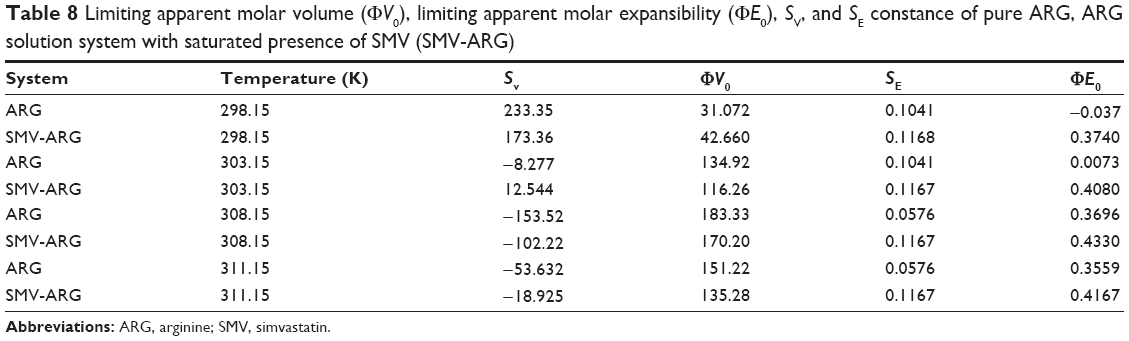 | Table 8 Limiting apparent molar volume (ΦV0), limiting apparent molar expansibility (ΦE0), SV, and SE constance of pure ARG, ARG solution system with saturated presence of SMV (SMV-ARG) |
|
|

and
|
|

where C is the molar concentration of the solute, d0 is the density of pure water, d is the density of the solution, M2 is the molecular mass of the solute, and α0 and α are the coefficients of expansion of the solvent and solution (with or without drug), respectively, and determined by means of the relation available in the literature.31 The Φv and ΦE showed linear dependence with square root of concentration and were found to obey the linear equation as shown in the following equations:
|
|
and
|
|
Values of SV and SE obtained from slopes of the corresponding plots are also given in Table 8. Table 8 shows that the values of are positive for the ARG systems in the absence and presence of SMV at the experimental temperatures. Since the is a measure of ion–solvent interaction, the positive values of indicate a strong ion–solvent or drug–solvent interactions. The results of both the systems indicate that the ion–solvent interactions (in the case of ARG systems) and the solute–solvent interactions (in the case of ARG with the presence of SMV systems) increase with an increase in temperature except at 311.15 K. The presence of ion–solvent or drug–solvent interaction between molecules promotes the structure making effects of the SMV in aqueous ARG systems.
As observed, SV values are positive at lower temperatures except for ARG systems at 303.15 K. Values are negative at higher temperatures at all cases of ARG and ARG–SMV systems; this suggests the absence of ion–ion or solute–solute interaction in the system. Further, it is seen that the values of SV for the system in the presence of SMV are higher as compared with those ARG-only systems. This points to the fact that the solvent structure is not too much enhanced in the presence of the drug.
The standard partial molar volume of transfer, Δt , at infinite dilution of SMV from water to aqueous ARG was determined from the following equation:
|
|
It is seen that the values of Δt are positive for all systems at experimental temperatures and decrease with an increase in temperature. Dehydration of ions (the cation and anion of the ARG) and drug (SMV) molecules may also make a positive contribution to the Δt value. This may be due to the destructive overlap of cospheres resulting in a net decrease in solvation, thereby increasing the solute (drug) volume, and because of the strong interactions between the drug and the ARG, the latter loses its effect on the water structure.
Values of for all the systems at all temperatures are low but positive except in the case of ARG at 298.15 K and vary irregularly with the increase in temperature. However, values of in the presence of SMV indicated the presence of caging or packing effect32 supporting the earlier contention that the solvent structure is not too much enhanced.
UV–visible analysis
The superimposed UV spectra of pure SMV and SMV–ARG systems are presented in Figure 1. The pure SMV shows three absorption peaks at 230, 238, and 246 nm with the 238 nm being the maximum wavelength (λmax). These observations are in agreement with the literature.33,34 The spectrum representing the SMV–ARG shows two peaks at 241 and 247 nm, with the former being the maximum wavelength. The disappearance of the absorption peak at 230 nm and the bathochromic shifts at 238 and 246 to 241 nm and 247 nm, respectively, indicate the formation of a complex.
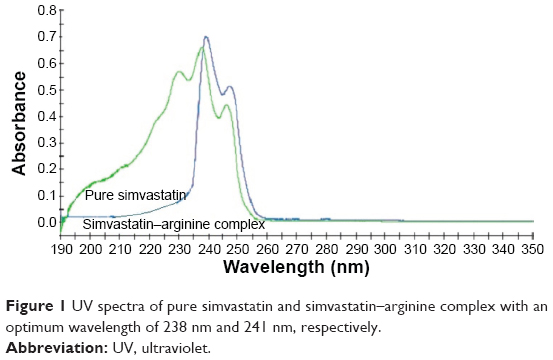 | Figure 1 UV spectra of pure simvastatin and simvastatin–arginine complex with an optimum wavelength of 238 nm and 241 nm, respectively. |
These observations of complexation are also supported by the results of thermophysical analysis that a molecular association predominates in the ternary system consisting of solute–cosolute and the solvent, that is, SMV–ARG–water.
FTIR spectroscopic analysis
The FTIR spectra containing SMV and SMV–ARG systems are shown in Figure 2. The SMV spectrum in ethanol shows the characteristics absorption peaks at 3,399.63 cm−1, 2,997.06 cm−1, 1,638.40 cm−1, and 1,208 cm−1 corresponding to the functional presence of free O–H stretch, C–H asymmetric stretch, ester C=O stretch, and lactone C–O–C stretch, respectively.10,35 The deviation in peak values (ie, 3,550 cm−1, 2,959 cm−1, 1,704 cm−1, and 1,267 cm−1) as compared with SMV spectrum in powder form can be attributed to the solvent effects. However, in the case of SMV–ARG systems, a broad peak is seen at 3,436.41 cm−1, with the disappearance of the peak at 2,977.6 cm−1. These peak alterations can be attributed to the fact that hydrogen bonding and chemical interaction at C–H asymmetric stretch may result in a complex formation. In addition, a new peak appeared at 2,075.05 cm−1, which can be due to a functional group being attributed to ARG. The peak at 1,638.40 cm−1 in the case of SMV appeared at 1,637.89 as a peak with higher intensity indicating its possible involvement. This result indicates that the complex formation is supported by both UV and FTIR analyses of the liquid system.
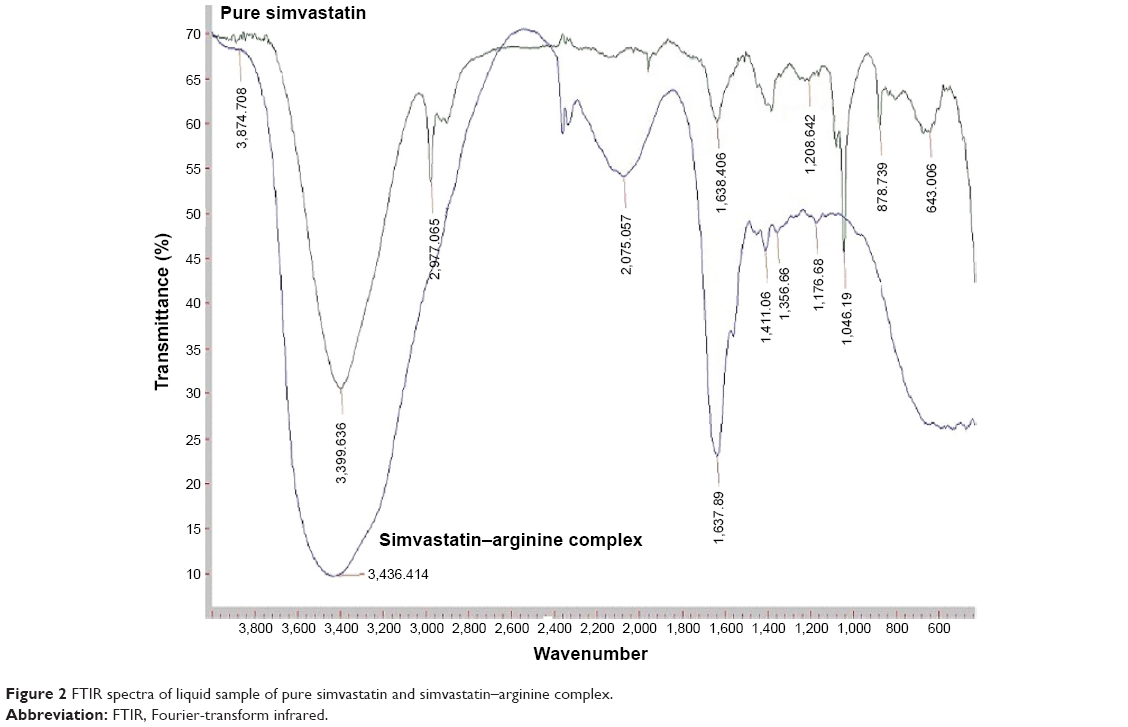 | Figure 2 FTIR spectra of liquid sample of pure simvastatin and simvastatin–arginine complex. |
NMR analysis
The proposed structure of the complexation of ARG and SMV is illustrated in Figure 3. It is clearly shown that ARG molecules bound to the polar part of SMV via hydrogen bonding. Due to this hydrogen bonding between NH of ARG and hydroxyl group of SMV as well as carbonyl group make SMV more polar. The 1H NMR and 2D NOESY (Figures 4 and 5) experiments showed a clear deviation of the respective chemical shifts. The 1H NMR of the complex exhibited the upfield shift of hydroxyl-beared methine proton from δ 4.6 to δ 4.03 and downfield chemical shift of C-5 methylene protons from δ 1.6 to δ 1.8 due to β-substituent chemical shift effect (β-SCS), which clearly showed that hydrogen bonding was established between NH of ARG and SMV C-4 hydroxyl group. Furthermore, this was proven through 2D NOESY interactions. Another possible complexation was also predicted through 1H NMR experiment that the NH part of ARG also formed complexation with the side chain of SMV. As a result of this minor shift of chemical shift, NH of ARG was observed. All the possible 1H NMR chemical shifts are shown in Table 9.
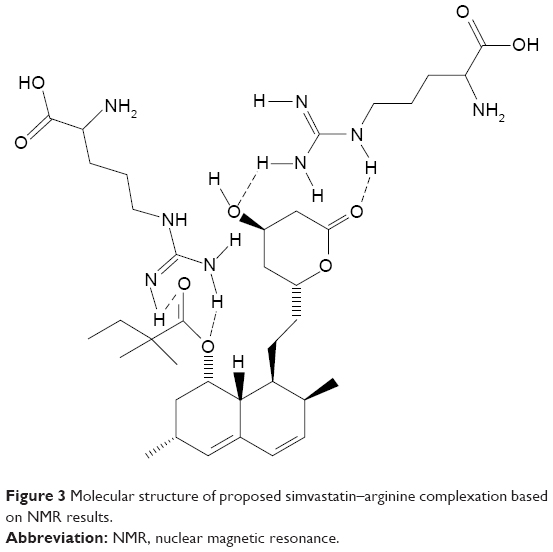 | Figure 3 Molecular structure of proposed simvastatin–arginine complexation based on NMR results. |
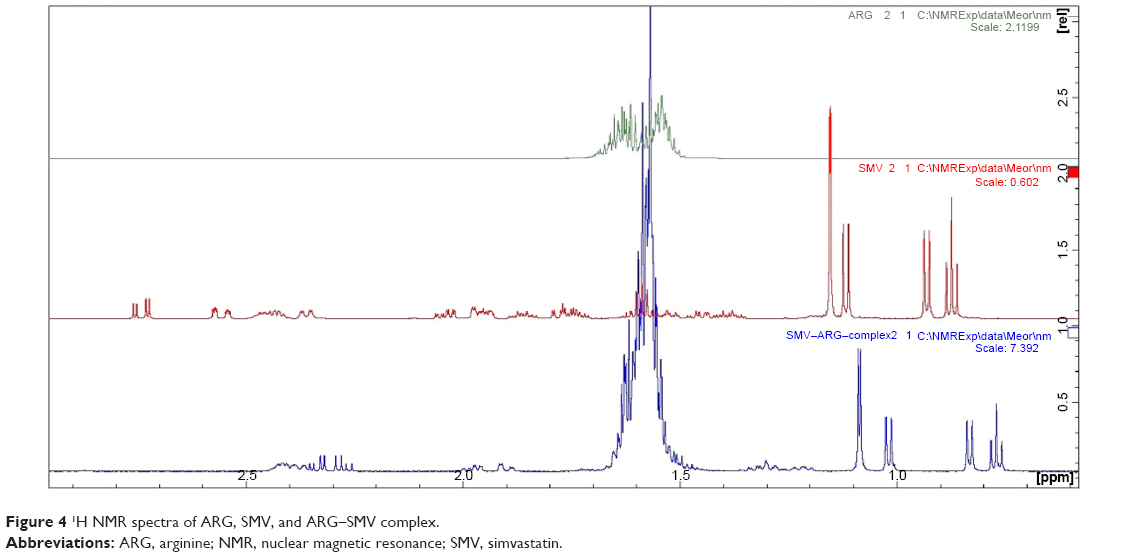 | Figure 4 1H NMR spectra of ARG, SMV, and ARG–SMV complex. |
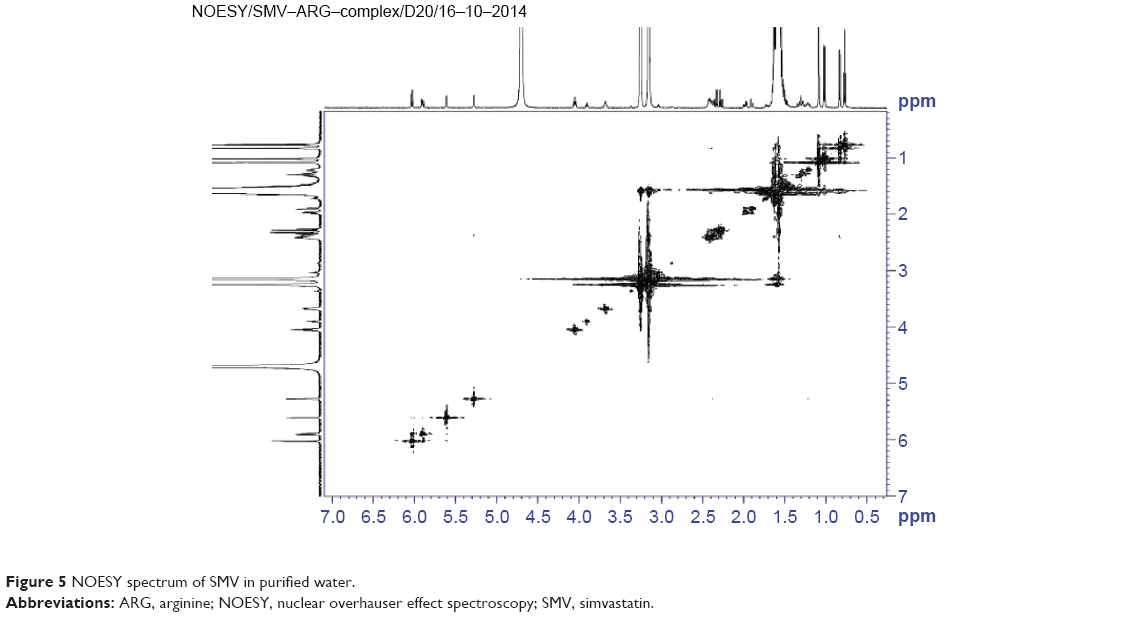 | Figure 5 NOESY spectrum of SMV in purified water. |
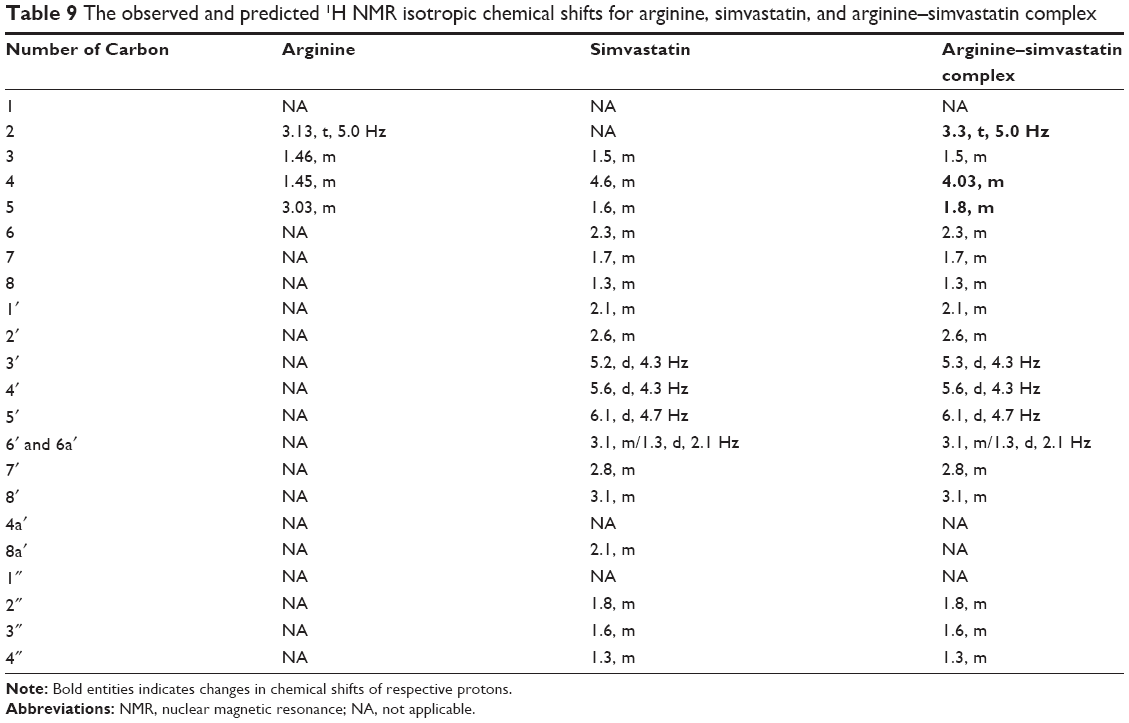 | Table 9 The observed and predicted 1H NMR isotropic chemical shifts for arginine, simvastatin, and arginine–simvastatin complex |
Conclusion
The present study investigated the phase solubility studies and densities and conductivities of several concentrations of SMV–ARG binary solution mixture at various temperatures. The results indicated that there was a massive enhancement of SMV solubility with the presence of ARG as a cosolute. This was in view of the negative values of Gibbs free energy of transfer () which indicated that solution environment became more favorable to enhance the accommodation of SMV in water. Based on volumetric and conductometric parameters, there is enough evidence to conclude that there is a strong solute–solvent and solute–cosolute interaction occurs in the SMV–ARG binary solution mixture. Furthermore, the results by spectral means complemented the thermophysical explanations, which prove that a complexation of ARG and SIM was formed resulting from the strong interaction between both molecules.
Acknowledgments
The authors are thankful to Hovid Berhad for providing SMV powder and the Faculty of Pharmacy (UiTM) for support and cooperation in the completion of this study. This study was supported by Long Term Grant Scheme (600-RMI/LRGS 5/3 (3/2012), Ministry of Higher Education, Government of Malaysia, and Research Excellence Fund (600-RMI/DANA 5/3/REI (3/2013), Research Management Centre (RMC), Universiti Teknologi MARA, Malaysia.
Disclosure
The authors report no conflicts of interest in this work.
References
Kasim N, Whitehouse M, Ramachandran C, et al. Molecular properties of WHO essential drugs and provisional biopharmaceutical classification. Mol Pharm. 2004;1:85–96. | ||
Shitara Y, Sugiyama Y. Pharmacokinetic and pharmacodynamic alterations of 3-hydroxy-3-methylglutaryl coenzyme A (HMG-CoA) reductase inhibitors: drug-drug interactions and interindividual differences in transporter and metabolic enzyme functions. Pharmacol Ther. 2006;112:71–105. | ||
Sacks FM. The relative role of low-density lipoprotein cholesterol and high-density lipoprotein cholesterol in coronary artery disease: evidence from large-scale statin and fibrate trials. Am J Cardiol. 2001;88:14N–18N. | ||
Nováková L, Vlcková H, Satínský D, et al. Ultra high performance liquid chromatography tandem mass spectrometric detection in clinical analysis of simvastatin and atorvastatin. J Chromatogr B Analyt Technol Biomed Life Sci. 2009;877:2093–2103. | ||
Nigori R, Mudigonda K, Kandikere V. Chromatography-mass spectrometry methods for the quantitation of statins in biological samples. J Pharm Biomed Anal. 2007;44:379–387. | ||
Patel M, Tekade A, Gattani S, et al. Solubility enhancement of lovastatin by modified locust bean gum using solid dispersion techniques. AAPS PharmSciTech. 2008;9:1262–1269. | ||
Chavhan S, Joshi G, Petkar K, et al. Enhanced bioavailability and hypolipidemic activity of simvastatin formulations by particle size engineering: physicochemical aspects and in vivo investigations. Biochem Eng J. 2013;79:221–229. | ||
Kulhari H, Pooja D, Prajapati SK, et al. Performance evaluation of PAMAM dendrimer based simvastatin formulations. Int J Pharm. 2011;405:203–209. | ||
Zhang Y, Wang H, Gao C, et al. Highly ordered mesoporous carbon nanomatrix as a new approach to improve the oral absorption of the water-insoluble drug, simvastatin. Eur J Pharm Sci. 2013;49:864–872. | ||
Rao M, Mandage Y, Thanki K, et al. Dissolution improvement of simvastatin by surface solid dispersion technology. Dissolut Technol. 2010;5(13):26–33. | ||
Jatwani S, Rana AC, Singh G, et al. Solubility and dissolution enhancement of simvastatin using synergistic effect of hydrophilic carriers. Der Pharm Lett. 2011;3:280–293. | ||
Javeer SD, Patole R, Amin P. Enhanced solubility and dissolution of simvastatin by HPMC-based solid dispersions prepared by hot melt extrusion and spray-drying method. J Pharm Investig. 2013;43:471–480. | ||
Taupitz T, Dressman JB, Klein S. New formulation approaches to improve solubility and drug release from fixed dose combinations: case examples pioglitazone/glimepiride and ezetimibe/simvastatin. Eur J Pharm Biopharm. 2013;84:208–218. | ||
Csempesz F, Süle A, Puskás I. Induced surface activity of supramolecular cyclodextrin-statin complexes: relevance in drug delivery. Colloids Surf A Physicochem Eng Asp. 2010;354:308–313. | ||
Mandal D, Ojha PK, Nandy BC, et al. Effect of carriers on solid dispersions of simvastatin (Sim): physico-chemical characterizations and dissolution studies. Lettre Der Pharmacia. 2010;2:47–56. | ||
Margulis-Goshen K, Magdassi S. Formation of simvastatin nanoparticles from microemulsion. Nanomedicine. 2009;5:274–281. | ||
Kang BK, Lee JS, Chon SK, et al. Development of self-microemulsifying drug delivery systems (SMEDDS) for oral bioavailability enhancement of simvastatin in beagle dogs. Int J Pharm. 2004;274:65–73. | ||
Mohamed M, Tripathy M, Majeed ABA. Studies on the thermodynamics and solute–solvent interaction of polyvinyl pyrrolidone wrapped single walled carbon nanotubes (PVP-SWNTs) in water over temperature range 298.15-313.15 K. Arabian J Chem. In press 2013. | ||
Arakawaa T, Kitab Y, Koyamac AH. Solubility enhancement of gluten and organic compounds by arginine. Int J Pharm. 2008;35:220–223. | ||
Hirano A, Arakawa T, Shiraki K. Arginine increases the solubility of coumarin: comparison with salting-in and salting-out additives. J Biochem. 2008;144:363–369. | ||
Solanki CS, Mishra P, Talari MK, et al. Conductometric study of nimesulide in aqueous solutions of hydrotropic agents at different temperatures. E J Chem. 2012;9:21–26. | ||
Ambomase SSB, Tripathy S, Tripathy M, et al. Studies on water-polymer interactions in the presence of aceclofenac at 298.15 K. E J Chem. 2011;8:63–70. | ||
Higuchi T, Connors KA. Phase solubility techniques. Adv Anal Chem Instrum. 1965;4:117–122. | ||
Palani R, Kalavathy S. Volumetric compressibility and transport studies on molecular interactions of mono, di and tri saccharides in aqueous sodium butyrate mixtures at 303.15 K. Adv Appl Sci Res. 2011;2:146–155. | ||
MacInnes DA. The conductance of aqueous solutions of electrolytes. J Chem Soc Faraday Trans. 1938;225:661–686. | ||
Tsierkezos NG, Philippopoulos AI. Conductometric and voltammetric studies on the bis(triphenyl phosphine) ruthenium (II) complex, cis-[RuCl2(L) (PPh3)2], where L:2-(2′-pyridyl) quinoxaline. Inorganica Chim Acta. 2009;362:3079–3087. | ||
Singh RD, Rastogi PP, Gopal R. Ion solvent interaction of tetraalkylammonium ions in solvents of high dielectric constant. Part-I. Conductance and walden product of tetra-alkylammonium ions in N-methyl acetamide at different temperatures. Can J Chem. 1968;46:3525–3530. | ||
Dash UN, Patnaik MR. Conductometric study of ion-pair formation in aqueous-solutions of potassium pyrosulfate at different temperatures. Indian J Chem A. 1996;35:836–838. | ||
Shekaaria H, Kazempourb A. Thermodynamic properties of d-glucose in aqueous 1-hexyl-3-methylimidazolium bromide solutions at 298.15 K. Fluid Phase Equilib. 2012;336:122–127. | ||
Coetzee JF, Ritchi D. Solute solvent interactions. In: Schneider H, editor. Solute–Solvent Interaction. New York, NY: Marcel Dekker; 1976:212–222. | ||
Harned HS, Owen BB. The physical chemistry of electrolyte solutions. In: Harned HS, editor. Electrolyte Solution. New York, NY: Reinhold Publishing Corp; 1958:358–376. | ||
Millero FJ. The partial molal volumes of electrolytes in aqueous solution. In: Horne RA, editor. Structure and Transport Processes in Water and Aqueous Solutions. New York, NY: John Wiley and Sons; 2003:519–595. | ||
Wang L, Asgharnejad M. Second-derivative UV spectrometric determination of simvastatin in its tablet dosage form. J Pharm Biomed Anal. 2000;21:1243–1248. | ||
Mane VB, Babar S, Kulkarni N. Development of UV spectrophotometric method for the simultaneous estimation of simvastatin and ezetimibe in tablet dosage form by simultaneous equation and absorbance ration method. Int J PharmTech Res. 2011;3:1459–1466. | ||
Singh H, Philip B, Pathak K. Preparation, characterization and pharmacodynamic evaluation of fused dispersions of simvastatin using PEO-PPO block co polymer. Iran J Pharm Res. 2012;11:443–445. |
 © 2016 The Author(s). This work is published and licensed by Dove Medical Press Limited. The full terms of this license are available at https://www.dovepress.com/terms.php and incorporate the Creative Commons Attribution - Non Commercial (unported, v3.0) License.
By accessing the work you hereby accept the Terms. Non-commercial uses of the work are permitted without any further permission from Dove Medical Press Limited, provided the work is properly attributed. For permission for commercial use of this work, please see paragraphs 4.2 and 5 of our Terms.
© 2016 The Author(s). This work is published and licensed by Dove Medical Press Limited. The full terms of this license are available at https://www.dovepress.com/terms.php and incorporate the Creative Commons Attribution - Non Commercial (unported, v3.0) License.
By accessing the work you hereby accept the Terms. Non-commercial uses of the work are permitted without any further permission from Dove Medical Press Limited, provided the work is properly attributed. For permission for commercial use of this work, please see paragraphs 4.2 and 5 of our Terms.