")
Back to Journals » Clinical Interventions in Aging » Volume 12
Serum uric acid is associated with lumbar spine bone mineral density in healthy Chinese males older than 50 years
Authors Xiao J, Chen WJ, Feng XH, Liu WY, Zhang ZX, He L, Ye ZB
Received 20 December 2016
Accepted for publication 19 January 2017
Published 28 February 2017 Volume 2017:12 Pages 445—452
DOI https://doi.org/10.2147/CIA.S130690
Checked for plagiarism Yes
Review by Single anonymous peer review
Peer reviewer comments 2
Editor who approved publication: Dr Zhi-Ying Wu
Jing Xiao, Weijun Chen, Xinhui Feng, Wenyi Liu, Zhenxing Zhang, Li He, Zhibin Ye
Department of Nephrology, Huadong Hospital Affiliated to Fudan University, Shanghai, People’s Republic of China
Objectives: We aimed to investigate the association of serum uric acid (UA) levels with bone mineral density (BMD) at all skeletal sites in healthy Chinese males >50 years of age.
Methods: A cross-sectional study of 385 Chinese males >50 years of age who underwent health checkup in Huadong Hospital Affiliated to Fudan University in Shanghai, China, was conducted. Clinical and bone characteristics were compared in different UA tertiles (UA1: UA <4.7 mg/dL, UA2: 4.7 mg/dL ≤ UA <6 mg/dL and UA3: UA ≥6 mg/dL). Pearson correlation and multiple regression analysis were used to study the correlation of UA with BMD at various skeletal sites.
Results: Serum UA levels were positively associated with higher BMD and T-values at the lumbar spine, but not at other skeletal sites, after adjusting for multiple confounding factors. Lumbar spine BMD; the T- and Z-values at the lumbar spine, total hip and femoral neck; as well as intact parathyroid hormone (iPTH) levels are higher in the highest tertile of UA than in the second tertile of UA.
Conclusion: Our results provide epidemiological evidence in Chinese Han males aged >50 years that serum UA levels are positively correlated with lumbar spine BMD and T-values, suggesting that UA may exert protective effect on bone density at the lumbar spine in Chinese males >50 years of age.
Keywords: T-value, Z-value, parathyroid hormone, bone turnover marker
Introduction
The impact of osteoporosis increases exponentially along with the aging of the population.1,2 Aging is one of the most important factors affecting bone mineral density (BMD), with certain underlying influential factors.1–3 However, many studies have been mainly focused on women concerning postmenopausal osteoporosis. Although osteoporosis is often described as a disease affecting postmenopausal women, researchers and clinicians have recently recognized its prevalence in men. In the USA, up to 25% of men >50 years of age experience a fracture due to osteoporosis, with approximately 80,000 suffering from a broken hip,4 and the incidence of hip fracture in men is expected to increase by 310% worldwide by 2050.5 According to the Endocrine Society Clinical Practice Guideline published in June 2012, men aged 70 years or older, or those aged 50–69 years with risk factors, such as low body weight, prior fracture as an adult, or smoking, should be screened for osteoporosis using central dual-energy X-ray absorptiometry (DXA).6 It is suggested that for men, age >50 years may be one such vital “turning point” for bone loss and certain influential factors may underlie the condition. Furthermore, it is observed that the BMD at different skeletal sites is differentially regulated during aging. The Fujiwara-kyo Osteoporosis Risk in Men (FORMEN) study showed that the proportion of men with low BMD only at total hip (TH) showed a significant increasing trend of developing osteoporosis with aging, while those with low BMD only at lumbar spine (LS) showed a decreasing trend. The prevalence rate of osteoporosis was underestimated when diagnosed using only BMD at LS.7 However, what factors may differentially regulate BMD at different skeletal sites are currently unclear.
Much evidence indicates that uric acid (UA) might have a physiologic beneficial effect as an antioxidant through its free radical-scavenging capacity.8 Indeed, UA accounts for approximately half of the antioxidant pool in human plasma.9 Therefore, a hypothesis was proposed that moderately elevated levels of plasma UA probably promote fracture healing because of the strong antioxidation.10 Subsequently, researchers have commenced observational and epidemiological studies on the effect of UA in osteoporosis.11–13 In a large population-based study of older men (more than 70 years old, the CHAMP study),12 higher serum UA levels were significantly associated with higher BMD at various skeletal sites and a lower prevalence of osteoporosis, after adjusting for covariates. However, the relationships of UA with BMD at different sites have not been specifically studied. Therefore, in this study, we selected healthy males >50 years old and investigated the association of their serum UA concentrations with BMD and T-values at all skeletal sites, including LS, TH, femoral neck (FN) and whole body (WB), so as to study the relationship of UA with BMD at different sites in Chinese males >50 years old.
Methods
Study participants
A total of 385 (age: 54.76±8.62 years) Chinese males >50 years old who had undergone comprehensive routine health examinations at Huadong Hospital Affiliated to Fudan University (Shanghai, People’s Republic of China) between January 1, 2010, and September 30, 2015, were admitted for analysis in this study. All subjects visited the health examination center spontaneously for routine health examinations consisting of extensive screening tests for the early detection of malignancy, diabetes, osteoporosis and other age-related diseases. Those who had taken drugs that could affect bone metabolism, such as bisphosphonate, systemic glucocorticoids, hormone therapy, or UA-lowering agents such as allopurinol, febuxostat, or benzbromarone, for more than 6 months or within the previous 12 months were excluded from this study. Participants with diseases that might affect bone metabolism, such as cancer, rheumatoid arthritis, gout or urinary stones, in addition to those with any abnormal results on liver, renal, or thyroid function tests were also excluded to avoid discrepancies due to changes in bone metabolism.
Our study was approved by the ethical review board of Huadong Hospital Affiliated to Fudan University and conformed to the ethics guidelines. Written informed consents were obtained from all subjects.
Biochemical measurements
Morning blood samples were obtained after 12 h of fasting and were subsequently analyzed in the laboratory at Huadong Hospital. The estimated glomerular filtration rate (eGFR; milliliters per minute per 1.73 m2), an indicator of renal function, was calculated using the Chronic Kidney Disease Epidemiology Collaboration (CKD-EPI) formula.14 The serum levels of UA, serum creatinine (Scr), alkaline phosphatase (ALP), calcium, phosphorus, high-sensitivity C-reactive protein (hsCRP), total cholesterol (TC), triglycerides (TG), high-density lipoprotein (HDL), low-density lipoprotein (LDL), apolipoprotein A (ApoA), apolipoprotein B (ApoB), lysophosphatidic acid (LPA), hemoglobin A1c (HbA1c), fasting blood glucose (FBG), 2-hour blood glucose (2HBG), fasting C-peptide (FC), 2-hour C-peptide (2HC), fasting insulin (FINS) and 2-hour insulin (2HINS) were measured. Homeostasis model of assessment – insulin resistance (HOMA – IR) was calculated as fasting glucose (mmol/L) × fasting insulin (mU/L)/22.5.
The serum concentrations of intact parathyroid hormone (iPTH), 25-dihydroxyvitamin D3 (25-OHD3) and bone turnover markers (BTMs) were measured by an electrochemical luminescence immunoassay on the automated analyzer Elecsys 2010 (Roche Diagnostics GmbH, Mannheim, Germany). BTMs that were measured in our study included the bone formation markers N-mid-osteocalcin (OC) and procollagen type I amino-terminal propeptide (PINP), as well as the bone resorption marker collagen type 1 cross-linked C-telopeptide (β-CrossLaps or β-CTx), which reflected the level of β C-terminal telopeptide. The intra- and interassay coefficients of variation (CVs) for iPTH, 25-OHD3, OC, PINP and β-CTx were 3.4%–5.8% and 4.3%–7.1%, 1.7%–7.5% and 2.2%–13.6%, 1.2%–4.0% and 1.7%–6.5%, 1.2%–3.0% and 1.7%–4.1% as well as 1.0%–4.6% and 1.6%–4.7%, respectively.
BMD and fat mass measurement
Body weight and body height were measured while the participants had their shoes off. Body mass index (BMI) was calculated as weight (kilograms) divided by height squared (meter squared). Regional BMD, including LS (L1–4), left FN, TH and WB BMD, as well as total, abdomen and hip fat masses, were measured using DXA (Delphi A; Hologic Inc, Bedford, MA, USA). To minimize interobserver variation, all scans and analyses were conducted by the same investigator. The day-to-day CVs of these observations were 0.86% in the LS BMD, 1.86% in the FN BMD, 1% in the TH BMD and 0.95% in the WB BMD. The densitometer was standardized by a standard phantom prior to each measurement.
Statistical analysis
Continuous clinical variables are reported in means ± standard deviation (SD). The clinical variables, BMD as well as the T-and Z-scores, of the participants in each of the three UA tertiles (UA1: UA <4.7 mg/dL, UA2: 4.7 mg/dL ≤ UA <6 mg/dL and UA3: UA ≥6 mg/dL) were compared using analysis of variance (ANOVA). We used least significance difference (LSD) test if the variance was homogeneous and used Tamhane’s T2 test if not. Pearson correlation analysis was used to find the factors associated with BMD values. Multiple linear regression analysis was then performed to determine the associations of serum UA levels with BMD levels and bone markers, after adjusting for potential confounders. Statistical significance for all analyses was set at P<0.05. Statistical analysis was performed with software SPSS 19.0.
Results
Clinical and bone characteristics in different UA tertiles
The main clinical variables are shown in Table 1. To rule out the effect of UA on bone health, we first studied the effect of UA on both the clinical parameters and fat mass. The participants were divided into three UA tertiles. UA, Scr, eGFR, BMI, TG, ApoB, HbA1c, FC, 2HC, 2HINS and abdominal fat mass were significantly different in the three UA tertiles (P<0.05).
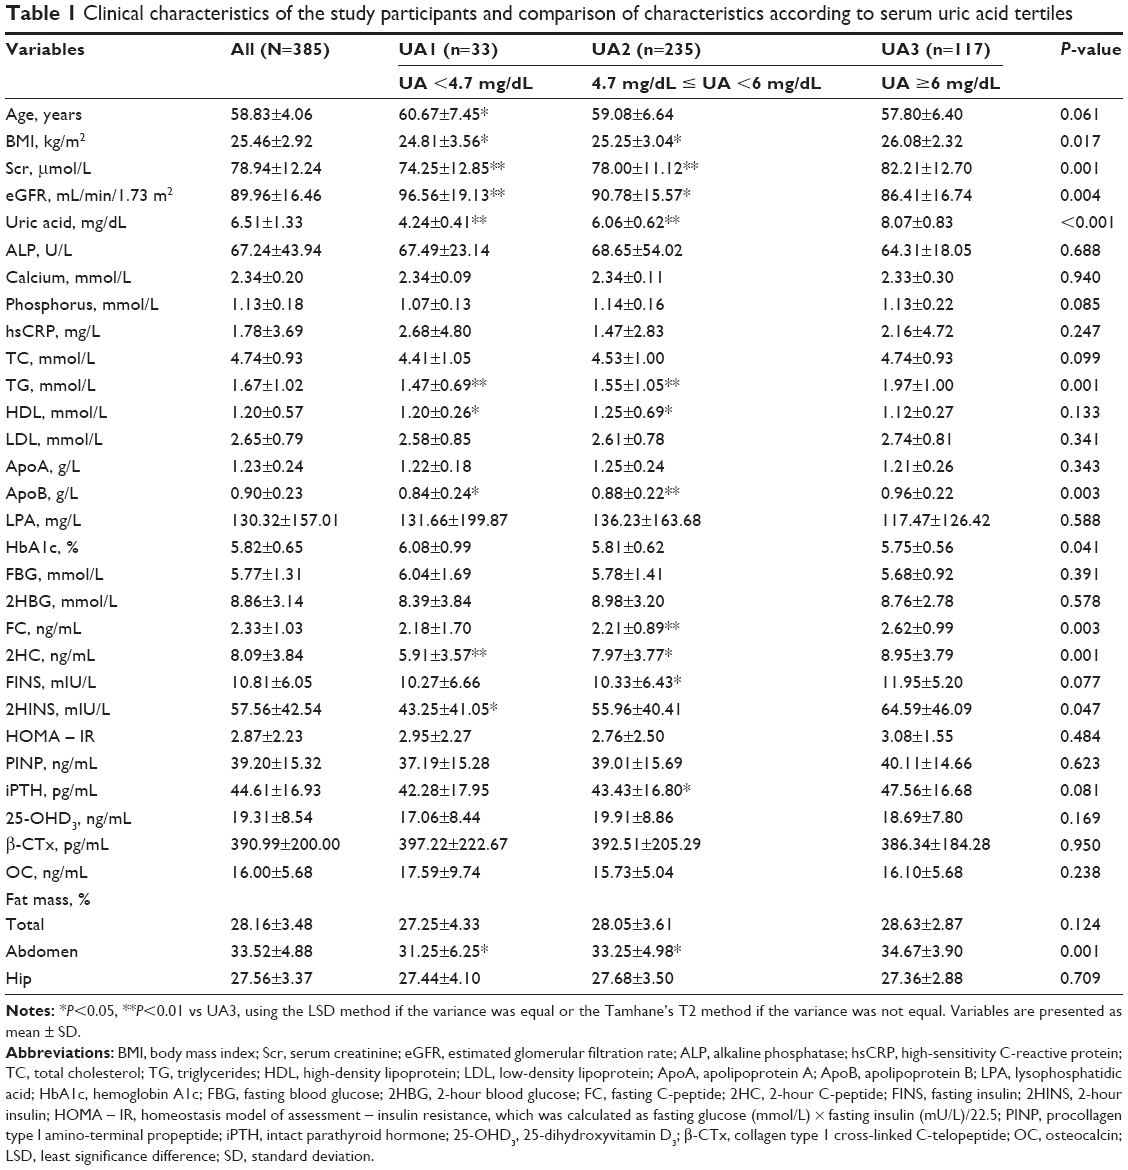 | Table 1 Clinical characteristics of the study participants and comparison of characteristics according to serum uric acid tertiles |
Relationship between the serum UA levels and BMD
Pearson correlation analysis showed that UA was positively associated with BMI (r=0.170, P=0.001), TC (r=0.109, P=0.034), TG (r=0.214, P<0.001), ApoB (r=0.162, P=0.002), FC (r=0.193, P<0.001), 2HC (r=0.179, P=0.001), FINS (r=0.117, P=0.032), 2HINS (r=0.118, P=0.033), iPTH (r=0.168, P=0.001), total fat mass (r=0.128, P=0.016) and abdominal fat mass (r=0.193, P<0.001). UA was negatively associated with age (r=−0.153, P=0.003) and eGFR (r=−0.166, P=0.001). These factors were recognized as confounding factors for UA on bone health.
UA was positively associated with BMD at LS (r=0.123, P=0.019) and FN (r=0.114, P=0.030); T-values at LS (r=0.134, P=0.012), TH (r=0.110, P=0.037) and FN (r=0.145, P=0.006); Z-values at the TH (r=0.129, P=0.026) and FN (r=0.135, P=0.020), by Pearson’s correlation analysis before adjusting for the confounding factors. After adjusting for confounding factors in the three models (model 1 adjusted for BMI; model 2 adjusted for BMI plus eGFR; model 3 adjusted for BMI, eGFR plus TC, TG, ApoB, HbA1c, FC, 2HC, FINS, 2HINS, iPTH, age and abdominal fat mass), the association of UA with LS BMD and LS T-values were still statistically significant, while the correlations of UA with BMD and T-values at other sites disappeared (P<0.05; Table 2).
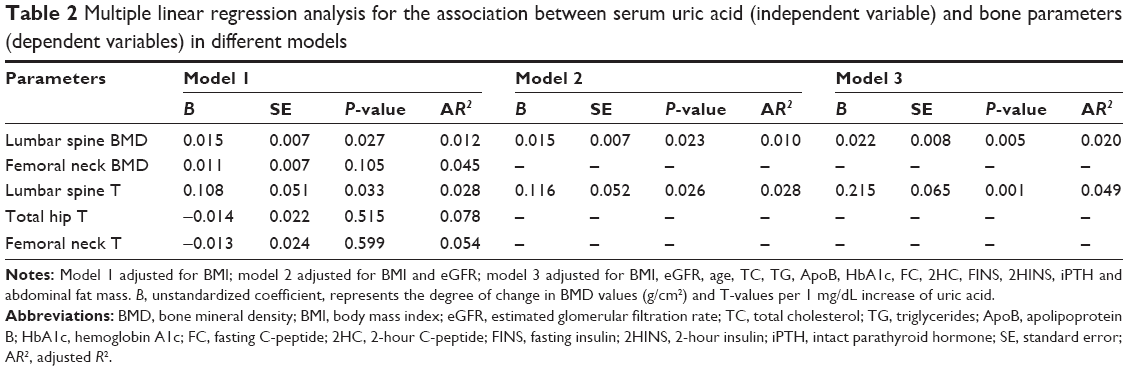 | Table 2 Multiple linear regression analysis for the association between serum uric acid (independent variable) and bone parameters (dependent variables) in different models |
BMD, T-values and Z-values in different UA tertiles
In order to compare the differences in BMD, T- and Z-values at different UA levels, participants were divided into three UA tertiles (UA1: UA <4.7 mg/dL; UA2: 4.7 mg/dL ≤ UA <6 mg/dL; UA3: UA ≥6 mg/dL). ANOVA analysis showed that participants in the highest UA tertiles had significantly higher LS BMD (Figure 1) compared with those in the second tertile (P=0.013). T-scores (Figure 2) and Z-scores (Figure 3) at LS, TH and FN of the participants in the highest UA tertile were also significantly higher than those in the second UA tertile (all P<0.05).
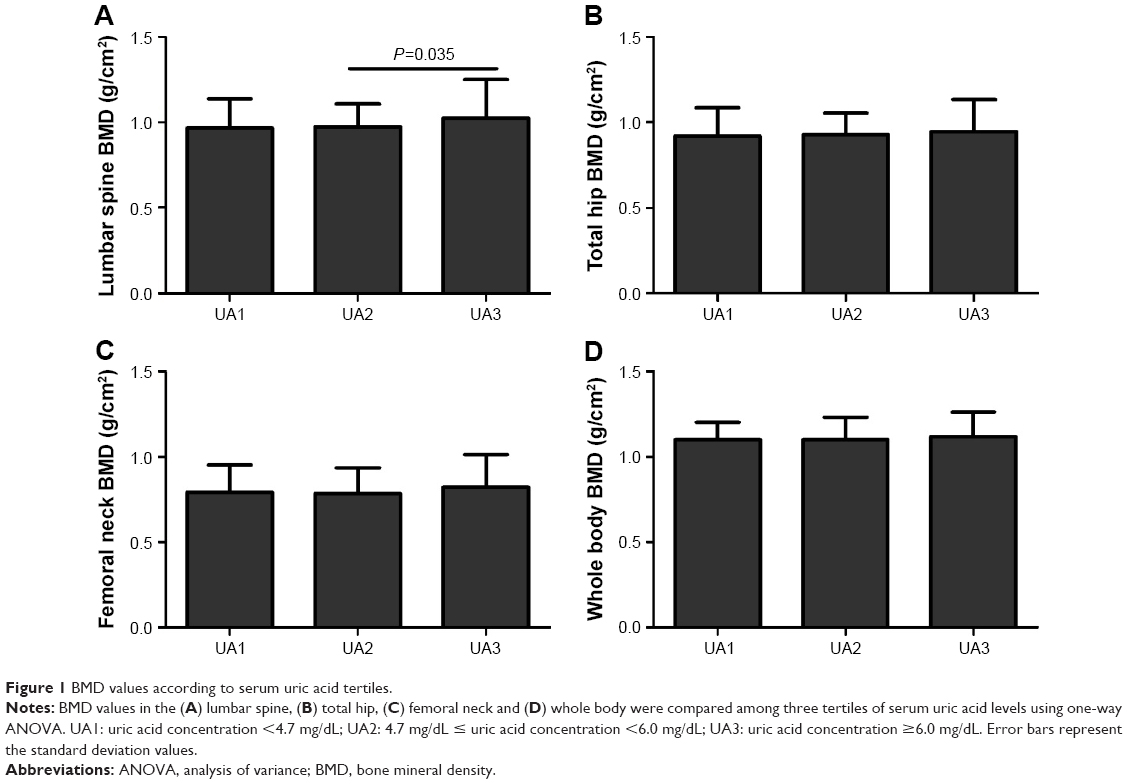 | Figure 1 BMD values according to serum uric acid tertiles. |
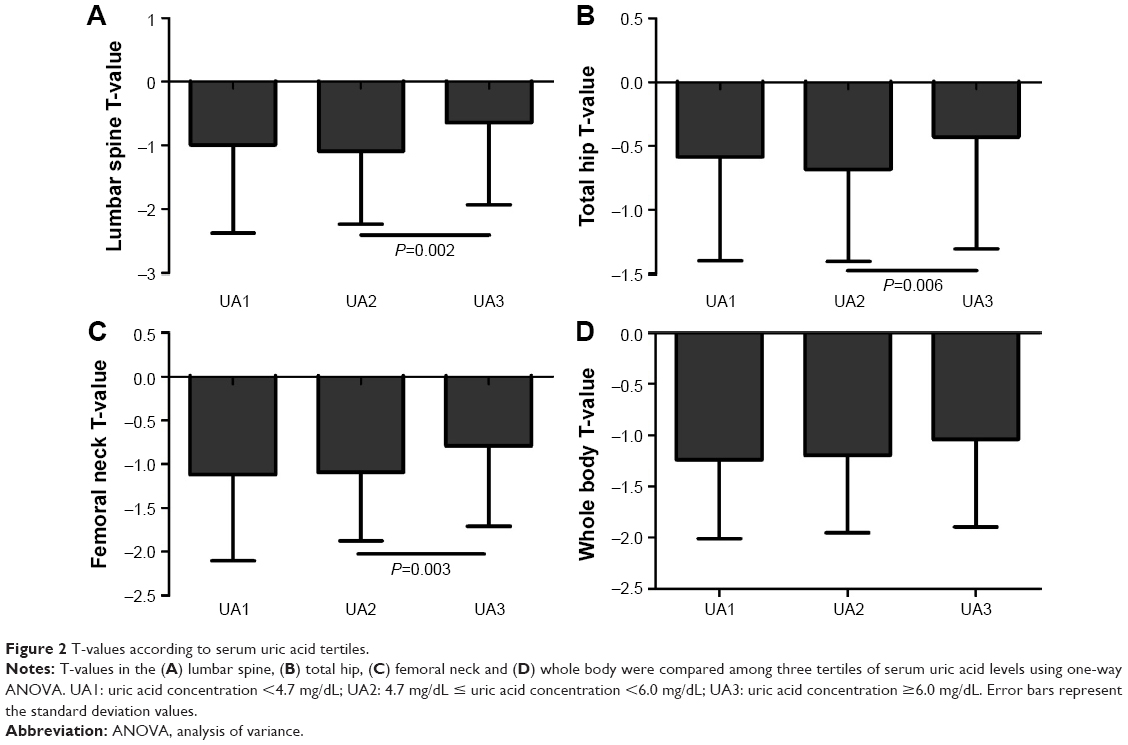 | Figure 2 T-values according to serum uric acid tertiles. |
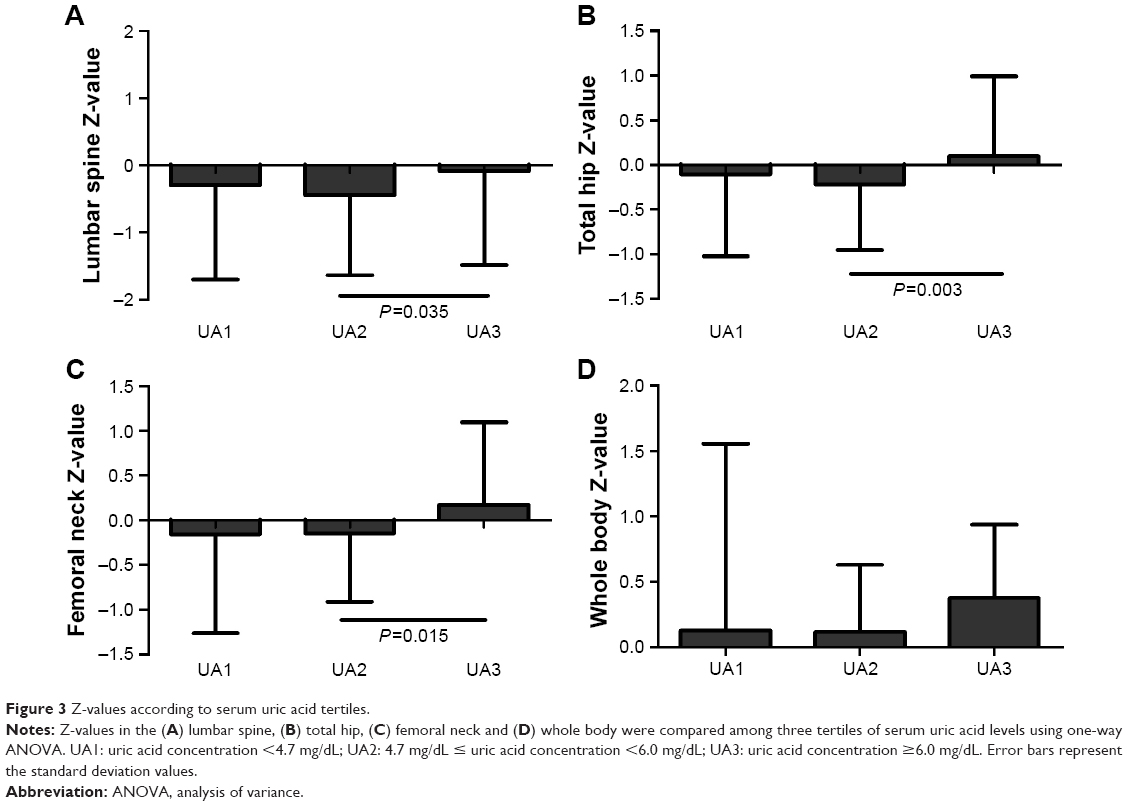 | Figure 3 Z-values according to serum uric acid tertiles. |
Relationship between the serum UA concentrations and bone biochemical markers
Serum UA concentrations were positively associated with iPTH (r=0.168, P=0.001) by Pearson’s correlation analysis. Multiple linear regression analyses showed that the serum UA concentrations were independently associated with serum iPTH after adjusting for confounding factors (Table 3). Intact PTH levels according to serum UA concentrations are presented in Figure 4. Serum iPTH was significantly higher in the highest tertile than in the second UA tertile (Figure 4; P=0.036).
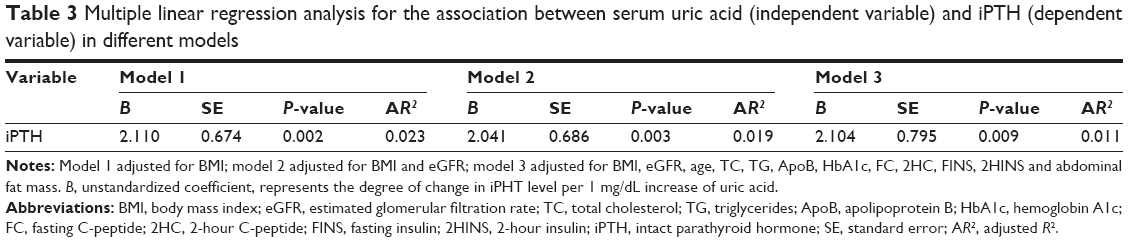 | Table 3 Multiple linear regression analysis for the association between serum uric acid (independent variable) and iPTH (dependent variable) in different models |
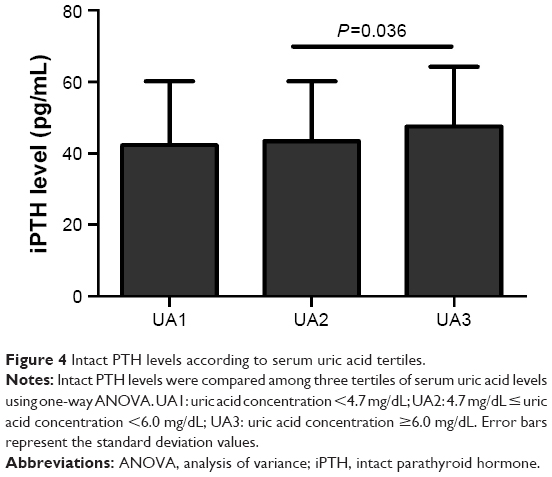 | Figure 4 Intact PTH levels according to serum uric acid tertiles. |
Discussion
In this study of 385 Chinese males >50 years old, we found that UA is positively associated with LS BMD and T-values by Pearson correlation and by multiple linear regressions after adjusting for confounding factors. T- and Z-values at LS, TH and FN were higher in the highest UA tertile than in the second UA tertile. However, no association of UA with BMD and T-values at FN or TH was found, suggesting that UA has better protective effect on BMD at LS than at other sites.
Till date, the effects of UA on different sites have not been extensively compared. Many studies12,15–17 noticed a protective effect of UA on BMD at all sites, or only at LS. In 2011, Nabipour et al12 first reported that high serum UA concentrations were associated with high BMD values at all sites, including LS, TH, FN and WB, in a population-based cohort of 1,705 older men (aged ≥70 years). A recent study on 868 men older than 50 years showed that the BMD at LS, FN and TH was significantly higher in men with higher serum UA levels.15 In Chinese males with diabetes mellitus (54.14±11.49 years), higher serum UA was positively associated with higher BMD at all sites.16 However, a retrospective analysis in 253 Chinese osteoporosis patients (65.9±10.3 years) receiving initial treatment showed that serum UA was positively correlated with LS BMD, but not FN or TH BMD.17 Some studies failed to find a protective effect of UA on bone health. Data from 6,759 National Health and Nutrition Examination Survey (NHANES; 2005–2010) participants >30 years of age found that in unadjusted analyses, higher serum UA levels were associated with higher BMD. However, these associations were no longer statistically significant after adjusting for potential confounders. When an elderly subgroup (age ≥65 years) was studied, the results were the same.18 It is suggested that the heterogeneity between different studies among these results might be explained by the variations in population characteristics (eg, ethnicity, gender, age, etc), study design, study size and covariates adjusted for.19 However, in our study, when we used the same method to study the relationship of UA with BMD at different sites, we still found different relationships, suggesting that different skeletal sites should also be taken into account when considering UA’s effect on BMD.
The mechanism of the differential effect of UA on BMD at different sites has not been previously studied. Some researchers have found an association of elevated serum UA with a higher BMD and greater muscle mass in a middle-aged and elderly Chinese population and it is suggested that the UA–BMD association was partly mediated by muscle mass.19 The Framingham Osteoporosis Study20 also found that higher amounts of visceral adipose tissue (VAT) are associated with greater BMD and better microstructure of the peripheral skeleton. These associations were also no longer significant after adjustment for BMI or weight, suggesting that the effects of VAT on the skeleton may not be substantial and may be independent of BMI or weight.20 We have also found positive association of UA with total fat mass and abdominal fat mass in our study, but these correlations disappeared after adjusting for confounding factors for UA. Therefore, it is less likely, at least in our cohort, that UA may act on different sites through local fat or lean mass ratios.
Mechanical load has recently been shown to play a role in bone turnover. It is possible that LS is under the influence of the mechanical load and the local ratio of osteoclasts to osteoblasts is thus regulated by the mechanical load, while other sites are less likely to be influenced by the mechanical load.21 We have also measured the BTMs and studied the relationship of UA with the BTMs. However, except the iPTH levels, other serum BTMs were neither significantly associated with UA nor different among the UA tertiles in our study. It is possible that the levels of the local BTMs and the local ratio of osteoclasts to osteoblasts may differ at different skeletal sites. Further studies are needed to measure the mechanical load and examine the local osteoclast to osteoblast ratios of different sites.
There are several noteworthy strengths in our study. Most importantly, we selected a cohort of Chinese males >50 years old, in order to specifically study the effect of UA on bone metabolism in this group of people who bear a great risk of bone loss. Secondly, we intentionally applied strict exclusion criteria based on medical histories and routine laboratory findings and made careful adjustments for possible confounders to appropriately investigate the pure physiologic effects of UA on bone metabolism. In addition, we noticed the different effects of UA on different skeletal sites in the Chinese cohort, UA’s effect on different skeletal sites individually.
There are, however, some limitations to this study. First, because this was a cross-sectional study, we could not determine the causal relationship that exists between serum UA levels and osteoporosis-related disorders. Second, our study population consisted of participants who visited the health checkup center; thus, this may not be representative of the general population, possibly resulting in a selection bias. Third, as this is only a cross-sectional and health checkup study, we do not have fracture information of the participants, which limits the application of the protective effect of UA in fracture.
Conclusion
This study demonstrates that in Chinese males aged ≥50 years, serum UA levels were positively correlated with BMD and T-values at the LS after adjusting for multiple confounders. No association of UA with BMD and T-values at other sites was found. LS BMD, T-values and Z-values at the LS, TH and FN were significantly higher in the highest UA tertile than in the second UA tertile. UA was also significantly associated with iPTH levels. Our findings suggest that UA may play a protective role on LS bone health in aging men. More work is needed to determine the mechanisms of the different effects of UA on bone density at different sites.
Acknowledgment
This manuscript is not under consideration for publication elsewhere in a similar form, in any language.
Disclosure
The authors report no conflicts of interest in this work.
References
O’Neill S, MacLennan A, Bass S, et al; Osteoporosis Australia Medical Scientific Committee. Guidelines for the management of postmenopausal osteoporosis for GPs. Aust Fam Physician. 2004;33(11):910–919. | ||
Grzibovskis M, Pilmane M, Urtane I. Today’s understanding about bone aging. Stomatologija. 2010;12(4):99–104. | ||
Cui R, Zhou L, Li Z, Li Q, Qi Z, Zhang J. Assessment risk of osteoporosis in Chinese people: relationship among body mass index, serum lipid profiles, blood glucose, and bone mineral density. Clin Interv Aging. 2016;11:887–895. | ||
National Osteoporsis Foundation. America’s Bone Health: The State of Osteoporosis and Low Bone Mass in Our Nation. Washington, DC: National Osteoporsis Foundation; 2002. | ||
Gullberg B, Johnell O, Kanis JA. World-wide projections for hip fracture. Osteoporos Int. 1997;7(5):407–413. | ||
Watts NB, Adler RA, Bilezikian JP, et al; Endocrine Society. Osteoporosis in men: an Endocrine Society clinical practice guideline. J Clin Endocrinol Metab. 2012;97(6):1802–1822. | ||
Iki M, Fujita Y, Tamaki J, et al. Design and baseline characteristics of a prospective cohort study for determinants of osteoporotic fracture in community-dwelling elderly Japanese men: the Fujiwara-kyo osteoporosis risk in men (FORMEN) study. BMC Musculoskelet Disord. 2009;10:165. | ||
Sautin YY, Johnson RJ. Uric acid: the oxidant-antioxidant paradox. Nucleosides Nucleotides Nucleic Acids. 2008;27(6):608–619. | ||
Masseoud D, Rott K, Liu-Bryan R, Agudelo C. Overview of hyperuricaemia and gout. Curr Pharm Des. 2005;11(32):4117–4124. | ||
Donghui MM. Moderate levels of plasma uric acid could promote fracture healing. Med Hypotheses. 2010;75(6):682. | ||
Makovey J, Macara M, Chen JS, et al. Serum uric acid plays a protective role for bone loss in peri- and postmenopausal women: a longitudinal study. Bone. 2013;52(1):400–406. | ||
Nabipour I, Sambrook PN, Blyth FM, et al. Serum uric acid is associated with bone health in older men: a cross-sectional population-based study. J Bone Miner Res. 2011;26(5):955–964. | ||
Ahn SH, Lee SH, Kim BJ, et al. Higher serum uric acid is associated with higher bone mass, lower bone turnover, and lower prevalence of vertebral fracture in healthy postmenopausal women. Osteoporos Int. 2013;24(12):2961–2970. | ||
Delanaye P, Mariat C. The applicability of eGFR equations to different populations. Nat Rev Nephrol. 2013;9(9):513–522. | ||
Hernandez JL, Nan D, Martinez J, et al. Serum uric acid is associated with quantitative ultrasound parameters in men: data from the Camargo cohort. Osteoporos Int. 2015;26(7):1989–1995. | ||
Zhao DD, Jiao PL, Yu JJ, et al. Higher serum uric acid is associated with higher bone mineral density in Chinese men with type 2 diabetes mellitus. Int J Endocrinol. 2016;2016:2528956. | ||
Chen L, Peng Y, Fang F, Chen J, Pan L, You L. Correlation of serum uric acid with bone mineral density and fragility fracture in patients with primary osteoporosis: a single-center retrospective study of 253 cases. Int J Clin Exp Med. 2015;8(4):6291–6294. | ||
Zhang D, Bobulescu IA, Maalouf NM, et al. Relationship between serum uric acid and bone mineral density in the general population and in rats with experimental hyperuricemia. J Bone Miner Res. 2015;30(6):992–999. | ||
Dong XW, Tian HY, He J, Wang C, Qiu R, Chen YM. Elevated serum uric acid is associated with greater bone mineral density and skeletal muscle mass in middle-aged and older adults. PLoS One. 2016;11(5):e0154692. | ||
Liu CT, Broe KE, Zhou Y, et al. Visceral adipose tissue is associated with bone microarchitecture in the Framingham Osteoporosis Study. J Bone Miner Res. 2017;32(1):143–150. | ||
Goldring SR. The osteocyte: key player in regulating bone turnover. RMD Open. 2015;1(suppl 1):e000049. |
 © 2017 The Author(s). This work is published and licensed by Dove Medical Press Limited. The full terms of this license are available at https://www.dovepress.com/terms.php and incorporate the Creative Commons Attribution - Non Commercial (unported, v3.0) License.
By accessing the work you hereby accept the Terms. Non-commercial uses of the work are permitted without any further permission from Dove Medical Press Limited, provided the work is properly attributed. For permission for commercial use of this work, please see paragraphs 4.2 and 5 of our Terms.
© 2017 The Author(s). This work is published and licensed by Dove Medical Press Limited. The full terms of this license are available at https://www.dovepress.com/terms.php and incorporate the Creative Commons Attribution - Non Commercial (unported, v3.0) License.
By accessing the work you hereby accept the Terms. Non-commercial uses of the work are permitted without any further permission from Dove Medical Press Limited, provided the work is properly attributed. For permission for commercial use of this work, please see paragraphs 4.2 and 5 of our Terms.