")
Back to Journals » International Journal of Nanomedicine » Volume 14
SERS-based differential diagnosis between multiple solid malignancies: breast, colorectal, lung, ovarian and oral cancer
Authors Moisoiu V, Stefancu A, Gulei D, Boitor R, Magdo L, Raduly L , Pasca S, Kubelac P , Mehterov N, Chiș V , Simon M , Muresan M, Irimie AI, Baciut M, Stiufiuc R , Pavel IE , Achimas-Cadariu P, Ionescu C, Lazar V, Sarafian V , Notingher I, Leopold N , Berindan-Neagoe I
Received 18 December 2018
Accepted for publication 16 April 2019
Published 2 August 2019 Volume 2019:14 Pages 6165—6178
DOI https://doi.org/10.2147/IJN.S198684
Checked for plagiarism Yes
Review by Single anonymous peer review
Peer reviewer comments 4
Editor who approved publication: Prof. Dr. Anderson Oliveira Lobo
Vlad Moisoiu,1,2,* Andrei Stefancu,1,3,* Diana Gulei,3,* Radu Boitor,4 Lorand Magdo,2,5 Lajos Raduly,5,6 Sergiu Pasca,2 Paul Kubelac,2,7 Nikolay Mehterov,8,9 Vasile Chiș,1 Marioara Simon,10 Mihai Muresan,2,11–12 Alexandra Iulia Irimie,13 Mihaela Baciut,14 Rares Stiufiuc,3,15 Ioana E Pavel,3,16 Patriciu Achimas-Cadariu,17,18 Calin Ionescu,2,11 Vladimir Lazar,19 Victoria Sarafian,8,9 Ioan Notingher,4 Nicolae Leopold,1,3 Ioana Berindan-Neagoe3,5,20
1Faculty of Physics, Babeș-Bolyai University, Cluj-Napoca, Romania; 2Faculty of Medicine, Iuliu Hatieganu University of Medicine and Pharmacy, Cluj-Napoca, Romania; 3MedFuture - Research Center for Advanced Medicine, Iuliu Hatieganu University of Medicine and Pharmacy, Cluj-Napoca, Romania; 4School of Physics and Astronomy, University of Nottingham, Nottingham, UK; 5Research Center for Functional Genomics, Biomedicine and Translational Medicine, Iuliu Hatieganu University of Medicine and Pharmacy, Cluj-Napoca, Romania; 6Department of Pathophysiology, University of Agricultural Sciences and Veterinary Medicine, Cluj-Napoca, Romania; 7Department of Medical Oncology, Prof. Dr. Ion Chiricuta Clinical Cancer Center, Cluj-Napoca, Romania; 8Department of Medical Biology, Faculty of Medicine, Medical University-Plovdiv, Plovdiv, Bulgaria; 9Technological Center for Emergency Medicine, Plovdiv, Bulgaria; 10Department of Bronchology, Leon Daniello Pneumophysiology Clinical Hospital, Cluj-Napoca, Romania; 115th Surgical Department, Cluj-Napoca Municipal Hospital, Cluj-Napoca, Romania; 12Department of Surgical and Gynecological Oncology, Prof. Dr. Ion Chiricuta Clinical Cancer Center, Cluj-Napoca, Romania; 13Department of Prosthetic Dentistry and Dental Materials, Division Dental Propaedeutics, Aesthetics, Faculty of Dentistry, Iuliu Hatieganu University of Medicine and Pharmacy, Cluj-Napoca, Romania; 14Department of Cranio-Maxillofacial Surgery and Dental Emergencies, Iuliu Hatieganu University of Medicine and Pharmacy, Cluj-Napoca, Romania; 15Department of Pharmaceutical Physics-Biophysics, Faculty of Pharmacy, Iuliu Hatieganu University of Medicine and Pharmacy, Cluj-Napoca, Romania; 16Department of Chemistry, Wright State University, Dayton, OH, USA; 17Department of Surgery, Iuliu Hatieganu University of Medicine and Pharmacy, Cluj-Napoca, Romania; 18Department of Surgical Oncology, Prof. Dr. Ion Chiricuta Clinical Cancer Center, Cluj-Napoca, Romania; 19Worldwide Innovative Network for Personalized Cancer Therapy, Villejuif, France; 20Department of Functional Genomics and Experimental Pathology, Prof. Dr. Ion Chiricuta Clinical Cancer Center, Cluj-Napoca, Romania
*These authors contributed equally to this work
Purpose: Surface-enhanced Raman scattering (SERS) spectroscopy on serum and other biofluids for cancer diagnosis represents an emerging field, which has shown promising preliminary results in several types of malignancies. The purpose of this study was to demonstrate that SERS spectroscopy on serum can be employed for the differential diagnosis between five of the leading malignancies, ie, breast, colorectal, lung, ovarian and oral cancer.
Patients and methods: Serum samples were acquired from healthy volunteers (n=39) and from patients diagnosed with breast (n=42), colorectal (n=109), lung (n=33), oral (n=17), and ovarian cancer (n=13), comprising n=253 samples in total. SERS spectra were acquired using a 532 nm laser line as excitation source, while the SERS substrates were represented by Ag nanoparticles synthesized by reduction with hydroxylamine. The classification accuracy yielded by SERS was assessed by principal component analysis–linear discriminant analysis (PCA-LDA).
Results: The sensitivity and specificity in discriminating between cancer patients and controls was 98% and 91%, respectively. Cancer samples were correctly assigned to their corresponding cancer types with an accuracy of 88% for oral cancer, 86% for colorectal cancer, 80% for ovarian cancer, 76% for breast cancer and 59% for lung cancer.
Conclusion: SERS on serum represents a promising strategy of diagnosing cancer which can discriminate between cancer patients and controls, as well as between cancer types such as breast, colorectal, lung ovarian and oral cancer.
Keywords: surface-enhanced Raman scattering, SERS, serum, principal component analysis-linear discriminant analysis, solid malignancies
Introduction
Late diagnosis caused by the limited accuracy of existing cancer screening tools and/or their invasive character has an important contribution to cancer morbidity and mortality.1 For instance, the 5-year survival rate for breast cancer drops from approximately 100% for stage I to around 22% for stage IV.2 Thus, the continuous evolution of the malignant environment, leading to local and/or distant invasion as well as to multidrug resistance, renders advanced forms of cancer surgically unresectable and unresponsive to chemo and radiotherapy.3 The advent of serum biomarkers such as prostate-specific antigen (PSA)4 has improved early cancer detection, but their low accuracy limits their use for screening in the general population. Invasive screening tools such as colonoscopy or mammography are more accurate than serum biomarkers; nonetheless, there are surprisingly few methods of screening that are accurate enough for being recommended in the general population. Among these five cancer types, the US Preventive Services Task Force (USPSTF) recommends cancer screening in average-risk, asymptomatic adults, only for colorectal and breast cancer.5,6 As for lung, ovarian and oral cancer, the USPSTF concludes that the harms of screening in the general population outbalance any likely benefits or that the current evidence is insufficient to assess the balance.7–9 Other genomic,10 metabolomic,11 or proteomic12 markers have also been assessed with various results, but none of them has yet been translated in the clinical setting. Therefore, novel noninvasive methods of cancer screening are needed.
Raman spectroscopy detects the inelastic scattering of monochromatic light, resulting in frequency-shifted photons that provide molecular information about the sample.13,14 Surface-enhanced Raman scattering (SERS) is a method of amplifying the Raman signal using nano-scaled metal substrates such as silver or gold colloids, which are among the most convenient substrates for SERS.13,15,16 The mechanism behind SERS is thought to involve not only the excitation of localized surface plasmons,17 but also the formation of charge-transfer complexes,18 although there is ongoing debate regarding the role of each of these mechanism in the SERS amplification process.19,20
Several reports have shown that spontaneous Raman or SERS analysis of liquid or dried blood serum/plasma can efficiently discriminate between control and several types of cancer such as breast,21–23 lung,24 ovarian,25 colorectal,26–28 or head and neck cancer.29 In spite of that, the results of these preliminary studies cannot be compared directly, because of significant differences in the experimental setup employed for acquiring the SERS spectra of serum. Moreover, there is a paucity of studies performing comparative analysis between cancer types.30
In this study, the classification accuracy of SERS is demonstrated on a set of n=253 total serum samples collected from healthy volunteers and patients with breast, lung, colorectal, oral and ovarian cancer, with the aim of attaining a SERS-based differential diagnosis between cancer types.
Materials and methods
Fresh blood samples were acquired from healthy volunteers (n=39) and from patients diagnosed with breast (n=42), colorectal (n=109), lung (n=33), oral (n=17), and ovarian cancer (n=13). All cancer patients were treatment naïve and were included in the study irrespective of their cancer stage. The controls were represented by male and female blood donors of similar age with the patients, that did not report any significant health issue at the time of enrolment. The individual characteristics of the controls and patients included in this study are presented in Tables S1–S6. Blood samples were drawn into serum separator tubes and then centrifuged at 2,000 rpm (425 g) for 5 mins to isolate serum. The serum was subsequently stored at −80 °C until further analysis. All patients provided written informed consent for enrolling in this study. The study was approved by the Ethics Committee of the Ion Chiricuta Clinical Cancer Center Cluj-Napoca and the experiments were conducted in accordance with the Declaration of Helsinki.
Silver nanoparticles were synthesized using the hydroxylamine hydrochloride reduction method (hya-AgNPs).31 All reagent were supplied by Sigma-Aldrich. The fresh colloid was left overnight at room temperature before measurements. The nanoparticles were characterized by UV-Vis absorption spectroscopy (Jasco V-630 Spectrometer) and transmission electron microscopy (JEOL, JEM-100CX, operating at 100 kV).
In order to remove the proteins present in the serum, 200 µL of serum was mixed with 1.8 mL of methanol. The samples were then centrifuged at 2,000 rpm (425 g) for 5 mins and the supernatant was carefully collected. Then, 1 µL of the supernatant was mixed with 9 µL of silver colloid and 1 µL of NaCl 2M. A 5 µL droplet was then deposited on an aluminum substrate in order to acquire the SERS spectra from the droplet, before it dried. To prevent the contamination of samples, we employed sterile PCR-grade dual filter tips for handling the samples.
SERS spectra were acquired using an InVia Reflex Raman Spectrometer (Renishaw) equipped with a 532 nm laser (10 mW on the sample), a RenCam CCD detector, an upright Leica microscope and a diffraction grating with 1,800 lines mm−1. Prior to each measurement series, a calibration procedure was performed based on the 520 cm−1 band of an internal silicon standard. The spectra were acquired by focusing the laser through a 5X objective (Leica, NA=0.12) for 40 s. For each randomly chosen sample, two spectra were acquired and averaged.
Principal component analysis-linear discriminant analysis (PCA-LDA) was performed using custom-built MATLAB scripts (MathWorks). Prior to PCA-LDA, cosmic ray peaks were eliminated from the SERS spectra. All spectra were acquired under similar conditions and therefore, further spectral processing was deemed unnecessary. For the purpose of this study, several separate PCA-LDA models were built (see below).
In order to replicate previous studies, five independent PCA-LDA models were built, and each model was trained to discriminate between control samples and a particular type of cancer (one for each cancer type). Next, another PCA-LDA model was built to discriminate between controls and all cancer samples combined, that is, without taking into account the type of malignancy each cancer sample represented. Finally, a PCA-LDA model was built which also included the cancer type.
In order to avoid overfitting caused by resubstitution validation, a 5-fold per patient cross validation was performed. Therefore, spectra collected from 80% of the patients of each control-cancer type (or types) subset were used to train the classification model, while spectra from the remaining samples were employed for validation. The 5-fold split was performed 3 times to reduce the impact of interpatient variation.
PCA-LDA confusion matrices expressed in percentages were plotted and were used to calculate the sensitivity, specificity, positive and negative predictive values as well as the overall accuracy of each model. Scores from subsets of principal component loadings were selected for each cancer type so that the sensitivities and specificities for predicting on the validation sets were similar to the ones of the resubstitution analysis.
Results
The SERS spectra of deproteinized serum, acquired using the 532 nm laser presented several intense bands at 636, 727, 810, 887, 1.008, 1.135, 1.150, 1.201, 1.361, 1.446, 1.518, and 1.677 cm−1 (Figure 1), assigned in good agreement with the literature to nucleic acid catabolites such as uric acid and hypoxanthine, carotenoids and amino acids.32–35 These bands were also present in the difference spectra. Figure S1 shows a representative transmission electron microscopy image and the UV-Vis absorbance spectrum of the hya-AgNPs. A comparison between the average SERS spectrum of control samples and breast, colorectal, lung, ovarian and oral cancer is presented in Figures S2–S6, respectively.
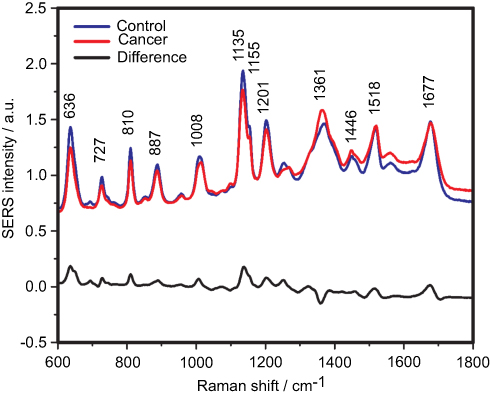 |
Figure 1 The mean surface-enhanced Raman scattering (SERS) spectra of serum from controls and breast, colorectal, lung, ovarian and oral cancer samples (all types combined) and their spectral difference. All SERS spectra were mean normalized and for each spectrum, two measurements were averaged. |
The resulting confusion matrixes of individual PCA-LDA models for each cancer type is presented in Figure 2. The overall accuracy of the PCA-LDA model for breast (n=42), colorectal (n=109), lung (n=33), ovarian (n=13) and oral cancer (n=17) was approximately 94%, 78%, 86%, 95% and 93%, respectively. Overall accuracy is defined as the percentage of correctly assigned samples out of the total number of samples considered in that particular PCA-LDA model.
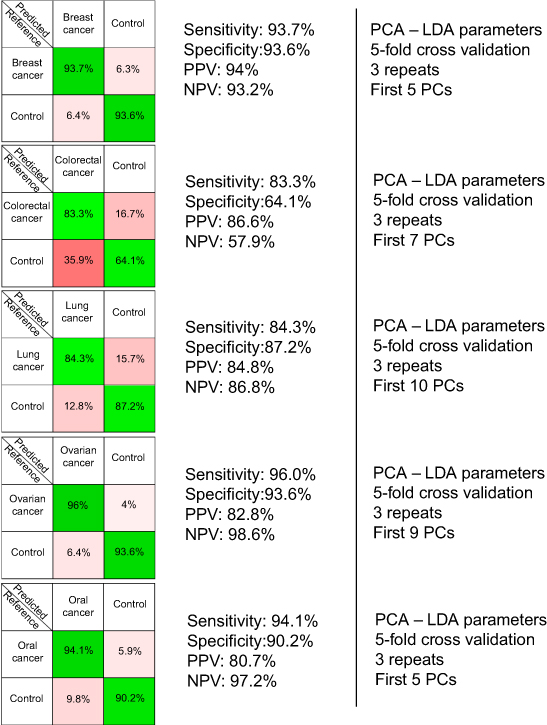 |
Figure 2 The results provided by the five principal component analysis–linear discriminant analysis (PCA-LDA) models, which compared control samples versus breast, colorectal, lung, ovarian and oral cancer samples. PPV denotes the positive predictive value, while NPV refers to the negative predictive value. The number of principal components (PCs) was chosen such that the sensitivities and specificities for predicting on the validation sets were similar to the ones of the resubstitution analysis. |
The results of the PCA-LDA model aiming to discriminate between controls and all cancer samples combined are presented in Figure 3. The overall accuracy of the model was around 94%.
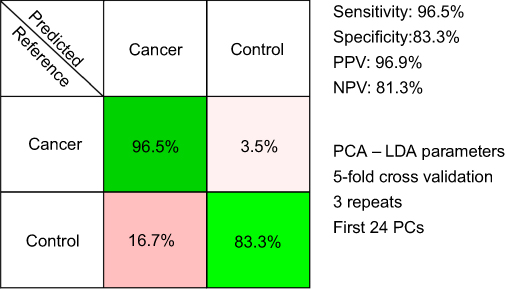 |
Figure 3 The results of the principal component analysis–linear discriminant analysis (PCA-LDA) for all cancer types combined (breast, colorectal, lung, ovarian and oral cancer). PPV denotes the positive predictive value, while NPV refers to the negative predictive value. The number of principal components (PCs) was chosen such that the sensitivities and specificities for predicting on the validation sets were similar to the ones of the resubstitution analysis. |
In order to test the possibility of attaining a differential diagnosis between cancer types based on SERS, a PCA-LDA model that splits the cancer group into individual cancer-types was built. The resulting multi-dimensional confusion matrix is presented in Figure 4.
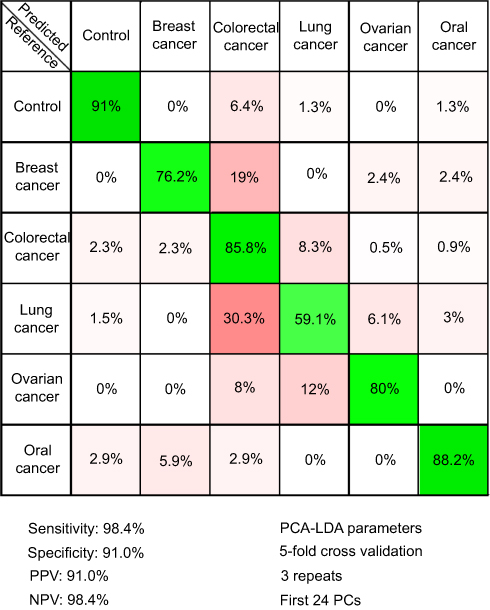 |
Figure 4 The results of the principal component analysis–linear discriminant analysis (PCA-LDA) that assessed the differential diagnosis between controls and breast, colorectal, lung, ovarian and oral cancer. PPV denotes the positive predictive value, while NPV refers to the negative predictive value. The number of principal components (PCs) was chosen such that the sensitivities and specificities for predicting on the validation sets were similar to the ones of the resubstitution analysis. The figures of merit represent the accuracy to distinguish between control samples and all types of cancer combined. |
Discussion
In this study, we included n=253 serum samples from controls and five of the leading types of cancer (ie, breast, colorectal, lung, ovarian and oral cancer). In order to remove serum proteins that prevent the acquisition of SERS spectra from serum metabolites, we employed methanol extraction. Thus, the metabolites were extracted using methanol, mixed with hya-AgNPs and then a droplet from this mixture was analyzed using a 532 nm laser line as excitation source. The methanol extraction has several advantages compared to other methods of acquiring SERS spectra from serum metabolites such as protein filtering or acquiring SERS spectra from dried samples. In the case of protein filtering, the shortcoming is that serum carotenoids, which are a broad class of metabolites differentially expressed in cancer patients,36 are also filtered out along with proteins, leading to SERS spectra less rich in information.23
Alternatively, SERS spectra of serum metabolites can also be acquired by drying the serum and nanoparticle mixture.30 In this case however, the disadvantage is that one must average over the entire spot surface for reproducible results, whereas when acquiring the signal from a droplet, there is an automatic averaging of the SERS signal over the sample due to the thermal motion of the molecules in the focal point of the laser.
Compared to the 633 nm or 785 nm laser lines employed in previous SERS studies, the 532 nm laser employed in this study has the advantage that it meets (pre)resonant conditions with serum carotenoids, leading to a strong amplification of the SERS signal from this class of molecules. Thus, when processing the serum samples by protein precipitation, the use of the 532 nm laser leads to the amplification of the carotenoid-associated bands at 1135 cm−1 and 1518 cm−1 (Figure 1).35 On the other hand, employing the 532 nm laser is also known to amplify the SERS signal from contaminants, leading to “rhodamine-like” SERS bands. In order to prevent the contamination of samples and the presence of rhodamine-like bands in the SERS spectra of serum, we successfully employed sterile dual filter tips when preparing the samples.37
The SERS spectra acquired from both cancer patients and healthy volunteers presented several intense bands at 636, 727, 810, 887, 1.008, 1.135, 1.150, 1.201, 1.361, 1.446, 1.518, and 1.677 cm−1 (Figure 1), which were assigned in good agreement with the literature to nucleic acid catabolites such as uric acid and hypoxanthine, carotenoids and amino acids.32–34 The carotenoids-associated SERS bands at 1135 cm−1 and 1518 cm−1 are absent when using filtered serum or laser lines with longer wavelengths as excitation source (eg, the 633 nm or 785 nm laser).35
The positive and negative peaks in the difference SERS spectrum between the cancer and the control groups suggest that cancer samples differ from control samples in a complex manner, with some of the metabolites being enriched in the cancer group and others in the control group. For instance, the carotenoid-associated band at 1135 cm−1 was more intense in the control subjects than in the case of the cancer patients (Figures 1 and S2–S6), in line with previous studies describing lower blood carotenoid levels in patients with breast, colorectal, lung, ovarian and oral cancer.38–42 In regard to the other bands in the spectrum besides the bands attributed to carotenoids, it was harder to clearly delineate trends that are associated with each cancer type. Thus, the results show that the SERS spectra of serum have a complex pattern that prevents the identification of bands that have characteristic lower/higher intensity for each cancer type. Therefore, the analysis of the SERS spectral differences between cancer types and controls requires machine learning techniques, which can be trained to recognize the spectral features associated with each cancer type.
In order to test the efficacy of the SERS-based method in discriminating between each cancer type and the corresponding controls, five independent PCA-LDA models were built (one for each cancer type) (Figure 2). The figures of merit corresponding to the PCA-LDA models are the following: the overall accuracy for the breast, ovarian, and oral cancer was around 94%, 95% and 93% respectively, while the overall accuracy was comparatively lower for lung and colorectal cancer (86% and 78%, respectively). In case of the colorectal cancer, the relatively lower overall accuracy (78%) was a consequence of control samples being misclassified as colorectal cancer samples (specificity 64%). Overall accuracy, which gives a global perspective regarding the classification power of the model for each group, was calculated from the confusion matrices expressed in terms of absolute number of samples (data not shown) as the percentage of correctly assigned samples out of the total number of samples. These results confirm previous studies aiming to discriminate between cancer patients and controls based on the SERS spectra of serum.
The number of PCs used as input for the PCA-LDA was chosen based on the similarity in the classification accuracy between the training set (80% of the samples) and the validation set (20% of the samples).
Next, another PCA-LDA model was built, one that sought to discriminate between controls and all cancer samples combined, that is, without taking into account the type of malignancy that each cancer sample corresponded to. The confusion matrix of the PCA-LDA model is depicted in Figure 3, and it corresponds to an overall accuracy of 94%. Thus, SERS spectra of serum allowed efficient classification of samples even when the samples came from multiple types of solid malignancies.
Next, a PCA-LDA model was constructed to include the type of cancer to which each sample corresponded to, with the aim of attaining a differential diagnosis between different cancer types (Figure 4). The highest accuracy was obtained for the control group (91%), while the accuracy of assigning cancer samples to the corresponding cancer types ranged between 88% for oral cancer to 59% for lung cancer.
Therefore, even when considering specific cancer types, the control samples can be accurately discriminated from cancer samples (specificity and sensitivity above 90%). Regarding the accuracy of distinguishing between cancer types, the classification accuracy is more variable. Thus, although all cancer types are known to display a multitude of differentially expressed serum metabolites,43–47 our study suggests that the differential expression of the metabolites responsible for the SERS signal is more robust in some cancer types (ie, breast, ovarian, and oral cancer) than in others (ie, colorectal and lung cancer). Nonetheless, these results suggest that SERS can be used for the differential diagnosis between cancer types, thus extending previous observations regarding SERS-based cancer screening on individual cancer types.
Compared to other cancer markers that represent specific proteins, nucleic acids or metabolites,10–12 SERS-based screening provides a global characterization of the molecular structure of the samples. In particular, SERS can simultaneously assess the levels of the carotenoids and the status of the purinosome, a performance which cannot be achieved using other detection methods. Moreover, the miniaturization of the Raman spectroscopes and the fast turnaround time of the method allows the easy implementation of SERS in the point-of-care setting.48 Moreover, SERS-based screening can easily be scaled up for populational studies.35 Given the possibility to achieve a differential diagnosis between cancer types, SERS could also guide the management of patients with cancer of unknown primary site, for which metastatic lesions are apparent but no founding tumor can be identified.49
In the future, one might envision the use of SERS spectroscopy as a point-of-care cancer screening tool, which could be employed either alone, or in combination with cancer-type specific serum biomarkers.50–52 However, the clinical translation of SERS-based cancer screening will have to surpass several issues, including improving the reproducibility of the method and attaining prospective validation in randomized clinical trials. International cooperation groups such as Raman4Clinics37 or The International Society for Clinical Spectroscopy (CLIRSPEC)53 hold promise that such a process is feasible in a not too distant future.
Acknowledgments
This work was supported by the Competitiveness Operational Program 2014-2020 POC-A1-A1.1.4-E-2015, financed under the European Regional Development Fund, project No. P_37_765 and P 37_796. This work was also supported from the research grant No. 193/2014; PN-II-PT-PCCA-2013-4-1959 “Non-invasive intelligent systems for colorectal cancer diagnosis and prognosis based on circulating microRNAs integrated in the clinical workflow – INTELCOR”, financed by The Ministry of Research and Innovation, Romania, POC grant No. 35/01.09.2016, ID 37_796, entitled “Clinical and economical impact of personalized targeted anti-microRNA therapies in reconverting lung cancer chemoresistance – CANTEMIR”, financed by The Ministry of Research and Innovation, Romania, project PNCDI III 2015-2020 “Increasing the performance of scientific research and technology transfer in translational medicine through the formation of a new generation of young researchers” – ECHITAS, No. 29PFE/18.10. 2018, Sectoral Operational Program for Increasing the Economic Competitiveness (POSCCE), grant No. 709/2010, financed by The Ministry of Research and Innovation, Romania, project No. 164/2017, entitled “Addressing the complex exposome profile in hormone-dependent cancers of the breast and prostate and its influence on tumoral genome”, financed by The Ministry of Research and Innovation, Romania, project “MicroRNAs biomarkers of response to chemotherapy and overall survival in colon cancer” financed by Terry Fox Foundation, Canada, project PN-II-PT-PCCA-2011-3.1-1221: “Intelligent Systems for Recurrence and Progression Prediction in Superficial Bladder Cancer Based on Artificial Intelligence and Microarray Data: Tumor mRNA and Plasma microRNA-IntelUro”, financed by The Ministry of Research and Innovation, Romania, project PN-III-P1-1.2-PCCDI-2017-0737, contract No. 35PCCDI/2018 – “Genomic mapping of population from polluted area with radioactivity and heavy metals to increase national security”, financed by The Ministry of Research and Innovation, Romania, PhD project 3066/29/01.02.2018 – “Mutational spectrum of ovarian cancer and its implications in treatment resistance to platinum based agents”, financed by Iuliu Hatieganu University of Medicine and Pharmacy, Project No. BG05M2OP001-2.009-0025, “Doctoral training at MU-Plovdiv for Competence, Creativity, Originality, Realization and Academism in Science and Technology - 2 (DOCTORANT - 2)”, funded under the Operational Programme “Science and Education for Smart Growth”, co-funded by the Structural and Investment Funds of the EU and Project HO-18/2014, funded by the Medical University of Plovdiv. Vlad Moisoiu and Andrei Stefancu acknowledges support from the College for Advanced Performance Studies, Babeș-Bolyai University, Cluj-Napoca, Romania.
Disclosure
The authors report no conflicts of interest in this work.
References
1. WHO. Guide to cancer early diagnosis; 2017. Available from: http://www.who.int/cancer/publications/cancer_early_diagnosis/en/,
2. Howlader N, Noone AM, Krapcho M, et al. SEER cancer statistics review. 1975–2014; 2018. Available from: https://seer.cancer.gov/csr/1975_2014/. Accessed June 27, 2019.
3. Robinson DR, Wu YM, Lonigro RJ, et al. Integrative clinical genomics of metastatic cancer. Nature. 2017;548(7667):297–303. doi:10.1038/nature23004
4. Andriole GL, Crawford ED, Grubb RL
5. Keating NL, Pace LE. Breast cancer screening in 2018: Time for shared decision making. JAMA. 2018;319(17):1814–1815.
6. US Preventive Services Task Force, Bibbins-Domingo K, Grossman DC, et al. Screening for colorectal cancer: US Preventive Services Task Force recommendation statement.JAMA. 2016;315(23):2564–2575.
7. Moyer VA, US Preventive Services Task Force. Screening for lung cancer: U.S. Preventive Services Task Force recommendation statement. Ann Intern Med. 2014;160(5):330–338.
8. US Preventive Services Task Force, Grossman DC, Curry SJ, et al. Screening for ovarian cancer: US Preventive Services Task Force recommendation statement. JAMA. 2018;319(6):588-594.
9. Moyer VA, US Preventive Services Task Force. Screening for oral cancer: U.S. Preventive Services Task Force recommendation statement. Ann Intern Med. 2014;160(1):55–60.
10. Phallen J, Sausen M, Adleff V, et al. Direct detection of early-stage cancers using circulating tumor DNA. Sci Transl Med. 2017;9:403. doi:10.1126/scitranslmed.aan2415
11. Spratlin JL, Serkova NJ, Eckhardt SG. Clinical applications of metabolomics in oncology: a review. Clin Cancer Res. 2009;15(2):431–440. doi:10.1158/1078-0432.CCR-08-1059
12. Fuzery AK, Levin J, Chan MM, Chan DW. Translation of proteomic biomarkers into FDA approved cancer diagnostics: issues and challenges. Clin Proteomics. 2013;10(1):13. doi:10.1186/1559-0275-10-17
13. Zong C, Xu M, Xu L-J, et al. Surface-enhanced raman spectroscopy for bioanalysis: reliability and challenges. Chem Rev. 2018;118(10):4946–4980. doi:10.1021/acs.chemrev.7b00668
14. Jafarzadeh N, Mani-Varnosfaderani A, Gilany K, Eynali S, Ghaznavi H, Shakeri-Zadeh A. The molecular cues for the biological effects of ionizing radiation dose and post-irradiation time on human breast cancer SKBR3 cell line: A Raman spectroscopy study. J Photochem Photobiol B. 2018;180:1–8. doi:10.1016/j.jphotobiol.2018.01.014
15. Sha MY, Xu H, Penn SG, Cromer R. SERS nanoparticles: a new optical detection modality for cancer diagnosis. Nanomedicine (Lond). 2007;2(5):725–734. doi:10.2217/17435889.2.5.725
16. Zhang Y, Hong H, Myklejord DV, Cai W. Molecular imaging with SERS-active nanoparticles. Small. 2011;7(23):3261–3269. doi:10.1002/smll.201100597
17. Hossain MK, Kitahama Y, Huang GG, Han X, Ozaki Y. Surface-enhanced Raman scattering: realization of localized surface plasmon resonance using unique substrates and methods. Anal Bioanal Chem. 2009;394(7):1747–1760. doi:10.1007/s00216-009-2762-4
18. Birke RL, Lombardi JR, Saidi WA, Norman P. Surface-enhanced Raman scattering due to charge-transfer resonances: a time-dependent density functional theory study of Ag13-4-mercaptopyridine. J Phys Chem C. 2016;120(37):20721–20735. doi:10.1021/acs.jpcc.6b01961
19. Wan F, Shi H, Chen W, et al. Charge transfer effect on raman and surface enhanced raman spectroscopy of furfural molecules. Nanomaterials. 2017;7(8):210. doi:10.3390/nano7120458
20. Campion A, Ivanecky JE, Child CM, Foster M. On the mechanism of chemical enhancement in surface-enhanced Raman scattering. J Am Chem Soc. 1995;117(47):11807–11808. doi:10.1021/ja00152a024
21. Bilal M, Bilal M, Tabassum S, et al. Optical screening of female breast cancer from whole blood using raman spectroscopy. Appl Spectrosc. 2017;71(5):1004–1013. doi:10.1177/0003702816667516
22. Bhattacharjee T, Khan A, Kumar P, Ingle A, Maru G, Krishna CM. Raman spectroscopy of serum: A study on ‘pre’ and ‘post’ breast adenocarcinoma resection in rat models. J Biophotonics. 2015;8(7):575–583. doi:10.1002/jbio.201400040
23. Cervo S, Mansutti E, Del Mistro G, et al. SERS analysis of serum for detection of early and locally advanced breast cancer. Anal Bioanal Chem. 2015;407(24):7503–7509. doi:10.1007/s00216-015-8923-8
24. Wang H, Zhang S, Wan L, Sun H, Tan J, Su Q. Screening and staging for non-small cell lung cancer by serum laser Raman spectroscopy. Spectrochim Acta A Mol Biomol Spectrosc. 2018;201:34–38. doi:10.1016/j.saa.2018.04.002
25. Ullah I, Ahmad I, Nisar H, et al. Computer assisted optical screening of human ovarian cancer using Raman spectroscopy. Photodiagnosis Photodyn Ther. 2016;15:94–99. doi:10.1016/j.pdpdt.2016.05.011
26. Lin D, Huang H, Qiu S, Feng S, Chen G, Chen R. Diagnostic potential of polarized surface enhanced Raman spectroscopy technology for colorectal cancer detection. Opt Express. 2016;24(3):2222–2234. doi:10.1364/OE.24.002222
27. Feng S, Wang W, Tai IT, Chen G, Chen R, Zeng H. Label-free surface-enhanced Raman spectroscopy for detection of colorectal cancer and precursor lesions using blood plasma. Biomed Opt Express. 2015;6(9):3494–3502. doi:10.1364/BOE.6.003494
28. Jenkins CA, Lewis PD, Dunstan PR, Harris DA. Role of Raman spectroscopy and surface enhanced Raman spectroscopy in colorectal cancer. World J Gastrointest Oncol. 2016;8(5):427–438. doi:10.4251/wjgo.v8.i5.427
29. Sahu A, Sawant S, Mamgain H, Krishna CM. Raman spectroscopy of serum: an exploratory study for detection of oral cancers. Analyst. 2013;138(14):4161–4174. doi:10.1039/c3an00308f
30. Xiao R, Zhang X, Rong Z, et al. Non-invasive detection of hepatocellular carcinoma serum metabolic profile through surface-enhanced Raman spectroscopy. Nanomedicine. 2016;12(8):2475–2484. doi:10.1016/j.nano.2016.07.014
31. Leopold N, Lendl B. A New Method for Fast Preparation of Highly Surface-Enhanced Raman Scattering (SERS) Active Silver Colloids at Room Temperature by Reduction of Silver Nitrate with Hydroxylamine Hydrochloride. J Phys Chem B. 2003;107(24):5723–5727.
32. Bonifacio A, Dalla Marta S, Spizzo R, et al. Surface-enhanced Raman spectroscopy of blood plasma and serum using Ag and Au nanoparticles: a systematic study. Anal Bioanal Chem. 2014;406(9–10):2355–2365. doi:10.1007/s00216-014-7622-1
33. Westley C, Xu Y, Thilaganathan B, Carnell AJ, Turner NJ, Goodacre R. Absolute quantification of uric acid in human urine using surface enhanced Raman scattering with the standard addition method. Anal Chem. 2017;89(4):2472–2477.
34. Westley C, Xu Y, Carnell AJ, Turner NJ, Goodacre R. Label-free surface enhanced Raman scattering approach for high-throughput screening of biocatalysts. Anal Chem. 2016;88(11):5898–5903. doi:10.1021/acs.analchem.6b00813
35. Jenkins CA, Jenkins RA, Pryse MM, et al. A high-throughput serum Raman spectroscopy platform and methodology for colorectal cancer diagnostics. Analyst. 2018;143(24):6014–6024. doi:10.1039/c8an01323c
36. Smith TA. Carotenoids and cancer: prevention and potential therapy. Br J Biomed Sci. 1998;55(4):268–275.
37. Bonifacio A, Cervo S, Sergo V. Label-free surface-enhanced Raman spectroscopy of biofluids: fundamental aspects and diagnostic applications. Anal Bioanal Chem. 2015;407(27):8265–8277. doi:10.1007/s00216-015-8697-z
38. Toniolo P, Van Kappel AL, Akhmedkhanov A, et al. Serum carotenoids and breast cancer. Am J Epidemiol. 2001;153(12):1142–1147. doi:10.1093/aje/153.12.1142
39. Huang J, Lu MS, Fang YJ, et al. Serum carotenoids and colorectal cancer risk: A case-control study in Guangdong, China. Mol Nutr Food Res. 2017;61:10. doi:10.1002/mnfr.201700267
40. Abar L, Vieira AR, Aune D, et al. Blood concentrations of carotenoids and retinol and lung cancer risk: an update of the WCRF-AICR systematic review of published prospective studies. Cancer Med. 2016;5(8):2069–2083. doi:10.1002/cam4.676
41. Chippagiri P, Im A, Banavar SR. Role of serum ß-carotene in the diagnosis and prevention of oral squamous cell carcinoma - a case control study. J Clin Diagn Res. 2014;8(4):ZC01–ZC03. doi:10.7860/JCDR/2014/7534.4211
42. Jeong NH, Song ES, Lee JM, et al. Plasma carotenoids, retinol and tocopherol levels and the risk of ovarian cancer. Acta Obstet Gynecol Scand. 2009;88(4):457–462. doi:10.1080/00016340902807215
43. McCartney A, Vignoli A, Biganzoli L, et al. Metabolomics in breast cancer: a decade in review. Cancer Treat Rev. 2018;67:88–96. doi:10.1016/j.ctrv.2018.04.012
44. Erben V, Bhardwaj M, Schrotz-King P, Brenner H. Metabolomics biomarkers for detection of colorectal neoplasms: a systematic review. Cancers. 2018;10(8):246. doi:10.3390/cancers10110400
45. Yu L, Li K, Zhang X. Next-generation metabolomics in lung cancer diagnosis, treatment and precision medicine: mini review. Oncotarget. 2017;8(70):115774–115786. doi:10.18632/oncotarget.22404
46. Turkoglu O, Zeb A, Graham S, et al. Metabolomics of biomarker discovery in ovarian cancer: a systematic review of the current literature. Metabolomics. 2016;12:4. doi:10.1007/s11306-016-0990-0
47. Shin JM, Kamarajan P, Fenno JC, Rickard AH, Kapila YL. Metabolomics of head and neck cancer: a mini-review. Front Physiol. 2016;7:526. doi:10.3389/fphys.2016.00526
48. McGregor HC, Short MA, Lam S, Shaipanich T, Beaudoin EL, Zeng H. Development and in vivo test of a miniature Raman probe for early cancer detection in the peripheral lung. J Biophotonics. 2018;11(11):e201800055. doi:10.1002/jbio.201700393
49. Varadhachary GR, Raber MN. Cancer of unknown primary site. N Engl J Med. 2014;371(8):757–765. doi:10.1056/NEJMra1303917
50. Stefancu A, Moisoiu V, Couti R, et al. Combining SERS analysis of serum with PSA levels for improving the detection of prostate cancer. Nanomedicine (Lond). 2018;13(19):2455–2467. doi:10.2217/nnm-2018-0127
51. Cuenca AG, Jiang H, Hochwald SN, Delano M, Cance WG, Grobmyer SR. Emerging implications of nanotechnology on cancer diagnostics and therapeutics. Cancer. 2006;107(3):459–466. doi:10.1002/cncr.22035
52. Tu Q, Chang C. Diagnostic applications of Raman spectroscopy. Nanomedicine. 2012;8(5):545–558. doi:10.1016/j.nano.2011.09.013
53. Mosier-Boss PA. Review of SERS Substrates for Chemical Sensing. Nanomaterials (Basel). 2017;7(6):142. doi:10.3390/nano7120458
Supplementary materials
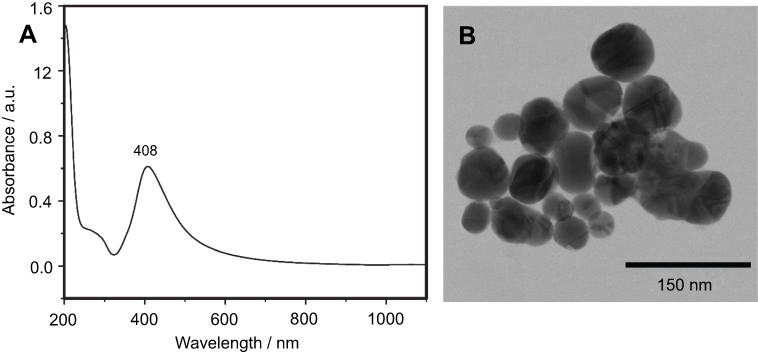 |
Figure S1 The physical properties of silver nanoparticles used for acquiring surface-enhanced Raman scattering (SERS) spectra of serum samples. The UV-Vis spectrum (A) and a representative transmission electron microscopy image (B) of the silver nanoparticles used for SERS. |
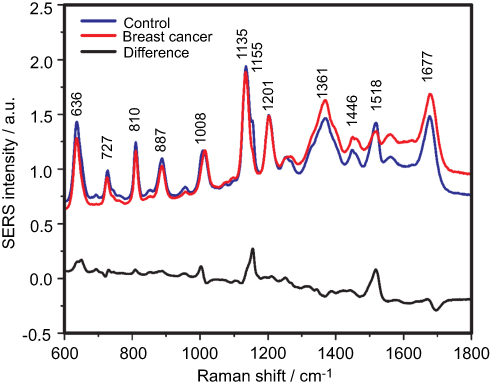 |
Figure S2 The mean surface-enhanced Raman scattering (SERS) spectra of serum from controls and breast cancer patients and their difference. The SERS spectra were acquired by focusing a 532 nm laser (10 mW) on the samples for 40 s. The SERS spectra were mean normalized and for each spectrum, two measurements were averaged. |
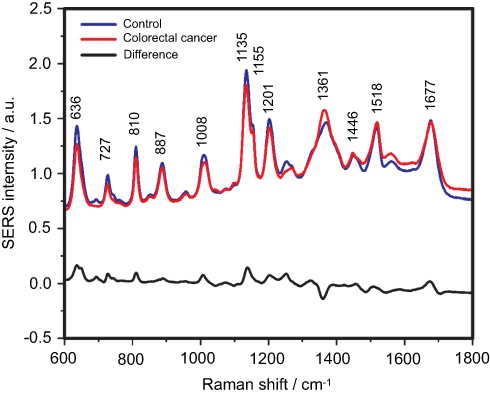 |
Figure S3 The mean surface-enhanced Raman scattering (SERS) spectra of serum from controls and colorectal cancer patients and their difference. The SERS spectra were acquired by focusing a 532 nm laser (10 mW) on the samples for 40 s. The SERS spectra were mean normalized and for each spectrum, two measurements were averaged. |
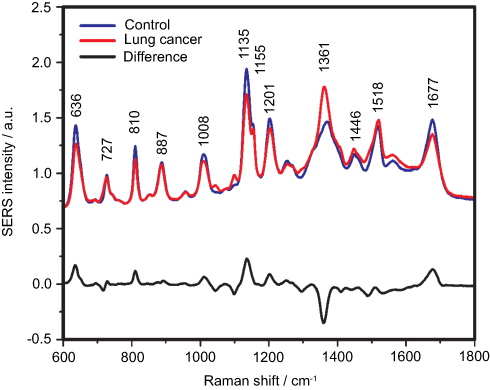 |
Figure S4 The mean surface-enhanced Raman scattering (SERS) spectra of serum from controls and lung cancer patients and their difference. The SERS spectra were acquired by focusing a 532 nm laser (10 mW) on the samples for 40 s. The SERS spectra were mean normalized and for each spectrum, two measurements were averaged. |
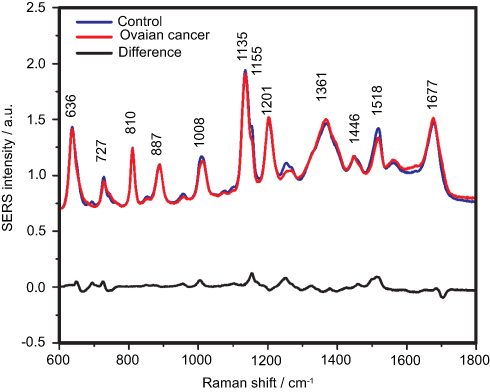 |
Figure S5 The mean surface-enhanced Raman scattering (SERS) spectra of serum from controls and ovarian cancer patients and their difference. The SERS spectra were acquired by focusing a 532 nm laser (10 mW) on the samples for 40 s. The SERS spectra were mean normalized and for each spectrum, two measurements were averaged. |
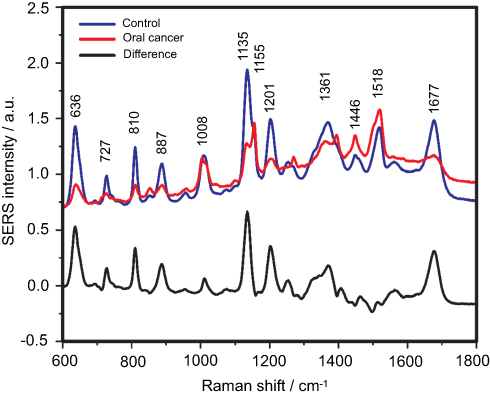 |
Figure S6 The mean surface-enhanced Raman scattering (SERS) spectra of serum from controls and oral cancer patients and their difference. The SERS spectra were acquired by focusing a 532 nm laser (10 mW) on the samples for 40 s. The SERS spectra were mean normalized and for each spectrum, two measurements were averaged. |
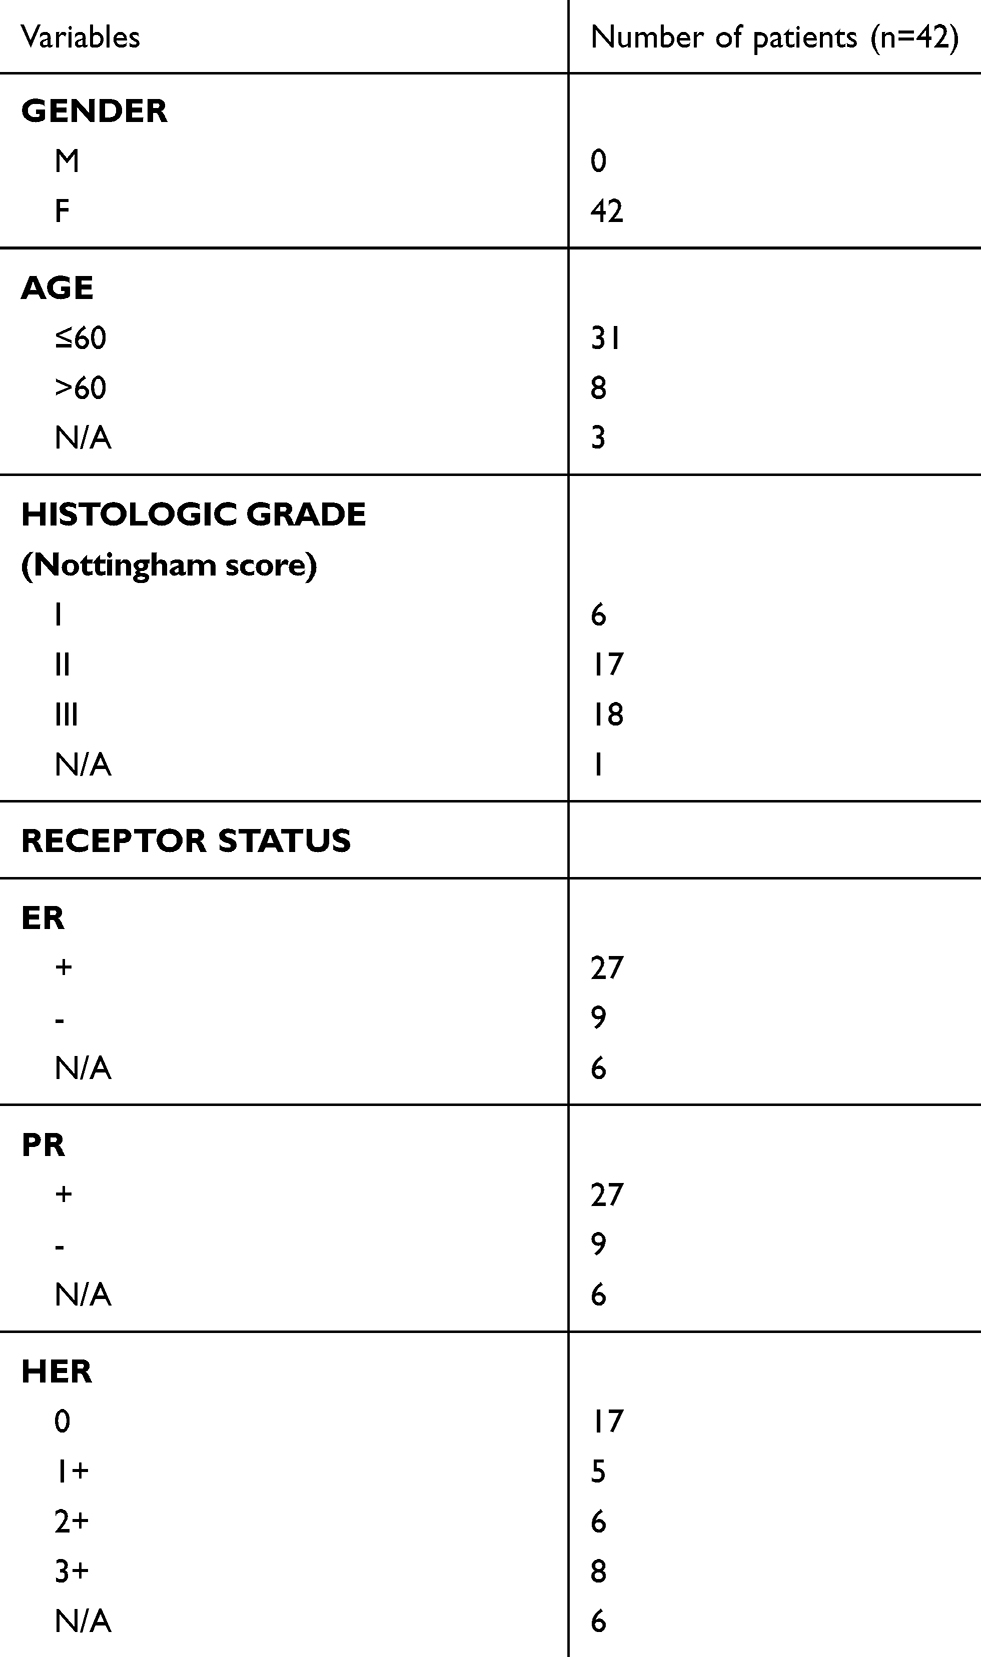 |
Table S1 Clinical characteristics of breast cancer group patients. |
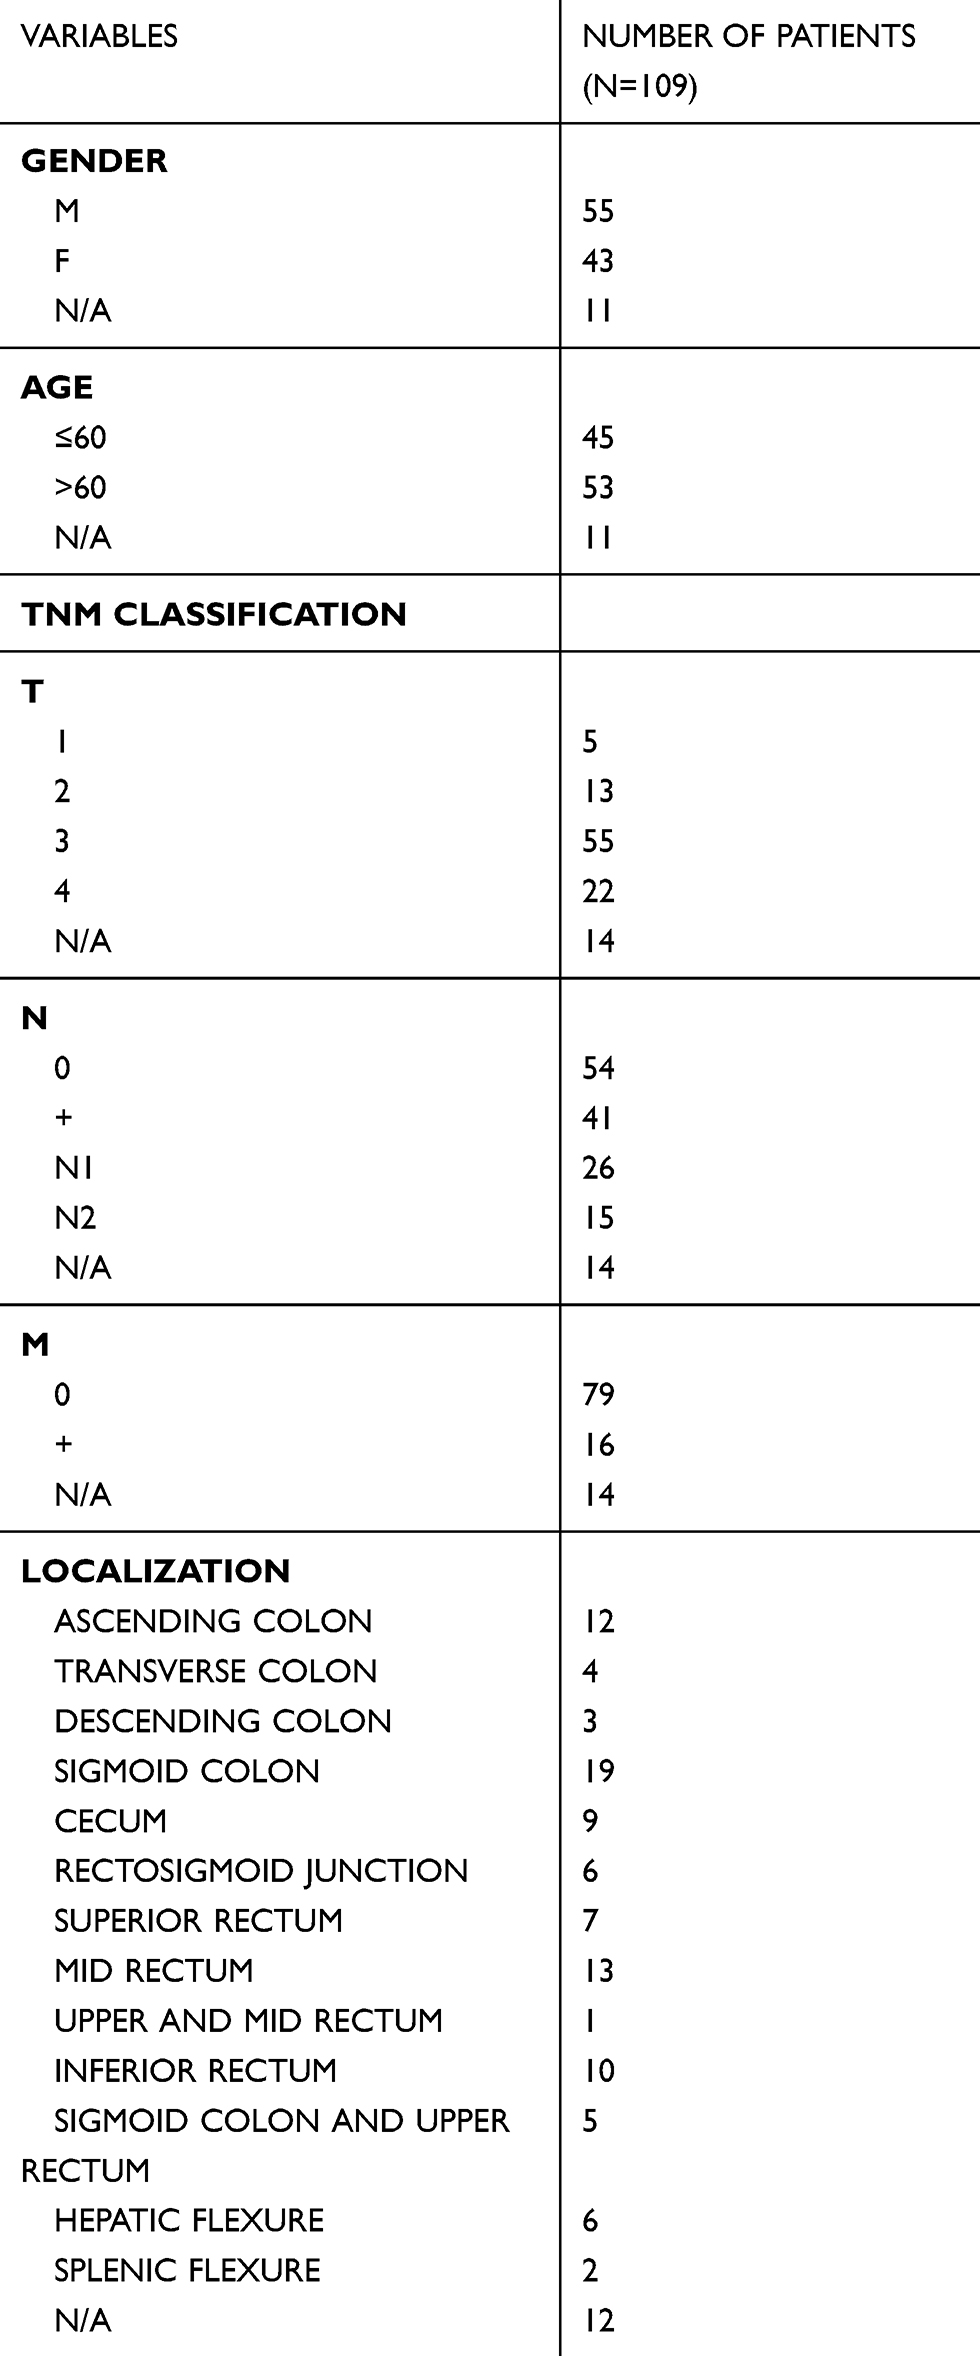 |
Table S2 Clinical characteristics of colorectal cancer group patients. |
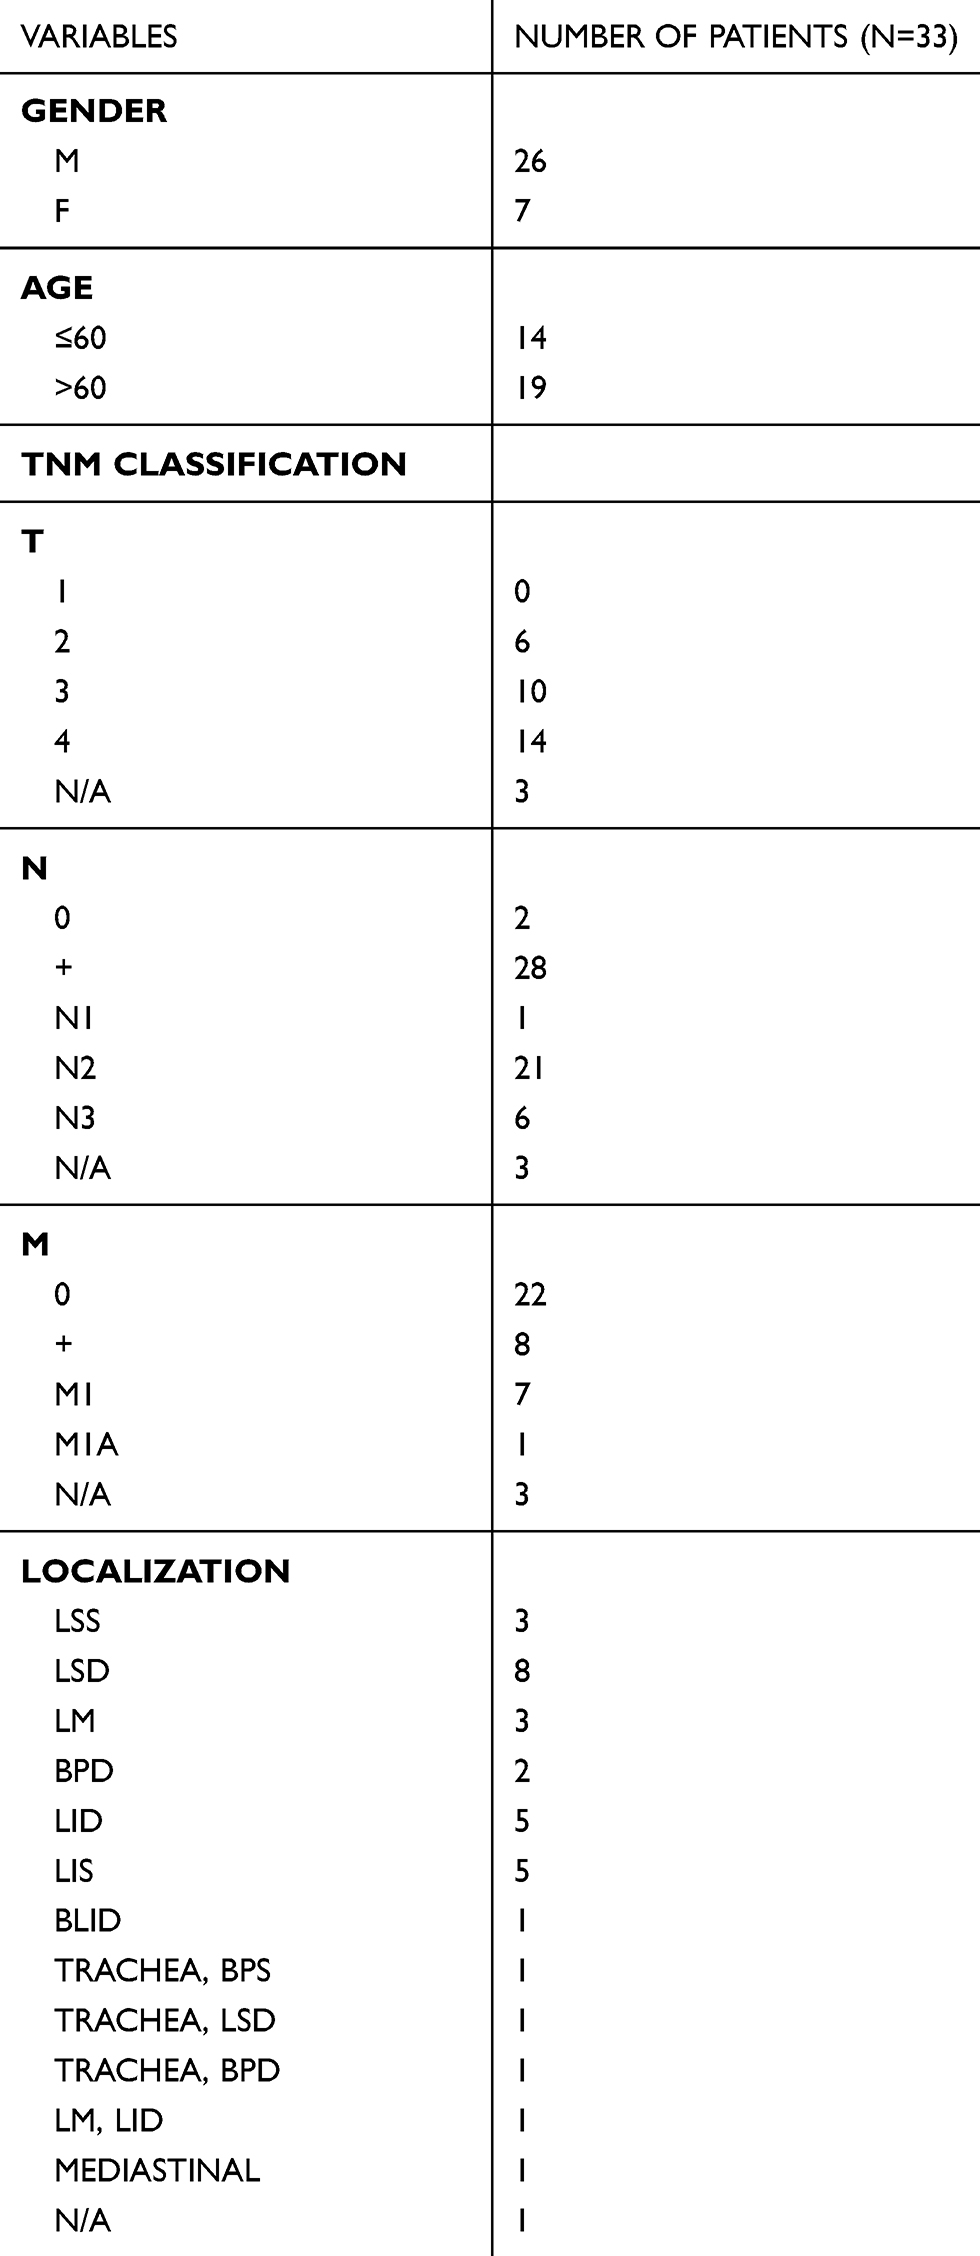 |
Table S3 Clinical characteristics of lung cancer group patients. |
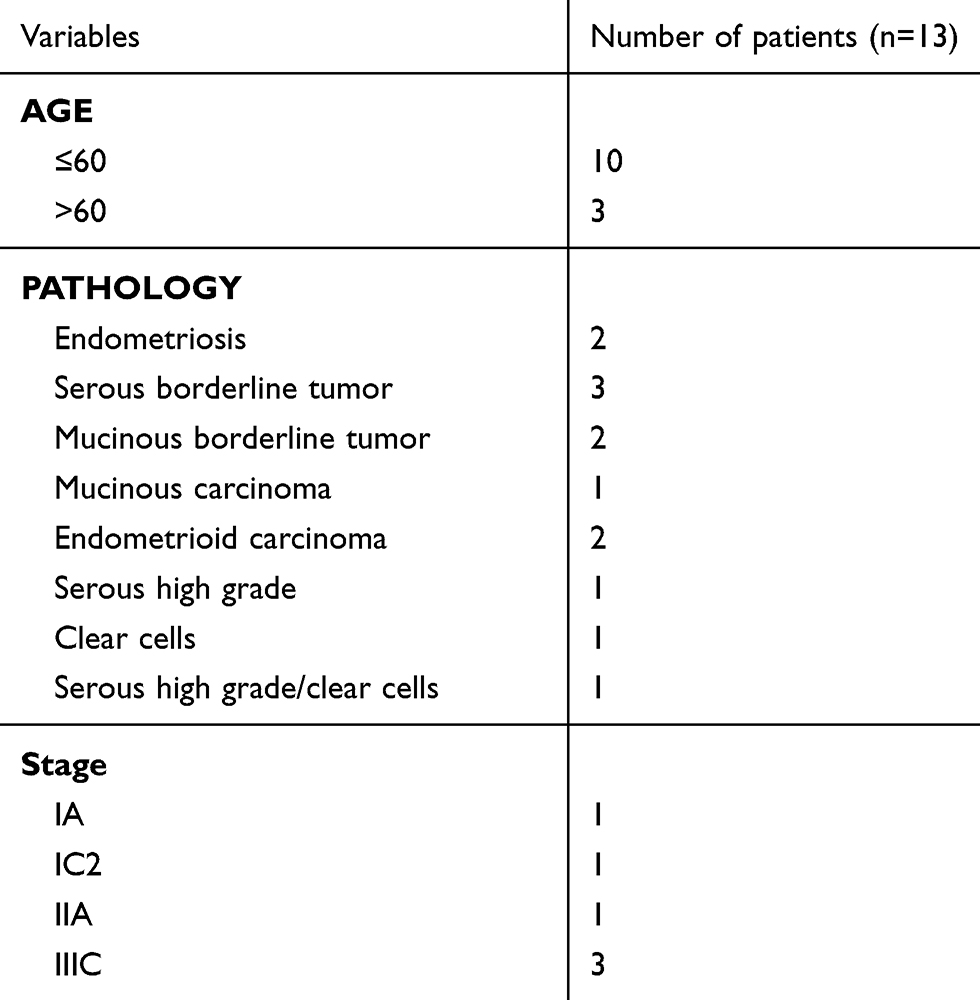 |
Table S4 Clinical characteristics of ovarian cancer group patients. |
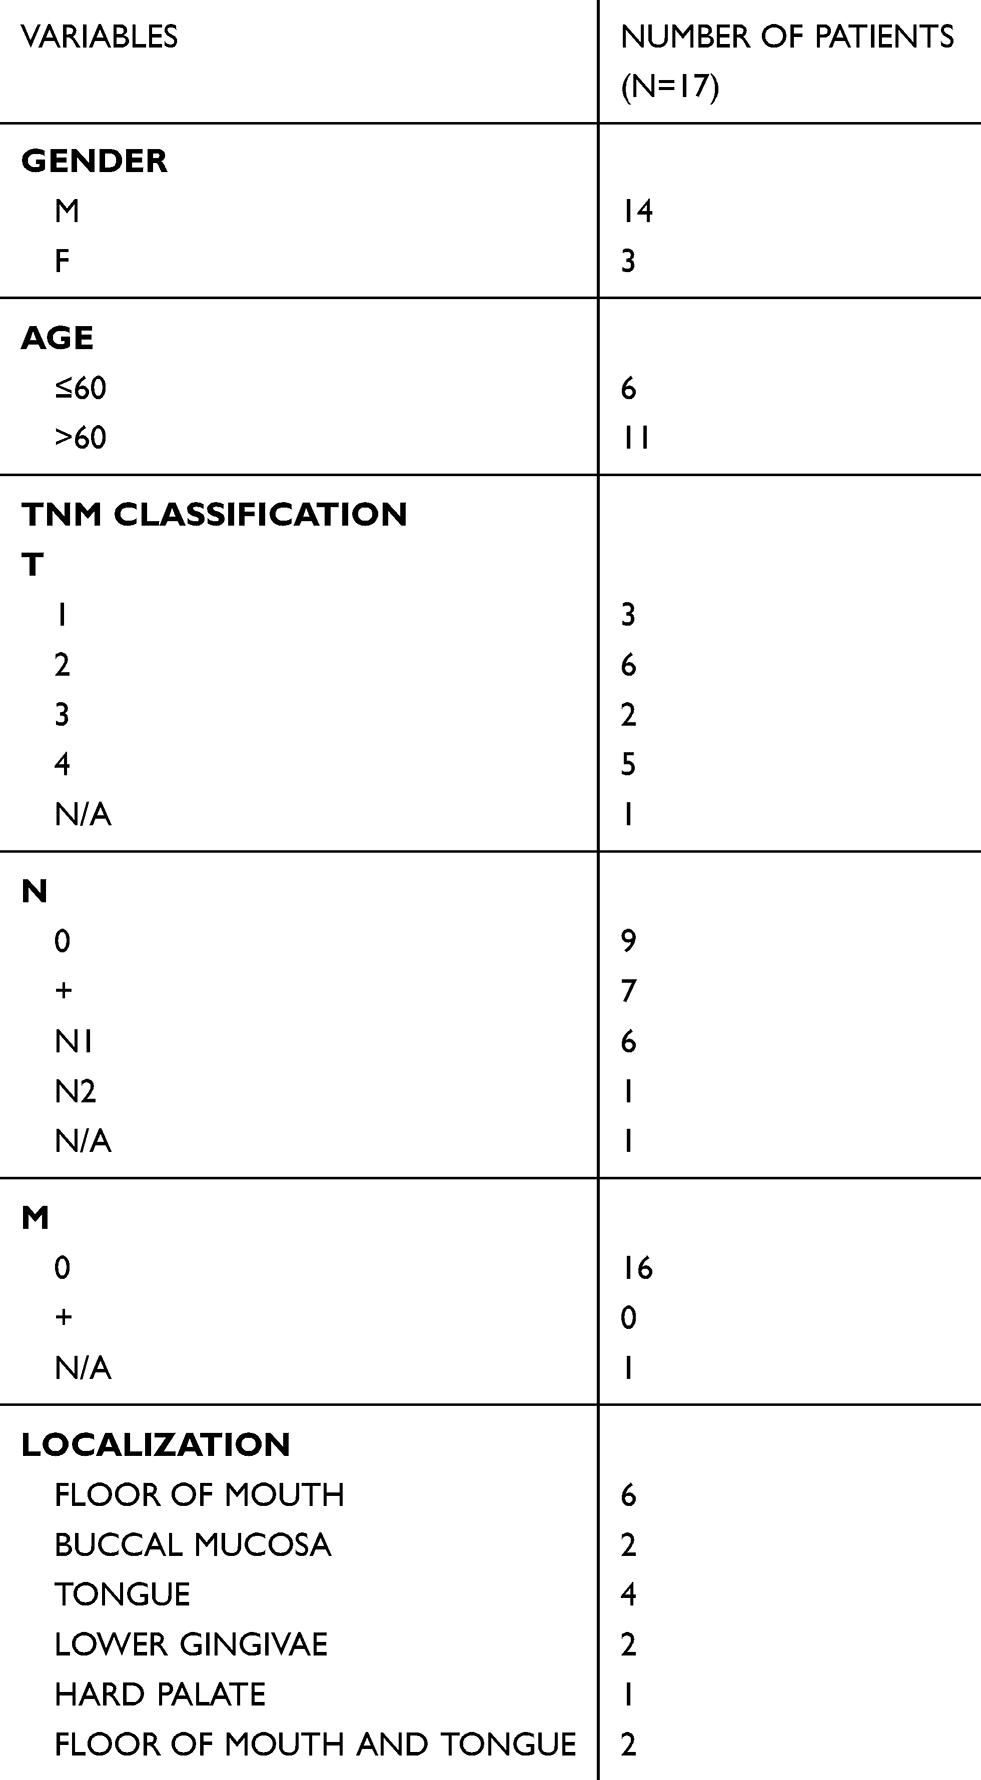 |
Table S5 Clinical characteristics of oral cancer group patients |
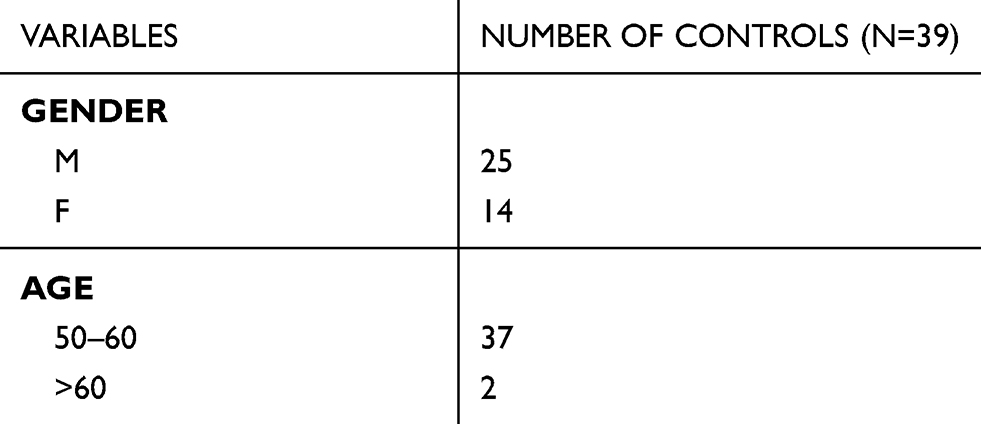 |
Table S6 Demographic information of healthy controls. |
 © 2019 The Author(s). This work is published and licensed by Dove Medical Press Limited. The full terms of this license are available at https://www.dovepress.com/terms.php and incorporate the Creative Commons Attribution - Non Commercial (unported, v3.0) License.
By accessing the work you hereby accept the Terms. Non-commercial uses of the work are permitted without any further permission from Dove Medical Press Limited, provided the work is properly attributed. For permission for commercial use of this work, please see paragraphs 4.2 and 5 of our Terms.
© 2019 The Author(s). This work is published and licensed by Dove Medical Press Limited. The full terms of this license are available at https://www.dovepress.com/terms.php and incorporate the Creative Commons Attribution - Non Commercial (unported, v3.0) License.
By accessing the work you hereby accept the Terms. Non-commercial uses of the work are permitted without any further permission from Dove Medical Press Limited, provided the work is properly attributed. For permission for commercial use of this work, please see paragraphs 4.2 and 5 of our Terms.