")
Back to Journals » Drug Design, Development and Therapy » Volume 11
Risk assessment and experimental design in the development of a prolonged release drug delivery system with paliperidone
Authors Iurian S, Turdean L, Tomuta I
Received 21 October 2016
Accepted for publication 25 November 2016
Published 13 March 2017 Volume 2017:11 Pages 733—746
DOI https://doi.org/10.2147/DDDT.S125323
Checked for plagiarism Yes
Review by Single anonymous peer review
Peer reviewer comments 3
Editor who approved publication: Dr Georgios Panos
Sonia Iurian, Luana Turdean, Ioan Tomuta
Department of Pharmaceutical Technology and Biopharmacy, University of Medicine and Pharmacy Iuliu Hatieganu, Cluj-Napoca, Romania
Abstract: This study focuses on the development of a drug product based on a risk assessment-based approach, within the quality by design paradigm. A prolonged release system was proposed for paliperidone (Pal) delivery, containing Kollidon® SR as an insoluble matrix agent and hydroxypropyl cellulose, hydroxypropyl methylcellulose (HPMC), or sodium carboxymethyl cellulose as a hydrophilic polymer. The experimental part was preceded by the identification of potential sources of variability through Ishikawa diagrams, and failure mode and effects analysis was used to deliver the critical process parameters that were further optimized by design of experiments. A D-optimal design was used to investigate the effects of Kollidon SR ratio (X1), the type of hydrophilic polymer (X2), and the percentage of hydrophilic polymer (X3) on the percentages of dissolved Pal over 24 h (Y1–Y9). Effects expressed as regression coefficients and response surfaces were generated, along with a design space for the preparation of a target formulation in an experimental area with low error risk. The optimal formulation contained 27.62% Kollidon SR and 8.73% HPMC and achieved the prolonged release of Pal, with low burst effect, at ratios that were very close to the ones predicted by the model. Thus, the parameters with the highest impact on the final product quality were studied, and safe ranges were established for their variations. Finally, a risk mitigation and control strategy was proposed to assure the quality of the system, by constant process monitoring.
Keywords: pharmaceutical development, quality by design, failure mode effects analysis, Ishikawa diagram, fish-bone diagram, hydrophilic matrix
Introduction
Pharmaceutical product preparation includes complex material (active principles and excipients) processing, consisting of numerous independent or continuous stages.1 Each operation comes with its own sources of variability. Novel concepts, taken up by the regulatory agencies, require the “built-in” quality of a drug product, through a scientifically proven, quality by design approach, which is meant to predict and control all sources of errors.2–4
From the development stage of a new formulation, a complete quality target product profile (QTPP) should be established, with the desired characteristics of the product and the critical quality attributes (CQAs) that have to be monitored in the intermediate and final stages of the preparation procedure.5 Risk assessment analysis involves one or more of the following tools: Ishikawa diagrams, failure mode effects analysis (FMEA), and hazard analysis and critical control points (HACCPs), and it is supposed to identify and rank the critical process parameters (CPPs).6 Usually, the variables that have an impact on CQAs are interconnected; therefore, their study using design of experiments (DoEs) was useful to assess and predict both their individual and interacting effects. Statistical calculations of the multifactorial relationships with the use of response surface methodology lead to the development of a design space, meaning a domain of input variables, which guarantee the delivery of a product with the required characteristics.5,7
A prolonged release drug delivery system requests rigorously controlled dissolution kinetics and the thorough understanding of the variables that could influence the system, so that it could be predicted quantitatively with a high precision.8,9 Polymeric matrix systems were extensively studied due to their simple preparation by direct compression and their easily available excipients. Hydrophilic polymers such as hydroxypropyl methylcellulose (HPMC), hydroxypropyl cellulose (HPC), and sodium carboxymethyl cellulose (CMCS) were used in the formulation of controlled release matrices, individually or as mixtures, and the drug transport kinetics depended on polymer hydration, swelling, and further erosion, as well as on drug dissolution and diffusion through the formed gel.10,11 On the other hand, insoluble matrices formed with hydrophobic polymers such as ethyl cellulose, Eudragit® RS (Evonik, Essen, Germany), or Kollidon® SR (BASF, Ludwigshafen, Germany) form porous structures upon hydration, and the dissolved active principle diffuses slowly through the pores into the liquid media.12–14
Kollidon SR is a physical mixture of polyvinyl acetate and polyvinylpyrrolidone (PVP; 8:2) prepared by direct compression, widely used for extended-release matrix tablets.13 They keep intact shape and dimensions passing through the gastric tract and facilitate the transport of the drug through the pores formed by PVP dissolution, in a diffusion-controlled manner. From the previous studies, it was found that water uptake rates in Kollidon SR matrices were very high at first media exposure, and then, they settled to a constant level when the matrix was completely soaked.15 Therefore, parameters such as pore sizes, Kollidon SR content, and matrix density principally regulate the release.
Paliperidone (Pal) was approved for schizophrenia treatment as an atypical antipsychotic and is available as Invega® prolonged release tablets that contain from 1.5 to 12 mg active principle. It is a weak base and practically insoluble in water,16 especially at increasing pH,17 and the absolute oral bioavailability is of only 28%.18 Controlled drug release techniques could assure a convenient dosing frequency and a steady-state drug level, which are beneficial for the patient’s comfort.
The present research work aimed at developing a prolonged release matrix tablet with Pal, within the concept of quality by design. The drug was included in an inert matrix made of Kollidon SR, to which hydrophilic polymers were added; a drug delivery system that, to the authors’ knowledge, had not been explored enough. The authors intended to modulate the release kinetics by a combined mechanism: one limitation imposed by the porous structure generated with the insoluble polymer and the other from the hydrophilic polymer gelling and slow drug diffusion.
Materials and methods
Materials
The following active principle and excipients were used: Pal (Apotex Pharmachem, Bangalore, India), lactose (FlowLac® 100; Meggle, Wasserburg am Inn, Germany), physical mixture of polyvinyl acetate and povidone (8:2) – Kollidon RS, HPC, (LH21; Shin-Etsu, Tokyo, Japan), HPMC (METHOCEL™ K4M Premium CR; Colorcon, Dartford, UK), CMCS (Fluka Chemie GmbH, Buchs, Switzerland), silicon dioxide, (Aerosil®; Evonik), and magnesium stearate (Union Derivan, Barcelona, Spain).
Tablet preparation
Pal was mixed with the compression excipients by means of geometric dilution, following the compression formulas, presented in the tables, in the preliminary part of the study and the experimental design. Tablets were manufactured by using an eccentric tablet press (Korsch EK0; Korsch, Berlin, Germany) equipped with a series of different diameter set punches (as shown in the descriptions of tablet formulas). The tablet press was adjusted for a fixed tablet weight that corresponded to a content of 3 mg Pal/tablet.
Tablet pharmaceutical characterization
Tablets were characterized for crushing strength (Dr Schleuniger, Radevormwald, Germany) and for Pal release at different times over 24 h (0.5, 1, 2, 4, 6, 8, 12, 18, and 24 h). The percentage of dissolved Pal was assessed by the European Pharmacopoeia method, by using a Pharma Test PT-DT7 system, apparatus no 1 (basket), at 37°C±0.5°C, 100 rpm, in 900 mL phosphate buffer (pH =6.8); 5 mL samples were redrawn at every specified time and replaced with the same volume of fresh media. The drug assay was performed by high-performance liquid chromatography/ultraviolet method (HPLC Agilent 1100; equipped with a Gemini C18 110 Å 50×3 mm ×5 μm column), having acetonitrile/0.1% phosphoric acid aqueous solution (15:85) as a mobile phase, at a flow rate of 1 mL/min. Pal was detected at 277 nm, at a retention time of 1.17 min.
For the release kinetics evaluation, the results were fitted with several mathematical equations: Baker and Lonsdale, Peppas, Hixon and Crowell, Higuchi, first order, and zero order.
Identification of the QTPP, CQAs, and risk analysis of CQAs
According to International Conference on Harmonisation (ICH) Q8, QTPP contains a set of characteristics of the pharmaceutical product, which are related to its quality, safety, and efficacy.5 Table 1 lists the QTPP for the extended-release Pal tablets, and the identified product quality features represent the basis for CQA defining. For each of the CQAs, an Ishikawa diagram was developed, as a risk assessment tool used to identify potential variables that could have an impact on the particular quality attribute.19
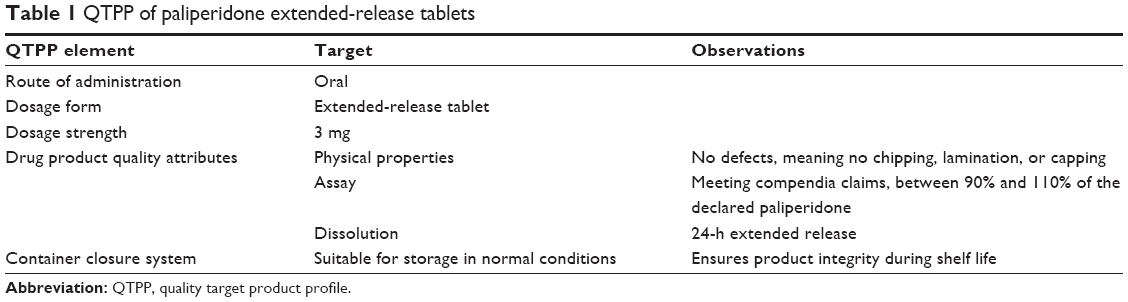 | Table 1 QTPP of paliperidone extended-release tablets |
Risk assessment by FMEA
An overall risk evaluation is depicted in the Ishikawa diagrams that contain all the process parameters that can influence or produce a failure concerning the quality of the final product. FMEA method allows the identification and prioritization of the failure modes that are most likely to cause product failure. The prioritization follows three criteria: frequency of occurrence, stringency of effects, and difficulty of detection. Each of these attributes was evaluated on a scale from 1 to 5, as follows: the occurrence (O) was ranked as 5 for frequent, 4 for probable, 3 for occasional, 2 for remote, and 1 for improbable; the severity (S), meaning the consequences of the failure mode, was classified as 5 for catastrophic, 4 for critical, 3 for serious, 2 for minor, and 1 for negligible; finally, the third criterion, the detectability (D), meaning the difficulty to identify the failure mode, was ranked as 5 for hard to detect, 4 for low chance to be detected, 3 for moderately detectable, 2 for highly detectable, and 1 for easily detectable. The three attributes were evaluated for each of the considered CPPs. The failure risk was calculated as risk priority number (RPN) = O×S×D (Table 2).20,21
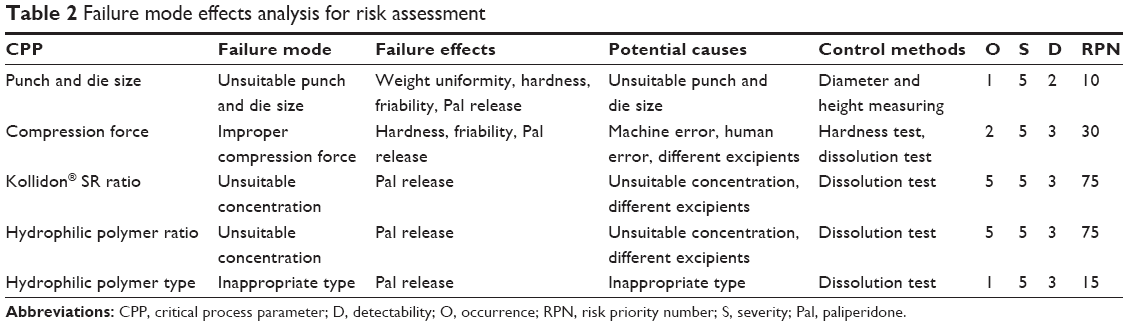 | Table 2 Failure mode effects analysis for risk assessment |
The highest ranked CPPs were explored in the preliminary experiments and the further experimental design.
Preliminary experiments
The preliminary experimental part aimed at establishing convenient size, weight, and mechanical strength for the Pal tablets in order to ensure appropriate weight uniformity, hardness, and dissolution profiles.
First, four formulations were prepared according to the data presented in Table 3, with increasing medium weights and sizes and the same hardness. Their dissolution profiles were evaluated, and consequently, final weight and size were selected for further experiments. Next, five formulations were prepared, by using the same qualitative and quantitative composition, but processed with increasing compression forces. Subsequently, the effect of the compression force on Pal release was determined, and an optimal compression force was chosen for the rest of the trials.
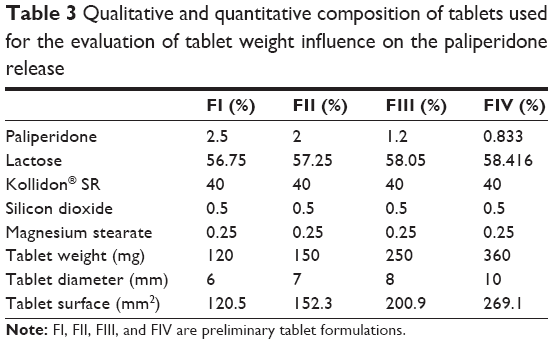 | Table 3 Qualitative and quantitative composition of tablets used for the evaluation of tablet weight influence on the paliperidone release |
Design of experiments
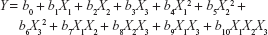
A D-optimal DoE was chosen, due to the precise estimation of factor effects and the low number of experimental trials compared with standard factorial design. Based on the Ishikawa diagrams, three key variables were identified that could influence the Pal release, apart from the size, weight, and mechanical strength that were already set to optimal values. The DoE was developed by using Modde 11.1 software (Umetrics, Umea, Sweden), and it comprised 18 runs and three center points, therefore 21 experiments, as shown in Table 4. Each of the formulations contained Kollidon SR as an inert matrix-forming agent in one of the four concentrations 25%, 30%, 35%, or 40% and 0%, 5%, or 10% of one of the chosen hydrophilic polymers (HPC, HPMC, or CMCS). As for the responses, the Pal release at each of the nine sampling times (Y1–Y9) was included in the DoE, as well as the k and n coefficients in Peppas kinetic equation (Y10 and Y11). The responses were expressed mathematically as equations that describe their relation to the formulation variables:
|
|
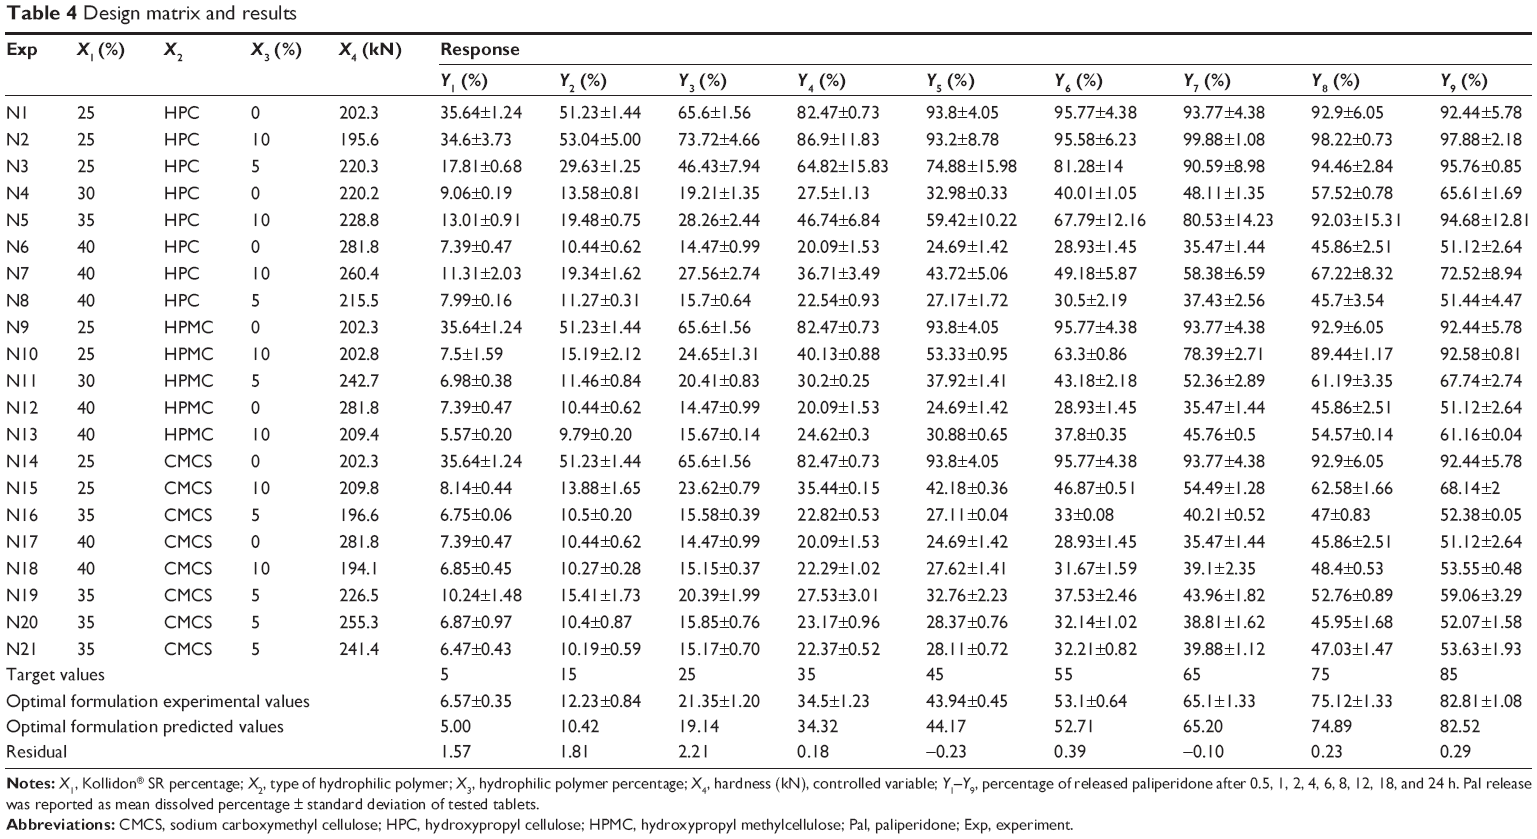 | Table 4 Design matrix and results |
where Y is the response, b0 is the mean value of the response, and bi are regression coefficients. The regression coefficients indicate the direction and the magnitude of the effect. X1, X2, and X3 are individual effects that are results of variation in one factor, whereas all the other factors are kept at constant values. X12, X22, and X32 are second-order terms that can reveal the curvatures in the effects’ variations. X1X2, X2X3, X1X3, and X1X2X3 are interaction effects that show the variation of the responses when two or more factors changed simultaneously.
The generated models were improved by backward elimination of the insignificant terms and the revised values of the regression coefficients, together with their statistical significance expressed as P-values (significant when P<0.05), which are listed in Table 5. The positive or negative value of the regression coefficient represents the positive or the negative influence the effects have on the response.
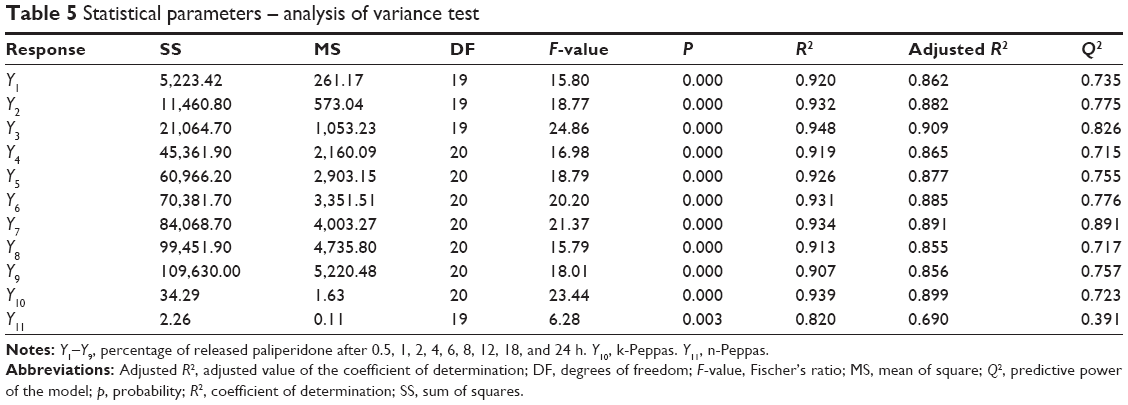 | Table 5 Statistical parameters – analysis of variance test |
Table 5 lists the results of the analysis of variance (ANOVA). The quality of model fit was assessed by calculating the regression coefficient (R2) between the observed and the predicted responses.22
In order to complete the statistical analysis, three-dimensional response surfaces were generated according to the revised regression equations (Table 6). The DoE comprised two quantitative factors (X1, Kollidon SR percentage; and X3, hydrophilic polymer percentage) and one qualitative factor (X2, the type of hydrophilic polymer: HPC, HPMC, or CMCS); therefore, the surfaces were graphical representations of the response as a function of X1 and X3, whereas X2 was consecutively HPC, HPMC, and CMCS.
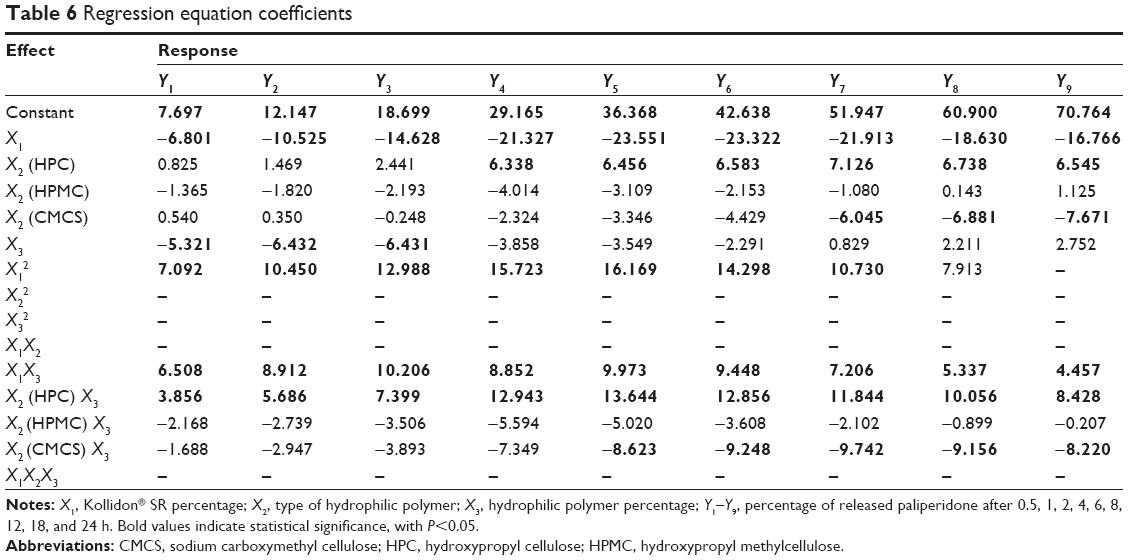 | Table 6 Regression equation coefficients |
Results and discussion
QTPP and CQAs of Pal prolonged release tablets
The QTPP of each pharmaceutical product was established according to the type of dosage form and preparation process. Based on preliminary studies, literature data, and researchers’ experience, the QTPP elements and their associated targets were framed as in Table 1.
The CQAs that were derived from the previously developed QTPP were crushing strength, the weight uniformity, and the in vitro dissolution profile. In order to have a clear image on the preparation process and to be able to thoroughly control and prevent any minor error, an Ishikawa diagram was developed for each of the CQAs (Figure 1). The CPPs were listed and evaluated by FMEA method, and the parameters with the highest RPN were considered for optimization through preliminary studies and DoE. The significance of the RPN values was highly risky for RPN ≥40, medium risk for RPN ≥20 and RPN <40, and low risk for RPN <20.21
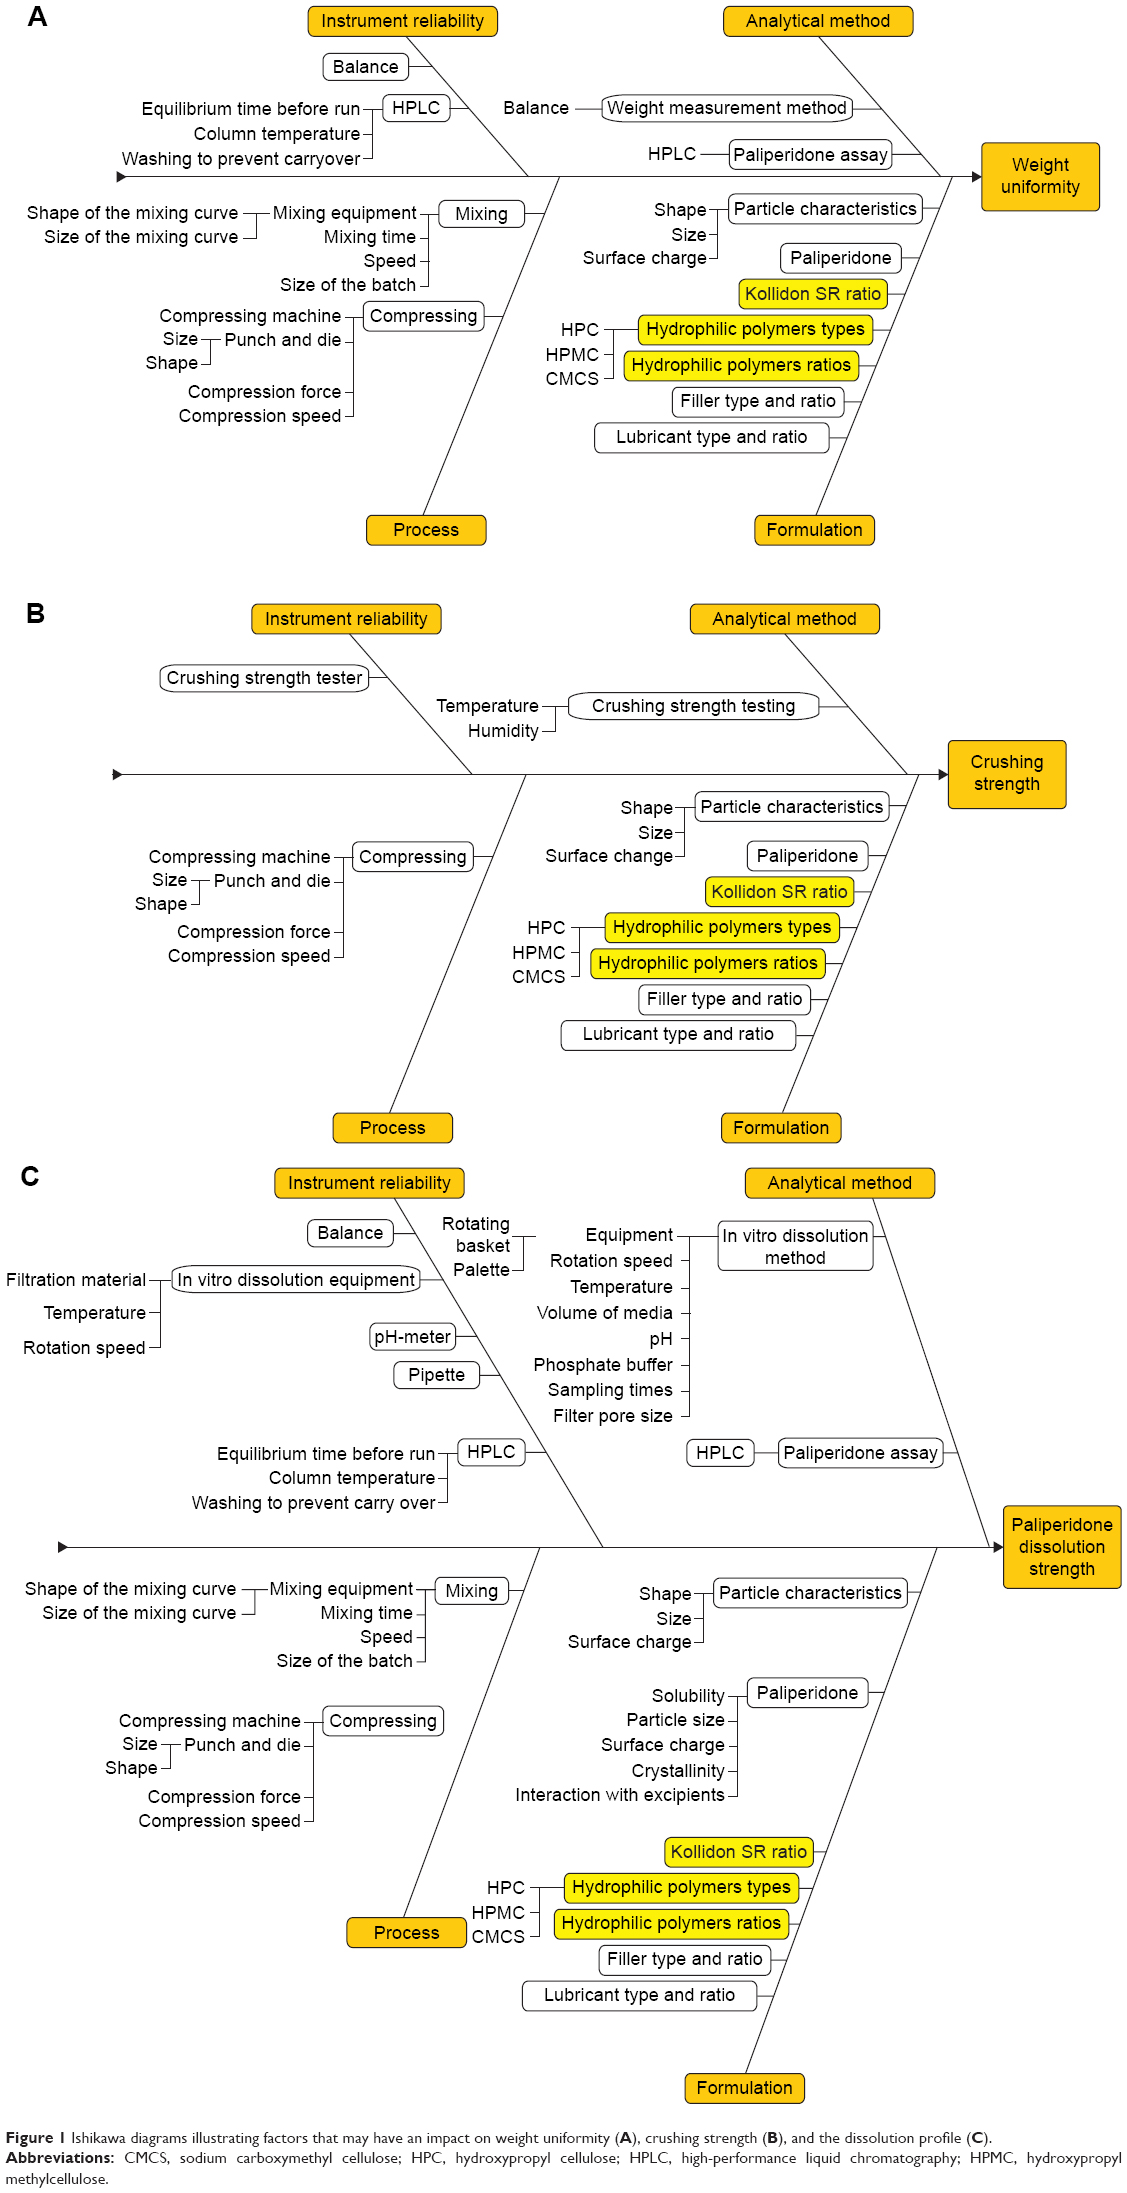 | Figure 1 Ishikawa diagrams illustrating factors that may have an impact on weight uniformity (A), crushing strength (B), and the dissolution profile (C). |
The punch and die size, the compression force, and the insoluble and soluble polymers as formulation factors were present as failure modes with high RPNs (Table 2) in the FMEA. The highest risk was met by the formulation parameters, Kollidon SR ratio and hydrophilic polymer ratio, which could occur with improper mixing or excipient supplier changing. Compression force was considered as a medium-risk CPP that could arise due to equipment malfunction, human errors, or variations in excipient characteristics. Once set, the last two CPPs, punch and die size and the type of hydrophilic polymers, have low influence on product CQAs and, therefore, low RPNs.
The risk analysis resulted in dividing the experimental work into two parts, preliminary experiments for the empirical optimization of tablet diameter (punch and die size) and compression force, and further thorough study of the high-risk CPPs by DoE.
Preliminary experiments
First, the study aimed at exploring the influence of the tablet weight and surface on the aforementioned CQAs. All formulations were within limits (relative standard deviation ≤5%) with respect to the weight uniformity test. In order to avoid double variable effect, the compression force was set so that the mechanical strength was constant. As shown in Figure 2A and B, Pal release increased with the tablet weight up to a value of 250 mg, due to the higher contact surface between the tablet and the dissolution media and the higher porosity created by the lactose and PVP dissolution,12 but when surpassing this value, no further changes were noticed in drug dissolution.
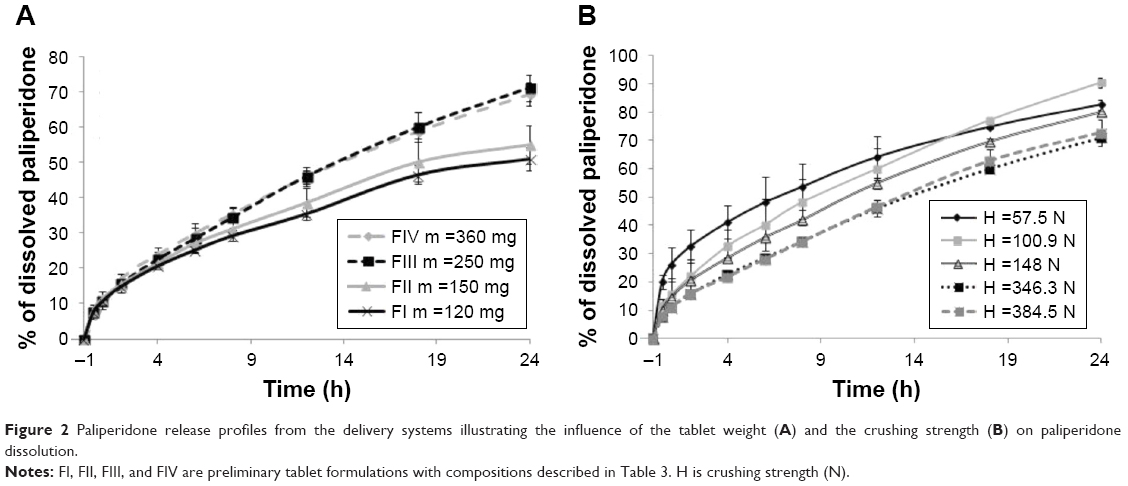 | Figure 2 Paliperidone release profiles from the delivery systems illustrating the influence of the tablet weight (A) and the crushing strength (B) on paliperidone dissolution. |
As slow Pal dissolution was the most important prerequisite for this drug delivery system, the tablet preparation was continued by using punch and die with a diameter of 7 mm, in order to obtain tablets of 120 mg and 120 mm2 average surface. This way, slow release is favored starting with the shape and the size of the tablet.
The impact of the compression force on the crushing strength was extensively studied; in the present case it produced an increase in the crushing strength from 57.5±9.86 N to 384.5±20.48 N. In order to assess the influence of the compression force on the Pal release, dissolution tests were conducted on formulations with the same content (FI tablets, Table 3), but with increasing crushing strength. As expected, the higher the crushing strength, the slower the release, but it seems that if an average value of 350 N is attained, the influence of the crushing strength weakens, up to a limit where the dissolution profile is no longer affected (Figure 2B). In insoluble matrix-type tablets, drug release increases with the increase in initial porosity.23 Lactose, the water-soluble filler, quickly dissolves in the media, leaving the water-filled pores that easily allow Pal release by diffusion. The diffusion coefficient was reported to rise with higher initial porosity, which explains the result obtained for the dissolution profiles.13,23
Considering the obtained results, the compression force for the further formulations was set to obtain crushing strengths between 200 N and 300 N.
DoE
The DoE included the two quantitative formulation parameters whose variations were considered the most hazardous for the quality profile of the final product and were ranked first according to their RPN values: the insoluble polymer, Kollidon SR ratio, and the soluble polymer ratio. Although the type of hydrophilic polymer, once chosen, was not considered a menace to the QTPP of the developed system (RPN =15, meaning low risk), it was included into the experimental design as a qualitative variable, to have a better view on its influence on the release and on its interactions with the insoluble matrix-forming agent.
Apart from the three aforementioned independent variables, the crushing strength was included into the experimental design matrix as a controlled variable, to eliminate/neutralize its influence on the dissolution results.
The results of ANOVA showed whether the variation of the responses was caused by the independent variables or it occurred by chance, at a confidence level of 95%, meaning that a model was considered significant when P<0.05. The statistical analysis (Table 5) revealed highly significant models for all responses, with P<0.05. The regression coefficients were >0.90, for most of the responses, which indicates that a high percentage of the response variance was explained by the model. At an R2 value of 0.90, 90% of the response was explained by the model.22 Adjusted R2 values were in a reasonable agreement, particularly for the reduced models, signifying good model fit. The Q2 values >0.5 and the small differences <0.2 between R2 and Q2, obtained for ten out of eleven responses, indicate the good predictive power and appropriateness of the developed models.22
Effects of factors on the Pal dissolution
The results for the measured responses, meaning the percentages of released Pal at different sampling times, were included into the design matrix (Table 4). Table 6 contains the revised regression coefficients for responses Y1–Y9. The responses, Y1–Y9, represented the percentage of released Pal at the nine sampling times, from 0.5 to 24 h. The release behavior was primarily influenced by the Kollidon SR ratio, with a negative effect on the dissolution throughout the 24-h test, meaning that the increase in Kollidon SR percentage determined slower Pal dissolution. A denser insoluble matrix with small pores determines low water infiltration and thus slow Pal diffusion into the dissolution media.23
Figure 3 depicts the influence of quantitative factors for each of the three hydrophilic polymers over time. It was represented in that way, to emphasize the manner the influences evolve during the dissolution test, for a better understanding of the effects of the variables and their interactions and for a complete image of the factors that control the dissolution mechanism.
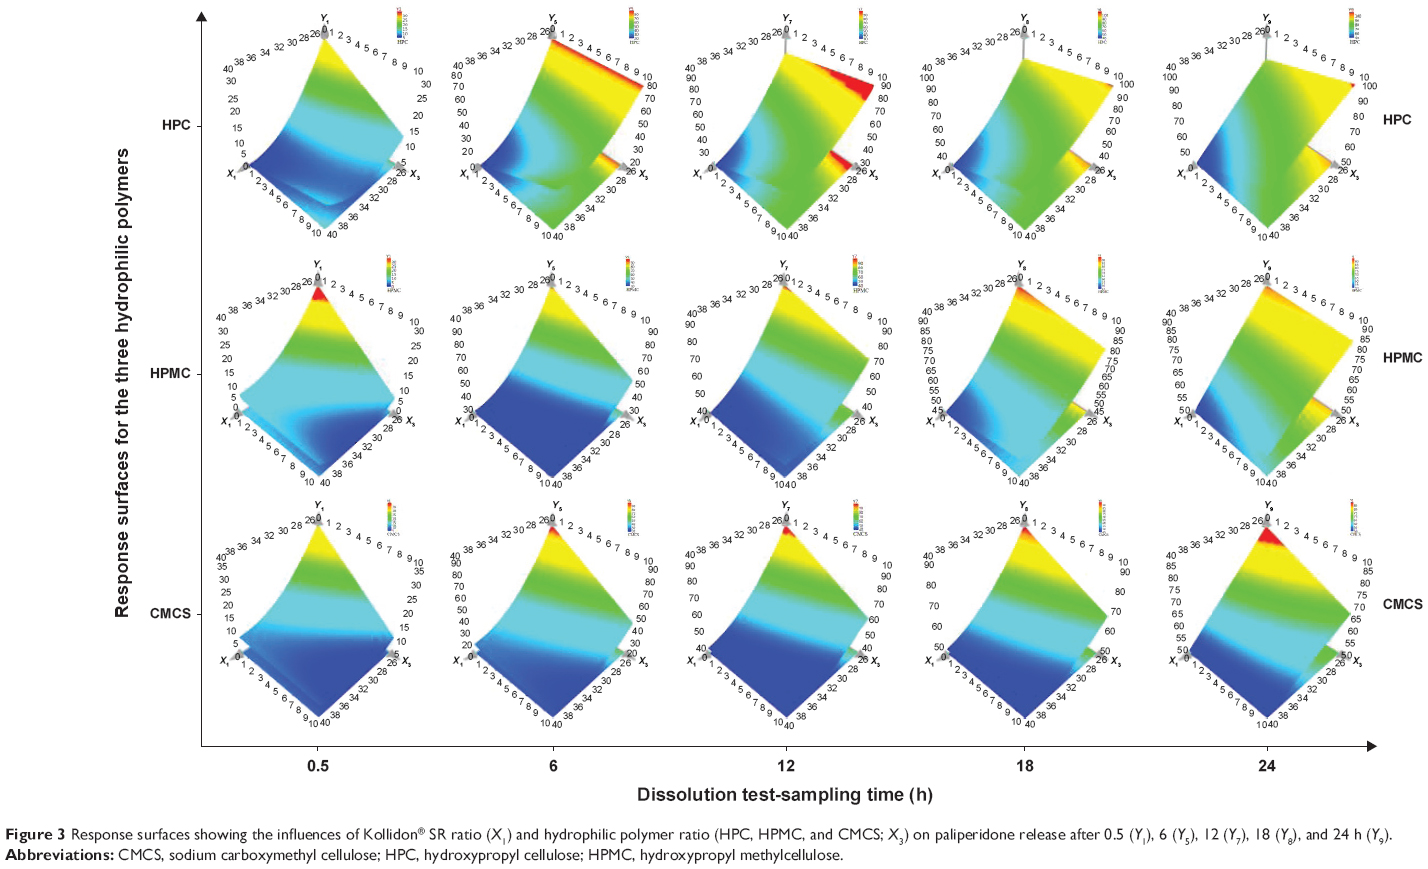 | Figure 3 Response surfaces showing the influences of Kollidon® SR ratio (X1) and hydrophilic polymer ratio (HPC, HPMC, and CMCS; X3) on paliperidone release after 0.5 (Y1), 6 (Y5), 12 (Y7), 18 (Y8), and 24 h (Y9). |
During the first hours of the dissolution test, at low Kollidon SR level, HPC percentage increase determined the delay in dissolution, whereas at a high Kollidon SR level, the Pal release was favored by the presence of high ratios of HPC. The same behavior was observed after 4 h, on the whole range of insoluble polymer concentration. In addition, in the first 6 h, at a high HPC content, an inflection point in the Kollidon SR concentration was found, ~32%, up to which the Pal release diminished, but when it was surpassed, the Pal release increased again. Thus, in the first interval of the dissolution test, Kollidon SR influence was the most significant, and higher concentrations led to more compact matrices and low contact surface between Pal and media, which resulted in slow dissolution, but after 6 h, Kollidon SR influence decreased and HPC influence became more significant, accelerating the release by inflating and breakage of the inert matrix.
HPMC influence is important in the first 6 h of the dissolution test and at low Kollidon SR ratios. A 10% increase in HPMC concentration produced a decrease of 30% in Pal dissolution after 30 min. Over the 24 h, the HPMC effect gradually decreased, whereas the Kollidon SR influence became linear. Unlike HPC, HPMC produced a more abrupt delay due to faster hydration that yielded a thick gel, which constituted a barrier for the active principle diffusion. The further gel structure erosion and polymer dissolution that occurred after ~6 h led to the loss of effect on the entire Kollidon SR concentration range.24
CMCS exhibited low effect on dissolution at high levels of Kollidon SR and significantly prolonged Pal release at low ratios of insoluble polymer, with a more significant effect at the beginning of the test. Due to its higher solubility, gel erosion occurred faster, and the dissolution lag was less important compared to the HPMC formulations.25
Effects of factors on the release kinetics
Several kinetic equations including Baker and Lonsdale, Peppas and Korsmeyer, Hixon and Crowell, Higuchi, first order, and zero order were tested in order to assess the Pal release behavior. Table 7 lists kinetics coefficient, Akaike constant, and correlation values. The equation that best fitted the data was Peppas–Korsmeyer (R2>0.99), although the Higuchi model also showed good results. Therefore, both mechanisms of erosion and diffusion participated to the Pal release, erosion, and diffusion.
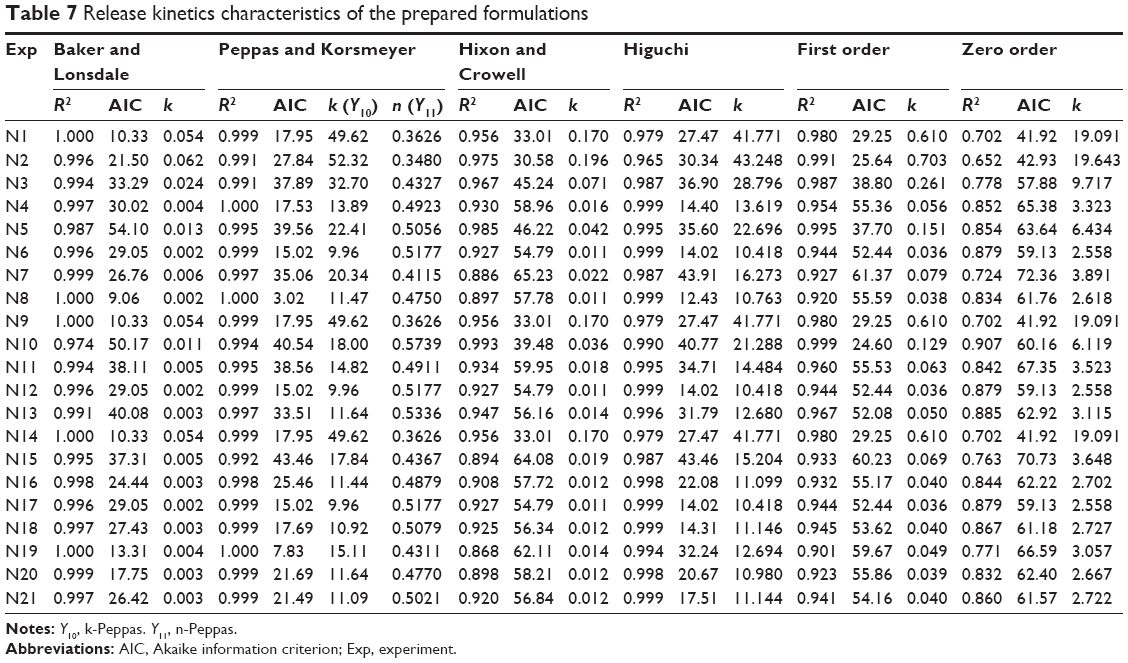 | Table 7 Release kinetics characteristics of the prepared formulations |
As R2 values were high enough to evaluate the dissolution behavior, the diffusional exponents were analyzed to characterize the type of diffusion. Most of the formulations released the active principle by non-Fickian transport (anomalous), with 0.45<n<0.89, especially at high Kollidon SR ratios.26,27 The release was done after Fickian transport when small amounts of Kollidon SR were used (n<0.45). The diffusion constant k is a measure of the release rate, and with the diffusion exponent n, it was analyzed as a response in the DoE (Y10 and Y11, Table 7).28 The generated response surfaces (Figure 4) showed that the release rate decreased when increasing the ratios of both insoluble and soluble polymers. The diffusion mechanism changed from Fickian to anomalous when Kollidon SR ratios increased. At a maximum Kollidon SR content, adding a hydrophilic polymer (HPMC; Figure 4) produced no effect on the active principle transport mechanism, probably because the rigid porous structure formed by the insoluble polymer did not allow polymer swelling and drug diffusion.29,30
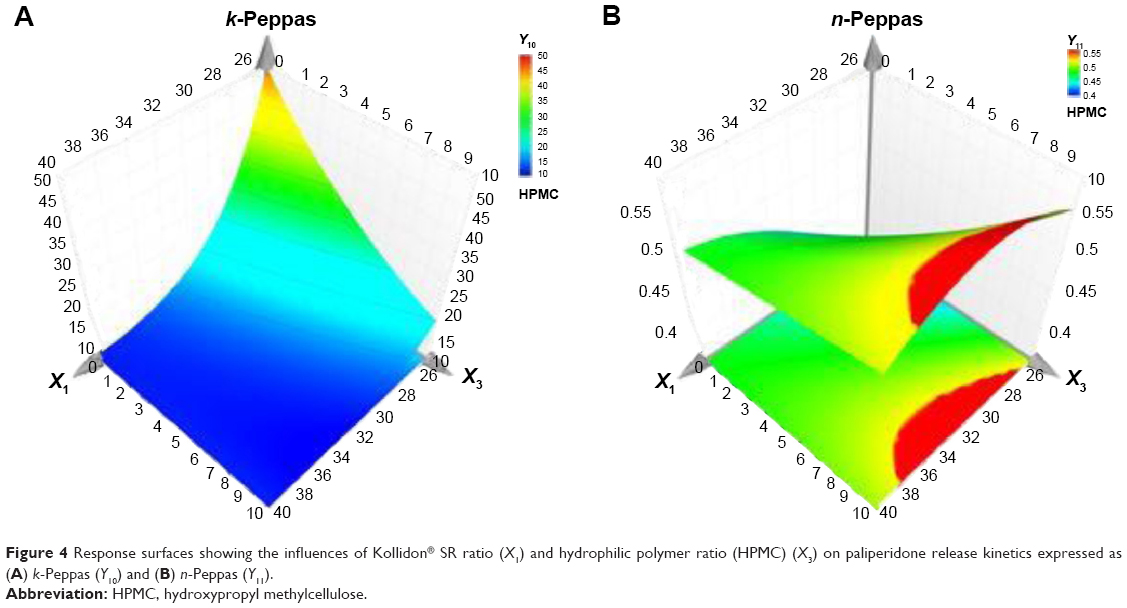 | Figure 4 Response surfaces showing the influences of Kollidon® SR ratio (X1) and hydrophilic polymer ratio (HPMC) (X3) on paliperidone release kinetics expressed as (A) k-Peppas (Y10) and (B) n-Peppas (Y11). |
Design space and optimization
Among the different approaches used to establish the design space, this work used response surface methodology with optimization to generate a domain of input variables that lead to a product with the desired CQAs. The statistical effect analysis verified whether the selected formulation variables and their interactions had a significant effect on Pal release from the delivery systems. The relationships between the CPPs and the CQAs were established by response surface modeling, which allowed the thorough understanding of their interconnections present in the experimental domain. From the initial experimental area, a design space was isolated (Figure 5) where all the specifications stated in the QTPP were met at a certain risk level. In order to generate it, a series of limitations and target values on the responses were applied, as indicated in Table 4. The target values for dissolution profile were selected so as to assure the Pal release according to the identified release mechanism of active ingredient from prepared matrix tablets (erosion and diffusion) for a period of 24 h. The CQAs indicated that the Pal release was constrained to low values at the beginning of the dissolution test and maximized after 24 h. As one of the independent variables was qualitative (the type of hydrophilic polymer), the conditions to obtain the Pal delivery system with the desired release by using HPMC as a hydrophilic matrix agent were generated.
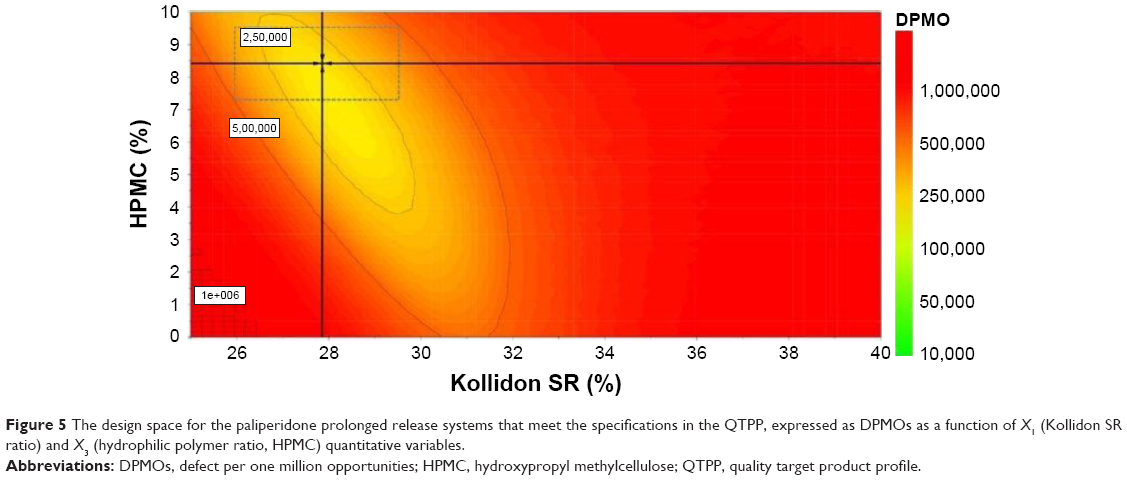 | Figure 5 The design space for the paliperidone prolonged release systems that meet the specifications in the QTPP, expressed as DPMOs as a function of X1 (Kollidon SR ratio) and X3 (hydrophilic polymer ratio, HPMC) quantitative variables. |
Each point from the design space surface represents a possible different formulation, having the Pal release specified in the QTPP, with a certain risk level. The risk of getting predictions outside the specifications, expressed as defect per million opportunities (DPMOs), was estimated by using Monte Carlo simulations (Figure 5). In order to prove that the model fits the data satisfactorily for predicting the drug release, the optimizer option of the Modde software was used to select an optimal formulation from the design space that contained X1=27.62% Kollidon SR, X2= HPMC, and X3=8.73% HPMC. The optimal formulation was prepared and tested under the same conditions as the former experimental runs. The small differences between the experimental results and the predicted ones, calculated as residuals (Table 4) and a P-value of 0.824, prove the validation of revised models, meaning that the process produces the desired CQAs if operated within the design space.
Risk mitigation and control strategy
Ishikawa diagrams and FMEA were used to establish a hierarchy of the input variables with the highest risks on Pal release. The factors with the highest impact were studied by using DoE, which resulted in the development of a design space, as an acceptable region within which the quality of the product can be assured, as stated in the QTPP. The risk mitigation and control strategy consists in a series of measures of quality assertion based on product and process knowledge.21
The variable X1 had an important impact on Pal release from the delivery system, as shown in regression equation coefficients (Table 6), response surfaces (Figure 3), and the P-value from ANOVA (Table 5). As discussed earlier, there is an optimum ratio of Kollidon SR, but also a wider range around the value of 27.62% where the desired release can be achieved. Keeping the variable X1 in this range assures Pal dissolution in the constraints range with a low error risk.
The type of hydrophilic polymer and especially the hydrophilic polymer ratio (X2 and X3) were ranked as highly important failure modes by the FMEA. The DoE results confirmed their impact (Table 6; Figure 3). Of the three evaluated polymers, HPMC was efficient in counteracting the burst release of Pal. Moreover, HPMC percentage variation produced the lowest effect on Pal release; therefore, it was selected as a hydrophilic matrix agent in the optimal formulation. The optimal formulation contained 8.73% HPMC, and moderate variations from this value were not expected to produce any significant effect on active ingredient dissolution.
The other two failure modes, punch and die size and compression force, were optimized in the preliminary part of the study, and in a validated production process, variation in these modes was most unlikely to occur.
Working within the established range of the process and formulation parameters leads to low failure-mode risks. However, the risk mitigation strategy involves monitoring the Pal release and maintaining the Pal dissolution parameters within the constraint range.
Conclusion
The current study demonstrated the relevance of the application of quality by design concept in the development of a new pharmaceutical product. An inert matrix based on Kollidon SR was developed, having HPMC as a hydrophilic polymer to modulate Pal release, through a highly predictive model with a small number of experiments. A formulation containing 27.62% Kollidon SR and 8.73% HPMC was found as the most promising with respect to both drug release and potential risks regarding quality assurance.
The risk analysis of failure modes coupled with experimental design proved their utility by outlining the parameters that have a high impact on product quality and establishing safe ranges for their variation. Such an approach can be of high importance when fast development of a product is requested, for expensive processes or simply to avoid getting products outside the specifications.
Acknowledgment
This work was supported by a grant of the Romanian National Authority for Scientific Research and Innovation, CNCS – UEFISCDI, project number PN-II-RU-TE-2014-4-1862.
Disclosure
The authors report no conflicts of interest in this work.
References
Yu LX. Pharmaceutical quality by design: product and process development, understanding and control. Pharm Res. 2008;25(4):781–791. | ||
Pallagi E, Ambrus R, Szabo-Revesz P, Csoka I. Adaptation of the quality by design concept in early pharmaceutical development of an intranasal nanosized formulation. Int J Pharm. 2015;491:384–392. | ||
Pallagi E, Karimi K, Ambrus R, Szabo-Revesz P, Csoka I. New aspects of developing a dry powder inhalation formulation applying the quality-by-design approach. Int J Pharm. 2016;511:151–160. | ||
Marto J, Gouveia LF, Goncalves LM, et al. A quality by design (QbD) approach on starch-based nanocapsules: a promising platform for topical drug delivery. Colloids Surf B: Biointerfaces. 2016;143:177–185. | ||
Fda.gov [homepage on the Internet]. Guidance for Industry Q8(R2) Pharmaceutical Development. Silver Spring: U.S. Department of Health and Human Services Food and Drug Administration; 2016 [cited October 18, 2016]. Available from: http://www.fda.gov/Drugs/GuidanceComplianceRegulatoryInformation/Guidances/default.htm. Accessed October 8, 2016. | ||
Fda.gov [homepage on the Internet]. Guidance for Industry Q9 Quality Risk Management. Rockville: U.S. Department of Health and Human Services Food and Drug Administration; 2016 [cited October 18, 2016]. Available from: http://www.fda.gov/cder/guidance/index.htm. Accessed October 8, 2016. | ||
Iurian S, Tomuţă I, Bogdan C, et al. Defining the design space for freeze-dried orodispersible tablets with meloxicam. Drug Dev Ind Pharm. 2016;42(12):1977–1989. | ||
Abdul A, Poddar SS. A flexible technology for modified release of drugs: multi layered tablets. J Control Release. 2004;97:393–405. | ||
Colombo P, Bettini R, Santi P, Peppas NA. Swellable matrices for controlled drug delivery: gel-layer behavior, mechanisms and optimal performance. Pharm Sci Technol Today. 2000;3(6):198–204. | ||
Szente V, Baska F, Zelko R, Suvegh K. Prediction of the drug release stability of different polymeric matrix tablets containing metronidazole. J Pharm Biomed Anal. 2011;54:730–734. | ||
Conti S, Maggi L, Segale L, et al. Matrices containing NaCMC and HPMC 1. Dissolution performance characterization. Int J Pharm. 2007;333:136–142. | ||
Song SH, Chae BR, Sohn SI, et al. Formulation of controlled release pelubiprofen tablet using Kollidon(®) SR. Int J Pharm. 2016;511:864–875. | ||
Grund J, Korber M, Bodmeier R. Predictability of drug release from water-insoluble polymeric matrix tablets. Eur J Pharm Biopharm. 2013;85:650–655. | ||
Sauri J, Millan D, Sune-Negre JM, et al. Quality by design approach to understand the physicochemical phenomena involved in controlled release of captopril SR matrix tablets. Int J Pharm. 2014;477:431–441. | ||
Siepmann F, Eckart K, Maschke A, Kolter K, Siepmann J. Modeling drug release from PVAc/PVP matrix tablets. J Control Release. 2010;141:216–222. | ||
Kumar S, Randhawa JK. Preparation and characterization of paliperidone loaded solid lipid nanoparticles. Colloids Surf B Biointerfaces. 2013;102:562–568. | ||
Aleksovski A, Lustrik M, Sibanc R, Dreu R. Design and evaluation of a specific, bi-phase extended release system based on differently coated mini-tablets. Eur J Pharm Sci. 2015;75:114–122. | ||
Huang W, Shi Y, Wang C, Yu K, Sun F, Li Y. Using spray-dried lactose monohydrate in wet granulation method for a low-dose oral formulation of a paliperidone derivative. Powder Technol. 2013;246:379–394. | ||
Xu X, Costa AP, Khan MA, Burgess DJ. Application of quality by design to formulation and processing of protein liposomes. Int J Pharm. 2012;434:349–359. | ||
Kaljevic O, Djuris J, Djuric Z, Ibric S. Application of failure mode and effects analysis approach for formulation of carvedilol compression coated tablets. J Drug Deliv Sci Technol. 2016;32:56–63. | ||
Vora C, Patadia R, Mittal K, Mashru R. Risk based approach for design and optimization of stomach specific delivery of rifampicin. Int J Pharm. 2013;455:169–181. | ||
Eriksson L, Johansson E, Kettaneh-Wold N, Wikstrom C, Wold S. Design of Experiments Principles and Applications. 3rd ed. Umea: Umetrics AB; 2008. | ||
Grund J, Koerber M, Walther M, Bodmeier R. The effect of polymer properties on direct compression and drug release from water-insoluble controlled release matrix tablets. Int J Pharm. 2014;469:94–101. | ||
Reza MS, Quadir MA, Haider S. Development of theophylline sustained release dosage form based on Kollidon SR. Pak J Pharm Sci. 2002;15(1):63–70. | ||
Takka S, Rajbhandari S, Sakr A. Effect of anionic polymers on the release of propranolol hydrochloride from matrix tablets. Eur J Pharm Biopharm. 2001;52:75–82. | ||
Lao LL, Peppas NA, Boey FYC, Venkatraman SS. Modeling of drug release from bulk-degrading polymers. Int J Pharm. 2011;418:28–41. | ||
Novoa GAG, Hainamaki J, Mirza S, et al. Physical solid-state and dissolution of sustained-release matrices of polyvinylacetate. Eur J Pharm Biopharm. 2005;59:343–350. | ||
Tomuta I, Leucuta SE. The influence of formulation factors on the kinetic release of metoprolol tartrate from prolong release coated minitablets. Drug Dev Ind Pharm. 2007;33:1010–1077. | ||
Pascoal ADSMR, da Silva PM, Coelho Pinheiro MN. Drug dissolution profiles from polymeric matrices: data versus numerical solution of the diffusion problem and kinetic models. Int Commun Heat Mass. 2015;61:118–127. | ||
Siepmann J, Peppas NA. Modeling of drug release from delivery systems based on hydroxypropyl methylcellulose (HPMC). Adv Drug Deliv Rev. 2012;64:163–174. |
 © 2017 The Author(s). This work is published and licensed by Dove Medical Press Limited. The full terms of this license are available at https://www.dovepress.com/terms.php and incorporate the Creative Commons Attribution - Non Commercial (unported, v3.0) License.
By accessing the work you hereby accept the Terms. Non-commercial uses of the work are permitted without any further permission from Dove Medical Press Limited, provided the work is properly attributed. For permission for commercial use of this work, please see paragraphs 4.2 and 5 of our Terms.
© 2017 The Author(s). This work is published and licensed by Dove Medical Press Limited. The full terms of this license are available at https://www.dovepress.com/terms.php and incorporate the Creative Commons Attribution - Non Commercial (unported, v3.0) License.
By accessing the work you hereby accept the Terms. Non-commercial uses of the work are permitted without any further permission from Dove Medical Press Limited, provided the work is properly attributed. For permission for commercial use of this work, please see paragraphs 4.2 and 5 of our Terms.