")
Back to Journals » Drug Design, Development and Therapy » Volume 10
Quantification of simvastatin in mice plasma by near-infrared and chemometric analysis of spectral data
Authors Fahmy U
Received 11 June 2016
Accepted for publication 1 July 2016
Published 5 August 2016 Volume 2016:10 Pages 2507—2513
DOI https://doi.org/10.2147/DDDT.S114826
Checked for plagiarism Yes
Review by Single anonymous peer review
Peer reviewer comments 2
Editor who approved publication: Prof. Dr. Wei Duan
Usama A Fahmy
Department of Pharmaceutics & Industrial Pharmacy, Faculty of Pharmacy, King Abdulaziz University, Jeddah, Saudi Arabia
Abstract: Time and cost saving is an essential requirement in pharmacokinetics and bioequivalence studies. The aim of this study is to use a simple, fast, and nondestructive near-infrared transmission spectroscopic method to quantify simvastatin (SMV) concentrations in mice plasma and also to improve SMV bioavailability by using alpha-lipoic acid as a carrier. Calibration curve was built at a concentration range of 10–250 ng/mL, and HPLC method was considered as a reference method. A partial least squares regression analysis model was used for method development, which gave less root mean square error cross-validation. Comparison of SMV concentrations obtained from both instruments showed no statistically significant differences between all the data. Near-infrared spectroscopy was utilized as a rapid, simple accurate method to quantify drug–plasma concentrations without need for any extraction protocols, and the significant effect of alpha-lipoic acid as a novel carrier to enhance SMV bioavailability is also addressed.
Keywords: alpha lipoic acid, bioavailability, non invasive, FTIR, pharmacokinetics
Introduction
Simvastatin (SMV) is an antihyperlipidemic drug that is used to decrease the risk of heart problems for those at high risk.1 It is taken orally and is commonly used for aged people.2 SMV undergoes excessive hepatic metabolism by which it is converted into other metabolites, thus making its determination in plasma difficult – only trace amounts could be detected. Determination of SMV in plasma requires many steps, such as derivatization with ferrocene boronic acid that requires GC–MS methods, which are not available in many laboratories.3 The UV–HPLC methods require the primary step of protein precipitation4 or an extraction procedure, which is a laborious process; moreover, most of the HPLC methods are expensive and time consuming or require special training in techniques and procedures. Near-infrared (NIR) spectroscopy has become an important method in the pharmaceutical industry for the characterization of new raw materials and has recently been used in determining some drugs in plasma5 and in other animal organs.6 The NIR technique has been successfully applied in chemical and pharmaceutical industries and in biological sample analyses. NIR has advantages over other techniques, as a fast, low cost, and sample destruction, and most importantly, it uses no specific reagents or extraction procedure prior to sample analysis.7
Utilization of recent and advanced NIR spectrometers with the associated software packages has led to the emergence of new applications to the NIR technique.8 The aim of this study is to utilize NIR technique for the quantification of SMV plasma levels after oral administration of SMV-loaded lipoic acid nanoparticles (NPs) using mice as an animal model.
Materials
SMV, alpha-lipoic acid (ALA), poly-vinyl alcohol (PVA), and hexane sulfonic acid were purchased from Sigma-Aldrich Co. (St Louis, MO, USA). Potassium dihydrogen orthophosphate and acetonitrile HPLC grade were purchased from Fluka (Germany).
Equipment
Vortex (IKA Works, Staufen in Breisgau, Germany), ultrasonic processor (VCX 750 series; Sonics, Milpitas, CA, USA), scanning electron microscope (SEM) (Phnom-ProG2, Eindhoven, the Netherlands), HPLC (1200 series; Agilent Technologies, Santa Clara, CA, USA) equipped with HP 1,200 diode array detector set at a wavelength of 238 nm, UltraCentrifuge (Z326K; HERMLE Labortechnik, Wehingen, Germany), freeze-dryer (Christ, Osterode am Harz, Germany), and NIR (Nicolet IZ10; Thermo Fisher Scientific, Waltham, MA, USA) were used.
Preparation of SMV-loaded lipoic acid NPs
SMV-loaded ALA NPs were prepared by the nanoprecipitation method, which was previously described by Bilati et al.9 Briefly, 150 mg of SMV and 150 mg of ALA were weighed and added to 3 mL of methanol; the mixture was vortexed for 1 minute to dissolve completely. Then, 10 mL of 1% PVA was added to the mixture dropwise during stirring, and then the formed suspension was subjected to ultrasonication for 5 minutes with 55% amplitude power. The formed NPs were added to 25 mL of 0.5% PVA solution and stirred. After 20 minutes, the formed NPs were rotavapored by rotavapor (Essen, BUCHI, Germany) to evaporate the methanol. The NPs were washed three times with distilled water.
Animal preparation
Male mice weighing 30–40 g, supplied by the Animal House Laboratory, Faculty of Pharmacy, King Abdulaziz University, Jeddah, Saudi Arabia, were used in this study. Animals were adapted for 16 days before the experiment in our animal facility. They were maintained on a 12-hour light–dark cycle. The room temperature was maintained at 22°C±2°C. Animal handling and experimental protocol were approved by the Unit of Biomedical Ethics, Faculty of Medicine, and King Abdulaziz University (date: December 15, 2015). The formula was subjected to pharmacokinetic study in plasma in comparison with raw SMV. SMV and SMV–ALA NPs were suspended in carboxymethyl cellulose (0.5%) and used in a single oral dose of 2 mg/kg. Forty-two mice were divided equally into two groups. The first group was administered SMV, while the second group was administered SMV–ALA NPs. Three animals from each group were lightly anesthetized with ether and subjected to blood sampling at 1 hour, 2 hours, 4 hours, 6 hours, 8 hours, 12 hours, and 24 hours after either treatment. Animals were sacrificed at the assigned time points immediately after blood withdrawal. Plasma was kept at −80°C for evaluation of SMV concentrations.
Preparation of SMV and ALA stock solution for calibration curve
An accurately weighed amount of SMV and ALA (100 mg) was transferred into a 100 mL volumetric flask, and then 10 mL was diluted to 100 mL volume using distilled water to reach a final concentration of 100 μg/mL.
Preparation of standard SMV–ALA plasma solutions
Spiked SMV–ALA plasma samples were prepared by adding aliquots of SMV–ALA dilutions to 0.5 mL of blank plasma to obtain a final concentration range of 250–10 ng/mL for calibration analysis. Seven concentrations were allocated, with seven measurement replicates for each.
Analysis of SMV by HPLC
Plasma SMV levels were quantified using a validated HPLC method described by Tan et al.4 Thermo C18 (250×4.6 mm2, 5 μm particle size) column was used, the mobile phase was composed of 0.02 M disodium hydrogen phosphate and 0.005 M sodium hexane sulfonic acid dissolved in distilled water as an aqueous phase and acetonitrile as an organic phase with concentration (75:25, v/v) aqueous to organic phase, respectively; the flow rate was 1.2 mL/min. The analysis was carried out at 22°C. Sample extraction procedure was as follows: 0.5 mL of the plasma was subjected to liquid–liquid extraction with 3 mL of cyclohexane–dichloromethane (3.5:1, v/v) and vortexed for 5 minutes; the organic layer was separated and evaporated under N2; and the residue was dissolved in 50 μL of the mobile phase. Samples were stored at 4°C until injection. For HPLC, the diode array detector was adjusted at 238 nm.
Estimation of SMV by NIR
Sample preparation
SMV plasma samples (0.5 mL), either free or spiked, were frozen at −80°C for 12 hours and then kept on freeze-dryer shelves (Christ) at 0.05 bar vacuum and −50°C temperature for 24 hours.
Selection of wavelength range
NIR frequency region that revealed the best drug signal was selected for the calibration after comparing absorbance spectra of SMV (free), plasma (free), and SMV plasma samples.
Chemometric analysis
All chemometric modeling analyses were performed using the TQ Analyst software (tenth edition; Thermo Fisher Scientific). Various pretreatment routines such as developing a calibration model are essential processes in NIR analysis before processing data. Partial least squares (PLS) regression analysis was used to build a calibration model. It is commonly used to correct light scatters and eliminate random fluctuations of the absorption spectra. The root mean square error of cross-validation was used to select the appropriate number of PLS factors (principal components) for each model.10
In vivo animal study
Mice were divided into two groups, each consisting of 21 animals. The first group received an SMV suspension of 2 mg/kg, and the second group received a suspension containing the formulated SMV–ALA NPs with a dose equivalent to 2 mg/kg SMV for each. Blood samples (1 mL) were collected in heparinized tubes prior to drug administration at 1 hour, 2 hours, 4 hours, 6 hours, 8 hours, 12 hours, and 24 hours after dosing. Samples were centrifuged at 3,000 rpm for 10 minutes, and then the obtained sera were stored at −80°C for further use.
SMV pharmacokinetic analysis
The main pharmacokinetic parameters, maximum plasma concentration (Cmax), time required to reach maximum plasma concentration (Tmax), and area under the plasma concentration time–curve from time 0 hour to 24 hours (AUC0–24), were calculated by the use of PK solver software (Version 10; Nanjing, People’s Republic of China). The results were expressed as mean ± SD. The pharmacokinetic data were tested by analysis of variance followed by Tukey’s multiple comparison test; the confidence level was set at P=0.05 (GraphPad Prism 6; GraphPad Software, Inc., La Jolla, CA, USA).
Results and discussion
SMV-loaded NP preparation and evaluation
Many trials were done using different surfactants, such as Tween 20, Tween 80, and sodium lauryl sulfate, and different solvents, such as ethanol, chloroform, and dichloromethane, with different ratios of SMV to lipoic acid. The smallest size with the highest entrapment efficiency was achieved by SMV:ALA (1:1). SMV and ALA NP average diameters were calculated from SEM images shown in Figure 1. The SEM images revealed that all NPs were spherical in shape and ~150.7 nm in diameter. Entrapment efficiency of SMV–ALA NPs was 55.57%, which is relatively low as a result of the high elasticity of lipoic acid, which forms small lumps after evaporation of methanol; thus, free SMV was lost during washing.
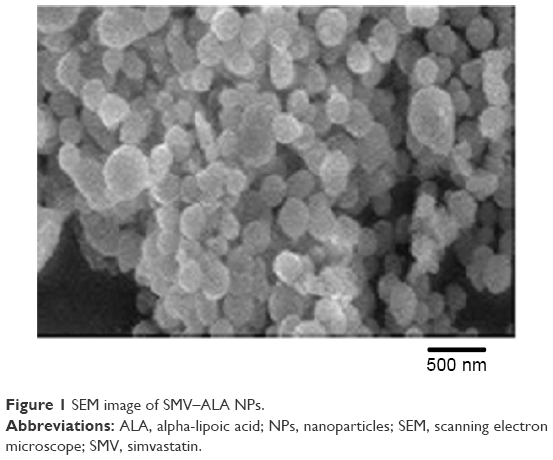 | Figure 1 SEM image of SMV–ALA NPs. |
HPLC analysis and validation
The SMV elution peak was at 19.76 minutes, while ALA peak was at 5.58 minutes. The results of method validation were qualified to determine SMV in mice plasma. Calibration curve showed mean R2 value of 0.9963. The regression equation Y=1.00132x-3.1012 revealed a good relationship between peak area and SMV concentration in the test range of 10–250 ng/mL, and the average recovery was 101.21% with 1.12% relative standard deviation (n=6).
NIR assay
The spectrum for free SMV and ALA is shown in Figure 2A. It is clear that SMV exhibits characteristic signal even in the presence of plasma components and ALA. This area is mainly related to overtone C–H stretching (CH3 and CH2 groups) for SMV.6 All raw spectra are represented in Figure 2B.
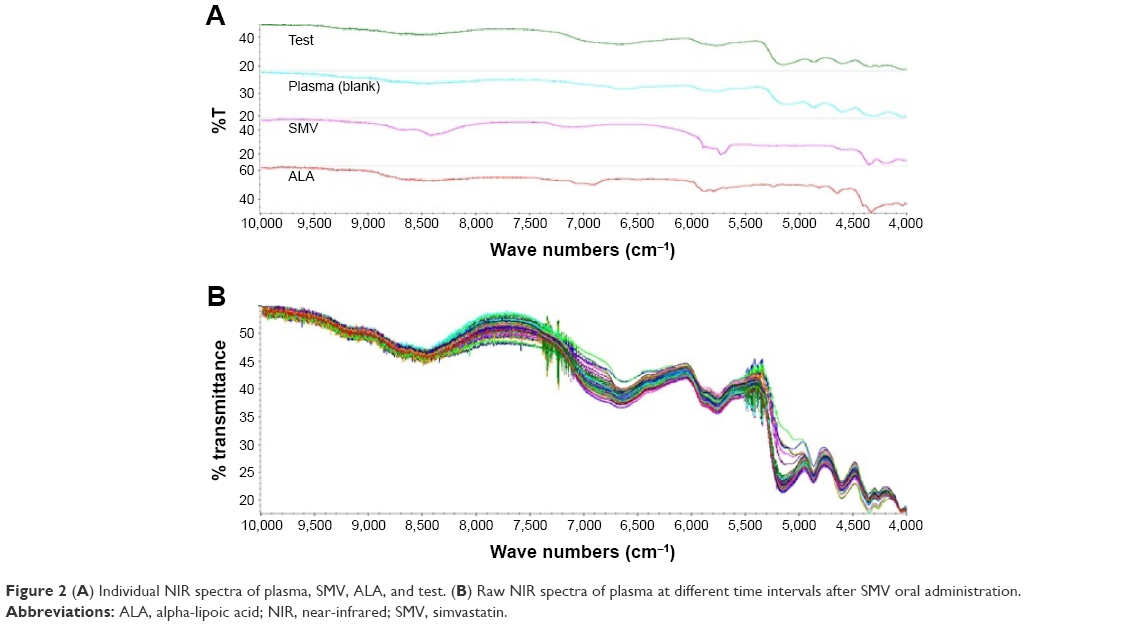 | Figure 2 (A) Individual NIR spectra of plasma, SMV, ALA, and test. (B) Raw NIR spectra of plasma at different time intervals after SMV oral administration. |
Chemometric analysis
Chemometric analysis is a statistical model, which is performed using the TQ Analyst software; the required component produces measurable peaks in the NIR spectrum in a sample mixture, but the peaks’ constituents strongly overlap.11 The PLS model can measure the specified sample components when the relationship between the concentration and absorption is nonlinear; the relationship between component concentration and peak data may be not achieved as a result of physical or chemical mixture interaction.12 These interactions may turn or extend the peak height. 20 mg from each lyophilized sample was weighed accurately and placed on a sample set of the NIR instrument, and all spectra were measured under optimal condition, resolution of 4 cm−1 and 32 scans; the scan range was from 4,000 cm−1 to 10,000 cm−1, the NIR instrument was flushed with N2, and the background was tested to avoid CO2 and humidity. The raw spectra of SMV in mice were recorded. NIR data were randomly split into calibration set (49 samples) and plasma sample test set (42 samples). The visual analysis of the second derivative spectra gave peaks and dips with an indication at the areas with wave number ranges of 4,256–4,300 cm−1 and 5,902–5,890 cm−1. The y-axis values change in the same way as the concentration of the drug, quantified through HPLC analysis, in the collected blood samples. At the selected ranges, the spectra showed a characteristic dip, which provides selectivity of the method. Raw SMV NIR spectrum revealed prominent peaks at the wave number range of 4,256–4,300 cm−1. This was in agreement with Porfire et al.6 The FT-NIR band obtained at 5,902–5,890 cm−1 could be as a result of the combination of SMV and ALA.
Wavelength ranges 4,256–4,300 cm−1 and 5,902–5,890 cm−1 were utilized in the PLS regression models. To detect the similarity between values obtained through HPLC analysis (reference values) and the calibration model values, root mean square error of prediction was calculated. Additionally, root mean square of calibration and root mean square error of cross validation were calculated. The PLS calibration model showed the root mean square of calibration, root mean square error of cross validation, and root mean square error of prediction values of 11.19 ng, 12.12 ng, and 12.51 ng, respectively. Figure 3 shows the calibration curve for the SMV concentrations obtained by The HPLC and the NIR which confirm the closeness of measured concentrations by the two instruments with R2 value 0.9988. PLS calibration model of the plasma samples fortified with SMV also showed comparable results, with a straight line having regression equation 1.05×, intercept −3.11, and R2 value of 0.99.
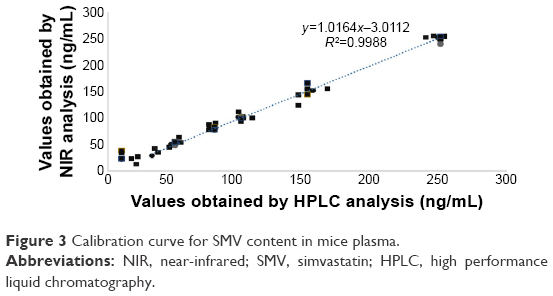 | Figure 3 Calibration curve for SMV content in mice plasma. |
Figure 4 shows the percentage of relative errors. It can be noted from this figure that the highest concentrations are associated with the lowest relative errors and vice versa; accordingly, linearity is established in the measurements. If we consider all the 42 samples obtained between 1 hour and 24 hours, then the average relative error is only 17.32%. Relative errors <±20% are acceptable for quality control standards.13 In addition, to check for any significant difference in the concentration of SMV in plasma samples predicted and the ones determined using HPLC method, paired t-test was carried out. The P-value obtained was 0.31, which indicated that HPLC method and FT-NIR, PLS model data showed no significant difference in the values obtained for the determination of SMV in plasma. NIR model can provide measures of the SMV concentration in the mice plasma within 24 hours. As shown in Table 1, NIR analysis data revealed the presence of SMV in the blood (0.47 ng/mL) in the case of the raw SMV group. Accordingly, this model could be utilized as a more sensitive method compared with HPLC. The low sensitivity could be attributed to the recovery process of SMV from plasma. The data of oral administration for raw SMV group showed that plasma SMV concentrations reached a maximum at 1 hour. Later, the drug gradually concentrated and reached a very low concentration within 12 hours after drug administration declined. However, in the medicated group, it became obviously clear that the drug concentration in plasma continued to increase and reached a maximum at 6.66 hours and gradually decreased at 24 hours.
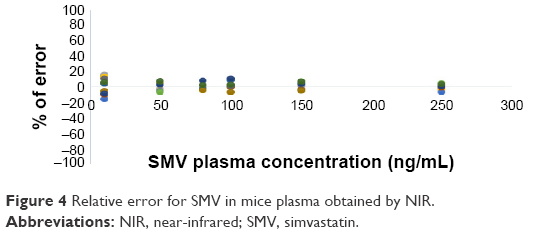 | Figure 4 Relative error for SMV in mice plasma obtained by NIR. |
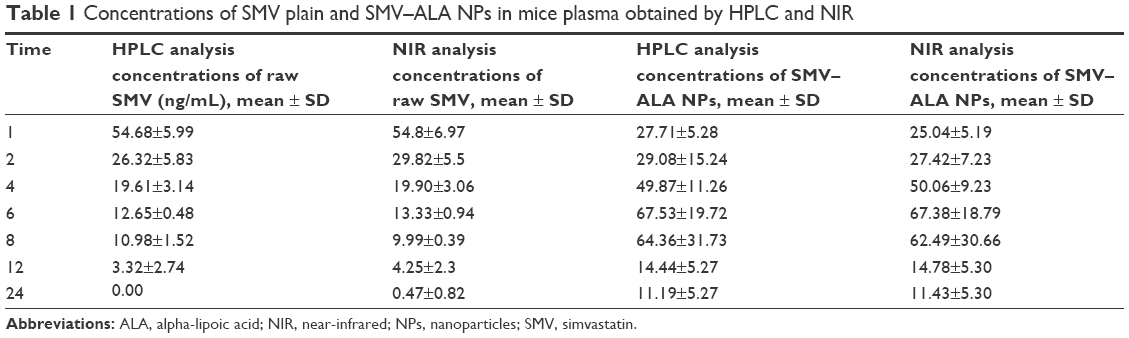 | Table 1 Concentrations of SMV plain and SMV–ALA NPs in mice plasma obtained by HPLC and NIR |
Pharmacokinetics
The pharmacokinetic data of the prepared formula are shown in Table 2. According to the obtained data, absorption of raw SMV achieved maximum plasma concentration within 1 hour, whereas the Tmax for the SMV–ALA NPs was 6.66±1.15 hours. The results of Cmax showed 54 ng/mL for raw SMV group and 74 ng/mL for SMV–ALA NP group. The AUC0–24 was increased approximately threefold for the SMV–ALA NP group in comparison with the raw SMV group. These pharmacokinetic data could be explained by an increase in SMV absorption, which may be achieved by one of the following three possible uptake mechanisms in oral absorption: 1) paracellular pathway uptake, 2) via transporters in epithelial cells and intracellular uptake,14–16 and 3) lymphatic uptake via the M cells and the Peyer patches.17 Moreover, it has been shown that the small size of NPs is able to increase the surface area, which coats the gastrointestinal mucosa, thereby increasing the area of the intestine in contact with the SMV and, consequently, the drug gradient concentration toward the blood.18,19 The increase in the Tmax compared with raw SMV revealed the NPs for controlled-release effect.
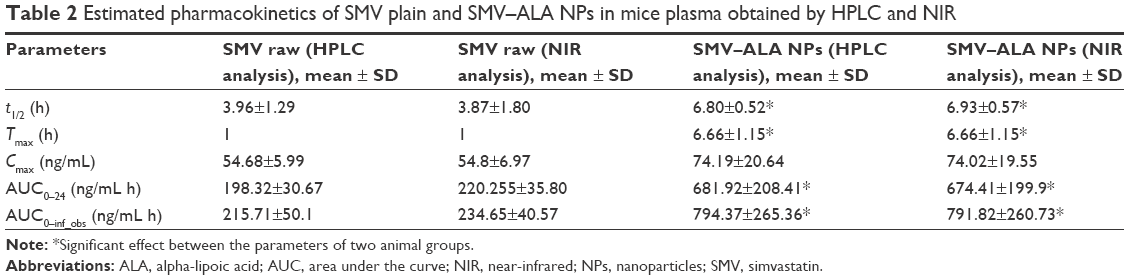 | Table 2 Estimated pharmacokinetics of SMV plain and SMV–ALA NPs in mice plasma obtained by HPLC and NIR |
Conclusion
In the present study, ALA was found to be a good carrier for SMV, which enhances its bioavailability threefold compared with raw SMV for oral administration. In addition, it was verified that NIR spectroscopy can be used for determining SMV concentrations in mice plasma rapidly and accurately. The PLS-NIR model was compared with the current HPLC method statistically, and data revealed no significant difference between the two methods. Thus, the fast and low-cost NIR combined with chemometrics could be a valuable tool for this purpose. Furthermore, a synergistic effect of SMV combined with ALA is predicted, which requires more clinical investigations to confirm this finding.
Acknowledgments
This work was supported by the Deanship of Scientific Research (DSR), King Abdulaziz University, Jeddah, under grant no (166-114-D1436). The author, therefore, gratefully acknowledges the DSR technical and financial support.
Disclosure
The author reports no conflicts of interest in this work.
References
Coruh Ú, Úzkan SA. Determination of the antihyperlipidemic simvastatin by various voltammetric techniques in tablets and serum samples. Pharmazie. 2006;61(4):285–290. | ||
Yu L, Xiang B. Quantitative determination of acyclovir in plasma by near infrared spectroscopy. Microchem J. 2008;90(1):63–66. | ||
Wu Z, Ouyang G, Shi X, Ma Q, Wan G, Qiao Y. Absorption and quantitative characteristics of C – H bond and O – H bond of NIR 1. Opt Spectrosc. 2014;117(5):703–709. | ||
Tan L, Yang LL, Zhang X, Yuan YS, Ling SS. [Determination of simvastatin in human plasma by high performance liquid chromatography]. Se Pu. 2000;18(3):232–234. | ||
Collins R, Armitage J, Parish S, Sleight P, Peto R; Heart Protection Study Collaborative Group. Effects of cholesterol-lowering with simvastatin on stroke and other major vascular events in 20 536 people with cerebrovascular disease or other high-risk conditions. Lancet. 2004; 363(9411):757–767. | ||
Porfire A, Muntean D, Achim M, Vlase L, Tomuta I. Simultaneous quantification of simvastatin and excipients in liposomes using near infrared spectroscopy and chemometry. J Pharm Biomed Anal. 2015; 107:40–49. | ||
Mohamed AI, Ahmed OA, Amin S, Elkadi OA, Kassem MA. In-vivo evaluation of clindamycin release from glyceryl monooleate-alginate microspheres by NIR spectroscopy. Int J Pharm. 2015;494(1): 127–135. | ||
Miyamoto-shinohara Y, Sukenobe J, Imaizumi T, Nakahara T. Survival of freeze-dried bacteria. J Gen Appl Microbiol. 2008;54(1):9–24. | ||
Bilati U, Allémann E, Doelker E. Development of a nanoprecipitation method intended for the entrapment of hydrophilic drugs into nanoparticles. Eur J Pharm Sci. 2005;24(1):67–75. | ||
Choi HS, Ipe BI, Misra P, Lee JH. Biodistribution of NIR fluorescent. Nano. 2009;9:12–17. | ||
Ajayakumar PV, Chanda D, Pal A, Singh MP, Samad A. FT-NIR spectroscopy for rapid and simple determination of nimesulide in rabbit plasma for pharmacokinetic analysis. J Pharm Biomed Anal. 2012; 58(1):157–162. | ||
Afara I, Singh S, Oloyede A. Application of near infrared (NIR) spectroscopy for determining the thickness of articular cartilage. Med Eng Phys. 2013;35(1):88–95. | ||
The United States Pharmacopeia, 25 th Revision. Rockville: U.S. Pharmacopocia Convention; 2002. | ||
El-Helw AR, Fahmy UA. Improvement of fluvastatin bioavailability by loading on nanostructured lipid carriers. 2015;10(1):5797–5804. | ||
Li J, Huang W, Chen L, et al. Variable selection in visible and near-infrared spectral analysis for noninvasive determination of soluble solids content of ‘Ya’ pear. Food Anal Methods. 2014;7(9): 1891–1902. | ||
Hosny KM, Aljaeid BM. Sildenafil citrate as oral solid lipid nanoparticles: a novel formula with higher bioavailability and sustained action for treatment of erectile dysfunction. Expert Opin Drug Deliv. 2014;11(7):1015–1022. | ||
Fahmy UA. Nanoethosomal transdermal delivery of vardenafil for treatment of erectile dysfunction: optimization, characterization, and in vivo evaluation. Drug Des Devel Ther. 2015;9:6129–6137. | ||
El-Say KM, Ahmed TA, Badr-Eldin SM, Fahmy U, Aldawsari H, Ahmed OA. Enhanced permeation parameters of optimized nanostructured simvastatin transdermal films: ex vivo and in vivo evaluation. Pharm Dev Technol. 2014;7450(8):919–926. | ||
Zidan AS, Hosny KM, Ahmed OA, Fahmy UA. Assessment of simvastatin niosomes for pediatric transdermal drug delivery. Drug Deliv. 2014;11:1–14. |
 © 2016 The Author(s). This work is published and licensed by Dove Medical Press Limited. The full terms of this license are available at https://www.dovepress.com/terms.php and incorporate the Creative Commons Attribution - Non Commercial (unported, v3.0) License.
By accessing the work you hereby accept the Terms. Non-commercial uses of the work are permitted without any further permission from Dove Medical Press Limited, provided the work is properly attributed. For permission for commercial use of this work, please see paragraphs 4.2 and 5 of our Terms.
© 2016 The Author(s). This work is published and licensed by Dove Medical Press Limited. The full terms of this license are available at https://www.dovepress.com/terms.php and incorporate the Creative Commons Attribution - Non Commercial (unported, v3.0) License.
By accessing the work you hereby accept the Terms. Non-commercial uses of the work are permitted without any further permission from Dove Medical Press Limited, provided the work is properly attributed. For permission for commercial use of this work, please see paragraphs 4.2 and 5 of our Terms.