")
Back to Journals » International Journal of Nanomedicine » Volume 13
Probing the intracellular refractive index and molecular interaction of gold nanoparticle in HeLa cells using single particle spectroscopy
Authors Mohsin ASM , Salim MB
Received 28 May 2018
Accepted for publication 6 August 2018
Published 4 October 2018 Volume 2018:13 Pages 6019—6028
DOI https://doi.org/10.2147/IJN.S175523
Checked for plagiarism Yes
Review by Single anonymous peer review
Peer reviewer comments 3
Editor who approved publication: Dr Thomas Webster
Abu S M Mohsin,1 Mariam B Salim2
1Centre for Micro-Photonics, Department of Physics, Swinburne University of Technology, Melbourne, VIC 3122, Australia; 2Electrical and Telecommunication Engineering, Swinburne University of Technology, Melbourne, VIC 3122, Australia
Background: We have introduced a novel method to quantify the intracellular refractive index (RI) of living cells and determine the molecular interaction of two interacting molecules using single particle spectroscopy. The advantages of this proposed technique over fluorescence-based imaging techniques is that it does not require any contrasting agent and it does not blink and bleach. Instead, our technique provides a non-destructive, non-invasive, high-resolution imaging of live cells.
Methods: To verify our technique, we initially tested our approach for a dielectric medium where gold nanoparticles (AuNPs) were embedded in a polyvinyl alcohol (PVA) matrix, which was then extended to the cellular environment. In the dielectric medium, we identified the single particle and dimer and determined the interparticle distance of AuNPs using confocal laser scattering microscopy. We also determined the single particle RI from dark-field scattering microscopy images, which was confirmed with Mie theory and finite-difference time-domain (FDTD) simulated results. The single particle spectroscopy and microscopy technique was then extended to determine the intracellular RI and biomolecular interaction inside living cells using hyperspectral imaging and dark-field scattering microscopy.
Results: The novelty of the paper lies in the demonstration of a direct and accurate method to probe the intracellular RI and molecular interaction focused on single particle analysis whereas previous demonstrations were based on AuNP ensembles. Optically acquired single particle and dimer images was verified by correlated SEM images also optical spectrum with analytical models and FDTD simulations for both the dielectric and cellular environment. We reported the interparticle distance of AuNPs inside HeLa cells and intracellular refractive index, which was also confirmed with Mie Theory and extensive FDTD simulations.
Conclusion: Moreover, we believe that our in-depth plasmonic NP-based alternate imaging technique will provide a new insight in monitoring cellular dynamics and tracking the targeted NPs within live cells, enabling us to use plasmonic NPs as an intracellular biosensor.
Keywords: intracellular refractive index, molecular interaction, dimerization, single particle spectroscopy, biosensor
Introduction
Plasmonic nanoparticles (NPs) are superior contrasting agents compared with alternative markers.1 Their absorption and scattering cross-sections are much higher than chemical fluorophore and quantum dots.2–4 Moreover, they are very stable and non-toxic, so they do not blink or bleach. These unique properties make NPs ideal for the investigation of various biologic interactions.2,5–7
Recently, single particle tracking has enabled significant scientific progress in investigating biologic processes by tracking the movement of individually labelled molecules with high spatial and temporal resolution.1,8,9 Also, plasmon coupling offers valuable additional information about the interparticle separation between co-localization, which enables us to experimentally probe the interaction between two interacting molecules.7,8,10–16
The refractive index (RI) of biologic cells plays a crucial role in many applications such as biophysics, biochemistry, and biomedicine to monitor the characteristics of living cells. The living cells contain numerous organelles with different RIs which could alter by any change in the cellular size, nucleus size, protein content, and biologic parameter. Thus, the measurement of RIs could be useful for quantitative study of cellular dynamics,17–19 medical diagnosis and identifying diseases.20,21 Several qualitative and quantitative techniques have been deployed to determine the RIs of biologic cells. Qualitative techniques such as phase contrast microscopy22 and differential interference microscopy23 allow spatial distribution visualization of RIs for individual cells or intracellular organelles in high contrast cellular imaging. Recently, several quantitative techniques have been developed to determine the integral, local, or average RI of single living cells or multiple cells using digital holographic microscopy,17,24,25 optical trapping technique,26 integrated chip technique,27 Hilbert phase microscopy,28 tomographic phase microscopy,29 tomographic bright field microscopy,30 and several interferometry techniques (eg, Rayleigh refractometer, Mach Zehnder, Michelson and Fabry-Perot interferometers).31–33
However, all these conventional methods have their inevitable disadvantages. A major disadvantage of the qualitative technique is that the phase shift information is mixed with intensity information, which makes it difficult to quantify the quantitative information from the acquired images.34 Also, while the interferometric method can determine the RI of homogenous mediums such as liquids and particles, it cannot be used for inhomogeneous matters such as biologic cells.
Additionally, over the past few decades, various microscopy-based techniques such as fluorescence resonance energy transfer (FRET),35,36 image correlation microscopy, (ICM)37 fluorescence correlation spectroscopy,38–43 image correlation spectroscopy,44–48 and fluorescence lifetime imaging (FLIM)35,36,49,50 have been introduced to investigate the molecular activities and interactions at submicroscopic resolution without destroying cells. However, all these techniques have various limitations that are not suitable for living cell imaging. Among them, FRET is constrained to detecting two closely separated (<5 nm) molecules of different types,36,51 while ICM is confined to submicroscopic imaging. Moreover, FRET and ICM are also critically limited by photo bleaching. Unfortunately, FLIM of green fluorescent proteins can only determine the RI in the order of 3 μm length scales. It is also subjected to photo bleaching and has the fleeting lifespan of fluorescence tags.35,36,49,50
To address the deficiencies of the previously discussed techniques, plasmonic NP-based single molecule detection and spectroscopy have been introduced to identify the single molecules which have been utilized to probe the RI of AuNPs inside biologic cells. In this paper, we demonstrate a novel technique which could determine the intracellular RI of biologic cells providing a two-order magnitude better resolution comparing to FLIM based methods. Additionally, the demonstrated method could quantify the accurate interparticle distance between two interacting molecules in cellular environment.
In our study, we performed confocal laser scattering microscopy on a dielectric medium. Gold nanospheres (AuNSs) 80 nm in diameter were dispersed on PVA matrix, spin coated onto a glass slide and then imaged through a 700−900 nm wavelength tunable ultrafast-Femto second laser (Tsunami®; Spectra-Physics, Santa Clara, CA, USA). To confirm the existence of the single particle and cluster, polarization and wavelength dependent single particle spectroscopy and point spread function (PSF) analysis was performed on the dielectric sample. The acquired optical images were correlated with scanning electron microscopy (SEM) images of the same location to determine the existence of single particles and clusters. We also extracted the RI from the experimentally acquired single particle images and validated the results with an analytical model and finite-difference time-domain (FDTD) simulated results. After using single particle spectroscopy on the dielectric sample, we then introduced the technique on cell samples where the pegylated (PEG) AuNSs were attached to HeLa cells. We acquired hyperspectral and dark-field scattering microscopy imaging of live cells and images where the PEG AuNSs were taken up by HeLa cells. Similar to the dielectric sample, single particle spectroscopy and PSF analysis was performed to identify the monomer and cluster. The RI of PEG AuNSs inside HeLa cells was extracted from the experimentally captured images and was finally verified with Mie theory and FDTD simulated results. The extracted RI values were used to simulate dimer and higher order cluster via FDTD simulation, which was compared with the experimentally extracted spectrum to determine the interparticle separation between two macromolecules at furthest and closest distances. The proposed technique will be helpful to probe the RI of PEG AuNPs inside HeLa cells and to quantify the interparticle distance, which will provide deeper insight into the subcellular interaction and signaling activities in the unexplored region.
Analytical models and numerical simulations using FDTD
In our study, we calculated the scattering cross-section of 80 nm diameter AuNSs using the Mie theory and FDTD simulation (Figure 1A). To explore the plasmon coupling of AuNS dimers, we used FDTD Solutions 7.5 (Lumerical Inc., Vancouver, BC, Canada) (Figure 2A). A total-field scattered field source with its wavelength ranging from 400−1,000 nm was used, and a grid resolution of 0.5 nm was chosen to obtain accurate results. The dielectric function of AuNPs was used from Johnson and Christy’s measurement and amended for size effect (surface scattering and radiation damping).52 The source direction was set along the axis of AuNPs. RI n=1.33 was used, and this was further altered to match the simulated spectra with the experimental spectra. Furthermore, we determined the single particle and dimer spectra using FDTD simulation and verified the simulated results with the Mie theory calculated spectra (Figure 1A).
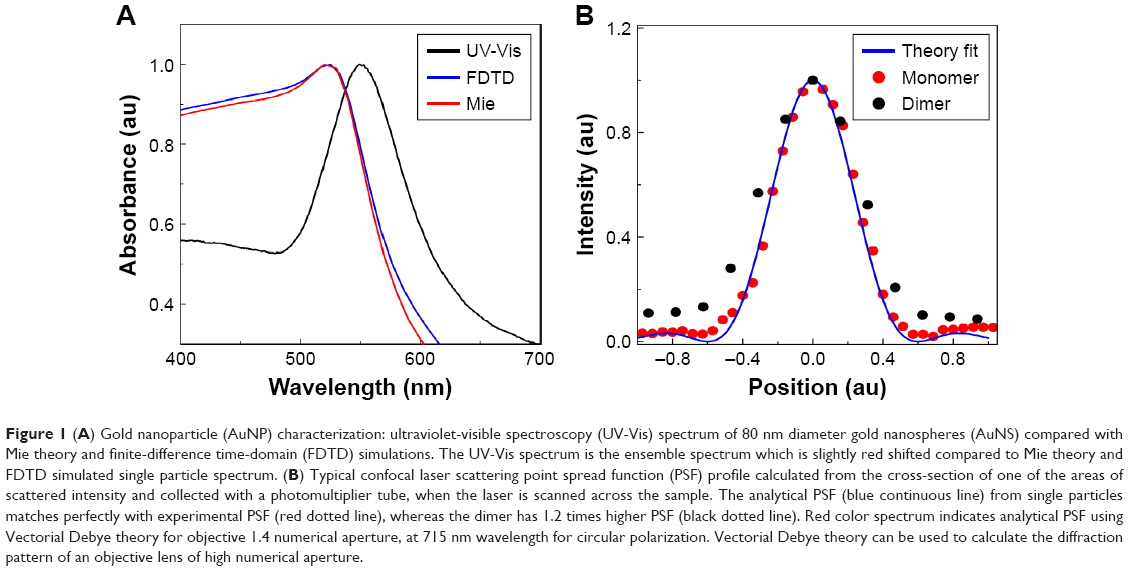 | Figure 1 (A) Gold nanoparticle (AuNP) characterization: ultraviolet-visible spectroscopy (UV-Vis) spectrum of 80 nm diameter gold nanospheres (AuNS) compared with Mie theory and finite-difference time-domain (FDTD) simulations. The UV-Vis spectrum is the ensemble spectrum which is slightly red shifted compared to Mie theory and FDTD simulated single particle spectrum. (B) Typical confocal laser scattering point spread function (PSF) profile calculated from the cross-section of one of the areas of scattered intensity and collected with a photomultiplier tube, when the laser is scanned across the sample. The analytical PSF (blue continuous line) from single particles matches perfectly with experimental PSF (red dotted line), whereas the dimer has 1.2 times higher PSF (black dotted line). Red color spectrum indicates analytical PSF using Vectorial Debye theory for objective 1.4 numerical aperture, at 715 nm wavelength for circular polarization. Vectorial Debye theory can be used to calculate the diffraction pattern of an objective lens of high numerical aperture. |
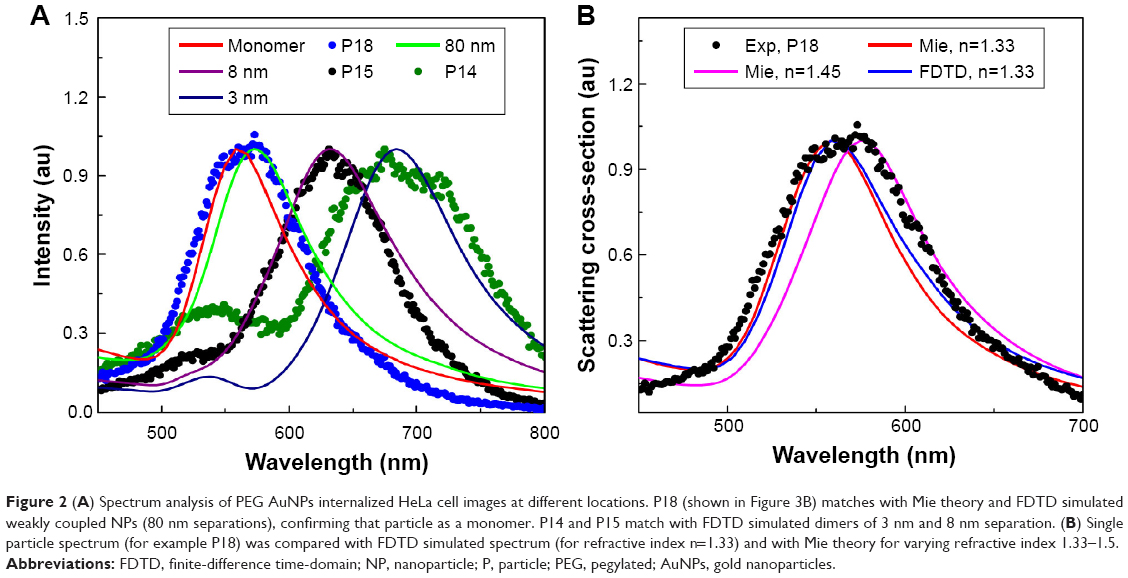 | Figure 2 (A) Spectrum analysis of PEG AuNPs internalized HeLa cell images at different locations. P18 (shown in Figure 3B) matches with Mie theory and FDTD simulated weakly coupled NPs (80 nm separations), confirming that particle as a monomer. P14 and P15 match with FDTD simulated dimers of 3 nm and 8 nm separation. (B) Single particle spectrum (for example P18) was compared with FDTD simulated spectrum (for refractive index n=1.33) and with Mie theory for varying refractive index 1.33–1.5. |
We also investigated the plasmon coupling of 80 nm diameter AuNS dimers using FDTD simulation for several interparticle distances (Figure 2A) and found the red shift in surface plasmon resonance (SPR) peak with decreasing interparticle distance, which is in agreement with the framework of excitation coupling theory.2,7,53,54 The amount of red shift was modelled using the universal plasmon ruler equation, which is comparable to the published results of Kat et al55 and Funston et al.56 It can be observed that plasmon coupling obeys an exponential relationship with the particle separation at weak coupling region, which is known as the universal plasmon ruler equation. However, plasmon resonance peak changes dramatically for small separations in the strong coupling region and matches more closely with a modified plasmon ruler equation.55 The experimentally acquired AuNP spectra was compared with FDTD simulated spectra, which was useful to determine the AuNP separations in dielectric and biologic samples (Figure 2B).
Experimental details
Single particle detection for dielectric samples
Dielectric sample preparation
The 80 nm diameter AuNSs used in this study were purchased from NanoSeedz™ Ltd (Ma On Shan, Hong Kong). The AuNP solution was dispersed 1:1 into an aqueous solution of 2% PVA (molecular weight 36 kDa) to prepare optical density one (1.2×1.010 AuNP/mL) and spin-coated onto a co-ordinate marked fabricated (5 nm Ti layer) grid attached to a glass slide, with the spin parameters adjusted to produce an approximately 150 nm thick nanorod or PVA film. The use of a PVA layer ensured that the NSs remained attached to the grid during multiple SEM sessions and due to the co-ordinate marked grid, we could correlate the optical and SEM images accurately. The ultraviolet-visible (UV-Vis) spectra of 80 nm diameter AuNSs compared with the Mie theory and FDTD simulations are shown in Figure 1A.
Experimental setup for dielectric sample
To determine the RI inside cells, the single particle and cluster spectrum must be identified. As a simplistic approach, initially we identified the single particle and cluster in a dielectric medium, where the AuNSs were embedded in PVA matrix (Figure 3A). Afterwards, we identified them in biologic samples where the AuNSs were embedded in HeLa cells (Figure 3B). In both cases, we performed hyperspectral and dark-field scattering and recorded the single particle and cluster spectrums which were verified with analytical spectra calculated via Mie theory and FDTD simulated spectra.
 | Figure 3 (A) Experimental dark-field scattering microscopy images of 80 nm diameter AuNSs in dielectric medium; and (B) PEG AuNPs embedded in HeLa cells. Distinct color circles represent monomer (P18) and cluster (P14 and P15), and intensity variation is due to various separations. (C) Confocal laser scattering images of PEG AuNPs HeLa cell sample, attached with dye molecules. The red spherical borders are cell membranes, and small colorful spherical particles (eg, red, yellow and green, etc.) are AuNPs. |
The prepared dielectric sample was irradiated with a Tsunami®, Ti:Sapphire femtosecond tunable (700–1,000 nm) laser (Spectra-Physics) and the sample was focused using a 1.4 numerical aperture oil immersion objective lens (Olympus, Sydney, NSW, Australia) and a 50 μm pinhole (Thorlabs Inc., Newton, NJ, USA). The sample was mounted onto a piezo stage for scanning and controlled using LabVIEW (National Instruments™, Auckland, New Zealand). An oil immersion medium was used to match the RI to ensure that no background signal was coming from the interface. The resulting scattered NPs were collected using a photomultiplier tube (Oriel® Instruments, Newport Corporation, Irvine, CA, USA) (Figure 4A). A quarter wave plate was used to produce circularly polarized light, and a linear polarizer was used to monitor the polarization dependency at a specific wavelength (Figure 5A).
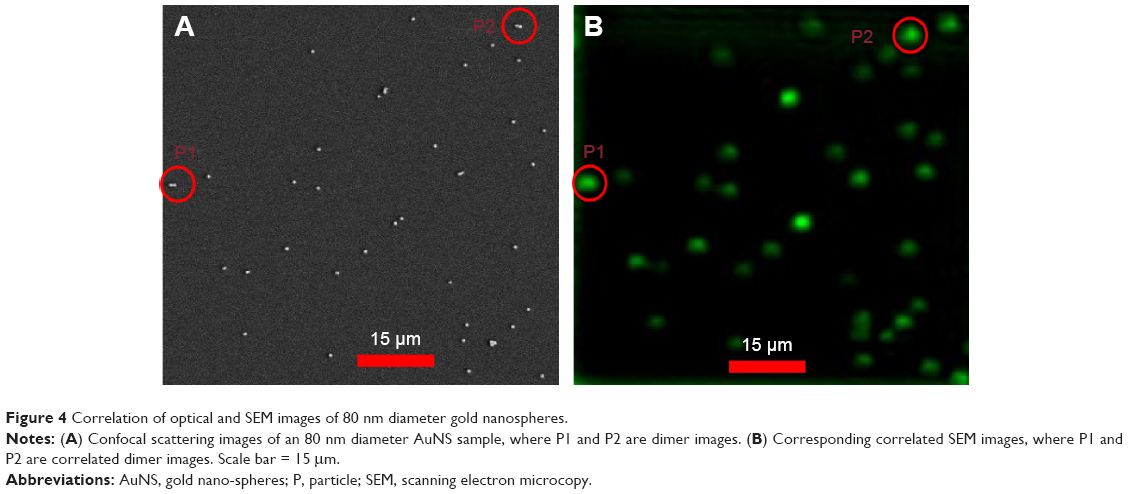 | Figure 4 Correlation of optical and SEM images of 80 nm diameter gold nanospheres. |
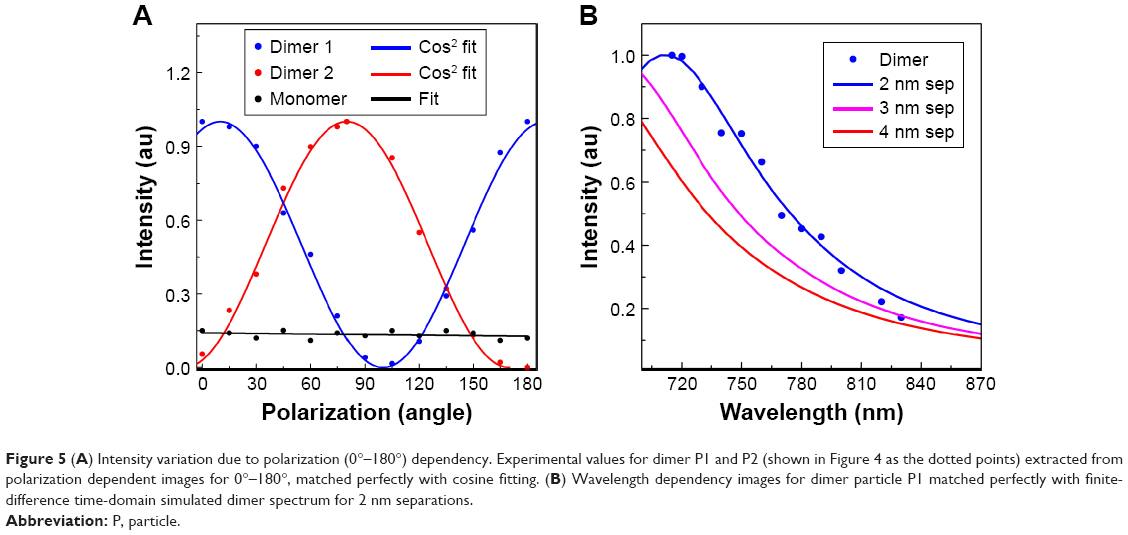 | Figure 5 (A) Intensity variation due to polarization (0°–180°) dependency. Experimental values for dimer P1 and P2 (shown in Figure 4 as the dotted points) extracted from polarization dependent images for 0°–180°, matched perfectly with cosine fitting. (B) Wavelength dependency images for dimer particle P1 matched perfectly with finite-difference time-domain simulated dimer spectrum for 2 nm separations. |
Single particle and dimer detection in dielectric samples
To confirm the existence of single particles, we calculated the PSF and line shape of scattering spectra. For the dielectric samples, we also conducted the polarization, wavelength spectroscopy and performed the correlation study between the acquired optical and SEM images. The PSF of the emitted particle was obtained using Vectorial Debye theory57 (Figure 1B). PSF describes the response of an imaging system to a point source or point object. The scattering spectrum produced a convolution of the focal spot and AuNSs in the sample which acts as a point source. Exploiting the convolution between Gaussian beam and a point scatterer, the Gaussian spot profile of the focusing object, and therefore the PSF of that specific object, can be determined which will provide information about the number of particles within a focal volume57 (Figure 1B). The experimentally acquired PSF matched perfectly with the analytical PSF calculated using Vectorial Debye Theory,57 which is shown in Figure 1B.
For further verification purposes, we performed the polarization and wavelength dependent microscopy and spectroscopy analysis. In the polarization spectroscopy analysis, polarization dependent images were acquired using a linear polarizer and varying the incident angle from 0°−180° at 15° intervals (Figure 5A). The intensity variation values were plotted against the polarization angle (Figure 5A) and compared with cosine fit. It has been observed that most of the particles within an image do not show any polarization dependency (Figure 5A). However, with a change of polarization from 0°−360° few particles show cos2 dependency, confirming the cluster formation (Figure 5A). Nevertheless remaining particles do not show any dependency except for linear dependency. Additionally, we performed the wavelength dependent imaging for 700−900 nm wavelengths using a circular polarizer at 10 nm intervals. Most of the particles’ intensity remained constant with an increase of wavelength due to the dominance of monomers (Figure 5B). However, for a few particles, intensity decreased with an increase of wavelengths in the 700−900 nm spectral range. As an example, particles 4 and 5 corresponded with the FDTD simulated 3 nm and 8 nm separation results (Figure 5B), confirming that they are dimers in nature which is verified by the correlated images (Figure 4B). Therefore, the wavelength dependency imaging not only enables us to identify the dimer but also enables us to determine the interparticle distance between two interacting NPs.
Probing the RI and molecular interaction of AuNPs inside HeLa cells
HeLa cell culture
HeLa cells obtained from Dr Ye Chan and Dr Chiara Paviolo (Sigma Aldrich) were maintained in DMEM (Sigma Aldrich, Sydney, NSW, Australia) and supplemented with 10% (v/v) FBS (Life Technologies Australia Pty Ltd, Melbourne, VIC, Australia), 1% (v/v) glutamine (Life Technologies Australia Pty Ltd) and 0.5% (v/v) amphotericin B (Life Technologies Australia Pty Ltd) in a humidified atmosphere (95% [v/v] air, 5% [v/v] carbon dioxide) at 37°C. Later, the cells (1.5×10⁴ cells/cm2) were trypsinized and seeded on coverslips, which were placed inside a μ-slide chamber (DKSH, Melbourne, VIC, Australia). Samples were incubated for one day at 37°C/5% CO2 to allow cell attachment. To determine the surface charge of PEG AuNP samples, we calculated the zeta potential which is 22.03±2.7 using the Huckel model. The calculated value of pH was found as 8.4 of the PEG HeLa cells. To visualize cell membranes, a DiD lipophilic tracer (Sigma Aldrich) was added with a AuNS sample with the particles at a concentration of 8 μm. AuNP attached HeLa cells samples were incubated for 30 minutes and later fixed with 3.7% (v/v) formalin for 10 minutes, followed by three rounds of washing with PBS for 5 minutes.
AuNP attached cell sample preparation
PEG AuNPs solution was then centrifuged for 15 minutes at 6,000 rpm and the supernatant was discarded adding a similar amount (1 mL) of distilled water to AuNP pellets. Then AuNPs were sonicated for 10 minutes to minimize the aggregation, followed by 30 minutes of UV light exposure (inside a biosafety cabinet) for sterilization purposes.
Optimization of method
We have demonstrated our technique for 80 nm diameter AuNPs, however we believe RI and molecular interaction could be extracted for other sizes and shapes of AuNSs. For the dielectric medium, we mixed the AuNPs with PVA matrix for 6–8 hours, drop cast the AuNP-PVA mixed solution onto a glass slide and spun-coated the sample 3–5 minutes for even distribution of AuNS. The concentration amount that was used for the dielectric sample with optical density one was 1.2×10¹⁰ AuNP/mL while for HeLa cells it was 1.5×10⁴ cells/cm2. However, the following experimental conditions were found to give best results: (a) best sample diameter of AuNSs: our investigation showed that 80 nm diameter AuNSs provide interesting insights, however further investigation on other shapes and sizes of AuNPs may also yield exciting results. (b) Optimal reaction time: 12–24 hours for PEG AuNSs. (c) Optimal concentration (or amount) of AuNSs: while our concentration for dielectric sample and HeLa cells was 1.2×10¹⁰ AuNP/mL and 1.5×10⁴ cells/cm2, respectively, we believe it will be interesting to find the optimal size, reaction time and concentration as a function of size, shape and geometry of particle.
Cell sample characterization
Cells cultured on coverslips were mounted on a microscopy mounting media (Aquatex Merck Millipore, Melbourne, VIC, Australia). Images of PEG 80 nm diameter AuNSs incubated with HeLa cells were acquired using a dark-field inverted microscope (Nikon Australia Pty Ltd, Sydney, NSW, Australia) with a 1.2–1.3 NA (Nikon Australia Pty Ltd) dark-field condenser and a 0.6−1.3 NA 100× oil immersion objective lens (Nikon Australia Pty Ltd). A 150-watt quartz-halogen aluminum lamp of with a range of 400–2,500 nm wavelength was used for illumination purposes. Samples were mounted on a 10 nm scale resolution automated stage and the scattering images were acquired with a color cooled digital camera (Nikon Australia Pty Ltd) (Figure 3B). The experimentally acquired single particle and dimer spectrum was acquired with the ENVI 4.8 image analysis software (CytoViva, Inc., Auburn, AL, USA), using a spectrometer of 400–1,000 nm wavelength with spectral resolution of 2.8 nm.
Probing the RI and molecular interaction
The extinction spectrum measured by the UV-Vis spectrometer showed that the scattering peaks of 80 nm diameter PEG AuNSs were 552 nm (Figure 1A). We calculated the peak wavelength for 80 nm diameter AuNSs using Mie theory where we considered the RI 1.33 (RI of water) and found the peak at 560 nm. We performed hyperspectral imaging and recorded the PEG AuNS attached HeLa samples. We also recorded and investigated the spectrum of all the particles within the images. We found that spectrum peak varied from 575 nm and above. We presumed that 575 nm is the single particle spectrum of AuNSs inside HeLa cells and the SPR red shifts are due to a change of environment inside HeLa cells. To verify our assumption, we recalculated the single particle spectrum using Mie theory by changing the RI values from 1.3 to 1.5 and observed the SPR peak at 575 nm for RI value 1.45. We also verified the results compared with FDTD simulated spectrum and observed the SPR peak at 575 nm for RI value 1.45. Therefore, it was suggested that due to a change of environment inside HeLa cells our single particle peak (SPR) changed from 560 nm (considering n=1.33) to 575 nm (considering n=1.45).
We believe the change of RI occurs due to internalization of PEG AuNSs inside HeLa cells. To confirm the internalization of PEG AuNSs and identify the location inside HeLa cells, we attached the dye molecules with HeLa cells and identified that PEG AuNSs were internalized inside the cell membrane by performing the scattering microscopy imaging using a z-step of 0.2 μm. To visualize the cell membrane, samples were imaged with a 100× oil immersion objective lens on an inverted confocal microscope (FluoView FV100; Olympus). A red helium-neon laser (633 nm; Newport Corporation) was used to excite the DiD (λEX=644 nm/λEM=665 nm), while a helium-neon laser (543 nm; Newport Corporation) was used to visualize the scattered laser light from the AuNS-HeLa cell complexes (λEX=545 nm/λEM=545±4 nm) (Figure 3C).
However, our reported intracellular RI value 1.45 for PEG AuNS incubated HeLa cells matches with previous results observed on the cell membrane, cytoplasm and nucleus of different types of cells (Figure 2B).58–60 Further, we focused on identifying the molecular interaction between two interacting AuNSs inside HeLa cells. To identify the separation, we simulated the AuNS dimer for varying distances utilizing the previously extracted RI value 1.45. Therefore, we cross-checked the experimentally acquired PEG AuNS attached HeLa cells with the FDTD simulated AuNS dimer spectrum to determine the exact interparticle distance between two interacting AuNSs in the cell membrane. Finally, we determined the exact separation for particles P4 and P5 and found the separation as 3 nm and 8 nm, respectively, which was validated by comparing the experimentally acquired spectrum with the FDTD simulated spectrum (Figure 5B).
Results and discussion
Single particle detection studies have gathered huge interest and they have been extensively used in several applications, including optical labeling and trapping of single particles, biosensing, and as a nano antenna to enhance fluorescence. However, far-field detection of single metal NPs was first utilized in 1998,61 and since then different applications have arisen based on single particles. Although single particle measurement is more difficult and provides low signal to noise ratio compared to ensemble measurement. Contrary to single fluorophore or semiconductor material, a single metal NP does not blink or bleach due to the large number of conduction electrons per particle (ie, typically 103–105). They exhibit very stable scattering, luminescence, harmonic emission and photo thermal emission and provide long observation time in microsecond time resolution, which is a major hurdle for organic fluorophore-based technique. Therefore, they are considered best to be used as an optical label over fluorophore or semiconductor quantum dots.
Previous studies have emphasized the ensemble of NPs. However, the key contribution of this work is the solution it provides to detect a single metal NP, and to probe the RI and interparticle distance inside biologic cells. The main advantage of our comprehensive study is that we focused on single particle detection compared with previous indirect measurements which were based on ensembles of AuNPs. Additionally, we have verified our single particle spectroscopy results into dielectric medium by correlating the optical images with SEM images before introducing them into a cellular environment.
In this study, we demonstrated the technique based on single particle analysis to probe the RI and reported the RI value as 1.45 in the cell membrane. Therefore, our observed RI values are in accordance with previously reported RI values for cell membranes (1.46–1.6), cytoplasms (1.35–1.39), and proteins (1.36–1.55).58–60 Previously, the RI of cellular components was investigated on ensembles of NPs with significantly lower spatial resolutions (μm scale). However, in our in-depth investigation, we determined the RI value of a single particle with a higher spatial resolution (nm scale). We believe our reported results will provide the foundation to determine more accurate RI values in the cell membrane, cytoplasm, proteins, and nucleus of several types of cells for various shapes and geometries of NPs or other biomolecules. Therefore, our direct single particle-based RI measurement approach will open new avenues to optically trap and detect the molecules without labeling them by using high numerical aperture objective lenses and maximizing the gradient force. Additionally, RI values will be useful to simulate the coupled NPs more precisely and determine the exact separation distance inside living cells, thus providing accurate spectra (Figure 2B).
Although RI is not a common marker for cellular studies, possible introduction of precise intracellular RI sensors could give extra dimensions to studies of cell morphology and dynamics. On the other hand, the advantages of hyperspectral imaging over confocal laser scattering microscopy is it does not require a sophisticated experimental setup, which includes a high-power incident light source, expensive detector, spectrometer and high numerical aperture, as only a spectrometer and normal light microscope is sufficient. Also, the white light is not destructive compared to high power laser. There is no analytical model available for coupled NPs or different shapes of NPs, however the limitations can be overcome by comparing the experimental spectrum with numerically simulated spectra performed by FDTD. Regardless of the few limitations, this technique provides a good starting point for discussion and further research to investigate single particle tracking, biosensing, probing intracellular refractive indexes, and monitoring molecular activities and interaction in live cells. Overall, our comprehensive investigation demonstrated a novel approach for determining the intracellular refractive index, monitoring cellular dynamics and interactions, and tracking of targeted NPs within living cells.
Conclusion
In conclusion, we demonstrated a novel technique to quantify the intracellular RI using single particle spectroscopy. We also determined the plasmon coupling of AuNS dimers, which was used to determine the interparticle distance between two interacting AuNSs embedded in PVA matrix and HeLa cells. Before introducing the single particle technique into the cellular environment, we tested our approach in a dielectric medium. We performed the confocal laser scattering microscopy and dark field scattering microscopy respectively for AuNSs embedded PVA matrix sample and AuNSs attached HeLa cell sample and identified the single particle and dimer. For both cases, the experimental results was validated with analytical results (Mie theory) and FDTD simulated spectra, which has been used to quantify the intracellular RI and molecular interaction. The novelty of this paper lies in the presentation of a systematic study of single particle spectroscopy to identify the single particle and dimer, probe the intracellular RI of AuNSs, and determine the exact interparticle distance of two interacting AuNSs in HeLa cells. The results were verified by analytical models, extensive FDTD simulations, and rigorous experimental study. Through our in-depth investigation, we have developed a novel imaging technique that utilizes plasmonic NPs to acquire imaging of the subcellular region of live cells through single particles. This technique will facilitate the improvement of optical properties for modeling cells and tissues, monitoring of cellular dynamics, and long-term tracking of targeted NPs within cells.
Acknowledgments
The authors would like to thank Swinburne University of Technology, Australia for the research facilities. The authors also thank Dr Ye Chan and Dr Chiara Paviolo (Sigma Aldrich, Sydney, NSW, Australia) for the HeLa cells used in this study.
Disclosure
The authors report no conflicts of interest in this work.
References
Huang X, Jain PK, El-Sayed IH, El-Sayed MA. Gold nanoparticles: interesting optical properties and recent applications in cancer diagnostics and therapy. Nanomedicine. 2007;2(5):681–693. | ||
El-Sayed IH, Huang X, El-Sayed MA. Surface plasmon resonance scattering and absorption of anti-EGFR antibody conjugated gold nanoparticles in cancer diagnostics: applications in oral cancer. Nano Lett. 2005;5(5):829–834. | ||
Zijlstra P, Chon JW, Gu M. Five-dimensional optical recording mediated by surface plasmons in gold nanorods. Nature. 2009;459(7245):410–413. | ||
Sönnichsen C, Reinhard BM, Liphardt J, Alivisatos AP. A molecular ruler based on plasmon coupling of single gold and silver nanoparticles. Nat Biotechnol. 2005;23(6):741–745. | ||
Aaron J, Travis K, Harrison N, Sokolov K. Dynamic imaging of molecular assemblies in live cells based on nanoparticle plasmon resonance coupling. Nano Lett. 2009;9(10):3612–3618. | ||
Mohsin ASM. Aggregation and uptake kinetics of gold nanoparticles in biological cells, using plasmon coupling and image correlation spectroscopy [PhD thesis]. Melbourne: Swinburne University of Technology; 2015. | ||
Jain PK, Huang W, El-Sayed MA. On the universal scaling behavior of the distance decay of plasmon coupling in metal nanoparticle pairs: a plasmon ruler equation. Nano Lett. 2007;7(7):2080–2088. | ||
Crow MJ, Seekell K, Ostrander JH, Wax A. Monitoring of receptor dimerization using plasmonic coupling of gold nanoparticles. ACS Nano. 2011;5(11):8532–8540. | ||
Murphy CJ, Gole AM, Stone JW, et al. Gold nanoparticles in biology: beyond toxicity to cellular imaging. Acc Chem Res. 2008;41(12):1721–1730. | ||
Aaron J, Nitin N, Travis K, et al. Plasmon resonance coupling of metal nanoparticles for molecular imaging of carcinogenesis in vivo. J Biomed Opt. 2007;12(3):034007–034011. | ||
Funston AM, Novo C, Davis TJ, Mulvaney P. Plasmon coupling of gold nanorods at short distances and in different geometries. Nano Lett. 2009;9(4):1651–1658. | ||
Kreibig UV, Volmer M. Optical Properties of Metal Clusters. Berlin: Springer-Verlag Berlin Heidelberg; 1995. | ||
Mohsin ASM, Salim MB. Probing the plasmon coupling, quantum yield, and effects of tip geometry of gold nanoparticle using analytical models and FDTD simulation. IEEE Photonics J. 2018;10(3):1–10. | ||
Reinhard BM, Siu M, Agarwal H, Alivisatos AP, Liphardt J. Calibration of dynamic molecular rulers based on plasmon coupling between gold nanoparticles. Nano Lett. 2005;5(11):2246–2252. | ||
Wang H, Rong G, Yan B, Yang L, Reinhard BM. Optical sizing of immunolabel clusters through multispectral plasmon coupling microscopy. Nano Lett. 2011;11(2):498–504. | ||
Sönnichsen C, Reinhard BM, Liphardt J, Alivisatos AP. A molecular ruler based on plasmon coupling of single gold and silver nanoparticles. Nat Biotechnol. 2005;23(6):741–745. | ||
Rappaz B, Marquet P, Cuche E, Emery Y, Depeursinge C, Magistretti P. Measurement of the integral refractive index and dynamic cell morphometry of living cells with digital holographic microscopy. Opt Express. 2005;13(23):9361–9373. | ||
Bista RK, Uttam S, Wang P, et al. Quantification of nanoscale nuclear refractive index changes during the cell cycle. J of Biomedical Optics. 2011;16(7):070503. | ||
Suissa M, Place C, Goillot E, Freyssingeas E. Internal dynamics of a living cell nucleus investigated by dynamic light scattering. Eur Phys J E Soft Matter. 2008;26(4):435. | ||
Backman V, Wallace MB, Perelman LT, et al. Detection of preinvasive cancer cells. Nature. 2000;406(6791):35–36. | ||
Subramanian H, Pradhan P, Liu Y, et al. Partial-wave microscopic spectroscopy detects subwavelength refractive index fluctuations: an application to cancer diagnosis. Opt Lett. 2009;34(4):518–520. | ||
Zernike F. Phase contrast, a new method for the microscopic observation of transparent objects. Physica. 1942;9(7):686–698. | ||
Nomarski G. Microinterféromètre différentiel ondes polarisées. J Phys Radium. 1955;1616:9S–11S. | ||
Kemper B, Carl DD, Schnekenburger J, et al. Investigation of living pancreas tumor cells by digital holographic microscopy. J of Biomedical Optics. 2006;11(3):034005. | ||
Jericho MH, Kreuzer HJ, Kanka M, Riesenberg R. Quantitative phase and refractive index measurements with point-source digital in-line holographic microscopy. Appl Opt. 2012;51(10):1503–1515. | ||
Ghosh N, Buddhiwant P, Uppal A, Majumder SK, Patel HS, Gupta PK. Simultaneous determination of size and refractive index of red blood cells by light scattering measurements. Appl Phys Lett. 2006;88(8):084101. | ||
Liang XJ, Liu AQ, Lim CS, Ayi TC, Yap PH. Determining refractive index of single living cell using an integrated microchip. Sens Actuators A Phys. 2007;133(2):349–354. | ||
Lue N, Choi W, Popescu G, et al. Live cell refractometry using Hilbert phase microscopy and confocal reflectance microscopy. J Phys Chem A. 2009;113(47):13327–13330. | ||
Choi W, Fang-Yen C, Badizadegan K, et al. Tomographic phase microscopy. Nat Methods. 2007;4(9):717–719. | ||
Phillips KG, Jacques SL, Mccarty OJ. Measurement of single cell refractive index, dry mass, volume, and density using a transillumination microscope. Phys Rev Lett. 2012;109(11):118105. | ||
Sørensen HS, Pranov H, Larsen NB, Bornhop DJ, Andersen PE. Absolute refractive index determination by microinterferometric backscatter detection. Anal Chem. 2003;75(8):1946–1953. | ||
Neto RBS, de Mendonça JPRF, Lesche B. Determination of absolute values of refractive index of liquids using an interferometric method. Revista de Física Aplicada e Instrumentação. 2004;17:74–79. | ||
Lunazzi JJ, Garavaglia M. Fabry-Perot laser interferometry to measure refractive index or thickness of transparent materials. J Phys E. 1973;6(3):237–240. | ||
Curl CL, Bellair CJ, Harris PJ, et al. Quantitative phase microscopy: a new tool for investigating the structure and function of unstained live cells. Clin Exp Pharmacol Physiol. 2004;31(12):896–901. | ||
Elizabeth AJE, Thomas MJ. Imaging molecular interactions in living cells by FRET microscopy. Curr Opin Chem Biol. 2006;10(5):409–416. | ||
Tsien RY, Bacskai BJ, Adams SR, Roger YT, Brian JB, Stephen RA. FRET for studying intracellular signalling. Trends Cell Biol. 1993;3(7):242–245. | ||
Clayton AHA, Walker F, Orchard SG, et al. Ligand-induced dimer-tetramer transition during the activation of the cell surface epidermal growth factor receptor-A multidimensional microscopy analysis. J Biol Chem. 2005;280(34):30392–30399. | ||
Palmer AG, Thompson NL, Arthur GP, Nancy LT. Fluorescence correlation spectroscopy for detecting submicroscopic clusters of fluorescent molecules in membranes. Chem Phys Lipids. 1989;50(3–4):253–270. | ||
Qian H. On the statistics of fluorescence correlation spectroscopy. Biophys Chem. 1990;38(1–2):49–57. | ||
Thompson NL. Fluorescence correlation spectroscopy. Topics in Fluorescence Spectroscopy. In: Lakowicz JR, editor. Vol. 1. New York: Techniques Plenum Press; 1991:53–176. | ||
Qian H, Elson EL. Fluorescence correlation spectroscopy with high-order and dual-color correlation to probe nonequilibrium steady states. Proc Natl Acad Sci U S A. 2004;101(9):2828–2833. | ||
Medina MA, Schwille P. Fluorescence correlation spectroscopy for the detection and study of single molecules in biology. Bioessays. 2002;24(8):758–764. | ||
Sengupta P, Garai K, Balaji J, Periasamy N, Maiti S. Measuring size distribution in highly heterogeneous systems with fluorescence correlation spectroscopy. Biophys J. 2003;84(3):1977–1984. | ||
Wiseman PW, Petersen NO. Image correlation spectroscopy. II. Optimization for ultrasensitive detection of preexisting platelet-derived growth factor-beta receptor oligomers on intact cells. Biophys J. 1999;76(2):963–977. | ||
Costantino S, Comeau JW, Kolin DL, Wiseman PW. Accuracy and dynamic range of spatial image correlation and cross-correlation spectroscopy. Biophys J. 2005;89(2):1251–1260. | ||
Ciccotosto GD, Kozer N, Chow TT, Chon JW, Clayton AH. Aggregation distributions on cells determined by photobleaching image correlation spectroscopy. Biophys J. 2013;104(5):1056–1064. | ||
Petersen NO, Brown C, Kaminski A, Rocheleau J, Srivastava M, Wiseman PW. Analysis of membrane protein cluster densities and sizes in situ by image correlation spectroscopy. Faraday Discuss. 1998;111(111):289–305. | ||
Sergeev M. High order autocorrelation analysis in image correlations [PhD thesis]. Canada, Montreal, Quebec: McGill University; 2004. | ||
Biju V, Muraleedharan D, Nakayama K, et al. Quantum dot-insect neuropeptide conjugates for fluorescence imaging, transfection, and nucleus targeting of living cells. Langmuir. 2007;23(20):10254–10261. | ||
Clayton AH, Walker F, Orchard SG, et al. Ligand-induced dimer-tetramer transition during the activation of the cell surface epidermal growth factor receptor-A multidimensional microscopy analysis. J Biol Chem. 2005;280(34):30392–30399. | ||
Jares-Erijman EA, Jovin TM, Elizabeth AJE, Thomas MJ. Imaging molecular interactions in living cells by FRET microscopy. Curr Opin Chem Biol. 2006;10(5):409–416. | ||
Peter BJ, R W C. Optical constants of the noble metals. Physical Review B. 1972;6(12):4370. | ||
Jain PK, Eustis S, El-Sayed MA. Plasmon coupling in nanorod assemblies: optical absorption, discrete dipole approximation simulation, and exciton-coupling model. J Phys Chem B. 2006;110(37):18243–18253. | ||
Link S, Mohamed MB, El-Sayed MA. Simulation of the optical absorption spectra of gold nanorods as a function of their aspect ratio and the effect of the medium dielectric constant. J Phys Chem B. 1999;103(16):3073–3077. | ||
Kat CW, Lei S, Huanjun C, Yao L, Jiangfang W, Hai QL. Observation of the Fano resonance in gold nanorods supported on high-dielectric-constant substrates. Acs Nano. 2011;5(7):5976–5986. | ||
Funston AM, Davis TJ, Novo C, Mulvaney P. Coupling modes of gold trimer superstructures. Philos Trans A Math Phys Eng Sci. 2011;369(1950):3472–3482. | ||
Min G. Advanced optical imaging theory. Springer Series in Optical Sciences. Berlin: Springer-Verlag Berlin Heidelberg; 1999:37–69. | ||
Beuthan J, Minet O, Helfmann J, Herrig M, Müller G. The spatial variation of the refractive index in biological cells. Phys Med Biol. 1996;41(3):369–382. | ||
Meyer RA. Light scattering from biological cells: dependence of backscatter radiation on membrane thickness and refractive index. Appl Opt. 1979;18(5):585–588. | ||
Xiao S, Drachev VP, Kildishev AV, et al. Loss-free and active optical negative-index metamaterials. Nature. 2010;466(7307):735–738. | ||
Lu HP, Xun L, Xie XS. Single-molecule enzymatic dynamics. Science. 1998;282(5395):1877–1882. |
 © 2018 The Author(s). This work is published and licensed by Dove Medical Press Limited. The full terms of this license are available at https://www.dovepress.com/terms.php and incorporate the Creative Commons Attribution - Non Commercial (unported, v3.0) License.
By accessing the work you hereby accept the Terms. Non-commercial uses of the work are permitted without any further permission from Dove Medical Press Limited, provided the work is properly attributed. For permission for commercial use of this work, please see paragraphs 4.2 and 5 of our Terms.
© 2018 The Author(s). This work is published and licensed by Dove Medical Press Limited. The full terms of this license are available at https://www.dovepress.com/terms.php and incorporate the Creative Commons Attribution - Non Commercial (unported, v3.0) License.
By accessing the work you hereby accept the Terms. Non-commercial uses of the work are permitted without any further permission from Dove Medical Press Limited, provided the work is properly attributed. For permission for commercial use of this work, please see paragraphs 4.2 and 5 of our Terms.