")
Back to Journals » Drug Design, Development and Therapy » Volume 9
Preparation and characterization of genipin-cross-linked silk fibroin/chitosan sustained-release microspheres
Authors Zeng S, Ye M, Qiu J, Fang W, Rong M, Guo Z, Gao W
Received 30 November 2014
Accepted for publication 26 February 2015
Published 4 May 2015 Volume 2015:9 Pages 2501—2514
DOI https://doi.org/10.2147/DDDT.S78402
Checked for plagiarism Yes
Review by Single anonymous peer review
Peer reviewer comments 3
Editor who approved publication: Professor Shu-Feng Zhou
Shuguang Zeng,1,* Manwen Ye,1,2,* Junqi Qiu,1 Wei Fang,1 Mingdeng Rong,1 Zehong Guo,1 Wenfen Gao1
1Department of Oral and Maxillofacial Surgery, Guangdong Provincial Stomatological Hospital, Southern Medical University, 2Department of Stomatology, Guangdong Women and Children Hospital, Guangzhou Medical University, Guangzhou, Guangdong, People’s Republic of China
*These authors contributed equally to this work
Abstract: We report the effects of distinct concentrations of genipin and silk fibroin (SF):chitosan (CS) ratios on the formation of SF–CS composite microspheres. We selected microspheres featuring an SF:CS ratio of 1:1, encapsulated various concentrations of bovine serum albumin (BSA), and then compared their encapsulation efficiency and sustained-release rate with those of pure CS microspheres. We determined that the following five groups of microspheres were highly spherical and featured particle sizes ranging from 70 µm to 147 µm: mass ratio of CS:SF =1:0.5, 0.1 g or 0.5 g genipin; CS:SF =1:1, 0.05 g or 1 g genipin; and CS:SF =1:2, 0.5 g genipin. The microspheres prepared using 1:1 CS:SF ratio and 0.05 g genipin in the presence of 10 mg, 20 mg, and 50 mg of BSA exhibited encapsulation efficiencies of 50.16%±4.32%, 56.58%±3.58%, and 42.19%±7.47%, respectively. Fourier-transform infrared spectroscopy (FTIR) results showed that SF and CS were cross-linked and that the α-helices and random coils of SF were converted into β-sheets. BSA did not chemically react with CS or SF. Moreover, thermal gravimetric analysis (TGA) results showed that the melting point of BSA did not change, which confirmed the FTIR results, and X-ray diffraction results showed that BSA was entrapped in microspheres in a noncrystalline form, which further verified the TGA and FTIR data. The sustained-release microspheres prepared in the presence of 10 mg, 20 mg, and 50 mg of BSA burst release 30.79%±3.43%, 34.41%±4.46%, and 41.75%±0.96% of the entrapped BSA on the 1st day and cumulatively released 75.20%±2.52%, 79.16%±4.31%, and 89.04%±4.68% in 21 days, respectively. The pure CS microspheres prepared in the presence of 10 mg of BSA burst release 39.53%±1.76% of BSA on the 1st day and cumulatively released 83.57%±2.33% of the total encapsulated BSA in 21 days. The SF–CS composite microspheres exhibited higher sustained release than did the pure CS microspheres, and thus these composite microspheres might function as a superior drug carrier.
Keywords: silk fibroin, chitosan, genipin, microspheres, controlled release
Introduction
Controlled release of bioactive proteins or peptide drugs is currently under intense investigation.1 One of the materials used for preparing sustained-release microspheres is chitosan (CS), which is generated by the deacetylation of chitin and is the only naturally occurring basic and hydrophilic polysaccharide. CS can be obtained from diverse sources, is nontoxic, causes no adverse reactions, and exhibits high biocompatibility, biodegradability, plasticity, and antimicrobial resistance. CS microspheres are widely used in the transport of biological macromolecules, such as proteins, peptides, oligonucleotides, and plasmids,2–4 but pure CS microspheres exhibit a high initial burst release rate and a short period of sustained release and, thus, require further refinement. One of the materials that can be used for this purpose is silk fibroin (SF), a natural protein polymer that accounts for 70%–80% of silk by weight and is obtained by ungluing silk. SF is rich in alanine, serine, glycine, and the other 18 amino acids; it is highly biocompatible and biodegradable, and it can promote cell adhesion, migration, and proliferation. SF is widely used in tissue scaffolds and in controlled-release carriers because of its unique formability, biocompatibility, and biodegradability.5
The preparation of sustained-release microspheres is critically affected by the cross-linking agent used. The chemical cross-linkers used commonly include glutaraldehyde, sodium tripolyphosphate, and formaldehyde. However, all of these cross-linkers are toxic to some extent.6,7 A new type of natural and water-soluble bifunctional cross-linking agent is genipin, which is extracted from Gardenia and is typically sold as a white crystal; when genipin reacts with polymers’ amino groups, its color changes from white to dark blue. Genipin is nearly 10,000 times less toxic than other commonly used cross-linkers such as glutaraldehyde.8 Zhang et al9 successfully cross-linked SF and CS by using genipin and generated a nanofibrous scaffold; the cross-linked SF and CS modified each other’s properties, and thus the resulting scaffold exhibited higher biocompatibility than did scaffolds cross-linked using glutaraldehyde or ethanol. In this study, we investigated the effects of two formulation variables – the SF:CS ratio and the genipin dosage – on the preparation of genipin-cross-linked SF–CS composite microspheres. We analyzed the physical and chemical properties of the microspheres and determined that the microspheres featuring a 1:1 SF:CS ratio and encapsulated bovine serum albumin (BSA) exhibited a superior sustained-release rate than did pure CS microspheres.
Materials and methods
Materials
The average particle size of the purchased SF powder was 2 μm (Xintian Silk Biotechnology Co, Ltd, Chaozhou, People’s Republic of China); the molecular weight of the CS used was 4.5×10⁵ kD and its degree of deacetylation was >90% (Shanghai Bio Science and Technology Co, Ltd, Shanghai, People’s Republic of China). Genipin of ≥98% high-performance liquid chromatography purity was purchased from ConBon Bio-Tech Co, Ltd (Chengdu, People’s Republic of China), and >98% pure BSA was obtained from Innoreagents (Huzhou, People’s Republic of China). The bicinchoninic acid (BCA) protein assay kit was from Sigma (St Louis, MO, USA). Cellulose dialysis bags (molecular weight cutoff: 8,000–14,000) were from Dingguo Biotechnology Co, Ltd (Guangzhou, People’s Republic of China). Paraffin oil, Span-80, acetic acid, and ethanol were all of analytical grade.
Preparation of SF solution
We dissolved 5.5 g of SF in a ternary solution (molar ratio CaCl2:H2O:C2H5OH =1:8:2) by applying magnetic stirring at 600 rpm for 1 hour at 80°C. The solution was allowed to stand for 3 hours to defoam and then was transferred to a dialysis bag and dialyzed against double-distilled (dd) H2O for 3 days, with the ddH2O being changed once every 3 hours. The resulting solution was filtered, and the mass fraction was measured to be 2%.
Preparation of SF–CS microspheres
We dissolved 2.5 g of CS in 2% acetic acid and adjusted the mass fraction to 2%. Microspheres were prepared using an emulsification cross-linking approach: 100 mL of 2% (by volume) Span-80 liquid paraffin was stirred for 30 minutes on a magnetic stirrer (IKA, Staufen, Germany) at 850 rpm to obtain a homogeneous solution that served as the oil phase. Next, 2% solutions of SF and CS (CS volume was fixed at 10 mL) were used as the aqueous phase and were dripped into the oil phase through a #7 needle. The mixture was emulsified for 30 minutes to obtain homogeneous, milky water-in-oil (W/O) emulsion, after which 10 mL of genipin solution (in ethanol) was added into the emulsion and the mixture was stirred for 2 hours at 850 rpm in a 37°C water bath. The precipitates were collected by centrifuging the mixtures for 10 minutes at 3,000 rpm, washed three times each with petroleum ether and isopropyl alcohol, and then dried in a vacuum to obtain blue microspheres. Table 1 lists the ratios of the materials used. We added 10 mg, 20 mg, or 50 mg of BSA during the preparation of the GM-7 microspheres to generate BSA-encapsulated SF–CS microspheres. During the preparation of BSA-entrapped microspheres, the wash supernatants were collected for testing. The 10-mg BSA sample was used for further preparation.
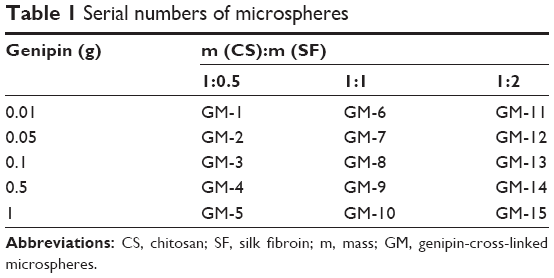 | Table 1 Serial numbers of microspheres |
Characterization of microspheres
Surface morphology of microspheres
Scanning electron microscopy (SEM) was used to examine microsphere surface morphology. The microspheres were adhered to the copper loading stage, coated with gold under vacuum, and observed under a field-emission scanning electron microscope (JSM-6330F, JEOL, Ltd, Tokyo, Japan). The mean diameter of BSA-encapsulated microspheres was determined by examining 200 randomly selected microspheres.
Particle size, swelling ratio, and equilibrium water content of microspheres
A laser particle-size analyzer (Beckman, Brea, CA, USA) was used to measure the particle size of empty microspheres that were confirmed (using SEM) to exhibit good surface morphology. The dry microspheres were placed in deionized water and then dispersed using ultrasonication. The microsphere suspension was concurrently stirred at 2,500 rpm and sonicated at 50 mV for 30 minutes, with 5%–13% light-blocking ratio. The particle size of the empty microspheres was analyzed using the software provided with the analyzer. The span index was calculated according to the following formula:
Span index = (D90 – D10)/D50 |
D90, D50, and D10 respectively represent the 90th, 50th, and 10th quantiles of the particle size of the microspheres – the smaller the span, the narrower the particle-size distribution. We measured three samples for each group of microspheres.
The SF–CS microspheres featuring a dry mass (Wd) of 0.1 g were suspended in 5 mL of deionized water in centrifuge tubes and placed in a shaker and shaken gently (100 rpm). Aliquots were collected at 0.5, 1, 2, 4, 6, 8, and 10 hours and centrifuged, after which the swollen microspheres were wiped with filter paper and immediately weighed to determine the swollen mass (Ws). The swelling rate (Esw) was calculated as follows:
Esw (%) = [(Ws – Wd)/Wd] ×100% |
The equilibrium water content (EWC) was calculated as follows:
EWC (%) = [(Wc – Wd)/Wc] ×100% |
Here, Wc is the mass of the swollen microspheres that reach equilibrium with water.
Fourier-transform infrared spectroscopy analysis
Fourier-transform infrared spectroscopy (FTIR) data for SF, CS, genipin, BSA, and SF–CS microspheres were collected on a Nicolet 6700 (Thermo Fisher Scientific Inc, Waltham, MA, USA). Samples were mixed with potassium bromide and converted into pellets under pressure. Scans were conducted over the range from 4,000 cm−1 to 400 cm−1.
X-ray diffraction
X-ray diffraction (XRD) analysis of SF, CS, genipin, BSA, and SF–CS microspheres was conducted on an X-ray powder diffractometer (Empyrean, PANalytical, Almelo, the Netherlands). The test condition was as follows: Cu target Kα1 radiation, voltage 40 kV, current 40 mA, emission slit 1/8°, antiscatter slit 1/4°, antiscatter slit 7.5 mm, and 2θ diffraction angle range 5°–55°. Each step size was 0.02° and time per step was 40 seconds.
Thermal gravimetric analysis of microspheres
Thermal gravimetric analysis (TGA) of the BSA-encapsulated microspheres was performed using a thermogravimetric analyzer (TG209F1, Netzsch, Germany). The microsphere samples were placed in an aluminum pan under a nitrogen atmosphere, and the temperature test range used was from room temperature to 350°C, with a heating rate of 10°C/min.
Encapsulation efficiency and drug-loading capacity
The BSA concentration in the supernatant and the used wash solution was measured using the BCA assay. The BCA working solution was prepared by thoroughly mixing reagent A with reagent B at a ratio of 50:1. The protein standard was dissolved in phosphate-buffered saline (PBS) and diluted to a final concentration of 0.5 mg/mL, and then 0, 1, 2, 4, 8, 12, 16, and 20 μL of the standard solution were sequentially added to eight wells in a standard 96-well plate together with PBS, bringing the total volume to 20 μL. Next, 200 μL of the BCA working solution was added to each well and the plate was placed at 37°C for 30 minutes, and then absorbance was measured at 595 nm. Protein concentration was calculated based on the standard curve.
Encapsulation efficiency and drug-loading capacity were calculated according to the following formulas:
Encapsulation efficiency = [Total BSA – (BSA in the centrifugation supernatant + BSA in the used wash solution)]/Total BSA ×100% |
Drug-loading capacity = Mass of [total BSA – (BSA in the centrifugation supernatant + BSA in the used wash solution)]/Mass of microspheres ×100% |
In vitro release
BSA-loaded microspheres equivalent to 1.5 mg of BSA were suspended in 10 mL of pH 7.4 PBS buffer in 15 mL centrifuge tubes, which were gently shaken on a horizontal shaker (100 rpm). From the supernatants, 20 μL aliquots of the solution were collected on the 1st, 2nd, 4th, 8th, 14th, and 21st days and the BSA concentration was measured using the BCA assay as described in the previous section.
Cumulative release rate = Total mass of BSA in the supernatant/Initial mass of BSA in microspheres ×100% |
Zero-level model, Level-1 model, Higuchi equation, and Weibull distribution model were used to describe drug release:
Higuchi equation10 is given by the equation
Mt/M∞ = kt1/2. |
Weibull distribution model11 is given by the expression
Mt/M∞ =1– exp(−atb). |
Mt and M∞ are the amounts of drug released at times t and ∞, and k is the constant obtained from the slope of the straight lines. Furthermore, “a” is the scale parameter and constant, “b” is the shape parameter and constant.
Statistical analysis
Statistical analysis was performed using SPSS19.0 (SPSS Inc, Chicago, IL, USA). The swelling ratio of the microspheres was analyzed using analysis of variance, and the groups were compared using Dunnett’s and Tukey–Kramer multiple comparisons. P<0.05 was considered statistically significant.
Results
Characterization of microspheres
SEM studies
SEM analysis revealed that the genipin-cross-linked microspheres (GM)-3, GM-4, GM-7, GM-10, and GM-14 groups of microspheres were mostly spherical and possessed a smooth surface (Figure 1), but microspheres of other groups exhibited poor morphology. Among the aforementioned five groups of microspheres, GM-7 microspheres possessed the smoothest surface, were the most spherical, and exhibited the most uniform particle-size distribution, suggesting that these represent the optimal batch of microspheres. The GM-10 and GM-14 microspheres displayed a few impurities deposited on the surface and adhesion between distinct microspheres, which we suspect could have resulted from excess genipin or excessive SF cross-linking. A high genipin concentration might lower the homogeneity of the SF deposited on the microsphere surfaces and the interspaces of the microspheres might be filled by SF.12,13 In both GM-4 and GM-3 microspheres, plaque adhesions between distinct microspheres were detected; these might be caused by the cross-linking of the CS amino groups between microspheres because of the high percentages of CS and the cross-linking agent used. Furthermore, these impurities and adhesions might have also resulted from incomplete mechanical mixing, in which not all the materials might have been simultaneously converted into the sphere wall; consequently, some of the materials might have been deposited on the microsphere surface or between microspheres and could have generated the observed debris or impurities.14
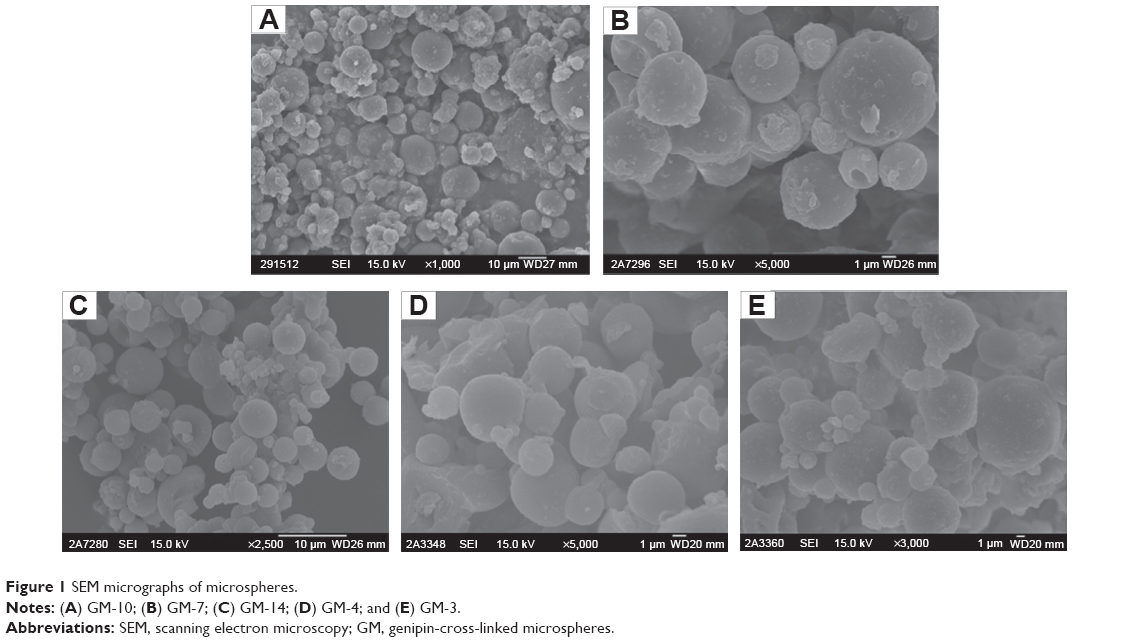 | Figure 1 SEM micrographs of microspheres. |
The three BSA-loaded microspheres (Figure 2) displayed a smooth surface, a spherical shape, a uniform particle-size distribution, and slight adhesion between microspheres. The microspheres prepared in the presence of 10 mg of BSA exhibited optimal surface morphology. The diameters of the microspheres prepared in the presence of 10 mg, 20 mg, and 50 mg of BSA were 7.84±0.97 μm, 7.53±1.15 μm, and 6.52±0.92 μm, respectively. The SEM results showed that an increase in the BSA dosage led to enhanced adhesion between the microspheres, perhaps because of increased amounts of BSA not being entrapped in the microspheres and instead being deposited on the surface. This surface-associated BSA might affect the formation of microspheres and could result in some of the materials not being fully converted into the sphere wall; these materials could be deposited on the microsphere surface or between the microspheres and form debris or impurities.
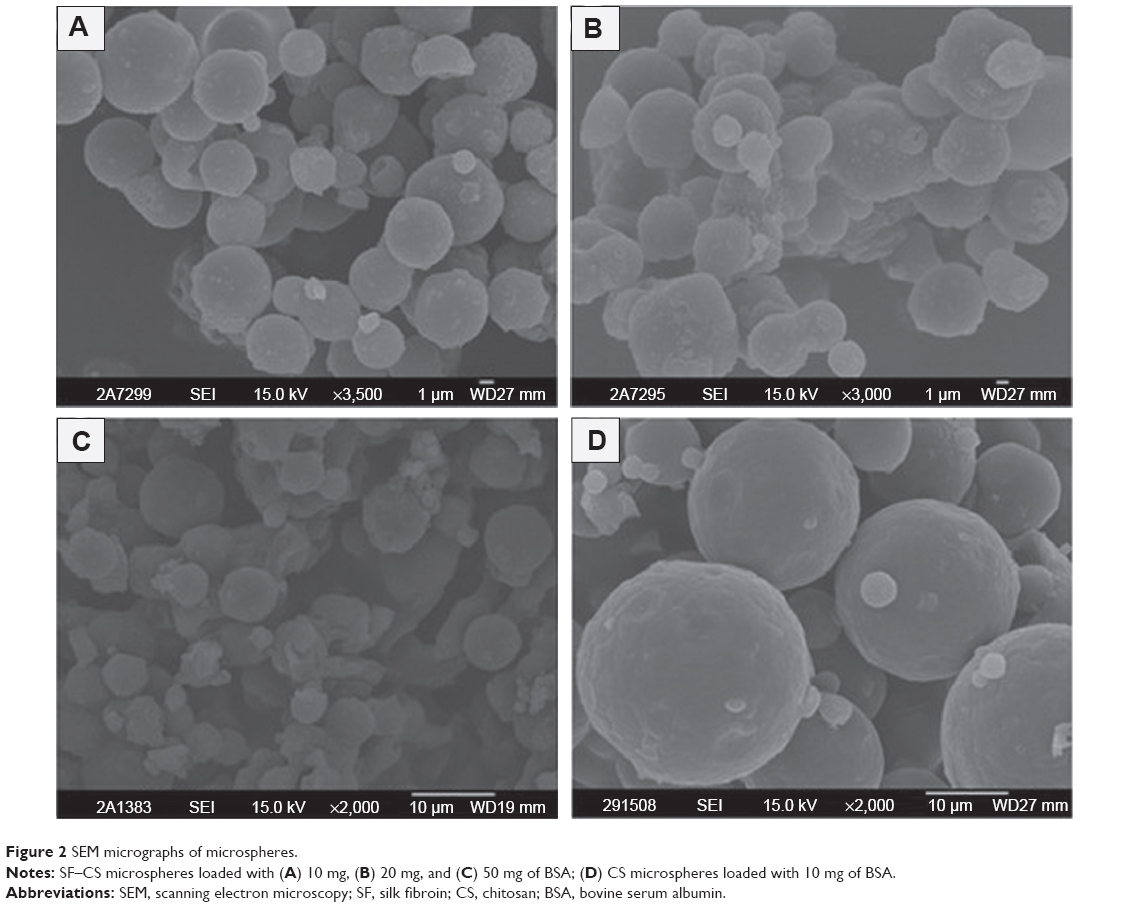 | Figure 2 SEM micrographs of microspheres. |
Particle size, Esw, and EWC of microspheres
Numerous factors can potentially affect the size of microspheres, including the speed of mechanical stirring, the amount of the cross-linking agent used, the concentration of the materials constituting the microsphere walls, and the type of drying used.15–18 In the case of the five groups of microspheres that displayed good morphology, particle-size distribution followed an approximately Gaussian distribution, and the sizes were between 70 μm and 150 μm (Figures 3 and 4, and Table 2). The volume-based/weighted mean particle sizes of GM-3, GM-4, GM-7, GM-10, and GM-14 groups were 109.83±2.28 μm, 89.00±1.08 μm, 146.60±3.46 μm, 71.13±0.85 μm, and 146.60±3.46 μm, respectively. This agrees with the 1 μm to 500 μm size range of microspheres previously reported.19 Notably, the laser particle-size analyzer reported considerably larger particle sizes than those obtained from SEM analysis. This discrepancy might be caused by the swelling of the microspheres: the microspheres that were measured using the laser particle-size analyzer were dispersed in deionized water, and the CS used to generate microspheres is strongly hydrophilic and swells rapidly after absorbing water; conversely, the microspheres analyzed using SEM were dry.2 The particle size of the GM-7 group was larger than the sizes of the other groups and was consistent with the swelling ratio (P<0.05). This is most likely because either the microspheres were not sufficiently cross-linked and thus swelled readily or because these microspheres can hold more water than other microspheres can. The D50 and D90 of the size distribution of the GM-3, GM-4, GM-7, GM-10, and GM-14 groups were (in μm) 29.58 and 109.48, 66.73 and 158.57, 102.45 and 324.87, 63.04 and 130.29, and 37.55 and 162.07, respectively. Whereas the size distribution was wide in the case of the GM-7 group, it was narrow for the GM-10 group. This could have been caused by the aggregation of microspheres resulting from extremely poor surface solidification in the presence of a low concentration of genipin; the highest concentration of genipin yielded the narrowest size distribution.20 The size distribution was measured using a laser particle-size analyzer, and the solvent in which the microspheres were placed was reported to be a factor that affects the size distribution.21 Moreover, when the concentration of the cross-linking agent was increased, the distribution span was decreased in the resulting GM-3, GM-4, GM-7, and GM-10 microspheres; however, the span was larger in the GM-14 group than in the GM-4 group, possibly because of more SF being used in the GM-14 preparation than in the GM-4 preparation.
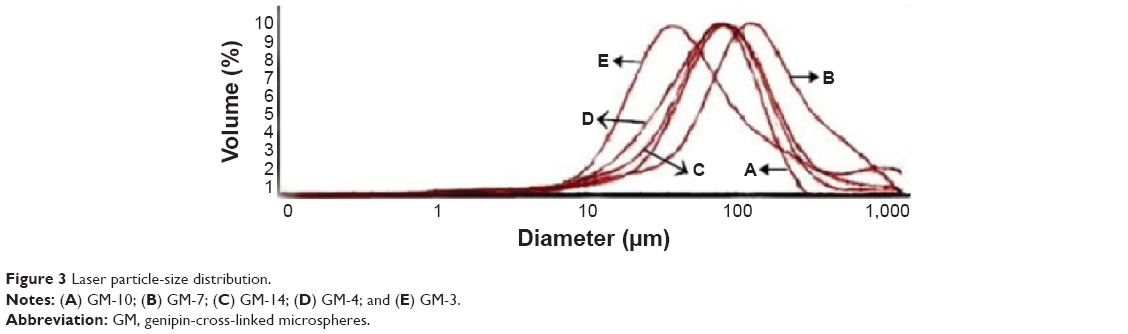 | Figure 3 Laser particle-size distribution. |
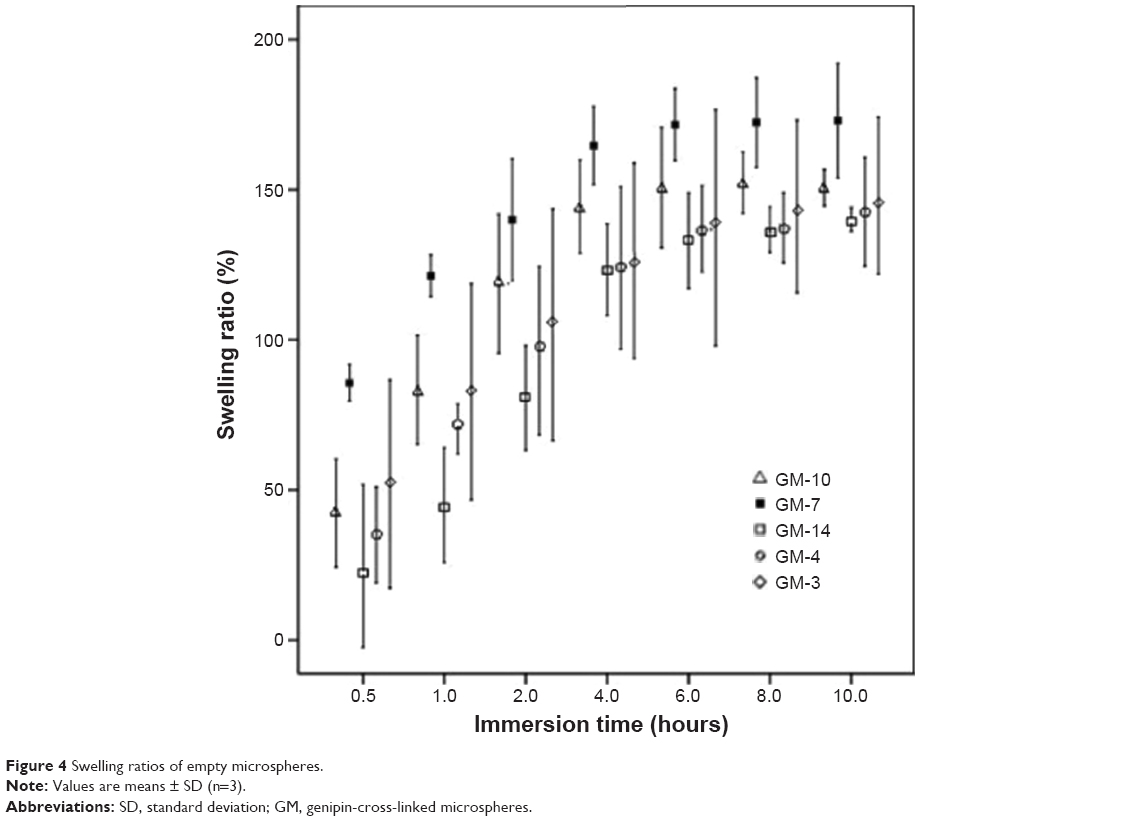 | Figure 4 Swelling ratios of empty microspheres. |
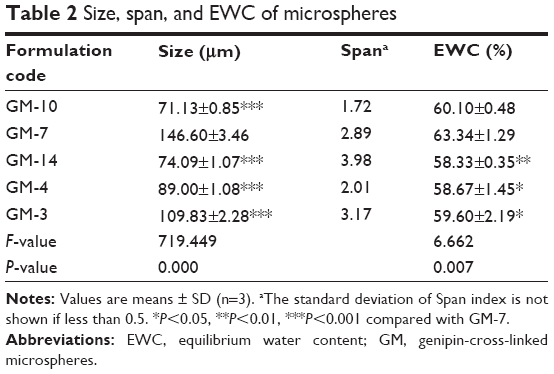 | Table 2 Size, span, and EWC of microspheres |
The Esw of all microspheres reached equilibrium by 6 hours after being immersed in deionized water. The average Esw values calculated for the GM-3, GM-4, GM-7, GM-10, and GM-14 groups after 10 hours were 150.67%, 173.01%, 140.00%, 142.67%, and 148.10%, respectively (Figure 4). The EWC of the GM-7 group was significantly different (P<0.05) when compared with the values calculated for the GM-3, GM-4, and GM-14 groups. The Esw of microspheres is closely related to the cross-linker concentration and the sphere wall materials. Thus, increases in genipin concentration could increase the density of CS cross-linking and lead to the assembly of highly dense internal structures that contain diminished space for accommodating water molecules. The SF–CS microsphere Esw is largely caused by CS because SF does not swell markedly in deionized water22 and thus does not increase the microsphere Esw.
After dispersion in deionized water, the four groups of BSA-loaded microspheres showed slight differences in the Esw during the first 6 hours (Figure 5), but after 6 hours, the Esw values of the three BSA-loaded SF–CS microspheres were almost the same, which suggested that their Esw had reached equilibrium. The capacity of composite microspheres to entrap proteins is limited, and when the amount of BSA reaches this capacity, the microspheres can no longer accommodate water molecules. The SF–CS microspheres were smaller than the pure CS microspheres; this is probably because of SF forming a dense network of cross-links and leaving less space for accommodating water molecules than that available in pure CS microspheres.
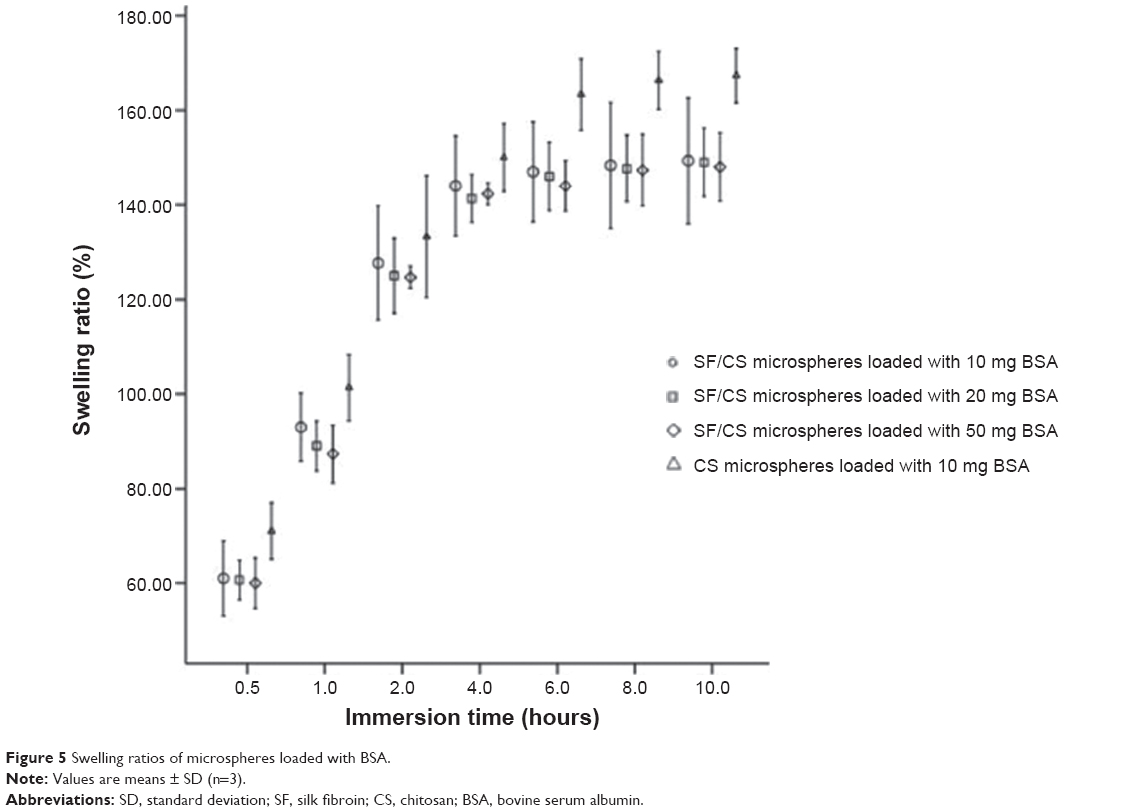 | Figure 5 Swelling ratios of microspheres loaded with BSA. |
FTIR studies
The FTIR spectra of CS contained three characteristic peaks at 3,380 cm−1, 1,653 cm−1, and 1,598 cm−1, representing –OH, –NH2 amide group I (C=O), and amide group II (NH2), respectively. The SF spectra contained four characteristic peaks at 3,293 cm−1, 1,629 cm−1, 1,518 cm−1, and 1,232 cm−1 (Figure 6), corresponding to the amide groups I, II, and III attributed to the SF present in a random-coil conformation,17 respectively. In the GM-3, GM-4, GM-7, GM-10, and GM-14 groups, a shift was detected from 3,380 cm−1 to 3,288 cm−1, 3,385 cm−1, 3,300 cm−1, 3,397 cm−1, and 3,289 cm−1; these characteristic peaks indicate the occurrence of hydrogen bonding in the microspheres.23 These peaks are mainly due to the random-coil conformation of SF. The characteristic band of CS at 1,598 cm−1 shifted to lower wavenumbers of 1,537 cm−1, 1,540 cm−1, 1,540 cm−1, 1,539 cm−1, and 1,536 cm−1 in GM-3, GM-4, GM-7, GM-10, and GM-14; this indicates nucleophilic substitution by the amino group of CS on the olefinic carbon atom at C-3 of genipin, followed by the opening of the dihydropyran ring to form the heterocyclic amine, and it represents the binding of genipin to this site.20,24,25 The C=O stretching vibration at 1,653 cm−1 of CS and 1,629 cm−1 of SF was shifted to 1,628 cm−1, 1,631 cm−1, 1,628 cm−1, and 1,629 cm−1, and these were attributed to the hydrogen bonds between C=O and NH2 within the CS being broken by genipin to release free C=O,26 but we observed that the C=O peak of GM-14 failed to shift; this could have occurred because of the amide I of the excess SF affecting the dissociation of the C=O of CS in GM-14. In the case of SF, the N–H peak that occurred at 3,293 cm−1 was weak and almost absent in the microspheres, which was attributed to this N–H being cross-linked to the N–H of CS by genipin; this suggests that the N–H sites would be the most accessible sites for cross-linking.27,28 Moreover, amide II and amide III of SF showed peaks at 1,518 cm−1 and 1,232 cm−1, which were shifted to 1,536 cm−1, 1,539 cm−1, 1,540 cm−1, 1,540 cm−1, and 1,537 cm−1 and 1,262 cm−1, 1,298 cm−1, 1,295 cm−1, 1,261 cm−1, and 1,266 cm−1, respectively, due to the conformation change from random coils or α-helices to β-sheets.9,29 BSA showed two characteristic peaks at 2,960 cm−1 and 1,452 cm−1; the peaks of the BSA entrapped in the microspheres did not change notably, indicating that BSA was not cross-linked by genipin.
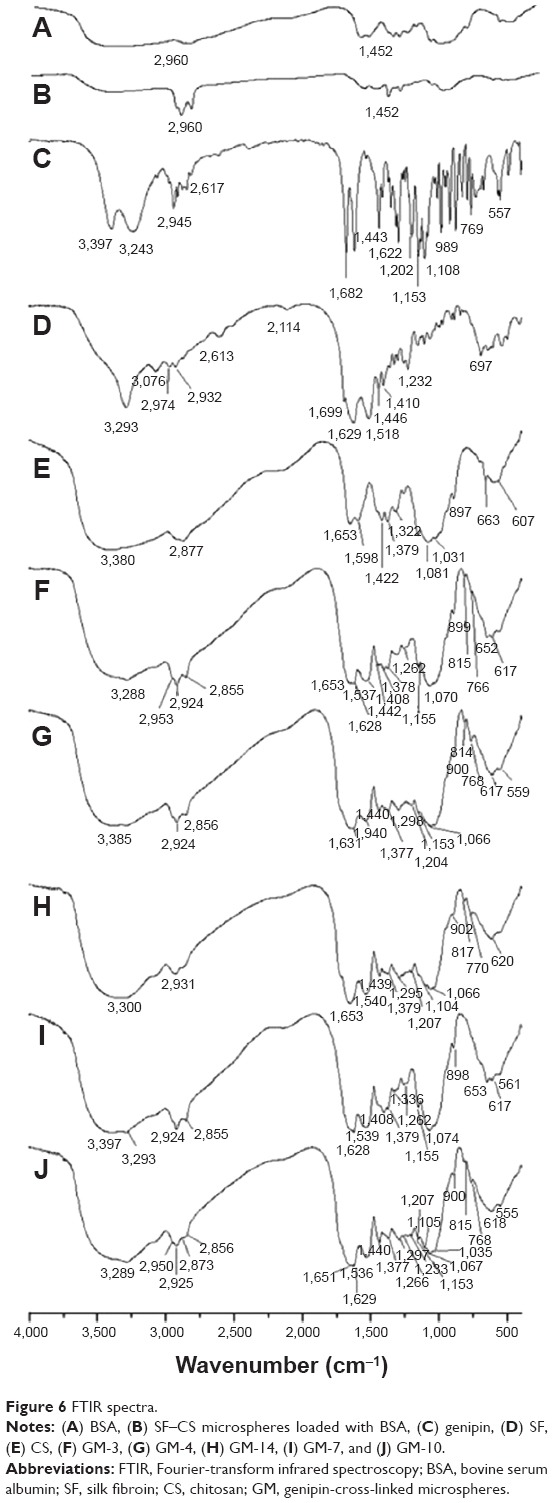 | Figure 6 FTIR spectra. |
XRD studies
The results of XRD analysis (Figure 7) showed that the 2θ diffraction peaks of CS appeared at 10.2°, 19.9°, 29.3°, and 31.2°; the main 2θ diffraction peaks of SF were at 9.0°, 18.1°, 18.9°, 20.5°, 21°, 23°, 29.7°, and 35°. The SF–CS microspheres showed 2θ diffraction peaks between 8.0° and −8.4° and near 20°. The microspheres prepared in the presence of 50 mg, 20 mg, and 10 mg of BSA yielded diffraction peaks respectively at 8.33° and 18.51°; 8°, 19.5°, and 23°; and 10.08° and 20.25°. These results agree with the FTIR data indicating that SF and CS were not merely mixed together but were cross-linked by genipin, leading to a change in the secondary structure of SF from random coils or α-helices into stable β-sheets, thus effectively enhancing its crystallinity and regularity. Chemical bonds were formed between SF and CS. These data and the FTIR results suggested that the genipin-mediated cross-linking of amino groups between SF and CS generates bonds that can improve the physical properties of the microspheres. Analysis of the BSA-loaded microspheres showed that the characteristic BSA peak disappeared in the microspheres prepared in the presence of 10 mg of BSA, which indicated that BSA was entrapped in a noncrystalline form in these microspheres. However, the microspheres prepared using 50 mg and 20 mg of BSA retained certain peaks because some of the BSA was not completely encapsulated in the microspheres and was instead adhered to their surface.
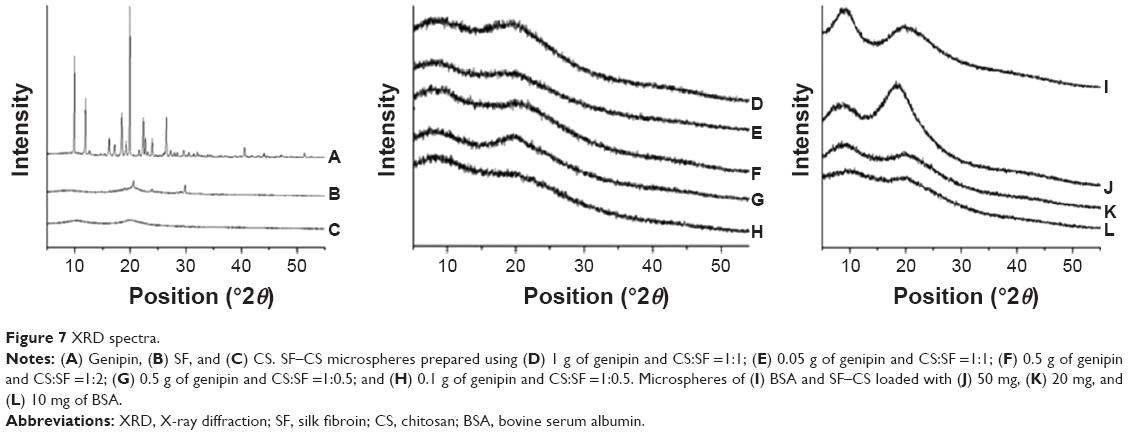 | Figure 7 XRD spectra. |
TGA studies
The TGA results showed that the CS weight remained constant when the temperature was increased from 120°C to 280°C, and that this was followed by rapid weight loss when the temperature was raised further (Figure 8). SF did not exhibit weight loss when the temperature was increased from 120°C to 205°C, but it rapidly lost weight when the temperature was raised from 205°C to 240°C. No additional weight loss occurred until ~290°C. BSA’s melting point is 232°C and its decomposition temperature is 350°C. Thus, microspheres prepared in the presence of 20 mg and 50 mg of BSA rapidly lost weight at ~235°C. The 10 mg BSA microspheres rapidly lost weight at 205°C, and the weight loss accelerated when the temperature was raised to 230°C. This is because most of the BSA was entrapped in the microspheres in the case of the 10 mg group. The weight loss here was mainly caused by the degradation of SF; conversely, numerous BSA molecules were adhered to the surface of the 20 mg and 50 mg BSA microspheres, and the weight loss of these surface-bound BSA molecules accounted for most of the weight loss in these microspheres. The melting point of BSA did not change among these three groups of microspheres, suggesting that BSA did not react with the cross-linking agent or the microspheres. This further confirmed the FTIR data.
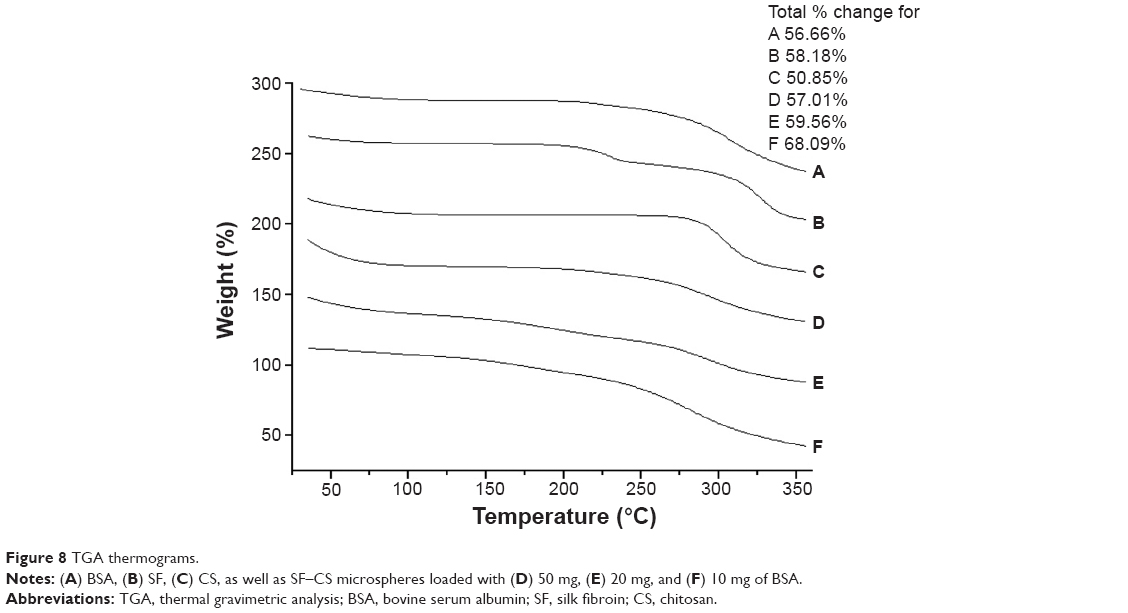 | Figure 8 TGA thermograms. |
Encapsulation efficiency and loading capacity
The loading capacity of microspheres increased with increasing BSA input (Table 3), going from 1.25%±0.11% to 5.27%±0.93% when the BSA dosage was increased from 10 mg to 50 mg. When the BSA dosage was increased from 10 mg to 20 mg, the encapsulation efficiency increased from 50.16%±4.32% to 56.58%±3.58%, but when the dosage reached 50 mg, the encapsulation efficiency decreased to 42.19%±7.47%. This is likely because the use of excess BSA lowers the number of BSA molecules entrapped in or adhered to the surface of the microspheres and also increases the number of molecules suspended in the wash supernatant. The loading capacity of CS microspheres was higher than that of SF–CS microspheres when the same amount of BSA was used. The SF–CS microspheres were heavier than the CS microspheres and this resulted in the differences in loading capacity.
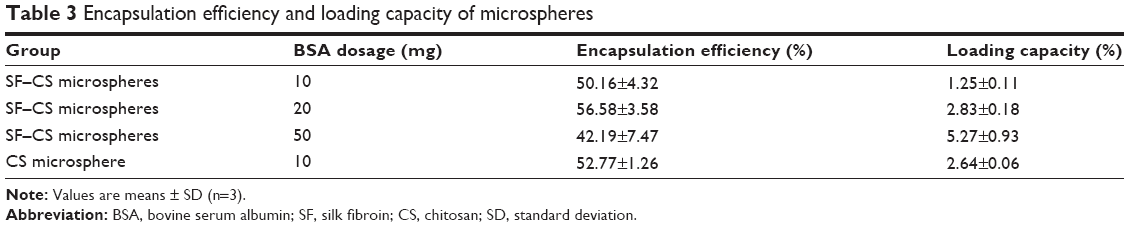 | Table 3 Encapsulation efficiency and loading capacity of microspheres |
In vitro release studies
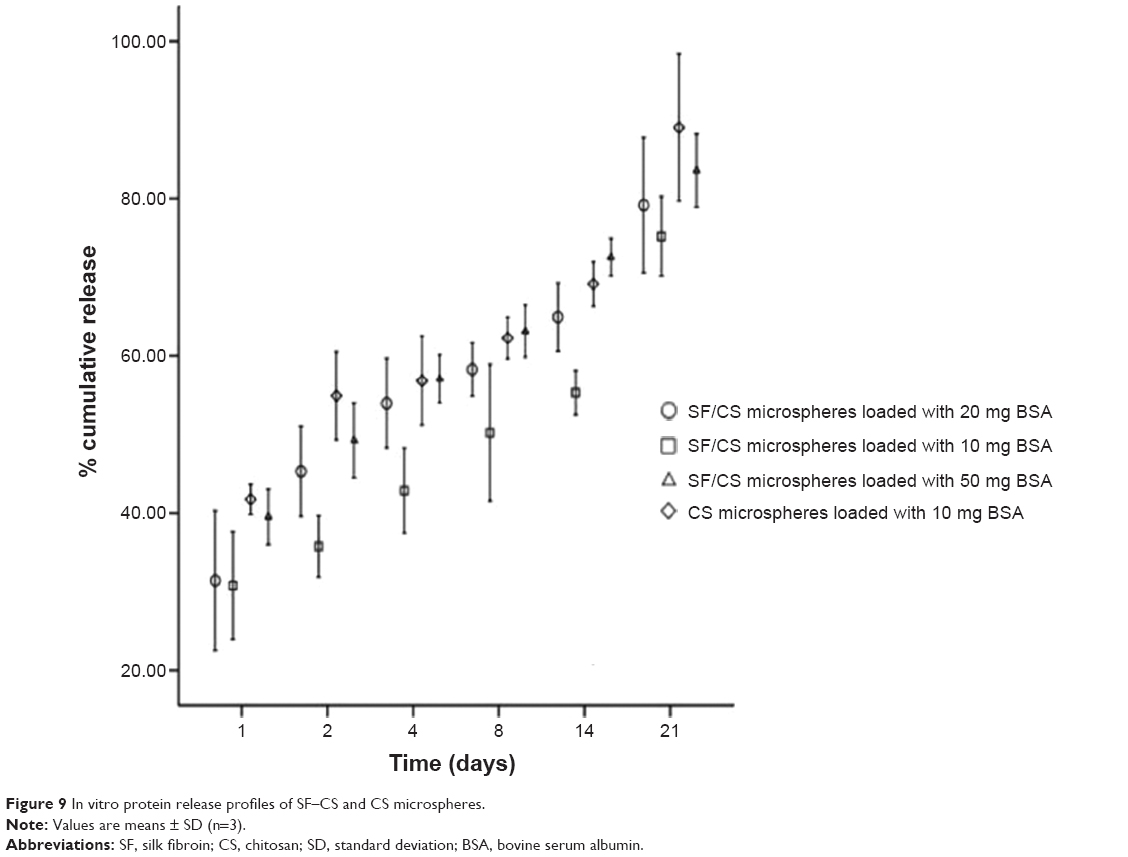
SF–CS microspheres prepared in the presence of 10 mg, 20 mg, and 50 mg of BSA burst release 30.79%±3.43%, 34.41%±4.46%, and 41.75%±0.96% of the total entrapped BSA on the 1st day, respectively (Figure 9). The CS microspheres burst release 39.53%±1.76% of the total entrapped BSA on the 1st day. The initial burst of BSA release might be due to the BSA adhered to the surface of the microspheres. The 50 mg group burst release >40% of the BSA, probably because more BSA was present on the surface of these microspheres than on the microspheres of other groups, as suggested by FTIR and XRD analyses.20
 | Figure 9 In vitro protein release profiles of SF–CS and CS microspheres. |
After 21 days, the 10 mg, 20 mg, and 50 mg SF–CS microspheres and the CS microspheres cumulatively released 75.20%±2.52%, 79.16%±4.31%, 89.04%±4.68%, and 83.57%±2.33% of the total BSA, respectively. The release from the four groups can be divided into two phases: rapid release on the 1st day and sustained release in the following days. The SF–CS microspheres exhibited superior sustained release when compared with the CS microspheres because the SF–CS microsphere wall was composed of cross-linked SF and CS that can effectively control the release of encapsulated contents and wall degradation; consequently, the duration of BSA release was lengthened. The release models for the three groups of SF–CS microspheres are shown in Table 4. When the relevant coefficients of each equation were used as indicators, the release in the three microsphere groups was found to be in accordance with the Higuchi equation and the Weibull distribution model. This result indicates that each of these SF–CS microspheres possessed a defined sustained-release capability.
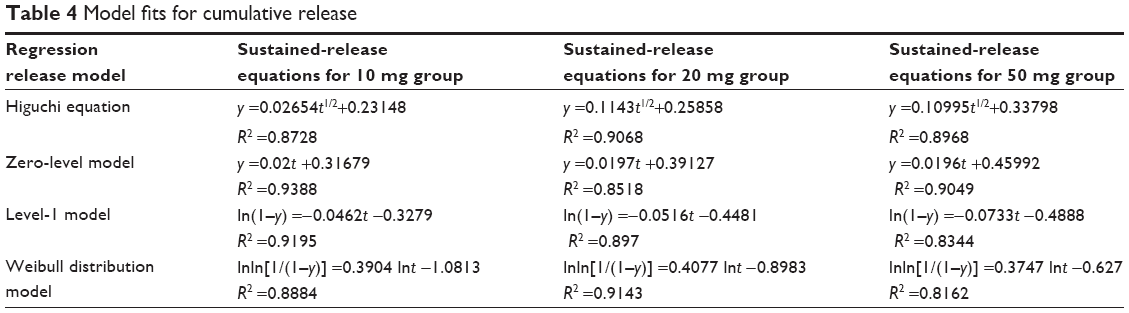 | Table 4 Model fits for cumulative release |
Discussion
Microspheres and microcapsules have been widely used in biomaterials and pharmaceutics,30 and they can be used to carry cell growth factors or chemicals, prolong drug release, or target drugs to specific cells and tissues. Recently, substantial attention has been devoted toward investigating sustained-release microspheres or microcapsules, and numerous materials have been used for preparing microspheres and microcapsules; however, few studies have focused on methods to reduce their initial burst release and prolong the release time. She et al29 prepared scaffolds by using distinct SF-to-CS ratios and determined that SF–CS scaffolds can potently promote the proliferation of a human hepatoma cell line. We were inspired by the research of She et al29 and in this study, we attempted to reduce the initial burst release rate and prolong the release time by generating improved SF–CS microspheres.
A classic model protein used for studying the slow-release properties of microspheres is BSA.31–34 BSA and bone morphogenetic protein-2 exhibit no marked differences in terms of encapsulation efficiency and loading capacity and demonstrate only slight differences in their cumulative release.23 Thus, we used BSA as the model protein in our investigation of the sustained-release properties of microspheres.
The preparation of microspheres by means of emulsion cross-linking requires cross-linking agents; however, the most commonly used cross-linkers, such as glutaraldehyde, NaOH, sodium tripolyphosphate, formaldehyde, ethylene glycol, ether, and disulfide, are toxic and exert unpredictable effects. Thus, the biocompatibility of the microspheres prepared using these cross-linkers remains in question. By contrast, genipin is a natural cross-linking agent that is hydrolyzed from geniposidic acid by β-glucosidase. Genipin is already being used for treating liver disease, high blood pressure, and constipation; moreover, genipin has been reported to be capable of improving insulin secretion and relieving diabetes symptoms.35,36 Furthermore, Tsai et al37 found that after injection into rats, CS microspheres that were cross-linked using genipin demonstrated superior tissue-healing effects and slower degradability than did microspheres cross-linked using glutaraldehyde. Therefore, we used genipin as the cross-linking agent in this study.
When SF–CS microspheres are prepared using emulsion cross-linking, the SF:CS ratio and the amount of the cross-linking agent used are factors that critically affect the morphology of the microspheres, as well as their physical and chemical properties. Shang et al38 prepared a blended film featuring distinct SF-to-cellulose ratios and found that this film exhibited increases in tensile strength, thermal stability, and water stability when the SF-to-cellulose ratio was altered. Thus, to optimize the ratio of the microsphere materials, we used various ratios of SF and CS in the microsphere preparation and then used SEM to identify the microspheres that exhibited the most favorable physical and chemical properties. From these optimized microspheres, we selected one subtype to further study encapsulation efficiency and sustained release. Our results showed that SF and CS modified each other’s properties, and thus the SF–CS microspheres demonstrated a lower initial burst release rate and a longer sustained-release phase when compared with pure CS microspheres.
During microsphere preparation, the CS solution was added dropwise through a #7 needle into an oil phase and the mixture was stirred for 30 minutes, after which the SF solution was added dropwise to generate a W/O emulsion; finally, the genipin solution was added. The results of FTIR and XRD analyses confirmed that genipin cross-linked the –NH2 groups of SF and CS. Cross-linking time can also affect microsphere formation and, the cross-linking reaction here was complete after 2 hours; the use of shorter times affected the surface morphology and the physical properties of the obtained microspheres. The proportions of the cross-linking agent, SF, and CS can also affect the formation of microspheres. When the cross-linking agent was insufficient, the microspheres exhibited poor morphology, were highly brittle, and disintegrated readily; conversely, the use of excessive amounts of the cross-linking agent caused excess cross-linking of SF and CS and resulted in poor microsphere shape or excessive adhesion between microspheres.
The encapsulation efficiency and loading capacity of microspheres are limited. When the amount of the loaded molecule (drug) was low, the loading capacity of the microspheres was correspondingly low and the amount of the drug entrapped was also low. Thus, the space for accommodating water molecules within the microspheres was high and this resulted in an increase in Esw values. We determined that the encapsulation efficiency of the microspheres of the 10 mg BSA group was lower than that of the 20 mg group microspheres (Figure 5). During the swelling of the microspheres, the Esw value of the 10 mg group was slightly higher than those of the 20 mg and 50 mg groups during the first 4 hours; however, at longer time points, the Esw values of the three groups of microspheres became similar because the space available for accommodating water molecules within the microspheres diminished gradually. Furthermore, encapsulation efficiency dropped when the BSA dosage exceeded a limit because of the increase in the amount of BSA that was not entrapped in the microspheres. The Esw of these microspheres was also lowered because the space within the microspheres for accommodating water molecules was diminished.
Microspheres prepared by means of emulsion cross-linking are widely recognized to be capable of slowly releasing their contents. Our results showed that regardless of its dosage (10 mg, 20 mg, or 50 mg), BSA’s sustained release was in line with the zero-level model, level-1 model, the Weibull distribution model, and the Higuchi equation, although the microspheres prepared in the presence of distinct BSA dosages showed differences in cumulative release. When 50 mg of BSA was used, the microspheres exhibited a high initial burst release and a high cumulative release after 21 days. However, when the same 10 mg dose of BSA was used, the SF–CS microspheres and the CS microspheres showed marked differences in sustained release, probably because SF was cross-linked with CS and was present in a highly dense network in the microsphere wall in the composite microspheres; consequently, the SF–CS microspheres released BSA more slowly than did the CS microspheres.
Conclusion
We investigated the preparation of genipin-cross-linked SF–CS microspheres by using an emulsion cross-linking method and determined the optimal ratio of the starting materials. We also examined the encapsulation efficiency and sustained-release capacity of the microspheres by using BSA as a model protein. The microspheres exhibit regular surface morphology, an appropriate particle size, optimal physical and chemical properties, high encapsulation efficiency, and prolonged release. Compared with pure CS microspheres, the SF–CS microspheres demonstrate a lower initial burst release and a prolonged cumulative release up to 21 days. Therefore, genipin-cross-linked SF–CS microspheres might function as effective drug carriers.
Acknowledgment
This study was supported by the Science and Technology Planning Project of Guangdong Province, People’s Republic of China (project number 2011B031300022).
Author contributions
SGZ designed the study. SGZ, MWY, JQQ, WF, MDR, ZHG, and WFG conducted the experiments and data analysis, SGZ and MWY drafted the manuscript. All authors critically reviewed the manuscript and approved the final version for publication.
Disclosure
The authors have no financial interests that might be perceived to affect the results or the discussion reported in this article.
References
Wang LY, Gu YH, Su ZG, Ma GH. Preparation and improvement of release behavior of chitosan microspheres containing insulin. Int J Pharm. 2006;311(1–2):187–195. | ||
Khor E, Lim LY. Implantable applications of chitin and chitosan. Biomaterials. 2003;24(13):2339–2349. | ||
Sinha VR, Singla AK, Wadhawan S, et al. Chitosan microspheres as a potential carrier for drugs. Int J Pharm. 2004;274(1–2):1–33. | ||
Desai KG, Park HJ. Effect of manufacturing parameters on the characteristics of vitamin C encapsulated tripolyphosphate-chitosan microspheres prepared by spray-drying. J Microencapsul. 2006;23(1):91–103. | ||
Wang X, Wenk E, Matsumoto A, Meinel L, Li C, Kaplan DL. Silk microspheres for encapsulation and controlled release. J Control Release. 2007;117(3):360–370. | ||
Welsh ER, Schauer CL, Qadri SB, Price RR. Chitosan cross-linking with a water-soluble, blocked diisocyanate. 1. Solid state. Biomacromolecules. 2002;3(5):1370–1374. | ||
Ballantyne B, Jordan SL. Toxicological, medical and industrial hygiene aspects of glutaraldehyde with particular reference to its biocidal use in cold sterilization procedures. J Appl Toxicol. 2001;21(2):131–151. | ||
Jin J, Song M, Hourston DJ. Novel chitosan-based films cross-linked by genipin with improved physical properties. Biomacromolecules. 2004;5(1):162–168. | ||
Zhang K, Qian Y, Wang H, et al. Genipin-crosslinked silk fibroin/hydroxybutyl chitosan nanofibrous scaffolds for tissue-engineering application. J Biomed Mater Res A. 2010;95(3):870–881. | ||
Higuchi T. Rate of release of medicaments from ointment bases containing drugs in suspension. J Pharm Sci. 1961;50:874–875. | ||
Weibull W. A statistical distribution of wide applicability. J Appl Mech. 1951;18:293–297. | ||
Yang X, Shang S, Li L, Tao X, Yan F. Vapor phase polymerization of 3,4-ethylenedioxythiophene on flexible substrate and its application on heat generation. Polym Adv Technol. 2011;22(6):1049–1055. | ||
Shang S, Yang X, Tao X, Lam SS. Vapor phase polymerization of pyrrole on flexible substrate at low temperature and its application on heat generation. Polym Int. 2010;59(2):204–211. | ||
Liu J, Liu C, Liu Y, Chen M, Hu Y, Yang Z. Study on the grafting of chitosan–gelatin microcapsules onto cotton fabrics and its antibacterial effect. Colloids Surf B Biointerfaces. 2013;109:103–108. | ||
Chiu YT, Chiu CP, Chien JT, Ho GH, Yang J, Chen BH. Encapsulation of lycopene extract from tomato pulp waste with gelatin and poly(gamma-glutamic acid) as carrier. J Agric Food Chem. 2007;55(13):5123–5130. | ||
Lamprecht A, Schaèfer U, Lehr CM. Influences of process parameters on preparation of microparticle used as a carrier system for x3 unsaturated fatty acid ethyl esters used in supplementary nutrition. J Microencapsul. 2001;18(3):347–357. | ||
Nakagawa K, Iwamoto S, Nakajima M, Shono A, Satoh K. Microchannel emulsification using gelatin and surfactant-free coacervate microencapsulation. J Colloid Interface Sci. 2004;278(1):198–205. | ||
Silva DF, Fávaro-Trindade CS, Rocha GA. Microencapsulation of lycopene by gelatin–pectin complex coacervation. J Food Process Preserv. 2012;36:185–190. | ||
Rocha-Selmi GA, Bozza FT, Thomazini M, Bolini HM, Fávaro-Trindade CS. Microencapsulation of aspartame by double emulsion followed by complex coacervation to provide protection and prolong sweetness. Food Chem. 2013;139(1–4):72–78. | ||
Kawadkar J, Chauhan MK. Intra-articular delivery of genipin cross-linked chitosan microspheres of flurbiprofen: preparation, characterization, in vitro and in vivo studies. Eur J Pharm Biopharm. 2012;81(3):563–572. | ||
Shang S, Zeng W, Tao X. Investigation on the electrical response behaviors of multiwalled carbon nanotube/polyurethane composite in organic solvent vapors. Sens Actuators B Chem. 2012;166–167:330–337. | ||
Wang X, Yucel T, Lu Q, Hu X, Kaplan DL. Silk nanospheres and microspheres from silk/pva blend films for drug delivery. Biomaterials. 2010;31(6):1025–1035. | ||
Niu X, Feng Q, Wang M, Guo X, Zheng Q. Preparation and characterization of chitosan microspheres for controlled release of synthetic oligopeptide derived from BMP-2. J Microencapsul. 2009;26(4):297–305. | ||
Mi FL, Sung HW, Shyu SS. Synthesis and characterization of a novel chitosan-based network prepared using naturally occurring crosslinker. J Polym Sci A Polym Chem. 2000;38:2804. | ||
Huang H, Wu J, Lin X, et al. Self-assembly of polypyrrole/chitosan composite hydrogels. Carbohydr Polym. 2013;95(1):72–76. | ||
Shang S, Zhu L, Fan J. Intermolecular interaction between natural polysaccharides and silk fibroin protein. Carbohydr Polym. 2013;93(2):561–573. | ||
Shang S, Zhu L, Chen W, Yi L, Qi D, Yang L. Reducing silk fibrillation through MMA graft method. Fibers Polym. 2009;10(6):807–812. | ||
Lu T, Shan G, Shang S. Stability of two-phase polymerization of acrylamide in aqueous poly(ethylene glycol) solution. J Appl Polym Sci. 2011;122(2):1121–1133. | ||
She Z, Jin C, Huang Z. Silk fibroin/chitosan scaffold: preparation, characterization, and culture with HepG2 cell. J Mater Sci Mater Med. 2008;19(12):3545–3553. | ||
Jones GL, Motta A, Marshall MJ, El Haj AJ, Cartmell SH. Osteoblast: osteoclast co-cultures on silk fibroin, chitosan and PLLA films. Biomaterials. 2009;30(29):5376–5384. | ||
Yang Y, Tang G, Zhang H, et al. Controllable dual-release of dexamethasone and bovine serum albumin from PLGA/β-tricalcium phosphate composite scaffolds. J Biomed Mater Res B Appl Biomater. 2011;96(1):139–151. | ||
Yu J, Wan F, Zhang C, Yan M, Zhang X, Wang S. Molecularly imprinted polymeric microspheres for determination of bovine serum albumin based on flow injection chemiluminescence sensor. Biosens Bioelectron. 2010;26(2):632–637. | ||
Zhai Z, Wang Y, Chen Y, Luo G. Fast adsorption and separation of bovine serum albumin and lysozyme using micrometer-sized macromesoporous silica spheres. J Sep Sci. 2008;31(20):3527–3536. | ||
Li X, Zhang B, Li W, et al. Preparation and characterization of bovine serum albumin surface-imprinted thermosensitive magnetic polymer microsphere and its application for protein recognition. Biosens Bioelectron. 2014;51:261–267. | ||
Prysiazhna OD, Sahach VF. The role of mitochondrial uncoupling proteins in the development of changes of endothelium-dependent reactions of the heart and vessels in experimental diabetes mellitus. Fiziol Zh. 2008;54(1):10–16. | ||
Guan L, Feng H, Gong D. Genipin ameliorates age-related insulin resistance through inhibiting hepatic oxidative stress and mitochondrial dysfunction. Exp Gerontol. 2013;48(12):1387–1394. | ||
Tsai CC, Huang RN, Sung HW, Liang HC. In vitro evaluation of the genotoxicity of a naturally occurring crosslinking agent (genipin) for biologic tissue fixation. J Biomed Mater Res. 2000;52(1):58–65. | ||
Shang S, Zhu L, Fan J. Physical properties of silk fibroin/cellulose blend films regenerated from the hydrophilic ionic liquid. Carbohydr Polym. 2011;86(2):462–468. |
 © 2015 The Author(s). This work is published and licensed by Dove Medical Press Limited. The full terms of this license are available at https://www.dovepress.com/terms.php and incorporate the Creative Commons Attribution - Non Commercial (unported, v3.0) License.
By accessing the work you hereby accept the Terms. Non-commercial uses of the work are permitted without any further permission from Dove Medical Press Limited, provided the work is properly attributed. For permission for commercial use of this work, please see paragraphs 4.2 and 5 of our Terms.
© 2015 The Author(s). This work is published and licensed by Dove Medical Press Limited. The full terms of this license are available at https://www.dovepress.com/terms.php and incorporate the Creative Commons Attribution - Non Commercial (unported, v3.0) License.
By accessing the work you hereby accept the Terms. Non-commercial uses of the work are permitted without any further permission from Dove Medical Press Limited, provided the work is properly attributed. For permission for commercial use of this work, please see paragraphs 4.2 and 5 of our Terms.