")
Back to Journals » Drug Design, Development and Therapy » Volume 10
Prediction of selective estrogen receptor beta agonist using open data and machine learning approach
Authors Niu A, Xie L, Wang H, Zhu B, Wang S
Received 15 April 2016
Accepted for publication 4 July 2016
Published 18 July 2016 Volume 2016:10 Pages 2323—2331
DOI https://doi.org/10.2147/DDDT.S110603
Checked for plagiarism Yes
Review by Single anonymous peer review
Peer reviewer comments 2
Editor who approved publication: Prof. Dr. Wei Duan
Ai-qin Niu,1 Liang-jun Xie,2 Hui Wang,1 Bing Zhu,1 Sheng-qi Wang3
1Department of Gynecology, the First People’s Hospital of Shangqiu, Shangqiu, Henan, People’s Republic of China; 2Department of Image Diagnoses, the Third Hospital of Jinan, Jinan, Shandong, People’s Republic of China; 3Department of Mammary Disease, Guangdong Provincial Hospital of Chinese Medicine, the Second Clinical College of Guangzhou University of Chinese Medicine, Guangzhou, People’s Republic of China
Background: Estrogen receptors (ERs) are nuclear transcription factors that are involved in the regulation of many complex physiological processes in humans. ERs have been validated as important drug targets for the treatment of various diseases, including breast cancer, ovarian cancer, osteoporosis, and cardiovascular disease. ERs have two subtypes, ER-α and ER-β. Emerging data suggest that the development of subtype-selective ligands that specifically target ER-β could be a more optimal approach to elicit beneficial estrogen-like activities and reduce side effects.
Methods: Herein, we focused on ER-β and developed its in silico quantitative structure-activity relationship models using machine learning (ML) methods.
Results: The chemical structures and ER-β bioactivity data were extracted from public chemogenomics databases. Four types of popular fingerprint generation methods including MACCS fingerprint, PubChem fingerprint, 2D atom pairs, and Chemistry Development Kit extended fingerprint were used as descriptors. Four ML methods including Naïve Bayesian classifier, k-nearest neighbor, random forest, and support vector machine were used to train the models. The range of classification accuracies was 77.10% to 88.34%, and the range of area under the ROC (receiver operating characteristic) curve values was 0.8151 to 0.9475, evaluated by the 5-fold cross-validation. Comparison analysis suggests that both the random forest and the support vector machine are superior for the classification of selective ER-β agonists. Chemistry Development Kit extended fingerprints and MACCS fingerprint performed better in structural representation between active and inactive agonists.
Conclusion: These results demonstrate that combining the fingerprint and ML approaches leads to robust ER-β agonist prediction models, which are potentially applicable to the identification of selective ER-β agonists.
Keywords: estrogen receptor subtype β, selective estrogen receptor modulators, quantitative structure-activity relationship models, machine learning approach
Introduction
Estrogen receptors (ERs) are nuclear transcription factors and hormone-regulated modulators of intracellular signaling and gene expression.1–4 There are two subtypes of ERs, ER-α and ER-β. ER-α is encoded by the ESR1 gene on chromosome 6, and ER-β is encoded by the ESR2 gene on chromosome 14.5 Both ER-α and ER-β are widely distributed in many kinds of cells and tissues, and modulate biological functions in several organ systems, such as endocrine, reproductive, skeletal, cardiovascular, and central nervous systems. ER-α is predominantly expressed in mammary gland, ovary, uterus, male reproductive organs (testes and epididymis), prostate, liver, heart, bone, adipose tissue, vascular system, and brain. ER-β is mainly expressed in mammary gland, ovary (granulosa cells), bladder, prostate (epithelium), adipose tissue, immune system, colon, heart, vascular system, lung, and brain.6,7 The ER-α subtype has a more prominent role in the mammary gland, uterus, the preservation of skeletal homeostasis, and the regulation of metabolism. The ER-β subtype has a more profound effect on the immune and central nervous systems. What is more, ER-β generally counteracts the ER-α promoted cell hyper-proliferation in tissues such as breast and uterus.4,8
Abnormal ER signaling leads to development of a variety of diseases including osteoporosis. Estradiol replacement therapy is used in the clinic for the treatment of osteoporosis. However, estradiol replacement therapy often leads to an increased risk of breast and endometrial cancers, and thromboembolism due to the ER-α promoted cell hyper-proliferation.4 Selective estrogen receptor modulators (SERMs) are a class of drugs that act on the ER. A characteristic that distinguishes these substances from pure ER agonists and antagonists (that is, full agonists and silent antagonists) is that their action is different in various tissues, thereby granting the possibility to selectively inhibit or stimulate estrogen-like action in various tissues.9,10 Following tamoxifen, the first SERM, a number of other anti-estrogens have been developed. Good SERMs would display antagonist activity in the mammary gland and uterus, and agonist activity in cardiovascular, skeletal, and central nervous systems.9,11,12 Emerging data suggest that ER-β subtype-selective ligands could be used to elicit beneficial estrogen-like activities and reduce side effects.4,13–15 These results inspired the medical researchers to discover selective ER-β agonists. Roberts et al found sulfonamides as selective ER-β agonists.16 Paterni et al identified a series of new salicylketoxime derivatives that display unprecedentedly high levels of ER-β selectivity, and one compound was further proved to be active in an in vivo xenograft model of human glioma.17
Computational approaches in medicinal chemistry provide important tools for lead discovery and lead optimizations. Machine learning methods are widely applied in computer aided drug design, particularly in the ligand based virtual screening. Zang et al developed binary classification models using a large collection of environmental chemicals from ER assays by quantitative structure-activity relationship (QSAR) and machine learning methods.18 Ng et al developed a classification model using decision forest to predict environmental chemicals binding to ER.19 However, previous QSAR studies mainly focused on toxicity or endocrine disruption activity predictions for environmental chemicals. Furthermore, there had been rare reports focusing on the subtype-selective ER agonist prediction.
Owing to the significance of the selective ER-β agonists, as discussed above, we proposed a protocol to predict selective ER-β agonists using a machine learning approach (Figure 1). Due to the difficulty in developing a regression model for a large structural diverse dataset, binary classification approaches were used here. In this work, we collected a dataset of selective ER-β agonists from an open database (ChEMBL, www.ebi.ac.uk/chembl) and performed the dataset analysis using principal component analysis (PCA) and distance analysis. Then we constructed the prediction models using various molecular fingerprints and machine learning approaches. The accuracies and robustness of the prediction models were further validated, and the performance of the machine learning methods and the molecular fingerprints was compared. These models could be useful in the discovery of selective ER-β agonists.
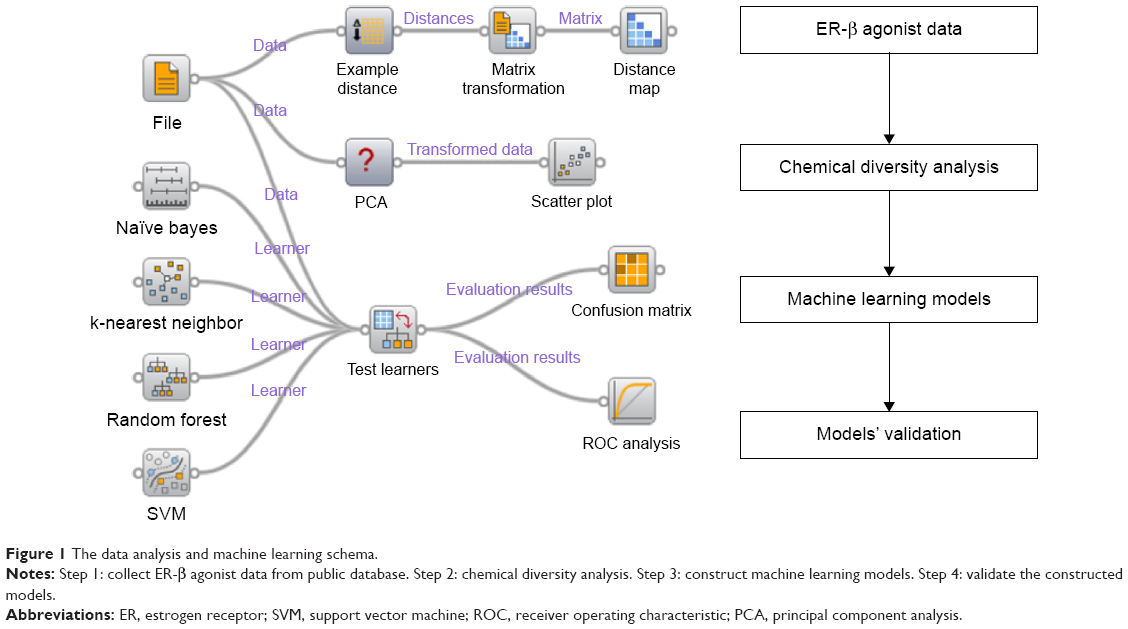 | Figure 1 The data analysis and machine learning schema. |
Materials and methods
Dataset
The ER-β bioactive agonists were downloaded from ChEMBL database (ChEMBL 20 release). Duplicates and salts were removed using Open Babel.20 Compounds with unclear EC50 data, for example <1,000 nM, were removed. The active ER-β agonist was defined as having an EC50 less than 10 μM. The inactive agonist was defined as having an EC50 more than 10 μM. Finally a dataset was constructed which contained 356 active agonists and 107 inactive agonists. The balancing of the dataset is important for developing a robust model. Machine learning approaches are likely to perform poorly in situations with data imbalance between the classes.21,22 In order to balance the dataset, we generated a decoy dataset (249 compounds) using the DUD-E online automated tool.23 Finally, a dataset with 356 active compounds and 356 inactive compounds was obtained.
Molecular fingerprints
Molecular fingerprints are representations of chemical structures originally developed for substructure and similarity searching, but later widely used for descriptors in QSAR studies.24 Four popular fingerprint generation methods in chemoinformatics including Chemistry Development Kit extended fingerprint (ExtFP, 1024 bits), MACCS fingerprint (MACCSFP, 166 bits), PubChem fingerprint (PubChemFP, 881 bits), and 2D atom pairs (AP2D, 780 bits) were used in this study. All the fingerprints were generated using the PaDEL-Descriptor software.25
Naïve Bayesian (NB) classification
The NB classification method is a simple classification method based on the Bayes’ theorem as described below:
|
|
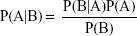
The prior probability can be estimated from the training set, while the marginal probability can be ignored. The details of NB classifier building have been described elsewhere.26,27 NB classification can process large amounts of data, learn fast, and noise data tolerance. The NB classifiers were developed in Orange with default settings. Laplace method was used for probability estimation.
k-nearest neighbor (KNN)
KNN classifier can predict a test sample based on the closest training examples. The nearness is measured by similarity or distance based on vectors in a multidimensional feature space. In the classification process, “k” was a user-defined value, and an unlabeled vector was classified by assigning the label that was most frequent in the k-nearest training samples. The KNN classifiers were developed in Orange using Euclidean distance and the value of “k” was set to three.
Random forest (RF)
The RF was first proposed by Breiman.28 The RF method is based upon an ensemble of decision trees, from which the prediction of a continuous variable is provided as the average of the predictions of all trees. The advantages of RF in QSAR include high accuracy of prediction, built-in descriptor selection, and a method for evaluating the importance of descriptors in the QSAR model. The details of training procedures are described elsewhere.29 The RF classifiers were developed in Orange and the number of trees in forest was set to ten, splitting was stopped in RF with nodes of five or fewer instances.
Support vector machine (SVM)
SVM is a general data modeling methodology, originally developed by Vapnik, aimed at minimizing the structural risk under the frame of Vapnik Chervonenkis theory.30 The principle of SVM is to find a hyperplane in a high dimensional space to separate the positives and negatives.31 In this work, the radial basis function kernel function was used and the cost was set to 1.00. SVM models were developed using Orange.
Model validation
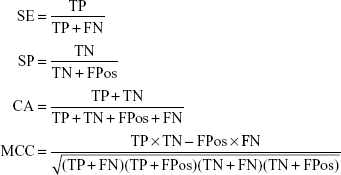
Cross validation method was employed to test the model performance and robustness. In 5-fold cross validation, the dataset was divided into five subsets, four subsets were chosen as training sets which left one subset as test set in each run. After five runs, each subset was used as test set and the entire dataset was predicted. The quality of the model was evaluated by the quantity of true positives (TP), true negatives (TN), false positives (FPos), and false negatives (FN). Then the sensitivity (SE), the specificity (SP), the classification accuracy (CA) and the Matthews correlation coefficient (MCC) were calculated using the following equations. Furthermore, the receiver operating characteristic (ROC) curve was plotted and the area under the ROC curve (AUC) was calculated. The values of AUC range from 0–1.0, and 1.0 indicates a perfect model, 0.5 indicates a random model, and >0.8 indicates a good model.
|
|
Results and discussion
Chemical diversity analysis
The diversity is important when building a QSAR model.32 The PCA was performed here to explore the chemical space of the dataset, which contained 356 active agonists and 356 inactive agonists. For each molecule, four types of fingerprints (ExtFP 1024 bits, MACCSFP 166 bits, PubChemFP 881 bits, and AP2D 780 bits) were calculated as descriptors. Each compound is represented by a multi-dimensional vector, the dimension of which is equal to the bit-length of a fingerprint. A reducing dimension calculation was processed in the PCA. The top two principal components were preserved and plotted as illustrated in Figure 2. Each node represents a molecule of the entire dataset. The actives and inactives were rendered in black and gray color, respectively. The actives and the inactives cover the same chemical space, suggesting the diversity of this collected dataset and the reasonability of the decoy generation methods. The distance of the compounds in this dataset was calculated using Euclidean distance based on the ExtFP. A distance matrix (712×712) was generated and plotted with a heat map. The distance values were normalized to interval 0–1. One represents the largest distance (green) and suggests the structural dissimilarity. As shown in Figure 3, most areas in the heat map were green, indicating the chemical diversity of this dataset.
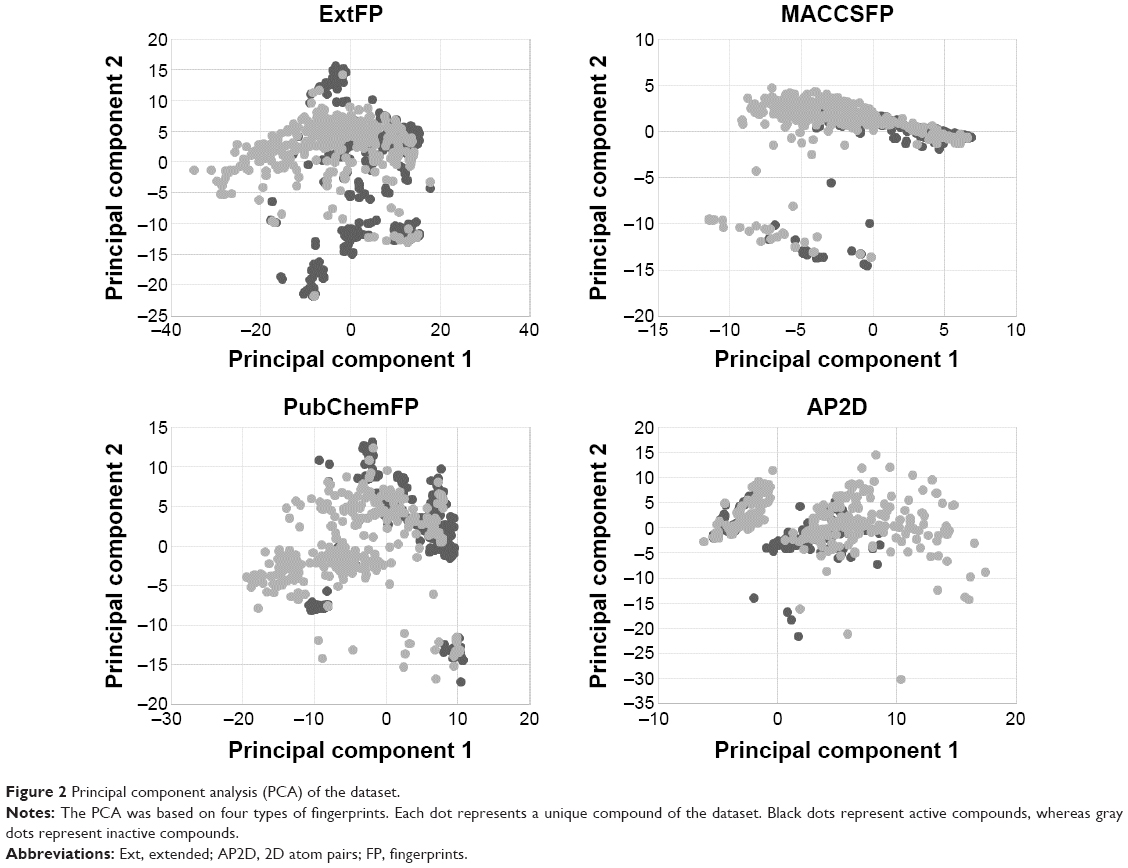 | Figure 2 Principal component analysis (PCA) of the dataset. |
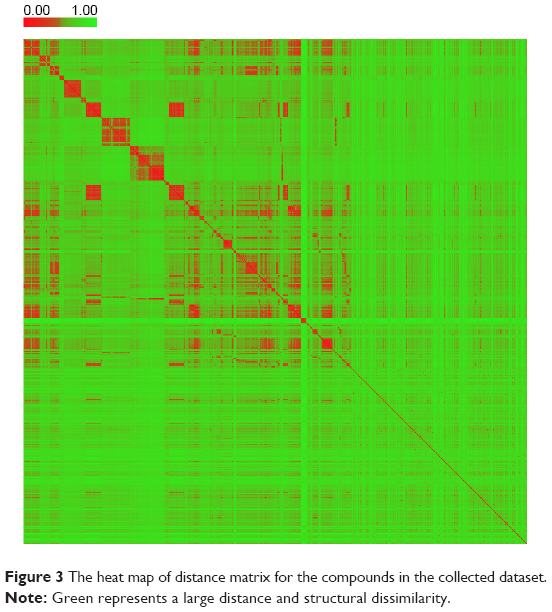 | Figure 3 The heat map of distance matrix for the compounds in the collected dataset. |
Performance of cross validation
In order to evaluate the performance of models, 5-fold cross validation was employed here. We developed 16 models based on four types of fingerprints and four classifiers. The CA, SE, SP, AUC, and MCC values are listed in Table 1. The ranges of CA, SE, SP, AUC, and MCC were 0.7710–0.8834, 0.8146–0.9410, 0.6938–0.8820, 0.8151–0.9475, and 0.5487–0.7698, respectively. The ROC curves of the 16 models are illustrated in Figure 4. The AUC values of all models were greater than 0.8, indicating the good performance of the constructed models. The excellent models (MCC >0.75) were SVM combined with ExtFP, and RF combined with ExtFP. SVM-ExtFP achieved performances of CA 0.8834 and MCC 0.7698. RF-ExtFP achieved a performance of CA 0.8750 and MCC 0.7501. Ten-fold cross validation method was also employed and the model performances were evaluated and are listed in Table S1. Compared with 5-fold cross validation results, 10-fold cross validation results tended to be a bit more optimistic and showed a similar trend. In the following study, the 5-fold cross validation results were used. For comparison, we developed models using true inactive agonists that do not include decoys. The 5-fold cross validation model performance is listed in Table S2. The mean value of the MCC for the 16 models is 0.3518, this indicates a poor performance of the imbalanced dataset when compared with the balanced dataset, which achieved a mean value of MCC 0.6881.
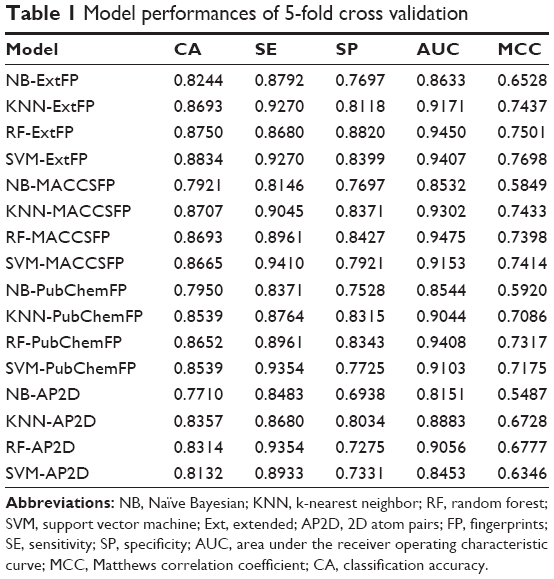 | Table 1 Model performances of 5-fold cross validation |
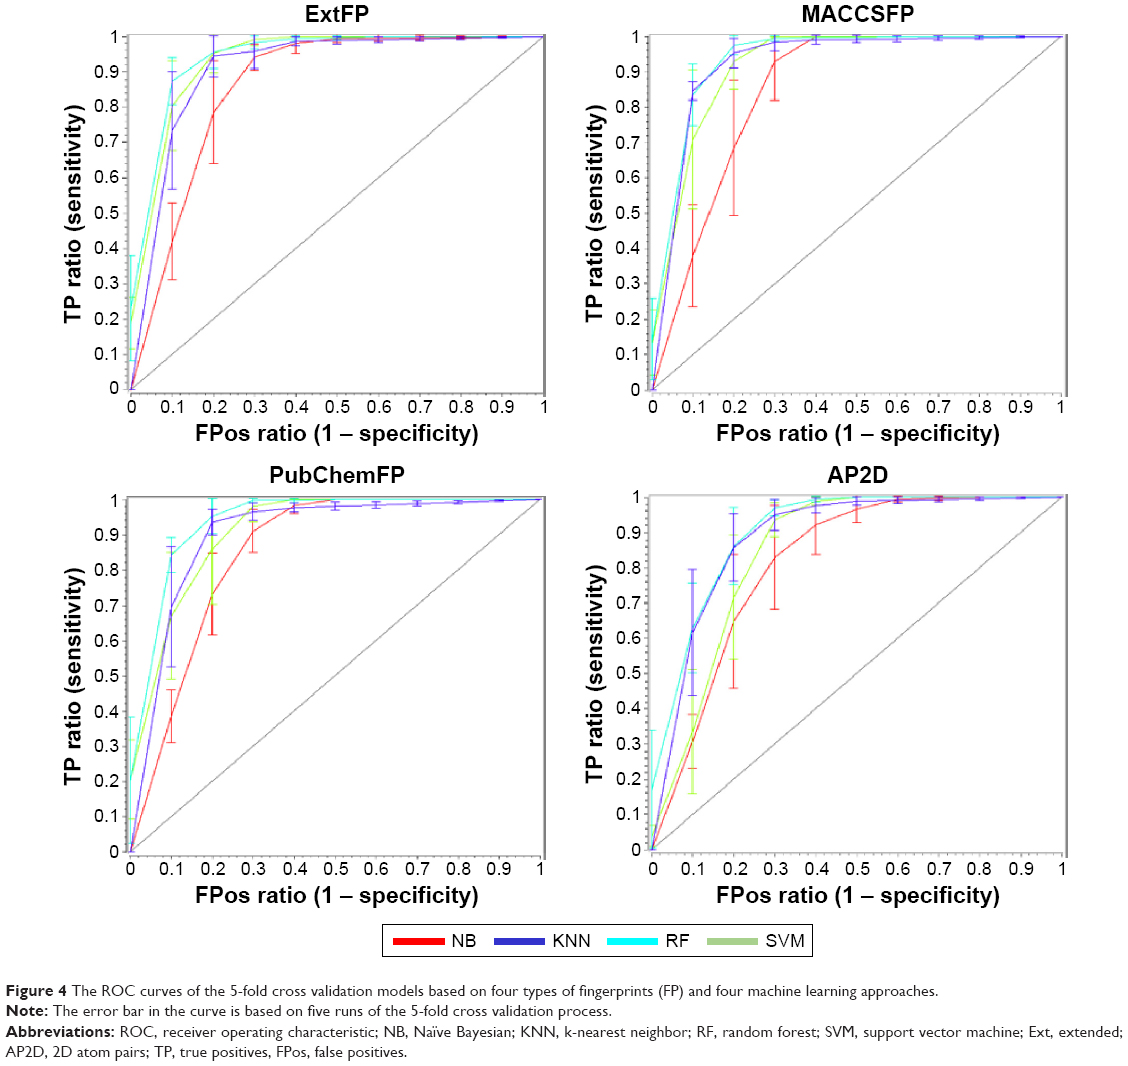 | Figure 4 The ROC curves of the 5-fold cross validation models based on four types of fingerprints (FP) and four machine learning approaches. |
In order to compare the performances of different machine learning methods, we ranked the performances of the models with the same fingerprint using the values of MCC. The rank results are shown in Figure 5. NB ranked fourth with each type of fingerprint. KNN ranked first with the MACCSFP. RF ranked first with PubChemFP and AP2D. SVM ranked first with ExtFP. These results suggest the model performance varies with different combinations of machine learning approaches and molecular fingerprints. Taken together, NB performs worst compared with KNN, RF, and SVM. RF and SVM are superior to other methods for the classification of ER-β agonists. In Zang et al’s binary classification models of a large collection of environmental chemicals from ER assays, they obtained the best model using SVM.18 This consistency suggests SVM is a suitable machine learning method for this target.
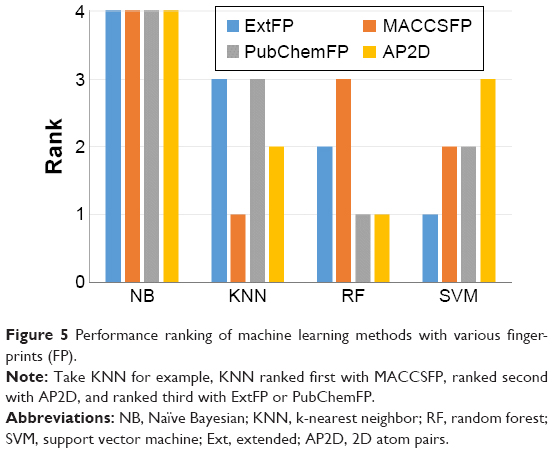 | Figure 5 Performance ranking of machine learning methods with various fingerprints (FP). |
We further compared the performances of the fingerprints. Model performances with various fingerprints and the same machine learning methods were ranked, as shown in Figure 6. As is obvious from the figure, ExtFP performed best and AP2D performed worst. ExtFP ranked first for any machine learning method mentioned here. In contrast, AP2D ranked last. ExtFP had 1024-bit length and AP2D had 780-bit length. Usually, the length of the fingerprints may affect the performance. However, MACCSFP with only 166-bit length, ranked second in KNN, RF, and SVM models, and ranked third in NB models. These results suggest that the model’s performance is not dependent on the length of the fingerprints but the structural representation methods. Furthermore, MACCSFP is a good fingerprint generation method for capturing the structural patterns of ER-β agonists.
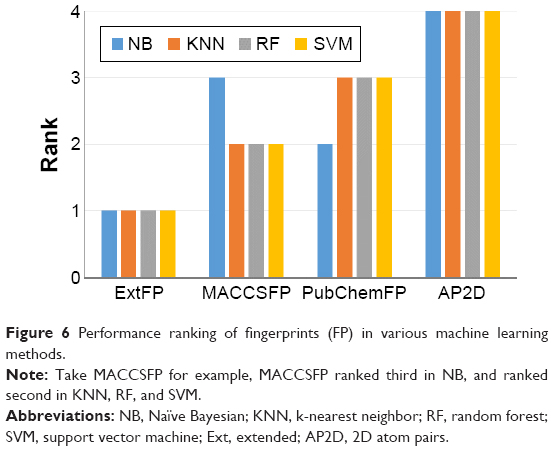 | Figure 6 Performance ranking of fingerprints (FP) in various machine learning methods. |
Performance of test set
To further evaluate the robustness of the model and to prove the observations in the cross validations, the test set was randomly split from the original dataset. The ratio of training set against test set was 2:1. The model performances for the test set are summarized in Table 2. For machine learning methods, RF ranked first with MACCSFP and PubChemFP. NB ranked last with any fingerprints. For fingerprints, ExtFP ranked first in NB and SVM. MACCSFP ranked first in KNN and second in RF and SVM. MACCSFP showed good performance and AP2D performed worst. This is in agreement with the previous observation in the cross validation.
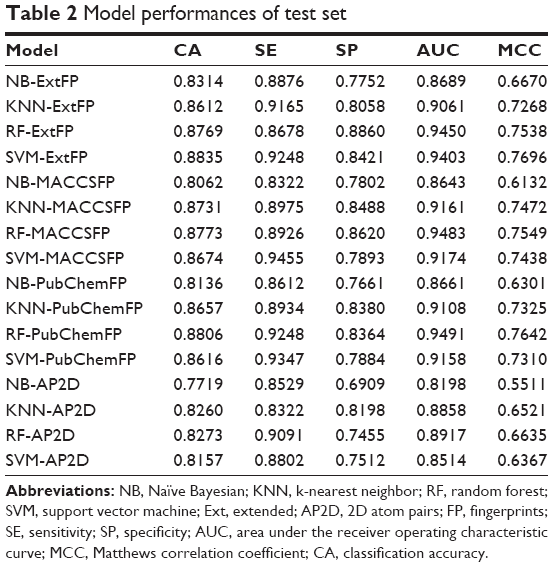 | Table 2 Model performances of test set |
We further collected an external test dataset from two literature sources,17,33 which included eleven ER-β selective agonists. We added eleven decoys to obtain a dataset with 22 compounds in total. We trained models using compounds from ChEMBL and predicted the external test dataset. The models’ performances are summarized in Table 3. All those models showed a good performance in classifying agonists and non-agonists.
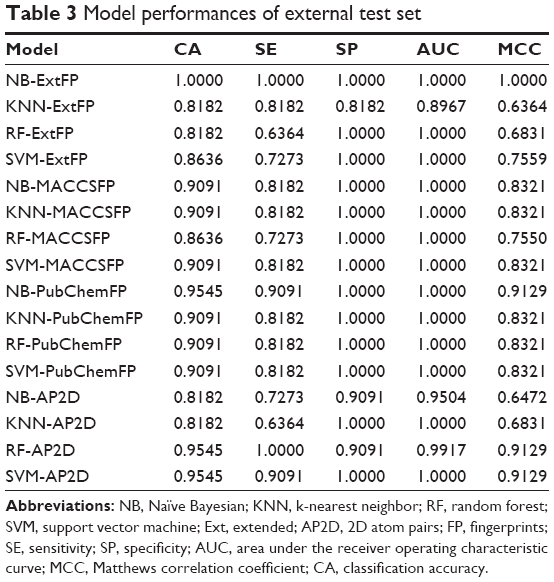 | Table 3 Model performances of external test set |
Conclusion
Emerging data suggest that ER-β subtype-selective ligands could be used to elicit beneficial estrogen-like activities and reduce side effects. There have been rare reports focusing on the subtype-selective ER agonist prediction. Owing to the significance of the selective ER-β agonists, in this work, we collected a dataset of selective ER-β agonists and performed the dataset analysis using PCA and distance analysis. Subsequently, we constructed the classification models of selective ER-β agonists using multiple machine learning methods and various molecular fingerprints. The models were validated through cross validation methods and test set validations. The range of classification accuracies was 77.10% to 88.34%, and the range of AUC values was 0.8151 to 0.9475, evaluated by the 5-fold cross validation. Comparison analysis suggests that both the RF and the SVM are superior to other machine learning methods for the classification of selective ER-β agonists. Chemistry Development Kit ExtFP and MACCSFP performed better in structural representation between active and inactive agonists. These models are robust and accurate, and could be applied in the virtual screening of large chemical libraries to identify selective ER-β agonists.
Disclosure
The authors report no conflicts of interest in this work.
References
Jia M, Dahlman-Wright K, Gustafsson JA. Estrogen receptor alpha and beta in health and disease. Best Pract Res Clin Endocrinol Metab. 2015;29(4):557–568. | ||
Katzenellenbogen BS, Choi I, Delage-Mourroux R, et al. Molecular mechanisms of estrogen action: selective ligands and receptor pharmacology. J Steroid Biochem Mol Biol. 2000;74(5):279–285. | ||
Evers NM, van den Berg JH, Wang S, et al. Cell proliferation and modulation of interaction of estrogen receptors with coregulators induced by ERα and ERβ agonists. J Steroid Biochem Mol Biol. 2014;143:376–385. | ||
Paterni I, Granchi C, Katzenellenbogen JA, Minutolo F. Estrogen receptors alpha (ERα) and beta (ERβ): subtype-selective ligands and clinical potential. Steroids. 2014;90:13–29. | ||
Nilsson S, Koehler KF, Gustafsson JA. Development of subtype-selective oestrogen receptor-based therapeutics. Nat Rev Drug Discov. 2011;10(10):778–792. | ||
Drummond AE, Fuller PJ. The importance of ERbeta signalling in the ovary. J Endocrinol. 2010;205(1):15–23. | ||
Taylor AH, Al-Azzawi F. Immunolocalisation of oestrogen receptor beta in human tissues. J Mol Endocrinol. 2000;24(1):145–155. | ||
Heldring N, Pike A, Andersson S, et al. Estrogen receptors: how do they signal and what are their targets. Physiol Rev. 2007;87(3):905–931. | ||
Jordan VC, Gapstur S, Morrow M. Selective estrogen receptor modulation and reduction in risk of breast cancer, osteoporosis, and coronary heart disease. J Natl Cancer Inst. 2001;93(19):1449–1457. | ||
Riggs BL, Hartmann LC. Selective estrogen-receptor modulators – mechanisms of action and application to clinical practice. N Engl J Med. 2003;348(7):618–629. | ||
Dhingra K. Selective estrogen receptor modulation: the search for an ideal hormonal therapy for breast cancer. Cancer Invest. 2001;19(6):649–659. | ||
Maximov PY, Lee TM, Jordan VC. The discovery and development of selective estrogen receptor modulators (SERMs) for clinical practice. Curr Clin Pharmacol. 2013;8(2):135–155. | ||
Minutolo F, Macchia M, Katzenellenbogen BS, Katzenellenbogen JA. Estrogen receptor beta ligands: recent advances and biomedical applications. Med Res Rev. 2011;31(3):364–442. | ||
Hinsche O, Girgert R, Emons G, Grundker C. Estrogen receptor β selective agonists reduce invasiveness of triple-negative breast cancer cells. Int J Oncol. 2015;46(2):878–884. | ||
Marzioni M, Torrice A, Saccomanno S, et al. An oestrogen receptor β-selective agonist exerts anti-neoplastic effects in experimental intrahepatic cholangiocarcinoma. Dig Liver Dis. 2012;44(2):134–142. | ||
Roberts LR, Armor D, Barker C, et al. Sulfonamides as selective oestrogen receptor β agonists. Bioorg Med Chem Lett. 2011;21(19):5680–5683. | ||
Paterni I, Bertini S, Granchi C, et al. Highly selective salicylketoxime-based estrogen receptor β agonists display antiproliferative activities in a glioma model. J Med Chem. 2015;58(3):1184–1194. | ||
Zang Q, Rotroff DM, Judson RS. Binary classification of a large collection of environmental chemicals from estrogen receptor assays by quantitative structure-activity relationship and machine learning methods. J Chem Inf Model. 2013;53(12):3244–3261. | ||
Ng HW, Doughty SW, Luo H, et al. Development and Validation of Decision Forest Model for Estrogen Receptor Binding Prediction of Chemicals Using Large Data Sets. Chem Res Toxicol. 2015;28(12):2343–2351. | ||
O’Boyle NM, Banck M, James CA, Morley C, Vandermeersch T, Hutchison GR. Open Babel: An open chemical toolbox. J Cheminform. 2011;3:33. | ||
Klein K, Hennig S, Paul SK. A Bayesian Modelling Approach with Balancing Informative Prior for Analysing Imbalanced Data. PloS One. 2016;11(4):e0152700. | ||
Datta S, Das S. Near-Bayesian Support Vector Machines for imbalanced data classification with equal or unequal misclassification costs. Neural Netw. 2015;70:39–52. | ||
Mysinger MM, Carchia M, Irwin JJ, Shoichet BK. Directory of useful decoys, enhanced (DUD-E): better ligands and decoys for better benchmarking. J Med Chem. 2012;55(14):6582–6594. | ||
Rogers D, Hahn M. Extended-connectivity fingerprints. J Chem Inf Model. 2010;50(5):742–754. | ||
Yap CW. PaDEL-descriptor: an open source software to calculate molecular descriptors and fingerprints. J Comput Chem. 2011;32(7):1466–1474. | ||
Chen L, Li Y, Zhao Q, Peng H, Hou T. ADME evaluation in drug discovery. 10. Predictions of P-glycoprotein inhibitors using recursive partitioning and naive Bayesian classification techniques. Mol Pharm. 2011;8(3):889–900. | ||
Sun H. A naive bayes classifier for prediction of multidrug resistance reversal activity on the basis of atom typing. J Med Chem. 2005;48(12):4031–4039. | ||
Breiman L. Random forests. Machine Learning. 2001;45(1):5–32. | ||
Svetnik V, Liaw A, Tong C, Culberson JC, Sheridan RP, Feuston BP. Random forest: a classification and regression tool for compound classification and QSAR modeling. J Chem Inf Comput Sci. 2003;43(6):1947–1958. | ||
Cheng F, Yu Y, Shen J, et al. Classification of cytochrome P450 inhibitors and noninhibitors using combined classifiers. J Chem Inf Model. 2011;51(5):996–1011. | ||
Heikamp K, Bajorath J. Support vector machines for drug discovery. Expert Opin Drug Discov. 2014;9(1):93–104. | ||
Xu C, Cheng F, Chen L, et al. In silico prediction of chemical Ames mutagenicity. J Chem Inf Model. 2012;52(11):2840–2847. | ||
Chen L, Wu D, Bian HP, et al. Selective ligands of estrogen receptor β discovered using pharmacophore mapping and structure-based virtual screening. Acta Pharmacol Sin. 2014;35(10):1333–1341. |
Supplementary materials
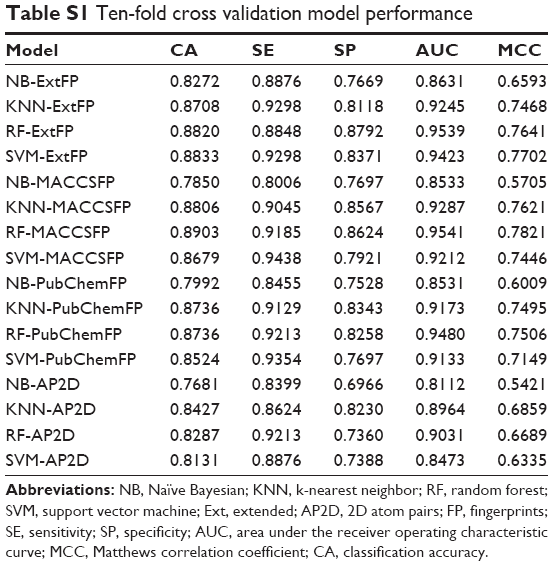 | Table S1 Ten-fold cross validation model performance |
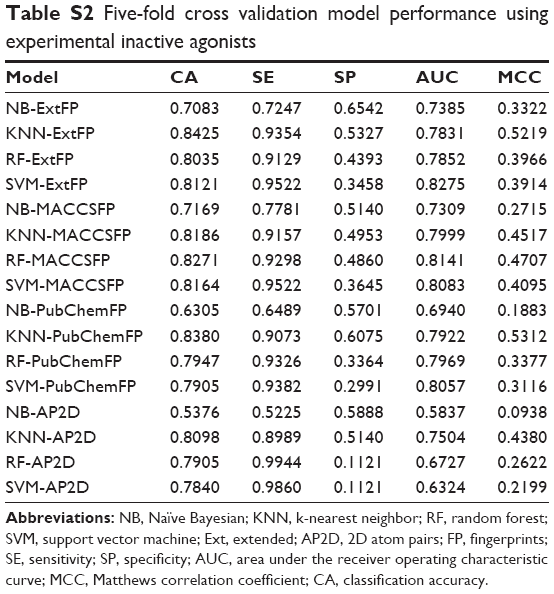 | Table S2 Five-fold cross validation model performance using experimental inactive agonists |
 © 2016 The Author(s). This work is published and licensed by Dove Medical Press Limited. The full terms of this license are available at https://www.dovepress.com/terms.php and incorporate the Creative Commons Attribution - Non Commercial (unported, v3.0) License.
By accessing the work you hereby accept the Terms. Non-commercial uses of the work are permitted without any further permission from Dove Medical Press Limited, provided the work is properly attributed. For permission for commercial use of this work, please see paragraphs 4.2 and 5 of our Terms.
© 2016 The Author(s). This work is published and licensed by Dove Medical Press Limited. The full terms of this license are available at https://www.dovepress.com/terms.php and incorporate the Creative Commons Attribution - Non Commercial (unported, v3.0) License.
By accessing the work you hereby accept the Terms. Non-commercial uses of the work are permitted without any further permission from Dove Medical Press Limited, provided the work is properly attributed. For permission for commercial use of this work, please see paragraphs 4.2 and 5 of our Terms.