")
Back to Journals » Clinical Interventions in Aging » Volume 11
Predicting Gleason score using the initial serum total prostate-specific antigen in Black men with symptomatic prostate adenocarcinoma in Nigeria
Authors Nnabugwu I , Udeh E, Ugwumba F, Ozoemena F
Received 13 October 2015
Accepted for publication 31 December 2015
Published 18 July 2016 Volume 2016:11 Pages 961—966
DOI https://doi.org/10.2147/CIA.S98232
Checked for plagiarism Yes
Review by Single anonymous peer review
Peer reviewer comments 4
Editor who approved publication: Dr Richard Walker
Ikenna I Nnabugwu, Emeka I Udeh, Fredrick O Ugwumba, Francis O Ozoemena
Urology Unit, Department of Surgery, College of Medicine, Enugu Campus, University of Nigeria, Enugu, Nigeria
Background: Men of Black African descent are known to have the highest incidence of prostate cancer. The disease is also more aggressive in this group possibly due to biologically more aggressive tumor or late presentation. Currently, serum prostate-specific antigen (PSA) assay plays a significant role in making the diagnosis of prostate cancer. However, the obtained value of serum PSA may not directly relate with the Gleason score (GS), a measure of tumor aggression in prostate cancer. This study explores the relationship between serum total PSA at presentation (iPSA) and GS.
Patients and methods: The iPSA of patients with histologically confirmed prostate cancer was compared with the obtained GS of the prostate biopsy specimens. The age of the patients at presentation and the prostate volumes were also analyzed with respect to the iPSA and GS. The data were analyzed retrospectively using IBM SPSS Version 20. Pearson correlation was used for numeric variables, whereas Fisher’s exact test was used for categorical variables. Significance was set at P≤0.05.
Results: There were 205 patients from January 2010 to November 2013 who satisfied the inclusion criteria. iPSA as well as age at presentation and prostate volume were not found to significantly correlate with the primary Gleason grade, the secondary Gleason grade, or the GS. However, the presence of distant metastasis was identified to significantly correlate positively with GS.
Conclusion: GS may not be confidently predicted by the iPSA. Higher iPSA does not correlate with higher GS and vice versa.
Keywords: PSA, patient age, prostate volume, prostate adenocarcinoma, Gleason score
Introduction
Worldwide, prostate cancer is the second most common cancer and the fifth commonest cause of cancer-related death in men.1,2 The incidence of the preclinical disease detected postmortem appears to be similar across races, but the incidence of the clinical disease varies significantly across races. The incidence is lowest in Asians (4.5–28.0 per 100,000 person-years), higher in native Africans (10.6–27.0 per 100,000 person-years), and highest in North Americans (97.2–100,000 person-years) and Australia/New Zealand (111.6 per 100,000 person-years).2 The incidence is particularly high among men of African descent in Northern America at 220 per 100,000 population.3 The disease has also been noted to be more aggressive in Blacks possibly due to late presentation of patients or development of a biologically more aggressive tumor.4,5
Adenocarcinoma of the prostate is by far the commonest histological variant.6,7 With the discovery of serum prostate-specific antigen (sPSA) and its derivatives came a new era in the management of prostate cancer: more cases are diagnosed especially in the presymptomatic stages, patient monitoring posttherapy is more precise, and disease prognosis is better appreciated.8–10 However, factors such as age and body mass index of patients, mass of prostate, serum androgen levels, constipation, and recent ejaculation may influence the value of and hence the clinical significance of sPSA in each patient. The role of these factors has been evaluated in various studies.11,12
Gleason score (GS) of the biopsy specimen, on the other hand, is an objective assessment of the degree of differentiation of the malignant prostate tissue. Of the three parameters (sPSA, clinical stage, and GS) needed in deciding on treatment modalities, GS is the least influenced by other factors, and GS of the biopsy specimen is a measure of the tumor aggression or virulence.13 Sequel to the 2005 International Society of Urological Pathology (ISUP) Consensus Conference on Gleason Grading of Prostatic Carcinoma modification of the Gleason scoring system, the ability of GS of the biopsy specimen to prognosticate is approaching that of the radical prostatectomy specimen.14,15 In our low socioeconomic setting, where majority of patients present in symptomatic stages as prostate cancer screening is not yet popular, and the cost of investigation and treatment is borne directly by the patients, the nature of the relationship between serum total PSA at presentation (iPSA), Prostate-specific antigen density (PSAD), and GS in the clinic situation needs to be clearly defined.
This study is designed to identify in the typical clinical situation, the relationship between age of patient, iPSA, and prostate volume (PV) on the one hand and GS on the other hand among symptomatic prostate adenocarcinoma patients. We seek to know if it will be rational to assume that in patients with symptoms of prostate cancer, lower iPSA reflects lower GS (hence tumor aggression) and vice versa.
Patients and methods
This study was approved by the Ethics Committee of the University of Nigeria Teaching Hospital. Patients gave verbal consent for their data to be used in the analysis. The Urology unit of the Department of Surgery of University of Nigeria Teaching Hospital, Ituku-Ozalla, Enugu state, Nigeria, is the center for this study. From March 2012 to November 2013, patients who had histologically proven adenocarcinoma of the prostate by transrectal core needle biopsy were included in this study. Patients on 5α-reductase inhibitors (5αRI) and antiandrogens before iPSA result or prostate biopsy were excluded. There were 43 patients within this cohort. The iPSA at presentation, abdominopelvic ultrasonography assessment of the PV, and the GS of the core needle prostate biopsy specimens were documented. The histological examinations of the prostate biopsy specimens were conducted by histopathologists with not <6 years of experience. The assigned GS usually was a consensus score between two or more histopathologists.
In addition, the case notes of patients with histologically confirmed adenocarcinoma of the prostate through core needle biopsy from January 2010 to March 2012 were reviewed retrospectively, retrieving each patient’s age, iPSA, and GS. The abdominopelvic ultrasonography assessment of PV of this cohort was not analyzed due to significant inconsistencies in documentation. In addition, patients on 5αRI or antiandrogens prior to iPSA estimation or prostate biopsy were excluded. There were 164 patients in this group.
Totally, there were 226 patients, 19 were excluded due to use of 5αRI or antiandrogens and two due to missing iPSA results. Therefore, 205 patients were analyzed. These patients had digitally guided extended sextant core needle biopsy of the prostate (8–12 cores per patient) due to one or more of the following: suspicious clinical history, suspicious digital rectal examination assessment, malignant abdominopelvic ultrasonography features of the prostate, and elevated iPSA >4 ng/mL. The ELISA technique was used for iPSA estimation in the hospital’s clinical chemistry laboratory. A size 16 G or 18 G spring-loaded core tissue biopsy needle was used in each case. Patients with malignant histology reports from simple prostatectomy specimens were not included in this analysis.
Therefore, from each case note that met the inclusion criteria, the age, occupation, residence, tribe, iPSA, ultrasonography report on the prostate, primary Gleason grade (GD1), secondary Gleason grade (GD2), and GS were extracted for analysis. The extracted data were set in Microsoft Office Excel 2007 spread sheet, imported into, and analyzed using IBM SPSS Version 20 (Armonk, NY, USA). Pearson correlation was used to analyze numeric variables. Fisher’s exact test (GraphPad Software, La Jolla, CA, USA) was used for categorical variables. Significance was set at two-tailed P≤0.05. Microsoft Office Excel 2007 Version was used to produce the charts.
Results
A total of 205 patients were included in this analysis. The patients were Nigerians aged 54–90 years (mean 70.88±7.93 years), residing in the Southern part of the country and prevalently peasant farmers and retired public servants (79%). They all had histologically proven symptomatic adenocarcinoma of the prostate of varying GSs from transrectal prostate biopsy.
The abdominopelvic ultrasonography assessments of the prostates of the 43 patients recruited prospectively reported 15 (34.9%), 10 (23.3%), and 18 (41.9%) prostates as nonsuspicious prostates, suspicious with prostate-confined lesions, and suspicious with locally advanced prostate lesions, respectively. The PV of these 43 patients varied from 16.8 mL to 310.0 mL with mean 91.4±56.1 mL and median of 71.8 mL, whereas the PSAD values obtained as the quotient of respective iPSA and PV were from 0.03 ng/mL2 to 4.83 ng/mL2 (mean 0.90±1.02 ng/mL2).
The iPSA values, available for 205 patients, were at a range of 1.9–700.0 ng/mL, mean 46.7±61.3 ng/mL, and median 28.0 ng/mL. Table 1 shows the Pearson correlation between age and iPSA, age and PV, and age and PSAD. There was a positive correlation between age and PV (P=0.54), but a negative correlation between age and iPSA, age and PSAD (P=0.53 and 0.93, respectively). These correlation values were not significant.
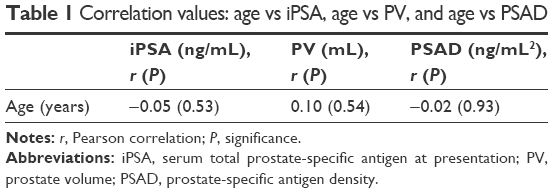 | Table 1 Correlation values: age vs iPSA, age vs PV, and age vs PSAD |
Further Pearson correlations were done: the relationships between age, iPSA, and PSAD on one hand and GD1, GD2, and GS on the other are shown in Table 2. Though younger patients tend to have higher GS, this was not statistically significant (P=0.25). The iPSA tends to increase with GS (P=0.35), whereas PSAD was inversely related to GS (0.54).
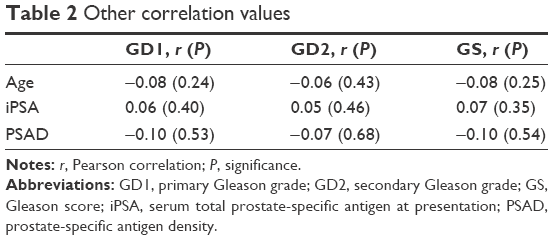 | Table 2 Other correlation values |
The patients were batched into age-groups and the GS analyzed. The age of the patients in group A was 50–59 years, 60–69 years in group B, 70–79 years in group C, and 80–89 years in group D. There were 21 people in group A, 58 in group B, 95 in group C, and 31 in group D. The mean of the values within these groups is shown in Figure 1. This figure shows no significant variation in mean of primary Gleason grade (MGD1) (P=0.85), mean of secondary Gleason grade (MGD2) (P=0.71), and mean of Gleason score (MGS) (P=0.88) across the groups.
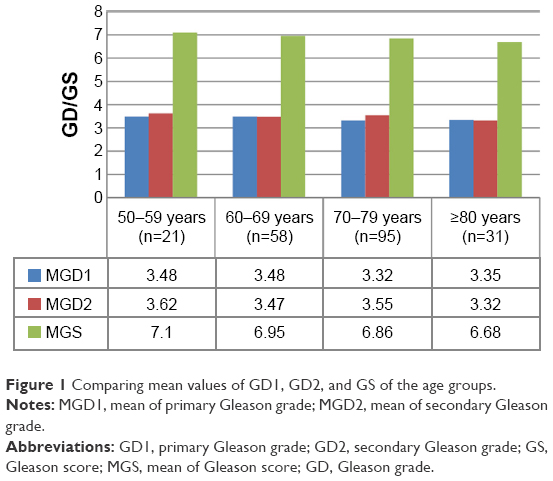 | Figure 1 Comparing mean values of GD1, GD2, and GS of the age groups. |
With respect to the iPSA, the patients were grouped into those with iPSA ≤10 ng/mL (n=53) and those with iPSA >10 ng/mL (n=152). The mean values of the GD1, GD2, and GS were compared for the two groups. There was no significant difference in MGD1 (P=0.22), MGD2 (P=0.19), and MGS (P=0.95) of the two groups. This is shown in Figure 2.
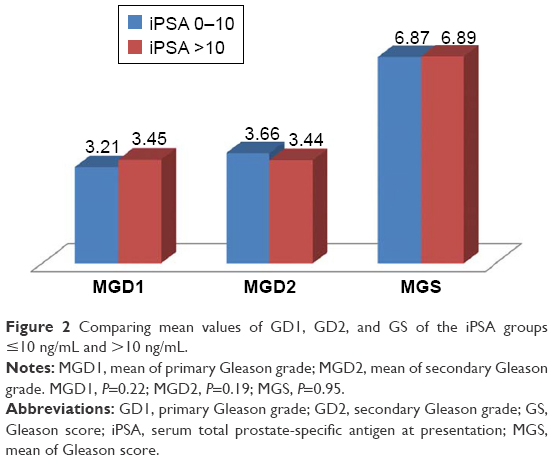 | Figure 2 Comparing mean values of GD1, GD2, and GS of the iPSA groups ≤10 ng/mL and >10 ng/mL. |
Likewise, the patients were regrouped into those with iPSA ≤20 ng/mL (n=90) and those with iPSA >20 ng/mL (n=115). The GD1, GD2, and GS of these two groups were analyzed for any significant difference in mean values. This is shown in Figure 3. Again, there was no significant difference in MGD1 (P=0.24), MGD2 (P=0.34), and MGS (P=0.21).
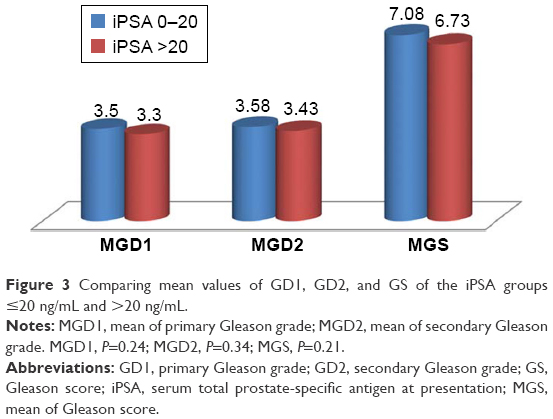 | Figure 3 Comparing mean values of GD1, GD2, and GS of the iPSA groups ≤20 ng/mL and >20 ng/mL. |
With respect to GS, the patients were categorized into two groups: GS <7 and GS ≥7. Of the 205 patients, 76 had a GS <7 with a mean age of 71.8±8.1 years and a mean iPSA value of 42.3±35.5 ng/mL, whereas 129 had GS ≥7 with a mean age of 70.4±7.9 years and mean iPSA of 49.3±72.3 ng/mL. There were no significant differences in the mean ages (P=0.23) and the mean iPSA (P=0.43) of the two groups. The PV tends to be higher among patients with GS ≥7 compared to patients with GS <7 (P=0.07), but the difference did not reach the defined statistical level of significance. There was no significant variation in the mean PSAD of the two groups (P=0.25). However, there was a significantly higher prevalence of distant metastasis (DM) at presentation in the GS ≥7 group (P=0.00). These are shown in Table 3.
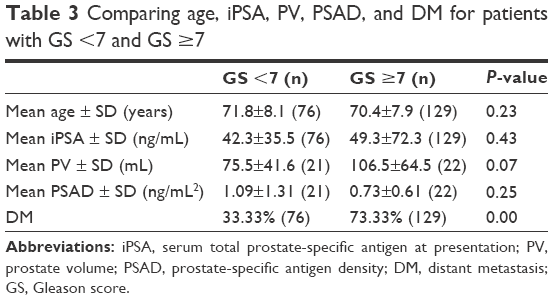 | Table 3 Comparing age, iPSA, PV, PSAD, and DM for patients with GS <7 and GS ≥7 |
Discussion
In the management of symptomatic patients with suspicious prostate enlargement, some important decisions need to be made. First, the decision to biopsy the prostate and grade the tumor must be made promptly. Second, the decision to offer active surveillance, curative therapy, or palliative care must be made confidently when malignancy has been confirmed. Cure rate is encouraging at >75% 10-year survival rate when curative therapy is applied to patients with favorable prognosis (iPSA ≤10 ng/mL, T1c–T2 tumor, and GS ≤3+3=6).16–18
Attempting to predict the GS (and hence tumor aggression) based on the obtained iPSA result among patients presenting with symptoms or the age at initial presentation may be fraught with errors. In this study, the iPSA results of 205 patients were obtained ranging from 1.9 ng/mL to 700.0 ng/mL (median 28.0 ng/mL). These patients were between 54 years and 90 years of age (mean 70.88±7.93 years). Table 1 reveals a negative correlation between age at initial presentation and iPSA, but this correlation is not significant. Generally in men, there is a significant positive correlation between age and sPSA,19,20 but it seems that among men with prostate adenocarcinoma, this relationship is altered. This is similar to the finding of Yamoah et al21 in Ghana. This may be because all the other factors that affect sPSA values become less relevant once the diagnosis of prostate cancer has been confirmed histologically: the sPSA value so obtained becomes attributable essentially to the cancer. Similarly, the foregoing reason may explain the absence of a significant positive correlation between age and total PV in men with symptomatic prostate adenocarcinoma as shown in Table 1: once the diagnosis of cancer has been confirmed, any other possible reason for the observed PV becomes less relevant.
There is no statistically significant correlation between age at initial presentation and the GD1, the GD2, or GS of the biopsy specimen as well (Table 2). The mean values of the GS of patients in each decade of life from the sixth decade (50–59 years) do not significantly differ in this study as well (Figure 1). A similar deduction was made from other studies,22,23 while a contrary result was obtained by Yarney et al24 who found a significant positive correlation between age and GS. Older patient age does not translate into longer cancer age within the patient’s prostate or into increasing dedifferentiation of malignant cells within the prostate. Therefore, the observation from this study is consistent. Table 3 also shows that the tumor differentiation in adenocarcinoma of the prostate does not significantly vary with patient’s age at presentation or with the iPSA contrary to the finding by Chamie et al.25 This again supports that carcinogenesis in this disease condition may not be from well-differentiated to less well-differentiated tumor over time in an individual,26 and that serum total PSA is not greater the more dedifferentiated the tumor is.
In the same vein, this study shows absence of any significant positive correlation between iPSA, or its derivative PSAD, and the GD1, the GD2, or the GS of the biopsy specimen (Table 2). This is similar to the findings of Izumi et al.27 Serum total PSA is known to be nonspecific for prostate adenocarcinoma. The iPSA values in patients with malignant prostates are contributed by the malignancy as well as other factors that affect sPSA values such as chronic prostatitis, prostatic stones, digital rectal examination, urethral catheterization, and so on. In addition, the amount of PSA released into the circulation from the malignant prostate may not be proportionate to tissue dedifferentiation. Herein lies the benefits of percentage-free PSA, which is more specific for prostate adenocarcinoma.28,29 Yamoah et al21 and Yarney et al24, however, documented significant positive correlations between sPSA and GS. When the GD1, the GD2, and the GS of patients presenting with iPSA ≤10 ng/mL are compared with those of patients presenting with iPSA >10 ng/mL (Figure 2), there are no significant differences in mean values. A similar analysis of patients with iPSA ≤20 ng/mL against those with iPSA >20 ng/mL failed to show any significant difference in mean values (Figure 3). These findings suggest that the GS of patients presenting with symptoms of suspicious prostate enlargement cannot be predicted confidently by the level of the iPSA. By projection also, the tumor aggression in patients who have symptoms may not be predicted by the presenting iPSA.
This assertion is further buttressed by the finding in Table 3, that of the 129 patients with intermediate- and high-grade tumors (GS ≥7), 73.33% presented with clinical evidence of DM, while of the 76 patients with low-grade tumors, 33.33% presented with clinical evidence of DM (P=0.0001), a finding supporting the fact that GS predicted tumor aggression in this cohort of patients as has been documented in many other studies.30,31 However, there is no significant difference in mean age of patient at presentation, mean iPSA, mean PV, and mean PSAD between patients with low-grade tumor and those with intermediate/high-grade tumor. Karademir et al32 found a significant correlation between central gland volume fraction (not total PV) and GS, ISUP 2009 consensus conference recognized that prostate cancer volume (not total PV) significantly correlates with GS,33 while Vellekoop et al34 documented an inverse relationship between larger total PV and adverse pathology.
Conclusion
In patients presenting with various symptoms of prostate cancer, tumor aggression assessed by GS may not be confidently predicted by the age of the patient at presentation, the iPSA, and the assessed total volume of the prostate. These parameters have not been found in this study to significantly vary with the GS of biopsy specimen of patients. Therefore, in our low socioeconomic setting, though patients bear the cost of medical therapy directly, prostate biopsy for tissue diagnosis and tumor grading is recommended for suspicious prostates.
Clinical practice points
Elevated sPSA has been accepted as an indication for prostate biopsy in both screened subjects and symptomatic patients. If malignant, the degree of differentiation of the specimen is expressed as the GS, a measure of tumor aggression and a prognostic index.
In low socioeconomic settings without viable Health Insurance System, cost of evaluation and treatment of disease conditions are borne directly by the patients who mostly are poor. The clinician decides on which investigations are “absolutely necessary” to ensure that the patients maintained the financial might to get to treatment of the ailment.
This doctrine of “absolutely necessary” comes with the risk intrinsic in making assumptions. One of these assumptions is that in the evaluation of patients with symptomatic suspicious enlargement of the prostate, the lower the serum total PSA, the lower the GS and vice versa.
Our findings in this study do not support this assumption. It is therefore imperative for clinicians and patients alike to appreciate prostate biopsy as well as sPSA assay as absolutely necessary in the optimal management of suspicious prostatic enlargement.
Disclosure
The authors report no conflicts of interest in this work.
References
Kamangar F, Dores GM, Anderson WF. Patterns of cancer incidence, mortality and prevalence across five continents: defining priorities to reduce cancer disparities in different geographic regions of the world. J Clin Oncol. 2006;24(14):2137–2150. | ||
Torre LA, Bray F, Siegel RL, Ferlay J, Lortet-Tieulent J, Jemal A. Global cancer statistics, 2012. CA Cancer J Clin. 2015;65(2):87–108. | ||
Siegel R, Ma J, Zou Z, Jemal A. Cancer statistics, 2014. CA Cancer J Clin. 2014;64(1):9–29. | ||
Fedewa SA, Jemal A. Prostate cancer disease severity and country of origin among black men in the United States. Prostate Cancer Prostatic Dis. 2013;16(2):176–180. | ||
Tindall EA, Monare LR, Petersen DC, et al. Clinical presentation of prostate cancer in Black South Africans. Prostate. 2014;74(8):880–891. | ||
Sapira MK, Obiorah CC. Age and pathology of prostate cancer in South-Southern Nigeria; is there a pattern? Med J Malaysia. 2012;67(4):417–419. | ||
Ugare UG, Bassey IE, Jibrin PG, Ekanem IA. Analysis of Gleason grade and scores in 90 Nigerian Africans with prostate cancer during the period 1994 to 2004. Afr Health Sci. 2012;12(1):69–73. | ||
Schröder FH, Hugosson J, Roobol MJ, et al; ERSPC Investigators. Screening and prostate-cancer mortality in a randomized European study. N Engl J Med. 2009;360(13):1320–1328. | ||
Faisal FA, Sundi D, Pierorazio PM, et al. Outcomes of men with an elevated PSA as their sole preoperative intermediate or high risk feature. BJU Int. 2014;114(6b):E120–E129. | ||
Koie T, Mitsuzuka K, Yoneyama T, et al. Prostate-specific antigen density predicts extracapsular extension and increased risk of biochemical recurrence in patients with high risk prostate cancer who underwent radical prostatectomy. Int J Clin Oncol. 2015;20(1):176–181. | ||
Larré S, Azzouzi AR, Cancel-Tassin G, et al. Impact de l’obésité sur le PSA lors du dépistage du cancer de la prostate. [Impact of obesity on PSA in prostate cancer screening]. Prog Urol. 2007;17(4):815–818. | ||
Wu YS, Na R, Xu JF, Bai PD, Jiang HW, Ding Q. The influence of prostate volume on cancer detection in the Chinese population. Asian J Androl. 2014;16(3):482–486. | ||
Epstein JI. An update of the Gleason grading system. J Urol. 2010;183(2):433–440. | ||
Epstein JI, Allsbrook WC Jr, Amin MB, Egevad LL; ISUP Grading Committee. The 2005 International Society of Urological Pathology (ISUP) consensus conference on Gleason grading of prostatic carcinoma. Am J Surg Pathol. 2005;29(9):1228–1242. | ||
Sfoungaristos S, Katafigiotis I, Perimenis P. The role of prostate density to predict a pathological tumour upgrade between needle biopsy and radical prostatectomy for low risk clinical prostate cancer in the modified Gleason system era. Can Urol Assoc J. 2013;7(11–12):E722–E727. | ||
Gerber GS, Thisted RA, Scardino PT, et al. Results of radical prostatectomy in men with clinically localized prostate cancer. JAMA. 1996;276(8):615–619. | ||
Heidenreich A, Bastian PJ, Bellmunt J, et al; European Association of Urology. EAU guidelines on prostate cancer. part 1: screening, diagnosis, and local treatment with curative intent-update 2013. Eur Urol. 2014;65(1):124–137. | ||
Norman Z, Militza P, Andres F, et al. Is active surveillance a safe alternative in the management of localized prostate cancer? Pathological features of radical prostatectomy specimens in potential candidates for active surveillance. Int Braz J Urol. 2014;40(2):154–160. | ||
Mochtar CA, Kiemeney LA, van Riemsdijk MM, et al. Prostate-specific antigen as an estimator of prostate volume in the management of patients with symptomatic benign prostatic hyperplasia. Eur Urol. 2003;44(6):695–700. | ||
Nnabugwu II, Ugwumba FO, Enivwenae OA, Udeh EI, Otene CO, Nnabugwu CA. Serum total prostate-specific antigen values in men with symptomatic prostate enlargement in Nigeria: role in clinician’s decision making. Clin Interv Aging. 2015;10:89–93. | ||
Yamoah K, Beecham K, Hegarty SE, Hyslop T, Showalter T, Yarney J. Early results of prostate cancer radiation therapy: an analysis with emphasis on research strategies to improve treatment delivery and outcomes. BMC Cancer. 2013;13:23. | ||
Adewuyi SA, Mbibu NH, Samaila MO, Ketiku KK, Durosinmi-Etti FA. Clinico-pathologic characterisation of metastatic prostate cancer in the Radiotherapy and Oncology department, Ahmadu Bello University Teaching Hospital, Zaria-Nigeria: 2006–2009. Niger Postgrad Med J. 2013;20(1):45–51. | ||
Antunes AA, Crippa A, Dall’Oglio MF, Nesrallah LJ, Leite KR, Srougi M. Age impact in clinicopathologic presentation and the clinical evolution of prostate cancer in patients submitted to radical prostatectomy. Int Braz J Urol. 2006;32(1):48–55. | ||
Yarney J, Vanderpuye V, Mensah J. Clinicopathologic features and determinants of Gleason score of prostate cancer in Ghanaian men. Urol Oncol. 2013;31(3):325–330. | ||
Chamie K, Oberfoell S, Kwan L, Labo J, Wei JT, Litwin MS. Body mass index and prostate cancer severity: do obese men harbor more aggressive disease on prostate biopsy? Urology. 2013;81(5):949–955. | ||
Penney KL, Stampfer MJ, Jahn JL, et al. Gleason grade progression is uncommon. Cancer Res. 2013;73(16):5163–5168. | ||
Izumi K, Ikeda H, Maolake A, et al. The relationship between prostate-specific antigen and TNM classification or Gleason score in prostate cancer patients with low prostate-specific antigen levels. Prostate. 2015;75(10):1034–1042. | ||
Morote J, Trilla E, Esquena S, et al. Value of percent free prostate-specific antigen for the prediction of pathological stage in men with clinically localized prostate cancer. Int J Biol Markers. 2002;17(4):239–243. | ||
Walz J, Haese A, Scattoni V, et al. Percent free prostate-specific antigen (PSA) is an accurate predictor of prostate cancer risk in men with serum PSA 2.5 ng/ml and lower. Cancer. 2008;113(10):2695–2703. | ||
Falzarano SM, Magi-Galluzzi C. Prostate cancer staging and grading at radical prostatectomy over time. Adv Anat Pathol. 2011;18(2):159–164. | ||
Lavery HJ, Droller MJ. Do Gleason patterns 3 and 4 prostate cancer represent separate disease states? J Urol. 2012;188(5):1667–1675. | ||
Karademir I, Shen D, Peng Y, et al. Prostate volumes derived from MRI volume-adjusted serum prostate-specific antigen: correlation with Gleason score of prostate cancer. AJR Am J Roentgenol. 2013;201(5):1041–1048. | ||
van der Kwast TH, Amin MB, Billis A, et al; ISUP Prostate Cancer Group. International Society of Urological Pathology (ISUP) consensus conference on handling and staging of radical prostatectomy specimens. Working group 2: T2 substaging and prostate cancer volume. Mod Pathol. 2011;24(1):16–25. | ||
Vellekoop A, Loeb S, Folkvaljon Y, Stattin P. Population based study of predictors of adverse pathology among candidates for active surveillance with Gleason 6 prostate cancer. J Urol. 2014;191(2):350–357. |
 © 2016 The Author(s). This work is published and licensed by Dove Medical Press Limited. The full terms of this license are available at https://www.dovepress.com/terms.php and incorporate the Creative Commons Attribution - Non Commercial (unported, v3.0) License.
By accessing the work you hereby accept the Terms. Non-commercial uses of the work are permitted without any further permission from Dove Medical Press Limited, provided the work is properly attributed. For permission for commercial use of this work, please see paragraphs 4.2 and 5 of our Terms.
© 2016 The Author(s). This work is published and licensed by Dove Medical Press Limited. The full terms of this license are available at https://www.dovepress.com/terms.php and incorporate the Creative Commons Attribution - Non Commercial (unported, v3.0) License.
By accessing the work you hereby accept the Terms. Non-commercial uses of the work are permitted without any further permission from Dove Medical Press Limited, provided the work is properly attributed. For permission for commercial use of this work, please see paragraphs 4.2 and 5 of our Terms.