")
Back to Journals » Drug Design, Development and Therapy » Volume 9
Pooled post hoc analysis of population pharmacokinetics of oxycodone and acetaminophen following a single oral dose of biphasic immediate-release/extended-release oxycodone/acetaminophen tablets
Authors Franke R, Morton T, Devarakonda K, Garber A
Received 18 December 2014
Accepted for publication 18 March 2015
Published 11 August 2015 Volume 2015:9 Pages 4587—4597
DOI https://doi.org/10.2147/DDDT.S79499
Checked for plagiarism Yes
Review by Single anonymous peer review
Peer reviewer comments 3
Editor who approved publication: Prof. Dr. Wei Duan
Ryan M Franke, Terri Morton, Krishna Devarakonda
Department of Clinical Pharmacology, Mallinckrodt Pharmaceuticals, Hazelwood, MO, USA
Abstract: This analysis evaluated the single-dose population pharmacokinetics (PK) of biphasic immediate-release (IR)/extended-release (ER) oxycodone (OC)/acetaminophen (APAP) 7.5/325 mg tablets administered under fasted conditions and the effects of a meal on their single-dose population PK. Data were pooled from four randomized, single-dose crossover trials enrolling healthy adult (18–55 years old) participants (three trials) and nondependent recreational users of prescription opioids (one trial) with a body weight of ≥59 kg. Participants received IR/ER OC/APAP 7.5/325 mg tablets in single doses of 7.5/325 mg (one tablet), 15/650 mg (two tablets), or 30/1,300 mg (four tablets) under fasted or fed conditions. Six variables were examined: sex, race, age, weight, height, and body mass index. Single-dose population PK was analyzed using first-order conditional estimation methods. A total of 151 participants were included in the analysis under fasted conditions, and 31 participants were included in the fed analysis. Under fasted conditions, a 10% change in body weight was accompanied by ~7.5% change in total body clearance (CL/F) and volume of distribution (V/F) of OC and APAP. Black participants had 17.3% lower CL/F and a 16.9% lower V/F of OC compared with white participants. Under fed conditions, the absorption rate constant of OC and APAP decreased significantly, although there was no effect on CL/F and V/F. Considering that the recommended dose for IR/ER OC/APAP 7.5/325 mg tablets is two tablets every 12 hours, adjustments of <50% are not clinically relevant. Dose adjustment may be necessary for large deviations from average body weight, but the small PK effects associated with race and consumption of a meal are not clinically relevant.
Keywords: acetaminophen, acute pain, biphasic, extended release, fixed-dose combination, immediate release, oxycodone, population pharmacokinetics
Introduction
Biphasic immediate-release (IR)/extended-release (ER) oxycodone (OC)/acetaminophen (APAP) 7.5/325 mg tablets (XARTEMIS™ XR formerly MNK-795; Mallinckrodt Brand Pharmaceuticals, Inc., Hazelwood, MO, USA) are approved in the US for the management of acute pain severe enough to require opioid treatment and for which alternative treatment options are inadequate.1 IR/ER OC/APAP has pharmacokinetic (PK) characteristics not found in other fixed-dose combination (FDC) or single-entity OC formulations. Specifically, IR/ER OC/APAP 7.5/325 mg tablets employ a dual-layer matrix designed to release 25% of the OC and 50% of the APAP rapidly from an IR layer and the remainder of the OC and APAP dose in a sustained manner from an ER layer over a 12-hour dosing interval.1 These novel PK properties facilitate a rapid onset of effect for acute pain relief while permitting infrequent dosing and sustained efficacy.
In a randomized, placebo-controlled trial, IR/ER OC/APAP demonstrated efficacy in treating acute moderate to severe pain and had a tolerability profile similar to other FDC opioid analgesics in patients who had undergone a primary unilateral first metatarsal bunionectomy, an established model for acute pain.2 However, the population PK of IR/ER OC/APAP has not been characterized.
Clinically, population PK analyses are important in determining whether dose adjustments are necessary to compensate for the effect on PK parameters (eg, absorption, distribution, metabolism, elimination) of patient factors such as body weight, age, sex, and race. For example, population PK analyses of the single-entity OC analgesic, controlled-release (CR) OC, have shown that the elimination of OC is slower in elderly patients compared with younger patients3 and in women compared with men.4 Because IR/ER OC/APAP has novel PK characteristics, it is important for prescribers to know whether the population PK of IR/ER OC/APAP may have clinically relevant effects, particularly if any of these effects have not been observed with other FDC or single-entity OC formulations. In a pooled analysis of two Phase I studies, single doses of IR/ER OC/APAP showed similar bioavailability and overall exposure over a 12-hour period compared with IR OC/APAP administered in two doses 6 hours apart.5
In addition, the potential effects of food and the fat content of food on PK are an important consideration with IR/ER OC/APAP. With other OC and APAP formulations, consumption of a high-fat meal has been reported to increase the absorption of OC,6 and food can delay the peak concentration of APAP.7 Food effects have particular relevance to the gastroretentive ER drug delivery technology used in IR/ER OC/APAP (Acuform®, Depomed, Inc., Newark, CA, USA) because clinically meaningful food effects have been reported in other products formulated with this technology.8,9 However, no clinically meaningful food effects were associated with the use of this gastroretentive technology in a previous study of IR/ER OC/APAP.10
To further characterize the PK of IR/ER OC/APAP, pooled data from four clinical trials were analyzed to assess the single-dose population PK of IR/ER OC/APAP in healthy participants under fasted conditions. In addition, the effects of high-fat and low-fat meals on the single-dose population PK of IR/ER OC/APAP were examined in one of these studies.
Methods
Study design
The single-dose population PK of OC and APAP following administration of IR/ER OC/APAP under fasted conditions was assessed in a post hoc analysis of pooled data from four individual studies. Studies 1 and 2 were open-label, randomized, crossover, single-dose studies in healthy participants under fasted conditions. Study 3 was a randomized, double-blind, double-dummy, active- and placebo-controlled seven-way crossover study in fasted, healthy recreational users of prescription drugs. Study 4 was a single-center, open-label, randomized, Phase I, three-period, six-sequence crossover study in healthy participants under fed or fasted conditions. However, only results obtained under fasted conditions were included in the pooled general population PK analysis. The single-dose PK under fed vs fasted conditions was assessed using the full data from the study.
The studies received institutional review board approval (protocol numbers: COV15000170, COV15000172, COV15000255, and COV15000244), and the studies were conducted in accordance with the International Conference on Harmonisation Good Clinical Practice, the Declaration of Helsinki, and applicable US clinical research regulations and guidelines. Participants provided written informed consent before study enrollment. These four Phase I studies conducted in the US were not registered.
Participants
Participants were healthy adults aged 18–55 years, with a body mass index (BMI) of 19 to <33 kg/m2 and a body weight of ≥59 kg. Study 3 enrolled healthy recreational users of prescription drugs. Key exclusion criteria included the following: electrocardiogram abnormalities; laboratory findings outside the upper or lower limits of normal (at investigator’s discretion); pulse oximetry readings <95% (<92% in study 4) while awake; use of nicotine-containing products within 6 months before enrollment (except study 4); any condition that might interfere with the absorption, distribution, metabolism, or elimination of study drug; and psychiatric disorders, gastrointestinal disease, seizures, or history of malignancy. Studies 1, 2, and 4 excluded individuals with current or past substance abuse. Study 3 excluded individuals with recreational opioid use during the 72 hours before study initiation.
Treatments
In studies 1–3, participants received single doses of one, two, or four intact tablets of IR/ER OC/APAP 7.5/325 mg under fasted conditions, for total single doses of 7.5/325 mg, 15/650 mg, or 30/1,300 mg, respectively. In studies 1 and 2, participants fasted for ≥10 hours overnight before the initial dose and again for 1 hour before the dose at hour 6. In study 3, participants fasted for ≥8 hours before the initial dose and for 4 hours postdose. In study 4, participants received two IR/ER OC/APAP tablets after a high-fat meal (~50% of kilocalories from fat and a total of 1,000±100 kcal), after a low-fat meal (~25%–30% of kilocalories from fat and a total of 800±80 kcal), or under fasted conditions (≥10 hours overnight through 4 hours postdose). In all studies, water was permitted during the fasting period but not between 1 hour before and 1 hour after dosing (excepting water provided with the dose). With the exception of study 3, participants were scheduled to receive each treatment separated by a 6- to 7-day washout period. In study 3, participants were scheduled to receive each treatment separated by a 72-hour washout period.
In studies 1, 2, and 4, participants were confined to the clinic from the evening before treatment to 48 hours postdose. In study 3, participants were confined for 25 days. In studies 1, 2, and 4, participants were prohibited from consuming foods containing poppy seeds, grapefruit juice, alcohol, or xanthenes (eg, coffee, tea, caffeinated soda, chocolate) for 2–14 days before check-in throughout each confinement period. In study 3, these prohibitions were implemented 72 hours before check-in and maintained throughout the confinement period. In addition, study 3 participants were to refrain from nicotine-containing products during confinement.
PK assessments
In all studies, blood samples for determination of OC and APAP were collected predose and up to 48 hours after dosing (study 1: 15, 30, and 45 minutes and 1, 2, 3, 4, 5, 6, 6.5, 7, 8, 9, 10, 12, 16, 18, 20, 24, 36, and 48 hours postdose; study 2: 1, 2, 3, 4, 5, 6, 6.5, 7, 9, 10, 12, 16, 18, 20, 24, and 36 hours postdose; study 3: 30 minutes and 1, 1.5, 2, 3, 4, 5, 6, 8, 12, 16, and 24 hours postdose; study 4: 15, 30, and 45 minutes and 1, 2, 3, 4, 5, 6, 7, 8, 9, 10, 12, 16, 18, 20, 24, 36, and 48 hours postdose). Samples were collected in prechilled tubes, placed in an ice bath/cryoblock, centrifuged according to the site’s established procedures, and frozen at ≤−70°C within 1 hour of collection until time of assay. OC and APAP concentrations were measured by using a high-performance liquid chromatography/tandem mass spectrometry assay that was validated for linearity, precision, accuracy, ruggedness, recovery, and specificity. The method was developed and validated over a calibration range of 0.100–100 ng/mL for OC and 100–50,000 ng/mL for APAP, using 0.100 mL of plasma containing dipotassium ethylenediaminetetraacetic acid as an anticoagulant. It used a liquid–liquid extraction procedure followed by chromatographic separation and tandem mass spectrometry detection of the analytes, with OC-d6 and APAP-d4 as internal standards. Data were collected using Analyst version 1.4.2 (Applied Biosystems, Carlsbad, CA, USA) and PPD Assist LIMS version 5 (PPD, Richmond, VA, USA). The lower limit of quantitation was 0.100 ng/mL for OC and 100 ng/mL for APAP. The average recovery of drug was 96.2% for OC, 50.1% for APAP, and 90.2% and 50.4% for the OC and APAP internal standards, respectively. The quality control intraday precision range was 1.28%–6.08% for OC and 1.94%–7.60% for APAP, and the quality control intraday accuracy range was −3.15% to 2.16% for OC and −4.95% to 2.90% for APAP. The interday precision range was 2.15%–7.89% for OC and 1.58%–7.82% for APAP, and the interday accuracy range was −1.86% to 2.65% for OC and −3.18% to 1.80% for APAP.
Statistical analyses
The influence of six different covariates (sex, race, age, weight, height, and BMI) on OC and APAP total body clearance (CL/F; F = bioavailability), volume of distribution (V/F), and absorption rate constant (Ka) was examined using NONMEM 7.2/PDxPop5 software (ICON Development Solutions, Dublin, Ireland). For building the final population PK model, covariate effects were evaluated in a stepwise forward addition manner followed by stepwise deletion. Starting with the basic model, different covariates and parameter combinations were assessed. Inclusion of the strongest covariate effect was determined by the greatest decrease in object function value (OFV) and Akaike information criteria,11 with a minimum change of >3.84 in OFV (corresponding to P<0.05) being required for addition to the model. This was repeated until no further covariates met the minimum change in OFV and the full model was established. All covariates were then removed from the full model one at a time, and the weakest effect was eliminated from the full model, unless the difference in OFV was larger than 6.63, which corresponds to stricter criteria of significance (ie, P<0.01). This was repeated until no more nonsignificant covariates were left to be removed. The remaining covariate parameter interactions constituted the final model.
Single-dose population PK data were analyzed using first-order conditional estimation methods. Food effects on population PK data were analyzed using first-order conditional estimation with interaction methods. The population PK of OC was best described by a one-compartment model (Figure 1A). An exponential error model was used to describe interindividual variability, and an additive-proportional error model was used for intraindividual (residual) variability. The population PK of APAP was best described by a two-compartment model (absorption compartment [V1], central compartment volume of distribution [V2], peripheral compartment volume of distribution [V3]; Figure 1B). An exponential error model was used to describe interindividual variability, whereas an additive–proportional error model was used for intraindividual variability. To stabilize the resulting models, the Ka was fixed at 5.4 hour−1 for the single-dose population PK of APAP. The Ka of APAP was not fixed for the analysis of food effects.
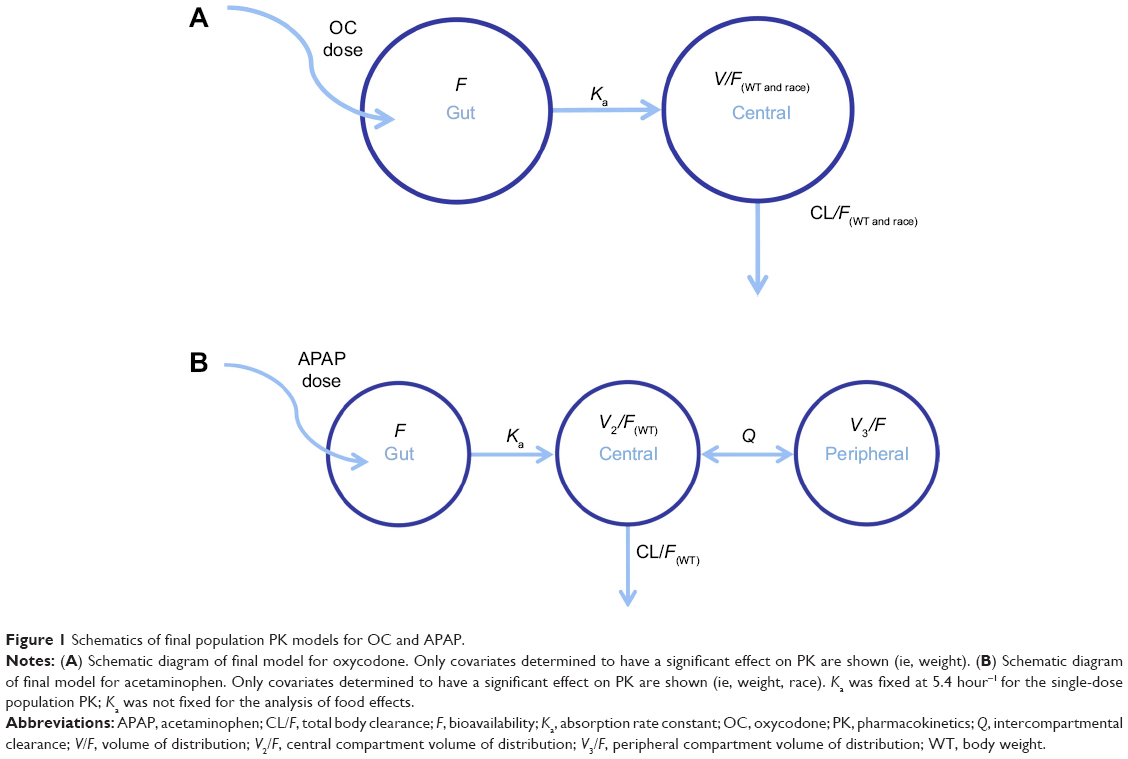 | Figure 1 Schematics of final population PK models for OC and APAP. |
Results
Patients and demographics
A total of 251 participants enrolled in the four studies; 151 completed all treatment periods and were included in the pooled analysis. Thirty-one participants who completed study 4 were included in the analysis of food effects. Most discontinuations were due to adverse events, almost exclusively vomiting, which was defined in the protocols as grounds for withdrawal. Nearly all participants were white or black, and approximately two thirds were men.
Demographic characteristics of the 151 participants in the pooled analysis of single-dose studies are presented in Table 1. Demographic characteristics of the 31 participants (out of 48 enrolled) who completed the single-dose study examining the effects of food are presented in Table 2.
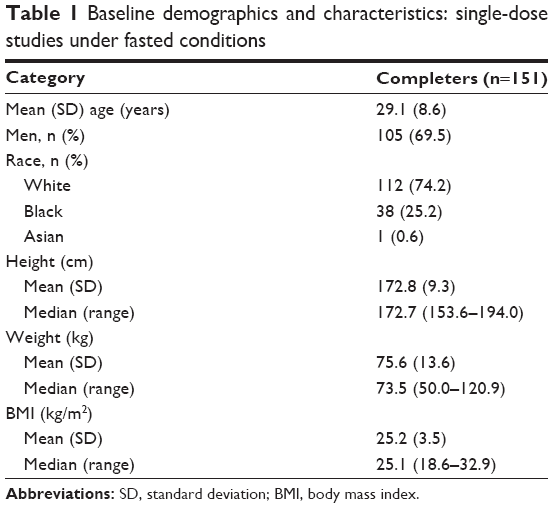 | Table 1 Baseline demographics and characteristics: single-dose studies under fasted conditions |
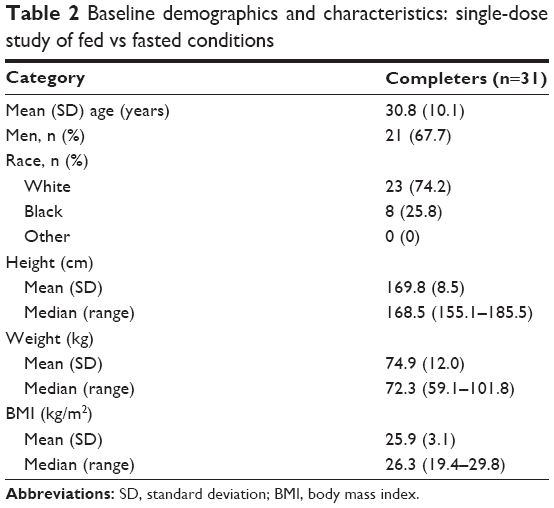 | Table 2 Baseline demographics and characteristics: single-dose study of fed vs fasted conditions |
Population PK – fasted conditions
Oxycodone
The individual CL/F and V/F equations for OC based on the final model were as follows:
CL/F = [θ1*((WT/73.45)**0.75)*(θ5**RACE)]*exp(η1) |
CL/F = [92.4*((WT/73.45)**0.75)*(1 or 0.831)]*exp(0.0673) |
V/F = [θ2*(WT/73.45)*(θ4**RACE)]*exp(η2) |
V/F = [772*(WT/73.45)*(1 or 0.827)]*exp(0.0694) |
where η is the interindividual variability and WT is the body weight.
As shown in Figure 2, there was improvement in the distribution of predicted OC concentrations in the final vs the base model. The final model improved the distribution of weighted residuals and individual weighted residuals (Figure 3) and also improved interindividual error values for CL/F and V/F compared with the base model (Figure 4).
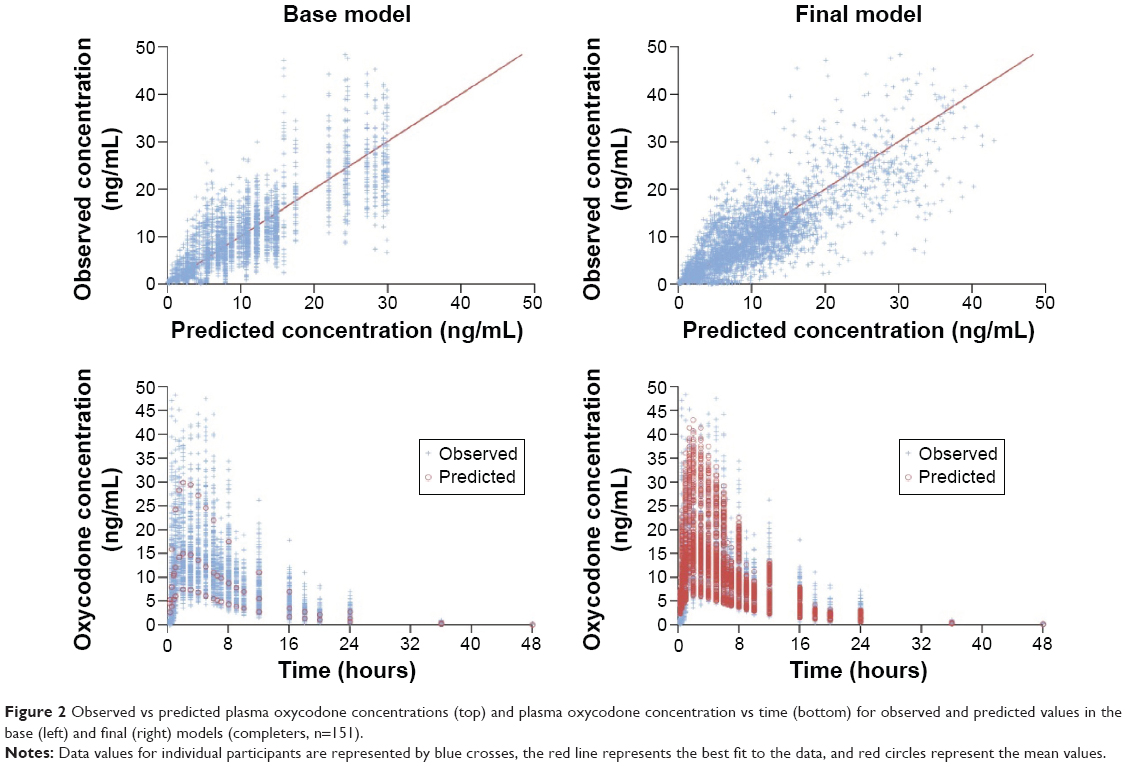 | Figure 2 Observed vs predicted plasma oxycodone concentrations (top) and plasma oxycodone concentration vs time (bottom) for observed and predicted values in the base (left) and final (right) models (completers, n=151). |
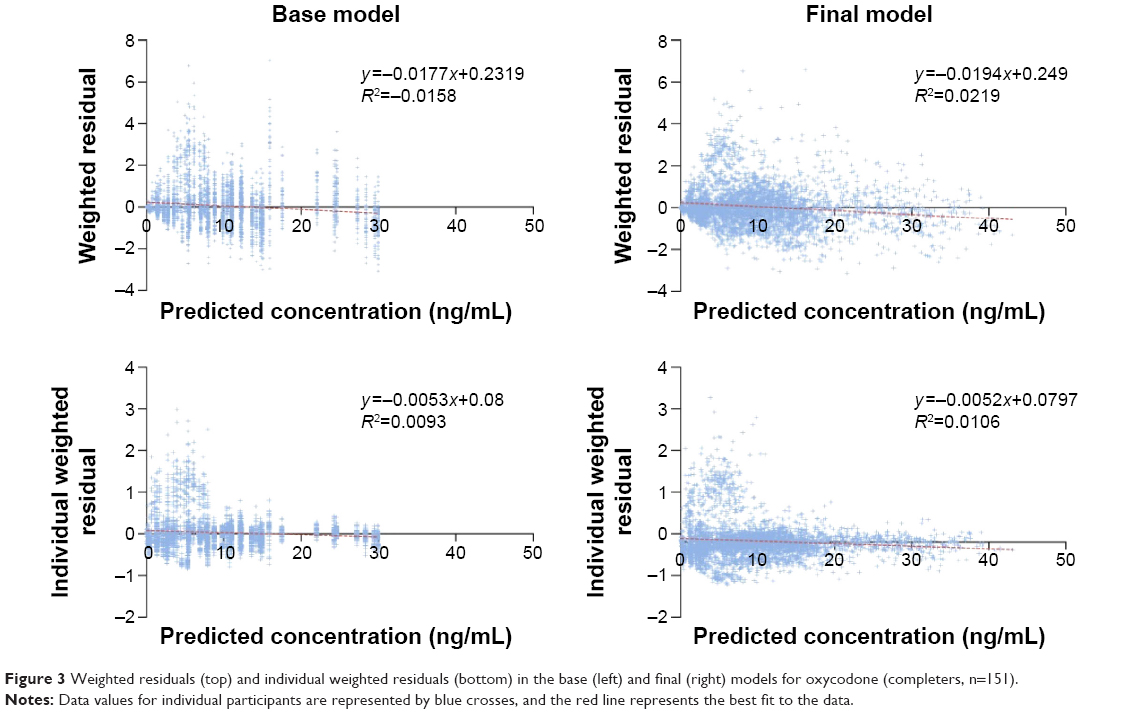 | Figure 3 Weighted residuals (top) and individual weighted residuals (bottom) in the base (left) and final (right) models for oxycodone (completers, n=151). |
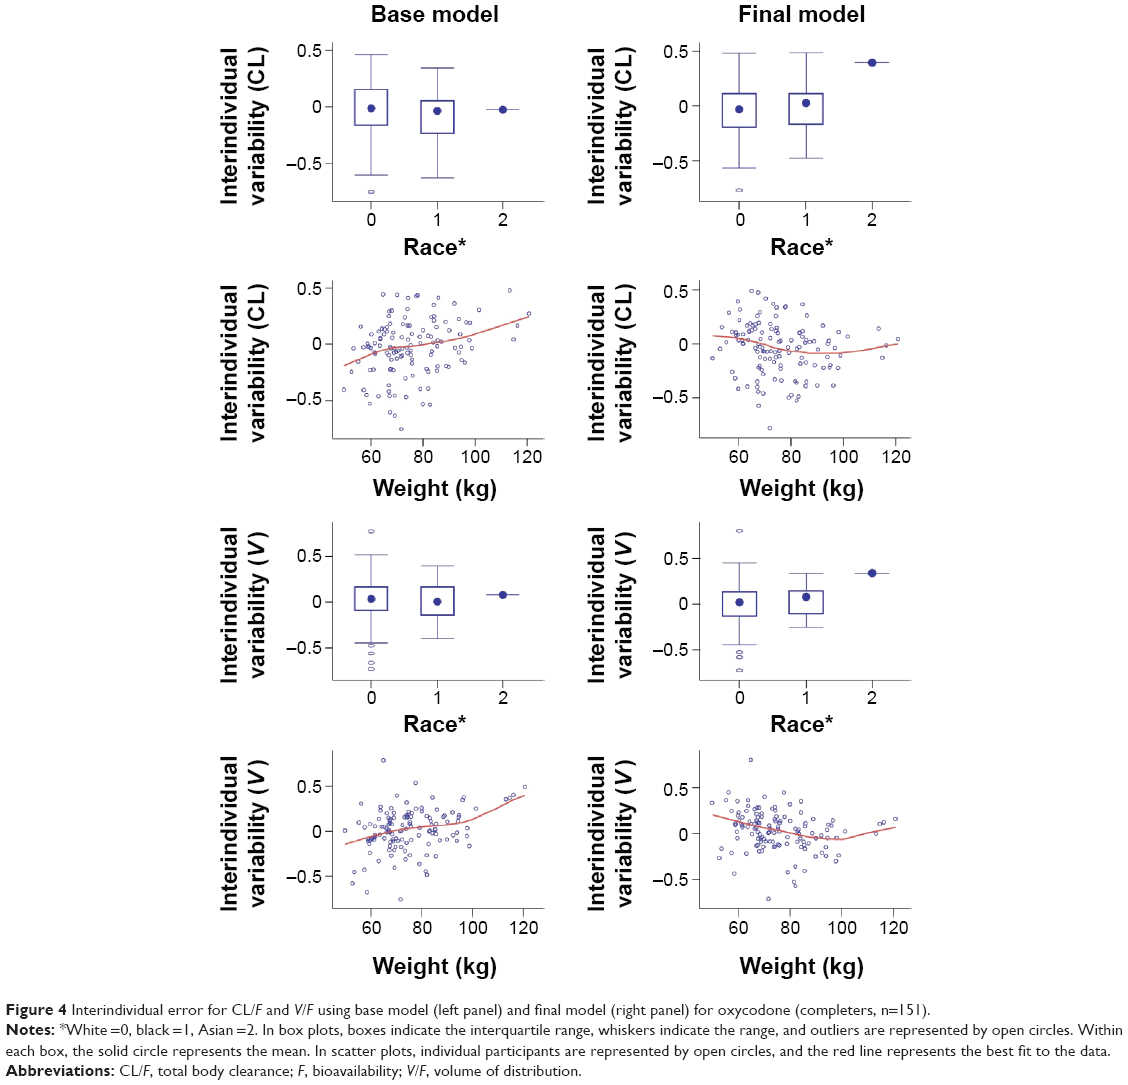 | Figure 4 Interindividual error for CL/F and V/F using base model (left panel) and final model (right panel) for oxycodone (completers, n=151). |
Average estimates of CL/F and V2/F in the base and final models are shown in Table 3. In the final model, the average estimates for OC were 92.4 L/h for CL/F, 772 L for V/F, and 1.15 hour−1 for Ka. Body weight and race were each identified as statistically significant sources of variability in both the CL/F and V/F of OC, as shown in Table 3; covariates not determined to have a significant effect on the PK are not included in the table. A positive correlation was observed with regard to body weight, with every 10% change in body weight from the median value of 73.45 kg resulting in an approximate 7.5% change in both CL/F and V/F. Race was also a factor, with black participants having a 17.3% lower CL/F and a 16.9% lower V/F compared with white participants.
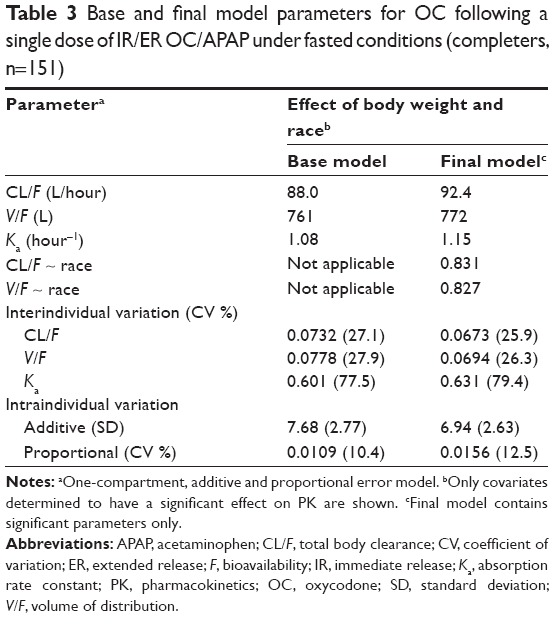 | Table 3 Base and final model parameters for OC following a single dose of IR/ER OC/APAP under fasted conditions (completers, n=151) |
Acetaminophen
Average estimates of the final model for APAP CL/F and V2/F were 20.5 L/h and 58.9 L, respectively (Table 4). The final model improved the distribution of predicted APAP concentrations (Figure 5) and weighted residuals (Figure 6). The individual CL/F and V2/F equations for APAP based on the final model were as follows:
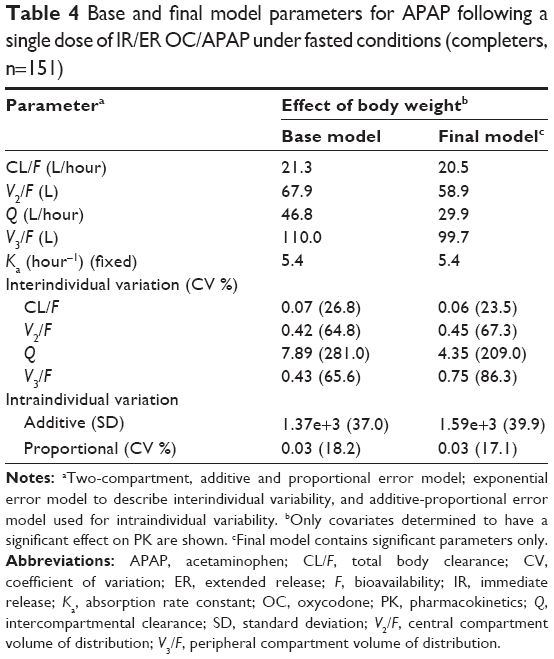 | Table 4 Base and final model parameters for APAP following a single dose of IR/ER OC/APAP under fasted conditions (completers, n=151) |
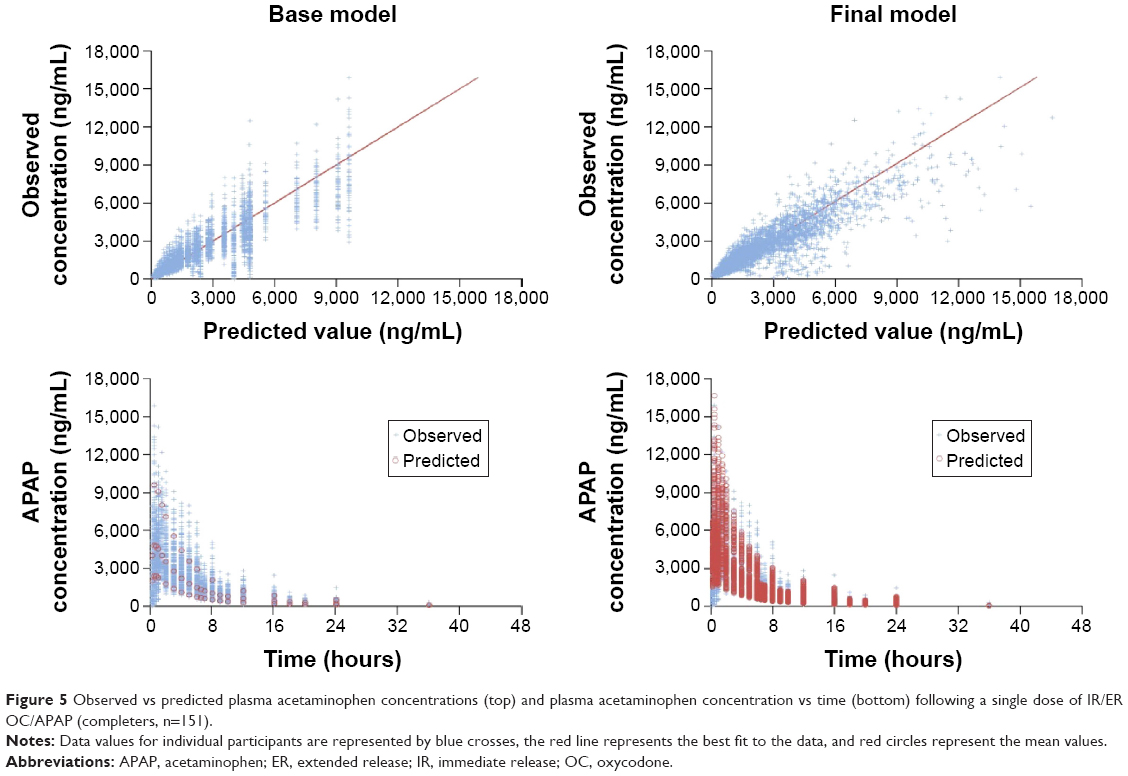 | Figure 5 Observed vs predicted plasma acetaminophen concentrations (top) and plasma acetaminophen concentration vs time (bottom) following a single dose of IR/ER OC/APAP (completers, n=151). |
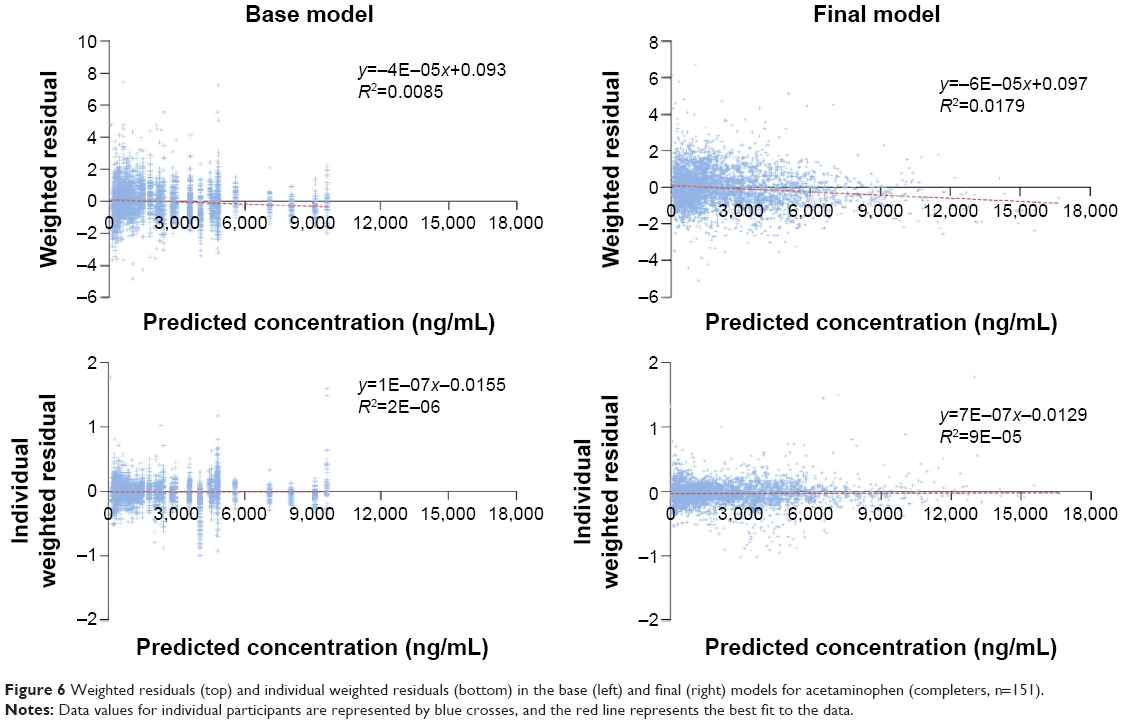 | Figure 6 Weighted residuals (top) and individual weighted residuals (bottom) in the base (left) and final (right) models for acetaminophen (completers, n=151). |
CL/F = [θ1*((WT/73.45)**0.75)]*exp(η1) |
CL/F = [20.5*((WT/73.45)**0.75)]*exp(0.0554) |
V2/F = [θ2*(WT/73.45)]*exp(η2) |
V2/F = [58.9*(WT/73.45)]*exp(0.453) |
Of the covariates studied, only body weight was associated with significant variability in APAP CL/F and V2/F, as shown in Table 4; covariates not determined to have a significant effect on the PK are not included in the table. For every 10% change in weight from the median value of 73.5 kg, a 7.5% change would occur in CL/F and V2/F.
Effects of food on PK parameters
Individual CL/F, V/F, and Ka equations for OC based on final model were calculated as follows:
CL/F = [θ1*(HT/168.5)]*exp(η1) |
CL/F = [77.6*(HT/168.5)]*exp(0.0517) |
V/F = [θ2*VDIET*(WT/72.3)]*exp(η2) |
V/F = [640*(1 or 0.608 or 0.648)*(WT/72.3)]*exp(0.0208) |
Ka = [θ3*KADIET]*exp(η3) |
Ka = [0.555*(1 or 0.518 or 0.497)]*exp(0.104) |
Individual CL/F, V2/F, and Ka equations for APAP based on final model were calculated as follows:
CL/F = [θ1*(θ9**SEX)*((WT/72.3)**0.75)]*exp(η1) |
CL/F = [22.9*(1 or 0.278)*((WT/72.3)**0.75)]*exp(0.0302) |
V2/F = [θ2*(θ8**SEX)*(WT/72.3)]*exp(η2) |
V2/F = [140*(1 or 0.295)*(WT/72.3)]*exp(0.0114) |
Ka = [θ5*KADIET]*exp(η5) |
Ka = [3.17*(1 or 0.802 or 0.825)]*exp(0.526) |
In these equations, men =0; women =1; η = interindividual random effects; fasted diet =0; low-fat diet =1; high-fat diet =2; VDIET =1 for fasting, θ4 for low-fat diet, or θ5 for high-fat diet; KADIET =1 for fasting, θ6 for low-fat diet, or θ7 for high-fat diet.
Base and final model parameters for OC and APAP are shown in Table 5. According to the final model formulations, the Ka of OC and APAP decreased 39% and 20%, respectively, when consuming a low-fat, low-calorie meal. The Ka of OC and APAP decreased 48% and 18%, respectively, when consuming a high-fat, high-calorie meal. The variability in Ka is plotted in Figures 7 and 8.
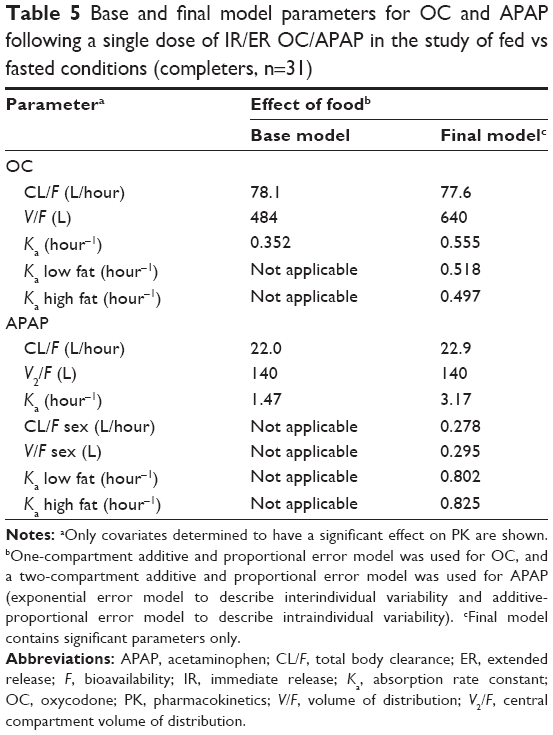 | Table 5 Base and final model parameters for OC and APAP following a single dose of IR/ER OC/APAP in the study of fed vs fasted conditions (completers, n=31) |
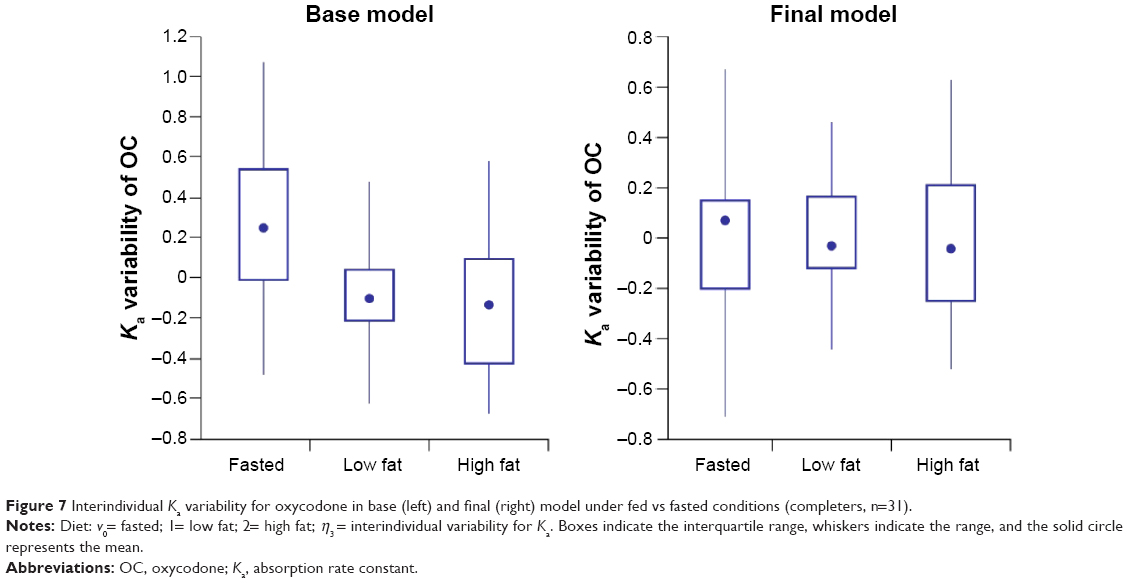 | Figure 7 Interindividual Ka variability for oxycodone in base (left) and final (right) model under fed vs fasted conditions (completers, n=31). |
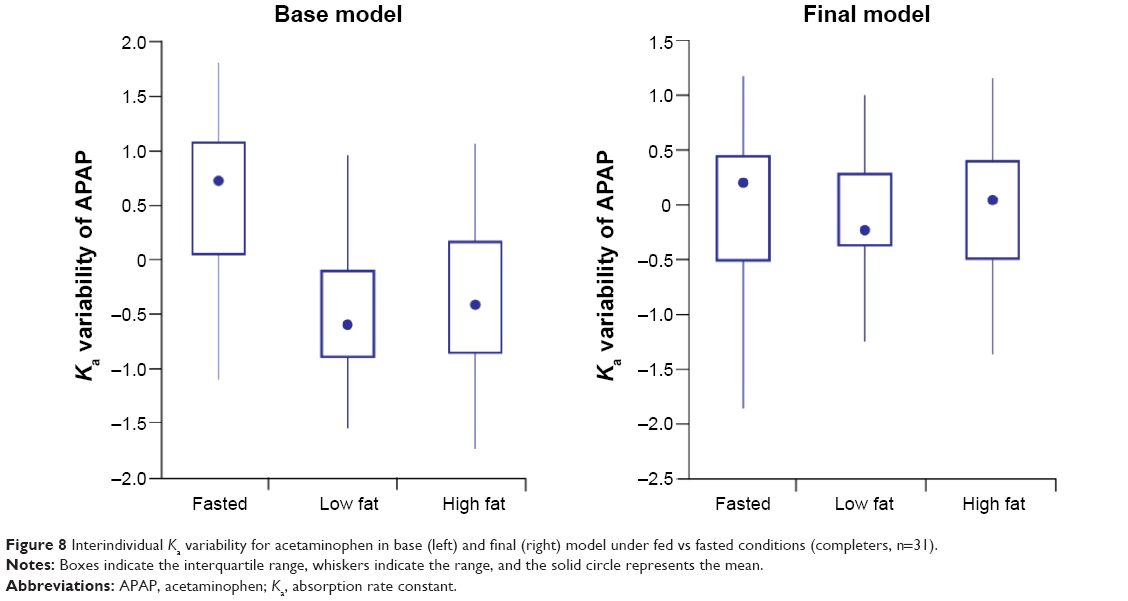 | Figure 8 Interindividual Ka variability for acetaminophen in base (left) and final (right) model under fed vs fasted conditions (completers, n=31). |
Discussion
A one-compartment model was generated to describe the population PK of OC after IR/ER OC/APAP administration, and a two-compartment model was used to characterize the population PK of APAP. Out of six covariates (sex, race, age, body weight, height, and BMI), body weight and race (black vs white) were each identified as statistically significant sources of variability in the CL/F and V/F of OC following single-dose administration of IR/ER OC/APAP.
Although these data may suggest using a lower dose of IR/ER OC/APAP in black patients, the difference is not clinically meaningful with respect to dosing of IR/ER OC/APAP tablets. Considering the approved dose of one to two tablets every 8–12 hours, dose adjustments of <50% are not clinically relevant for IR/ER OC/APAP 7.5/325 mg tablets.1 Nonetheless, black vs white racial differences in OC PK have not been reported previously as a necessary consideration for dose adjustment; hence, further investigation is warranted.
No sex-related PK differences were found with IR/ER OC/APAP. This is in contrast to the observed lower clearance of OC in women compared with men, when compensating for body weight, in a 1996 study of orally administered OC CR4; however, a 2011 study of intravenously administered OC in patients aged 20–90 years found no effect of sex on OC elimination in any age group.12 Both formulation and route of administration of OC differed between these two previous studies, whereas the present study involved oral administration of OC in a formulation distinct from OC CR.
Body weight, but not other examined demographic characteristics, affected the CL/F and V2/F of APAP, suggesting a potential need for dose adjustment of IR/ER OC/APAP based on weight. However as noted above, dose adjustments of <50% are not clinically relevant for IR/ER OC/APAP 7.5/325 mg tablets.1
Administration of IR/ER OC/APAP with food slightly decreased the Ka of OC and APAP. In the primary PK analysis of this study, food intake delayed time to maximum concentration (tmax) by 1.5 hours and 2 hours, respectively, for OC and APAP, and time to first measurable concentration (tlag) by 15 minutes for both.10 This supports the finding in the present population PK analysis that food decreases the Ka of OC and APAP. However, administration of IR/ER OC/APAP with food had no effect on the extent of drug exposure because the area under the concentration vs time curve for OC and APAP remained bioequivalent under high-fat and low-fat fed conditions in the primary PK analysis.10 Food had a small but statistically significant effect on the V/F of OC, and sex had a statistically significant effect on the CL/F and V2/F of APAP. However, these effects, which were limited to the subset of participants who received IR/ER OC/APAP under fed conditions, were small and not considered clinically relevant. Despite statistically significant changes in Ka in this population PK analysis, which were accompanied by increases in tmax and tlag, in the primary PK analysis, observed food effects are not clinically meaningful because total exposure remains the same regardless of food intake. Collectively, these results suggest that IR/ER OC/APAP can be administered with or without food.
The models developed for these analyses will be useful in addressing variability and may allow for improved dosing of IR/ER OC/APAP in patients with acute pain of moderate to severe intensity warranting opioid analgesic therapy. However, interpretation of the results from the analyses is limited by the small sample size and the exclusion of individuals with major medical conditions that might alter the PK properties of IR/ER OC/APAP tablets. The study also excluded pediatric (<18 years old) and older (>55 years) individuals and participants who would be classified as either obese or underweight. Almost all participants were white or black; hence, PK variability in Asian, Hispanic, or other ethnicities cannot be ruled out. Finally, the data pooled were for single-dose treatment, making it difficult to draw conclusions about differences based on subject characteristics that could emerge during extended treatment.
In conclusion, statistically significant population PK effects of body weight and race for OC, and of body weight for APAP, and food effects on Ka were not assessed to be clinically relevant, considering the approved dose range for IR/ER OC/APAP. However, dose adjustment may be necessary for large deviations from average body weight.
Acknowledgment
Mallinckrodt sponsored this research and funded editorial support provided by Jeffrey Coleman, MA, and Robert Axford-Gatley, MD, of C4 MedSolutions, LLC (Yardley, PA, USA), a CHC Group company.
Disclosure
All authors are employees of Mallinckrodt. The authors report no other conflicts of interest in this work.
References
Xartemis™ XR (oxycodone hydrochloride and acetaminophen extended-release tablets). Hazelwood, MO: Full Prescribing Information, Mallinckrodt Brand Pharmaceuticals, Inc.; 2014. | ||
Singla N, Barrett T, Sisk L, Kostenbader K, Young J, Giuliani M. A randomized, double-blind, placebo-controlled study of the efficacy and safety of MNK-795, a dual-layer, biphasic, immediate-release and extended-release combination analgesic for acute pain. Curr Med Res Opin. 2014;30(3):349–359. | ||
Saari TI, Ihmsen H, Neuvonen PJ, Olkkola KT, Schwilden H. Oxycodone clearance is markedly reduced with advancing age: a population pharmacokinetic study. Br J Anaesth. 2012;108(3):491–498. | ||
Kaiko RF, Benziger DP, Fitzmartin RD, Burke BE, Reder RF, Goldenheim PD. Pharmacokinetic-pharmacodynamic relationships of controlled-release oxycodone. Clin Pharmacol Ther. 1996;59(1):52–61. | ||
Devarakonda K, Morton T, Giuliani M, Kostenbader K, Barrett T. Single-dose pharmacokinetics of MNK-795, an extended-release oxycodone and acetaminophen combination analgesic: results from 2 active comparator studies. J Bioequiv Availab. 2014;6:038–045. | ||
Purdue Pharma L.P. Medical Services Dept. OxyContin (oxycodone HCl controlled-release) Tablets AMCP Dossier. Alexandria, VA: Academy of Managed Care Pharmacy; 2005. | ||
Tylenol® (acetaminophen). Fort Washington, PA: Full Prescribing Information, McNeil Consumer Healthcare; 2010. | ||
Glumetza® (metformin hydrochloride extended-release tablets). San Diego, CA: Full Prescribing Information, Santarus, Inc.; 2013. | ||
Gralise® (gabapentin extended-release tablets). Newark, CA: Full Prescribing Information, Depomed, Inc.; 2012. | ||
Devarakonda K, Morton T, Margulis R, Giuliani M, Barrett T. Pharmacokinetics and bioavailability of oxycodone and acetaminophen following single-dose administration of MNK-795, a dual-layer, biphasic, IR/ER combination formulation, under fed and fasted conditions. Drug Des Devel Ther. 2014;8:1125–1134. | ||
Akaike H. A new look at the statistical model identification. IEEE Trans Automat Contr. 1974;19(6):716–723. | ||
Liukas A, Kuusniemi K, Aantaa R, et al. Elimination of intravenous oxycodone in the elderly: a pharmacokinetic study in postoperative orthopaedic patients of different age groups. Drugs Aging. 2011;28(1):41–50. |
 © 2015 The Author(s). This work is published and licensed by Dove Medical Press Limited. The full terms of this license are available at https://www.dovepress.com/terms.php and incorporate the Creative Commons Attribution - Non Commercial (unported, v3.0) License.
By accessing the work you hereby accept the Terms. Non-commercial uses of the work are permitted without any further permission from Dove Medical Press Limited, provided the work is properly attributed. For permission for commercial use of this work, please see paragraphs 4.2 and 5 of our Terms.
© 2015 The Author(s). This work is published and licensed by Dove Medical Press Limited. The full terms of this license are available at https://www.dovepress.com/terms.php and incorporate the Creative Commons Attribution - Non Commercial (unported, v3.0) License.
By accessing the work you hereby accept the Terms. Non-commercial uses of the work are permitted without any further permission from Dove Medical Press Limited, provided the work is properly attributed. For permission for commercial use of this work, please see paragraphs 4.2 and 5 of our Terms.