")
Back to Journals » Drug Design, Development and Therapy » Volume 9
Plumbagin suppresses epithelial to mesenchymal transition and stemness via inhibiting Nrf2-mediated signaling pathway in human tongue squamous cell carcinoma cells
Authors Pan S, Qin Y, Zhou Z, He Z, Zhang X, Yang T, Yang Y, Wang D, Zhou S, Qiu J
Received 30 May 2015
Accepted for publication 6 August 2015
Published 5 October 2015 Volume 2015:9 Pages 5511—5551
DOI https://doi.org/10.2147/DDDT.S89621
Checked for plagiarism Yes
Review by Single anonymous peer review
Peer reviewer comments 3
Editor who approved publication: Prof. Dr. Wei Duan
Shu-Ting Pan,1 Yiru Qin,2 Zhi-Wei Zhou,2,3 Zhi-Xu He,3 Xueji Zhang,4 Tianxin Yang,5 Yin-Xue Yang,6 Dong Wang,7 Shu-Feng Zhou,2 Jia-Xuan Qiu1
1Department of Oral and Maxillofacial Surgery, The First Affiliated Hospital of Nanchang University, Nanchang, Jiangxi, People’s Republic of China; 2Department of Pharmaceutical Sciences, College of Pharmacy, University of South Florida, Tampa, FL, USA; 3Guizhou Provincial Key Laboratory for Regenerative Medicine, Stem Cell and Tissue Engineering Research Center and Sino-US Joint Laboratory for Medical Sciences, Guiyang Medical University, Guiyang, Guizhou, People’s Republic of China; 4Research Center for Bioengineering and Sensing Technology, University of Science and Technology Beijing, Beijing, People’s Republic of China; 5Department of Internal Medicine, University of Utah and Salt Lake Veterans Affairs Medical Center, Salt Lake City, UT, USA; 6Department of Colorectal Surgery, General Hospital of Ningxia Medical University, Yinchuan, Ningxia, People’s Republic of China; 7Cancer Center, Daping Hospital and Research Institute of Surgery, Third Military Medical University, Chongqing, People’s Republic of China
Abstract: Tongue squamous cell carcinoma (TSCC) is the most common malignancy in oral and maxillofacial tumors with highly metastatic characteristics. Plumbagin (5-hydroxy-2-methyl-1, 4-naphthoquinone; PLB), a natural naphthoquinone derived from the roots of Plumbaginaceae plants, exhibits various bioactivities, including anticancer effects. However, the potential molecular targets and underlying mechanisms of PLB in the treatment of TSCC remain elusive. This study employed stable isotope labeling by amino acids in cell culture (SILAC)-based quantitative proteomic approach to investigate the molecular interactome of PLB in human TSCC cell line SCC25 and elucidate the molecular mechanisms. The proteomic data indicated that PLB inhibited cell proliferation, activated death receptor-mediated apoptotic pathway, remodeled epithelial adherens junctions pathway, and manipulated nuclear factor erythroid 2-related factor 2 (Nrf2)-mediated oxidative stress response signaling pathway in SCC25 cells with the involvement of a number of key functional proteins. Furthermore, we verified these protein targets using Western blotting assay. The verification results showed that PLB markedly induced cell cycle arrest at G2/M phase and extrinsic apoptosis, and inhibited epithelial to mesenchymal transition (EMT) and stemness in SCC25 cells. Of note, N-acetyl-l-cysteine (NAC) and l-glutathione (GSH) abolished the effects of PLB on cell cycle arrest, apoptosis induction, EMT inhibition, and stemness attenuation in SCC25 cells. Importantly, PLB suppressed the translocation of Nrf2 from cytosol to nucleus, resulting in an inhibition in the expression of downstream targets. Taken together, these results suggest that PLB may act as a promising anticancer compound via inhibiting Nrf2-mediated oxidative stress signaling pathway in SCC25 cells. This study provides a clue to fully identify the molecular targets and decipher the underlying mechanisms of PLB in the treatment of TSCC.
Keywords: PLB, SILAC, EMT, stemness, Nrf2, tongue squamous cell carcinoma
Introduction
Tongue squamous cell carcinoma (TSCC) is the most prevalent type of oral and maxillofacial tumor, with an estimated 14,320 new cases and 2,190 deaths in the US in 2015.1 The most important etiological factors are tobacco, excessive consumption of alcohol, and betel quid usage, which act separately or synergistically.2 It has been reported that TSCC is more commonly found in males, with a percentage of 72.0% of all TSCC cases, compared with a percentage of 28.0% in females.1 Of note, the incidence of TSCC in young white women is significantly increasing, according to the Surveillance, Epidemiology, and End Results program data from 1973 to 2010 in the US.3 Because of the mobility and masticatory function of the tongue, TSCC is inclined to spread locally, involving perioral structures, and metastasize to local regional lymph nodes. For this reason, TSCC always demonstrates a much more aggressive behavior than other kinds of oral and maxillofacial tumors.4 Although there has been advancement in the sequential therapies, including radiation, surgery, and chemotherapy, the patients still suffer from serious relapse and the 5-year survival rate shows no inspiring progress.5 It requires the development of novel therapeutics with improved therapeutic effect and reduced side effect for TSCC treatment.
It has been revealed that acquisition of epithelial to mesenchymal transition (EMT) and induction of cancer stem cell (CSC)-like properties are closely involved in the initiation, development, progression, metastasis, and relapse of solid tumors.6,7 Normal epithelial cells show apical–basal polarity maintained by apical tight junctions and basolateral adherens junctions. The loss of epithelial property and acquisition of mesenchymal features enables cancer cells to metastasize easily and quickly. The reverse process of mesenchymal to epithelial transition (MET) can also occur. Cancer progression is affected by the balance between EMT and MET.8,9 Thus, interfering with the EMT process may help regress cancer metastasis. On the other hand, the proliferation of tumors is driven by a bulk of dedicated stem cells, the CSCs. CSCs, also known as cancer-initiating cells, are involved in cancer cell renewal and differentiation.10 CSCs can display EMT characteristics such as loss of adhesion protein E-cadherin.11 It is reported that CSCs play an important role in chemotherapy resistance due to the self-renewal ability. Multiple oncogenes are involved in the maintenance of stemness and tumorigenicity of CSCs, such as Octamer-4 (Oct-4), Bmi-1, Nanog, and sex-determing region Y-box 2 (Sox-2).12–15 Hence, targeting the CSCs shows great therapeutic potential in cancer therapy.16
Plumbagin (5-hydroxy-2-methyl-1, 4-naphthoquinone; PLB) is isolated from the root of Plumbago zeylanica L, Juglans regia, Juglans cinerea, and Juglans nigra, with a variety of pharmacological activities including anti-inflammatory, antiatherosclerotic, antibacterial, antifungal, and anticancer activities in in vitro and in vivo models.17 Notably, PLB shows a potent ability in killing cancer cells with minimal side effects.18 Previous studies from our and other groups have shown that PLB regulates various cellular processes such as cell cycle, apoptosis, autophagy, and cellular redox status.19–21 PLB also induces cancer cell apoptosis and autophagy by inhibition of nuclear factor kappa B (NF-κB) activation and phosphatidylinositide 3-kinase (PI3K)/protein kinase B (Akt)/mTOR signaling pathway.21–25 Besides, PLB can efficiently facilitate reactive oxygen species (ROS) generation, which also contributes to the cancer cell killing effect.26–28 However, the full spectrum of the molecular targets and therapeutic effects of PLB in TSCC are not clear.
Accumulating evidence shows that stable isotope labeling by amino acids in cell culture (SILAC)-based quantitative proteomic approach has the capability of revealing the potential targets of a given compound or drug.29,30 In this study, we aimed at elucidating the possible mechanisms for PLB’s anticancer effect in the treatment of TSCC using a SILAC-based quantitative proteomic approach to take a panoramic view of PLB in a TSCC cell line (SCC25). The corresponding verifications were also performed. In addition, we also carried out separate experiments to investigate the relationship between PLB-induced ROS generation and PLB-mediated cell cycle arrest, apoptosis induction, EMT inhibition, and stemness attenuation.
Materials and methods
Chemicals and reagents
Dulbecco’s Modified Eagle’s Medium (DMEM) and Ham’s F12 medium were obtained from Corning Cellgro Inc. (Herndon, VA, USA). Fetal bovine serum (FBS), PLB, dimethyl sulfoxide (DMSO), hydrocortisone, N-acetyl-L-cysteine (NAC, a ROS scavenger), L-glutathione (GSH, a ROS scavenger), ammonium persulfate, D-glucose, propidium iodide (PI), ribonuclease, protease and phosphatase inhibitor cocktails, radioimmunoprecipitation assay buffer (RIPA), bovine serum albumin (BSA), Tris base, sodium dodecyl sulfate (SDS), ethylenediaminetetraacetic acid, Dulbecco’s phosphate-buffered saline (PBS), dithiothreitol (DTT), 13C6-L-lysine, L-lysine, 13C6 15N4-L-arginine, and L-arginine were purchased from Sigma-Aldrich (St Louis, MO, USA). FASP™ protein digestion kit was bought from Protein Discovery Inc. (Knoxville, TN, USA). The Annexin V:PE apoptosis detection kit was purchased from BD Pharmingen Biosciences (San Jose, CA, USA). Ionic Detergent Compatibility Reagent (IDCR) kit, nuclear and cytoplasmic extraction kit, Pierce bicinchoninic acid (BCA) protein assay kit, skimmed milk, and Western blotting substrate were bought from Thermo Fisher Scientific (Waltham, MA, USA). The polyvinylidene difluoride (PVDF) membrane was purchased from Bio-Rad (Hercules, CA, USA). Primary antibodies against human CDK1/cdc2, Cyclin B1, cdc25, Fas (TNFRSF6)-associated via death domain (FADD), TNF1 receptor-associated death domain (TRADD), TRAIL-R2 (DR5), cleaved caspase-3 (CC3), E-cadherin, N-cadherin, Snail, Slug, zinc finger E-box-binding homeobox 1 (TCF8/ZEB1), vimentin, β-Catenin, zona occludens protein 1 (ZO-1), claudin-1, Oct-4, Bmi-1, Nanog, Sox-2, and glutathione S-transferase (GST) were purchased from Cell Signaling Technology Inc. (Beverly, MA, USA). Primary antibodies against nuclear factor erythroid 2-related factor 2 (Nrf2), NAD(P)H quinone oxidoreductase 1 (NQO1), and heat shock protein 90 (HSP90) were purchased from Santa Cruz Biotechnology Inc. (Santa Cruz, CA, USA). The antibodies against human β-actin and Histone H3 were obtained from Santa Cruz Biotechnology Inc.
Cell line and cell culture
The TSCC cell line SCC25 was obtained from the American Type Culture Collection (Manassas, VA, USA) and cultured in a 1:1 mixture of DMEM and Ham’s F12 medium containing 1.2 g/L sodium bicarbonate, 2.5 mM l-glutamine, 15 mM HEPES, and 0.5 mM sodium pyruvate and was supplemented with 400 ng/mL hydrocortisone and 10% heat-inactivated FBS. The cells were maintained at 37°C in a 5% CO2/95% air humidified incubator. PLB was dissolved in DMSO with a stock concentration of 100 mM and was freshly diluted to the desired concentrations with the culture medium. The final concentration of DMSO was at 0.05% (v/v, volume per volume). The control cells received only the vehicle. No ethics approval was required for the use of this cell line this paper.
SILAC quantitative proteomics
Quantitative proteomic experiments were performed using SILAC as described previously.31–33 Briefly, SCC25 cells were cultured in the medium with or without stable isotope-labeled amino acids (13C6 L-lysine and 13C615N4 L-arginine). SCC25 cells were passaged for five times by changing medium or splitting cells. Then, cells with stable isotope-labeled amino acids were treated with 5 μM PLB for 24 hours. Following that, the cell samples were harvested and lysed with hot lysis buffer (100 mM Tris base, 4% SDS, and 100 mM DTT). The proteins were denatured at 95°C for 5 minutes and sonicated at 20% amplitude (AMPL) for 3 seconds with 6 pulses. Later, the samples were centrifuged at 15,000× g for 20 minutes and the supernatant was collected in clean tubes. The protein concentration was determined using the IDCR kits. Then, equal amounts of heavy and light protein sample were combined to reach a total volume of 30–60 μL containing 300–600 μg proteins. The combined protein sample was digested using FASP™ protein digestion kit. After proteins were digested, the resultant sample was acidified to pH of 3 and desalted using a C18 solid-phase extraction column. The samples were then concentrated using vacuum concentrator at 45°C for 120 minutes and the peptide mixtures (5 μL) were subject to the hybrid linear ion trap-Orbitrap (LTQ Orbitrap XL, Thermo Scientific Inc.). Liquid chromatography-tandem mass spectrometry (LC-MS/MS) was performed using a 10 cm long 75 μm (inner diameter) reversed-phase column packed with 5 μm diameter C18 material with 300 Å pore size (New Objective, Woburn, MA, USA), with a gradient mobile phase of 2%–40% acetonitrile in 0.1% formic acid at 200 μL/minute for 125 minutes. The Orbitrap full MS scanning was performed at a mass (m/z) resolving power of 60,000, with positive polarity in profile mode (M+H+). Peptide SILAC ratio was calculated using MaxQuant version 1.2.0.13. The SILAC ratio was determined by averaging all peptide SILAC ratios from peptides identified of the same protein. The protein IDs were identified using Scaffold 4.3.2 from Proteome Software Inc. (Portland, OR, USA) and the pathway was analyzed using Ingenuity Pathway Analysis (IPA) from QIAGEN (Redwood City, CA, USA).
Cell cycle distribution analysis
The effect of PLB on cell cycle distribution of SCC25 cells was determined by flow cytometry using PI as the DNA stain as described previously.20 Briefly, SCC25 cells were treated with PLB at concentrations of 0.1, 1, and 5 μM for 24 hours. In separate experiments, SCC25 cells were treated with 5 μM PLB for 6, 24, and 48 hours. In addition, the effect of ROS scavengers (GSH and NAC)34 on PLB-induced G2/M arrest was also examined. Cells were trypsinized and resuspended in 1 mL serum-free medium. Subsequently, the cells were fixed with 3 mL 70% ethanol at −20°C overnight. The cells were stained using 50 μg/mL PI. A total number of 1×10⁴ cells was subject to cell cycle analysis using a flow cytometer (Becton Dickinson Immunocytometry Systems, San Jose, CA, USA). Finally, the raw data were analyzed by ModFitLT software (version 3.2.1) (Verity Software House, Topsham, MA, USA).
Quantification of cellular apoptosis
We used Annexin V:PE apoptosis detection kit to measure apoptotic cells after the cells were treated with 0.1, 1, and 5 μM PLB for 24 hours. In separate experiments, SCC25 cells were treated with 5 μM PLB for 6, 24, and 48 hours. In addition, the effect of GSH and NAC on PLB-induced apoptosis was also examined. Briefly, cells were trypsinized and washed twice with cold PBS, and then resuspended in 1× binding buffer with 5 μL of PE Annexin V and 5 μL of 7-amino-actinomycin D at a concentration of 1×10⁵/mL cells in a total volume of 100 μL. The cells were gently mixed and incubated in the dark for 15 minutes at room temperature. Following that, a quota of 1× binding buffer (400 μL) was added to each test tube and the number of apoptotic cells was quantified by flow cytometry (BD LSR II Analyzer) within 1 hour.
Western blotting assay
The levels of various cellular proteins were determined using Western blotting assays. The SCC25 cells were incubated with PLB at 0.1, 1, and 5 μM for 24 hours. In separate experiments, SCC25 cells were treated with 5 μM PLB for 6, 24, and 48 hours. After PLB treatment, cells were washed twice with precold PBS and lysed with the RIPA buffer containing the protease inhibitor and phosphatase inhibitor cocktails. In addition, we extracted the nuclear proteins according to the instruction given in the nuclear and cytoplasmic extraction kit. Protein concentrations were measured using the Pierce BCA protein assay kit. Equal amounts of protein samples at 20 μg were electrophoresed on 7%-12% sodium dodecyl sulfate–polyacrylamide gel electrophoresis (SDS-PAGE) minigel after thermal denaturation for 5 minutes at 95°C. Proteins were transferred onto immobilon PVDF membrane at 80 V for 3 hours at 4°C. Subsequently, membranes were blocked with 5% BSA and probed with indicated primary antibody overnight at 4°C and then blotted with respective secondary antibody. Visualization was performed using the Bio-Rad system. Cytosolic protein level was normalized to the matching densitometric value of β-actin, and nuclear protein level was normalized to the matching densitometric value of Histone H3.
Statistical analysis
Data are presented as the mean ± standard deviation (SD). Multiple comparisons were evaluated by one-way analysis of variance (ANOVA), followed by Tukey’s multiple comparison. A value of P<0.05 was considered statistically significant. All the assays were performed in triplicate.
Results
Summary of proteomic response to PLB treatment in SCC25 cells
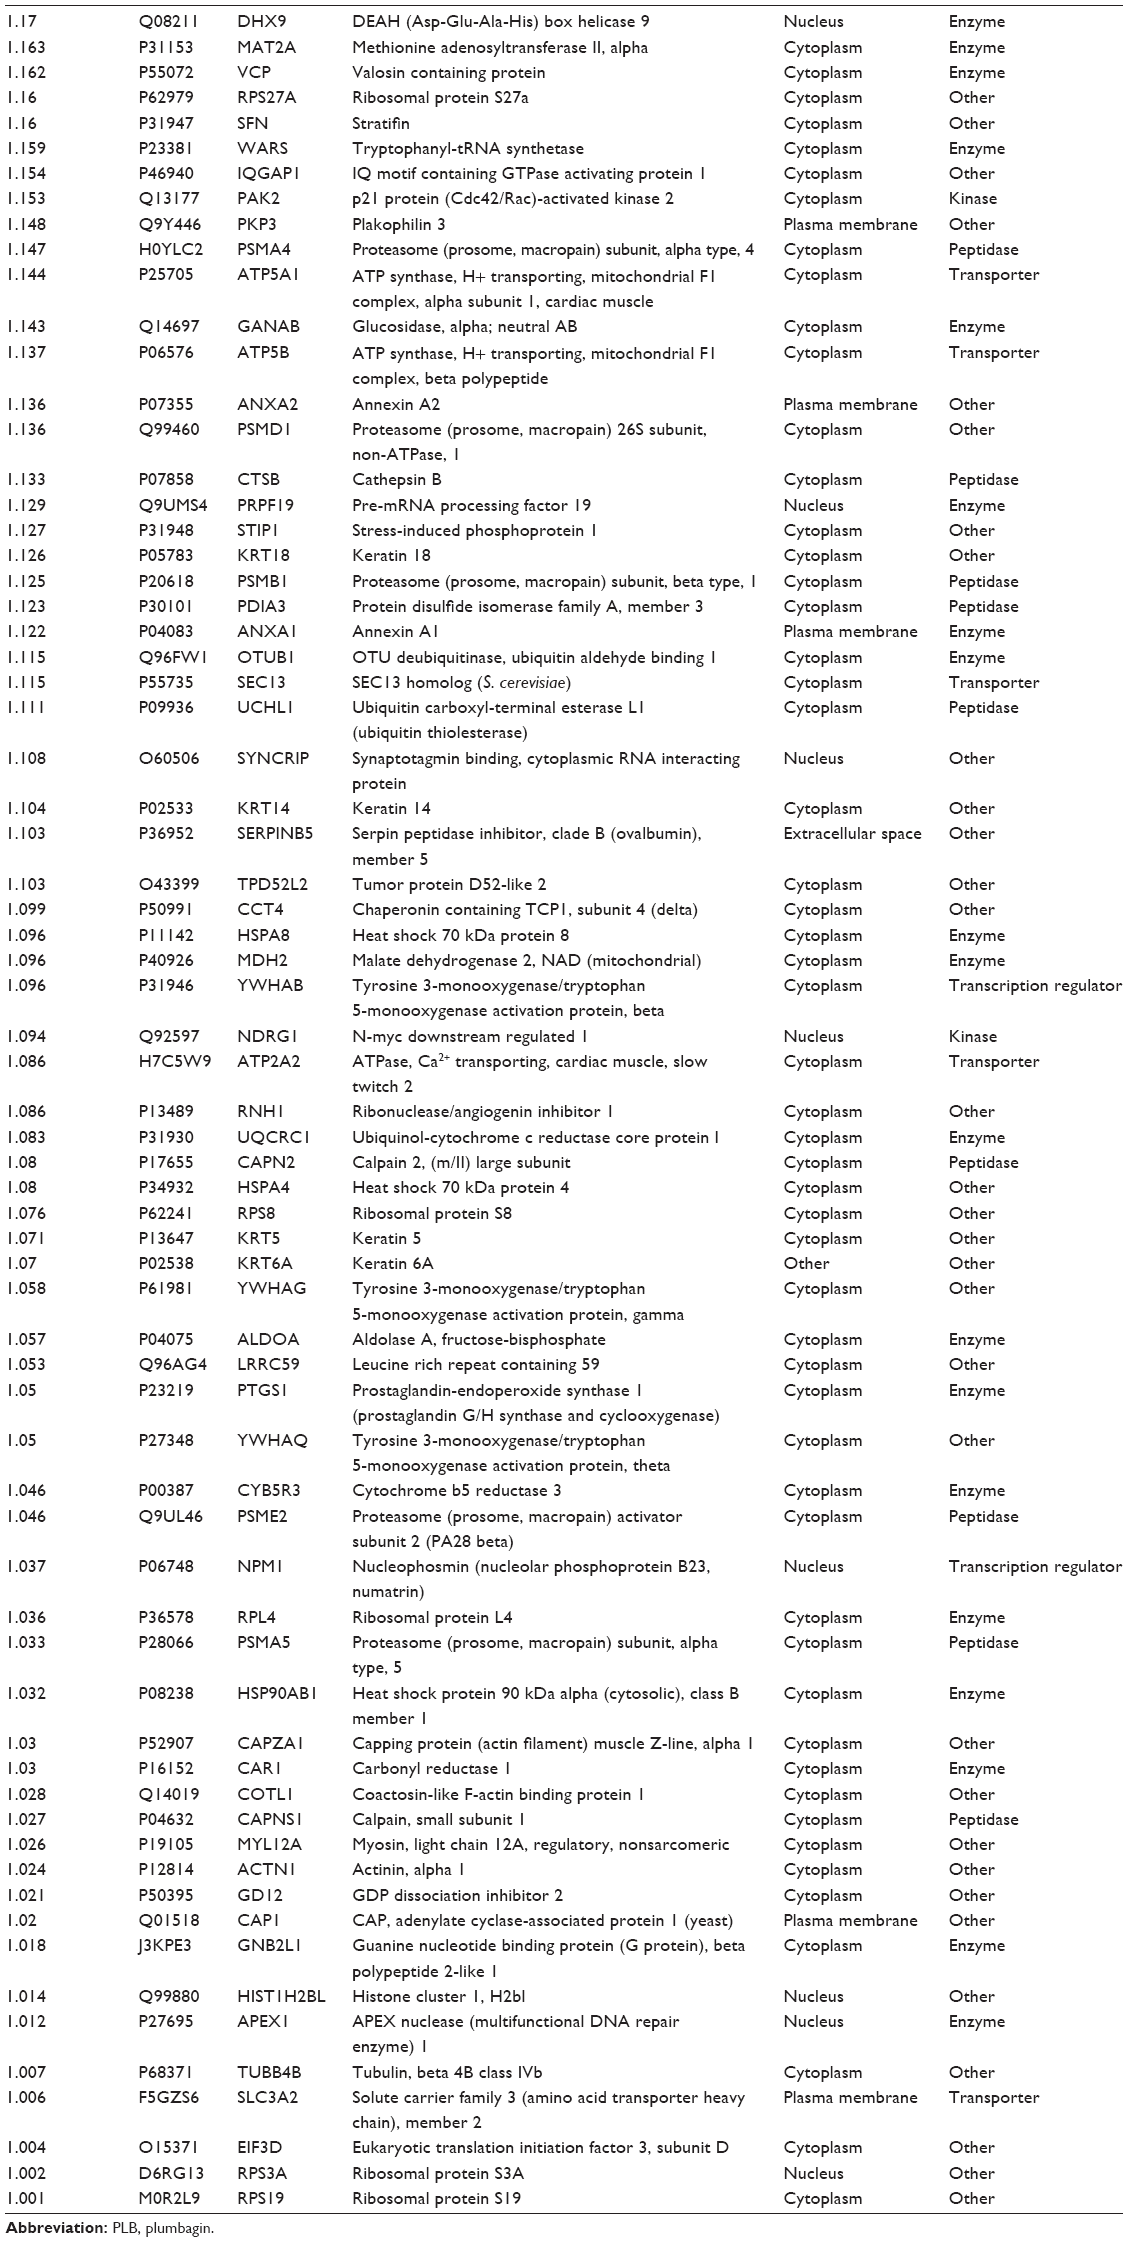
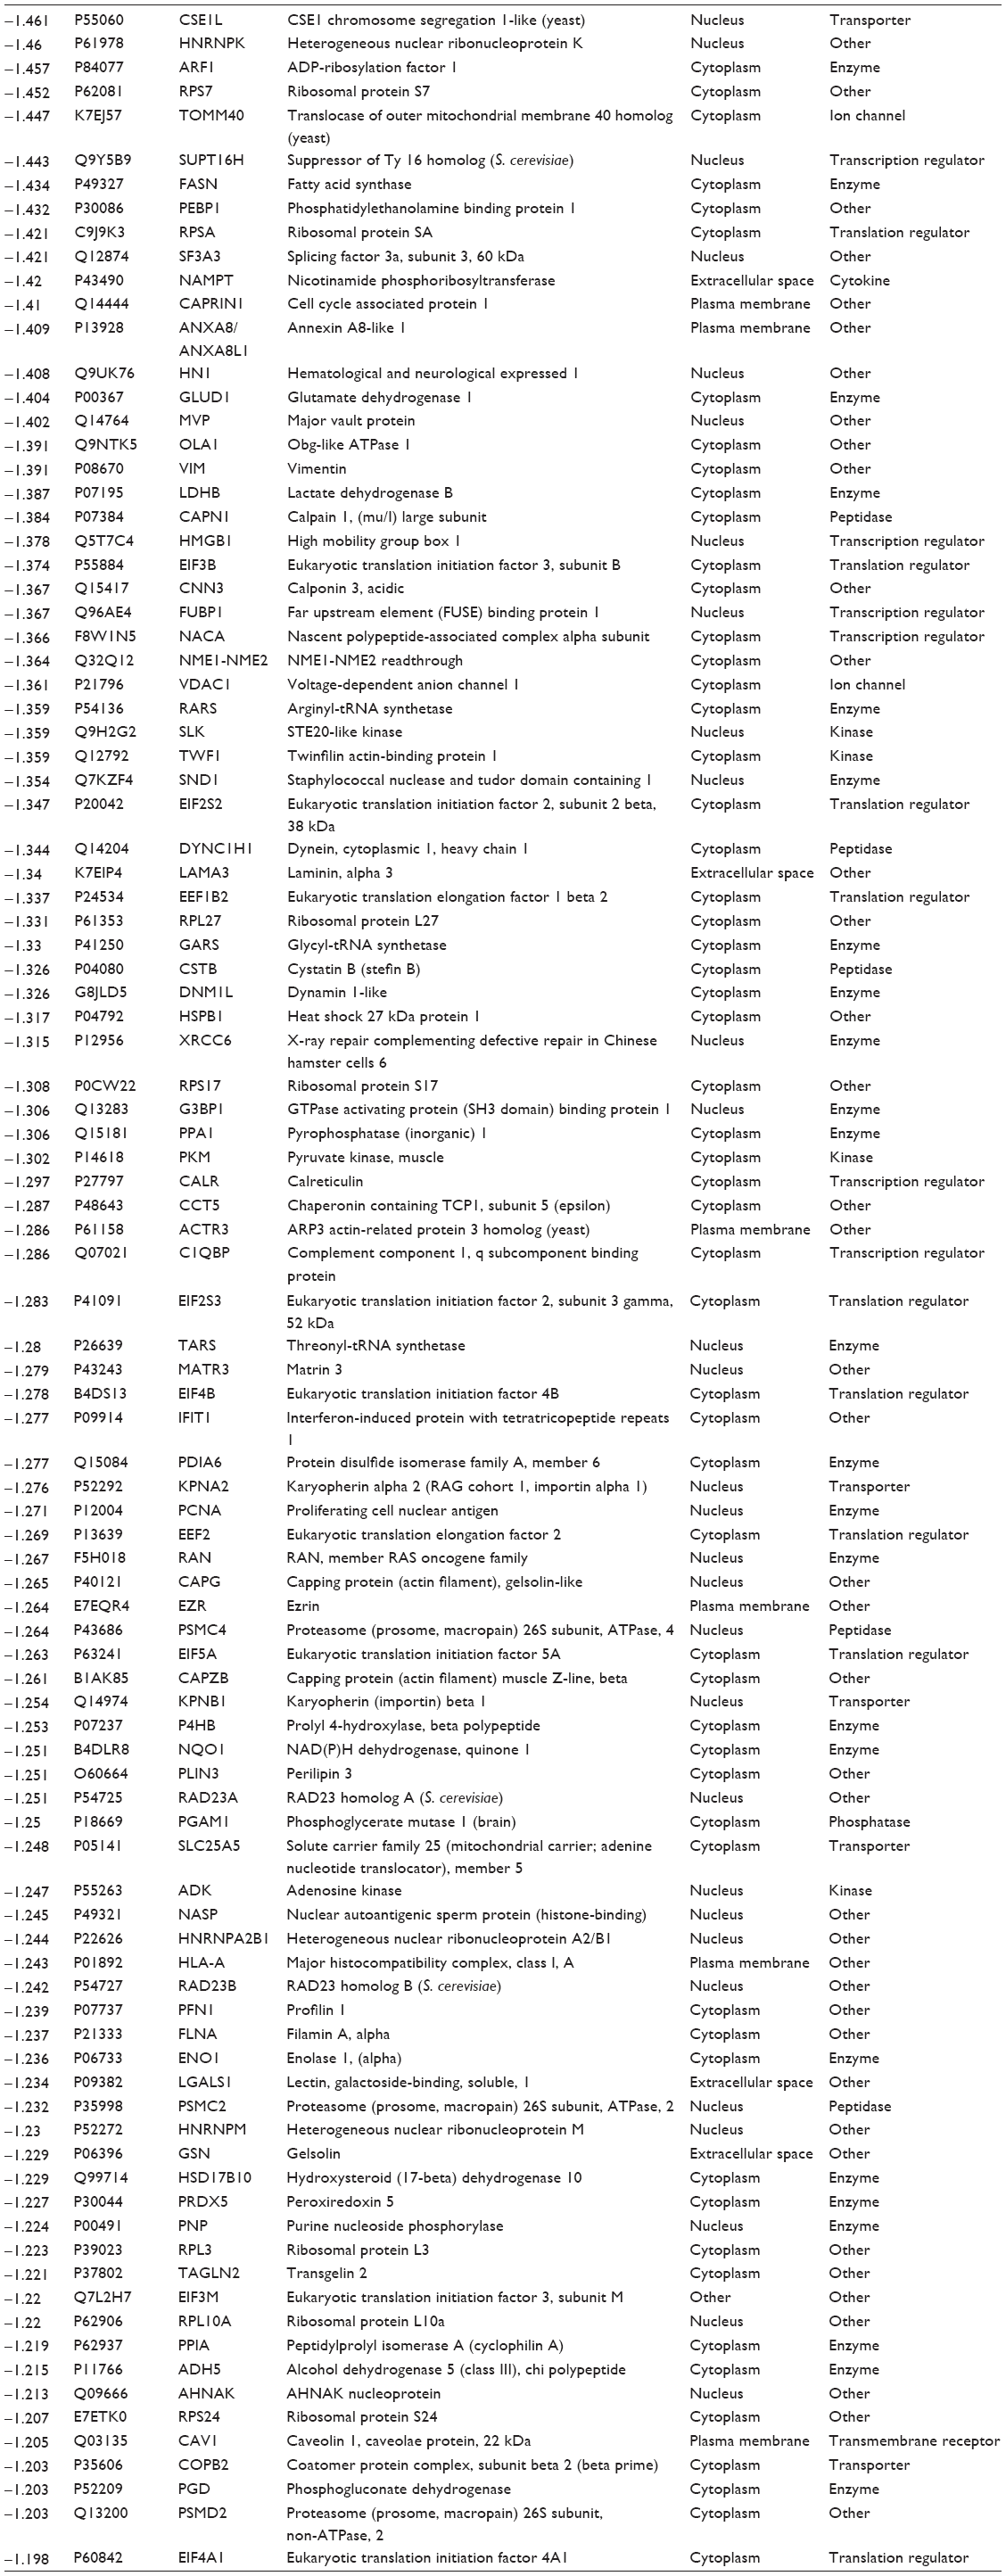
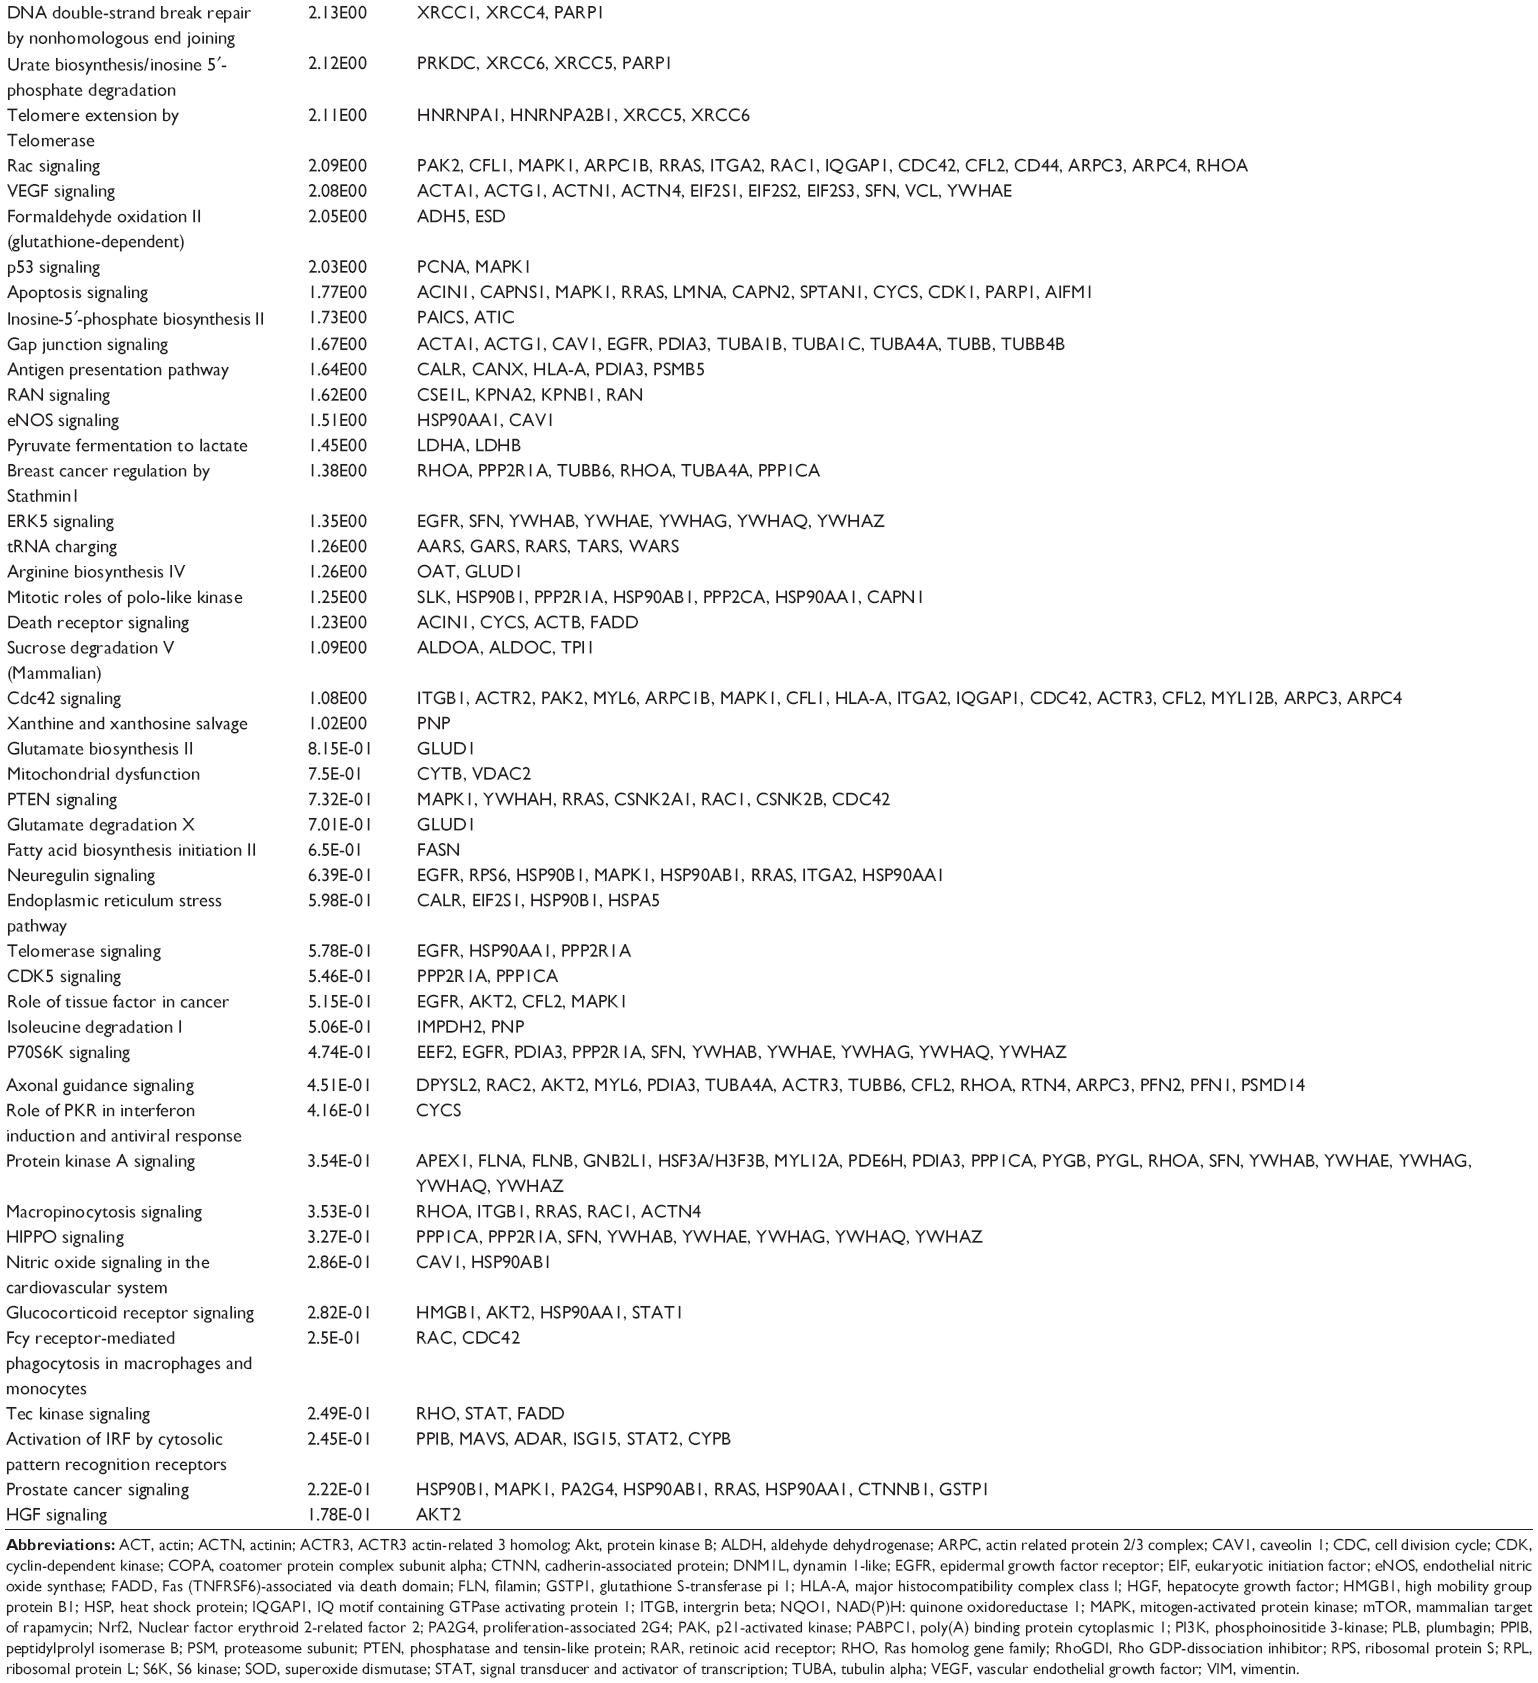
We first performed SILAC-based proteomics to evaluate the potential molecular targets of PLB in SCC25 cells. PLB increased the expression level of 143 protein molecules, but decreased the expression level of 255 protein molecules in SCC25 cells (Tables 1 and 2). Subsequently, these proteins were subject to IPA. The results showed that 101 signaling pathways were potentially regulated by PLB in SCC25 cells (Table 3 and Figure 1). The top ten targeted signaling pathways were EIF2 signaling pathway, regulation of eIF4 and p70S6K signaling, remodeling of epithelial adherens junctions pathway, mTOR signaling pathway, protein ubiquitination pathway, Nrf2-mediated oxidative stress response signaling pathway, epithelial adherens junction signaling pathway, caveolar-mediated endocytosis signaling pathway, RhoA signaling pathway, and oxidative phosphorylation pathway (Table 3). Notably, a number of molecules were involved in cell survival, cell proliferation, redox homeostasis, cell metabolism, cell migration, and cell death, such as p53, CDK1/cdc2, FADD, Nrf2, MAPK, mTOR, p70S6K, E-cadherin, and vimentin.
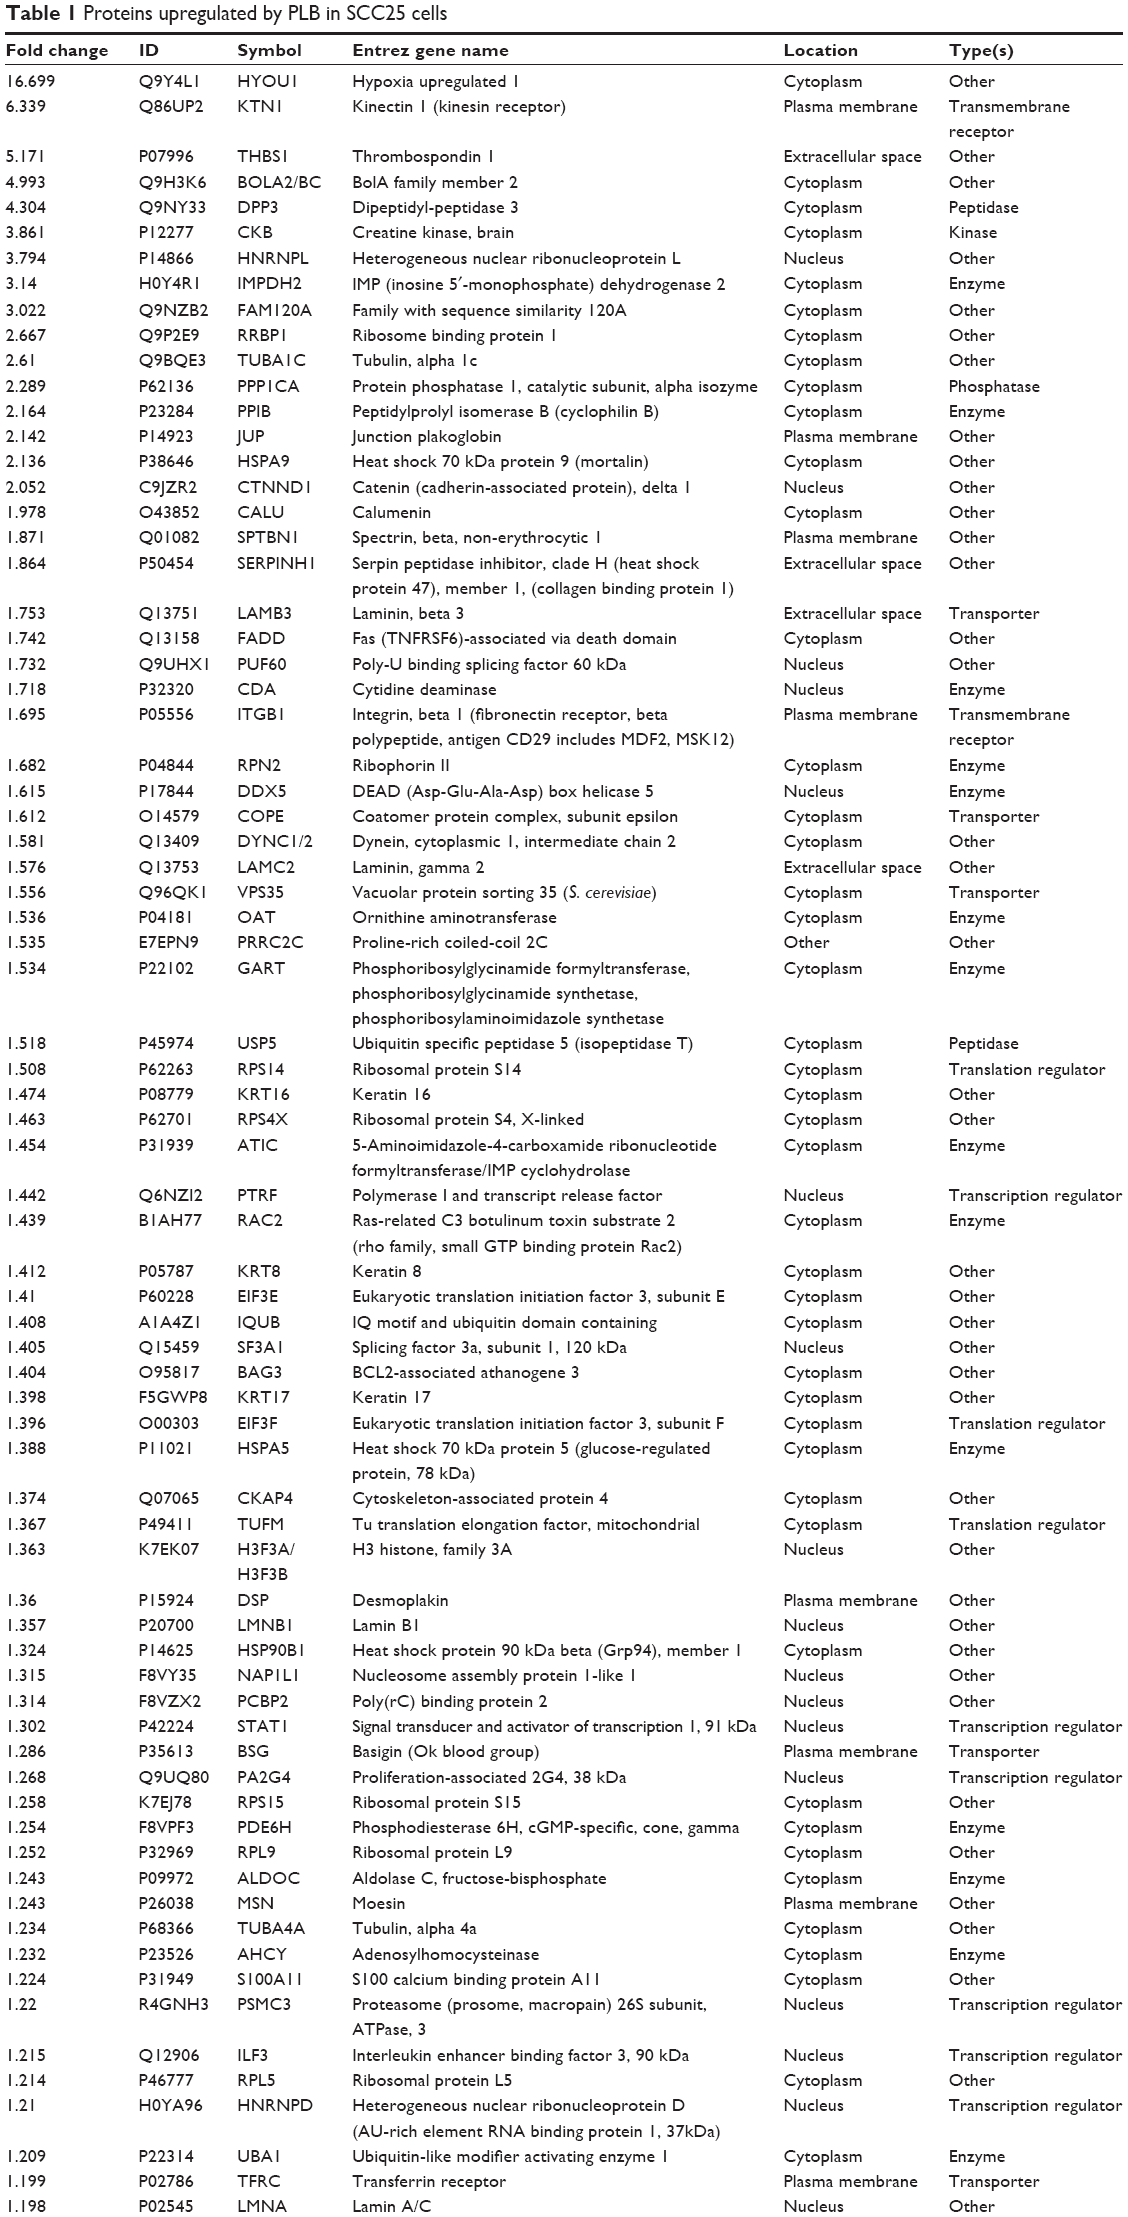  | Table 1 Proteins upregulated by PLB in SCC25 cells |
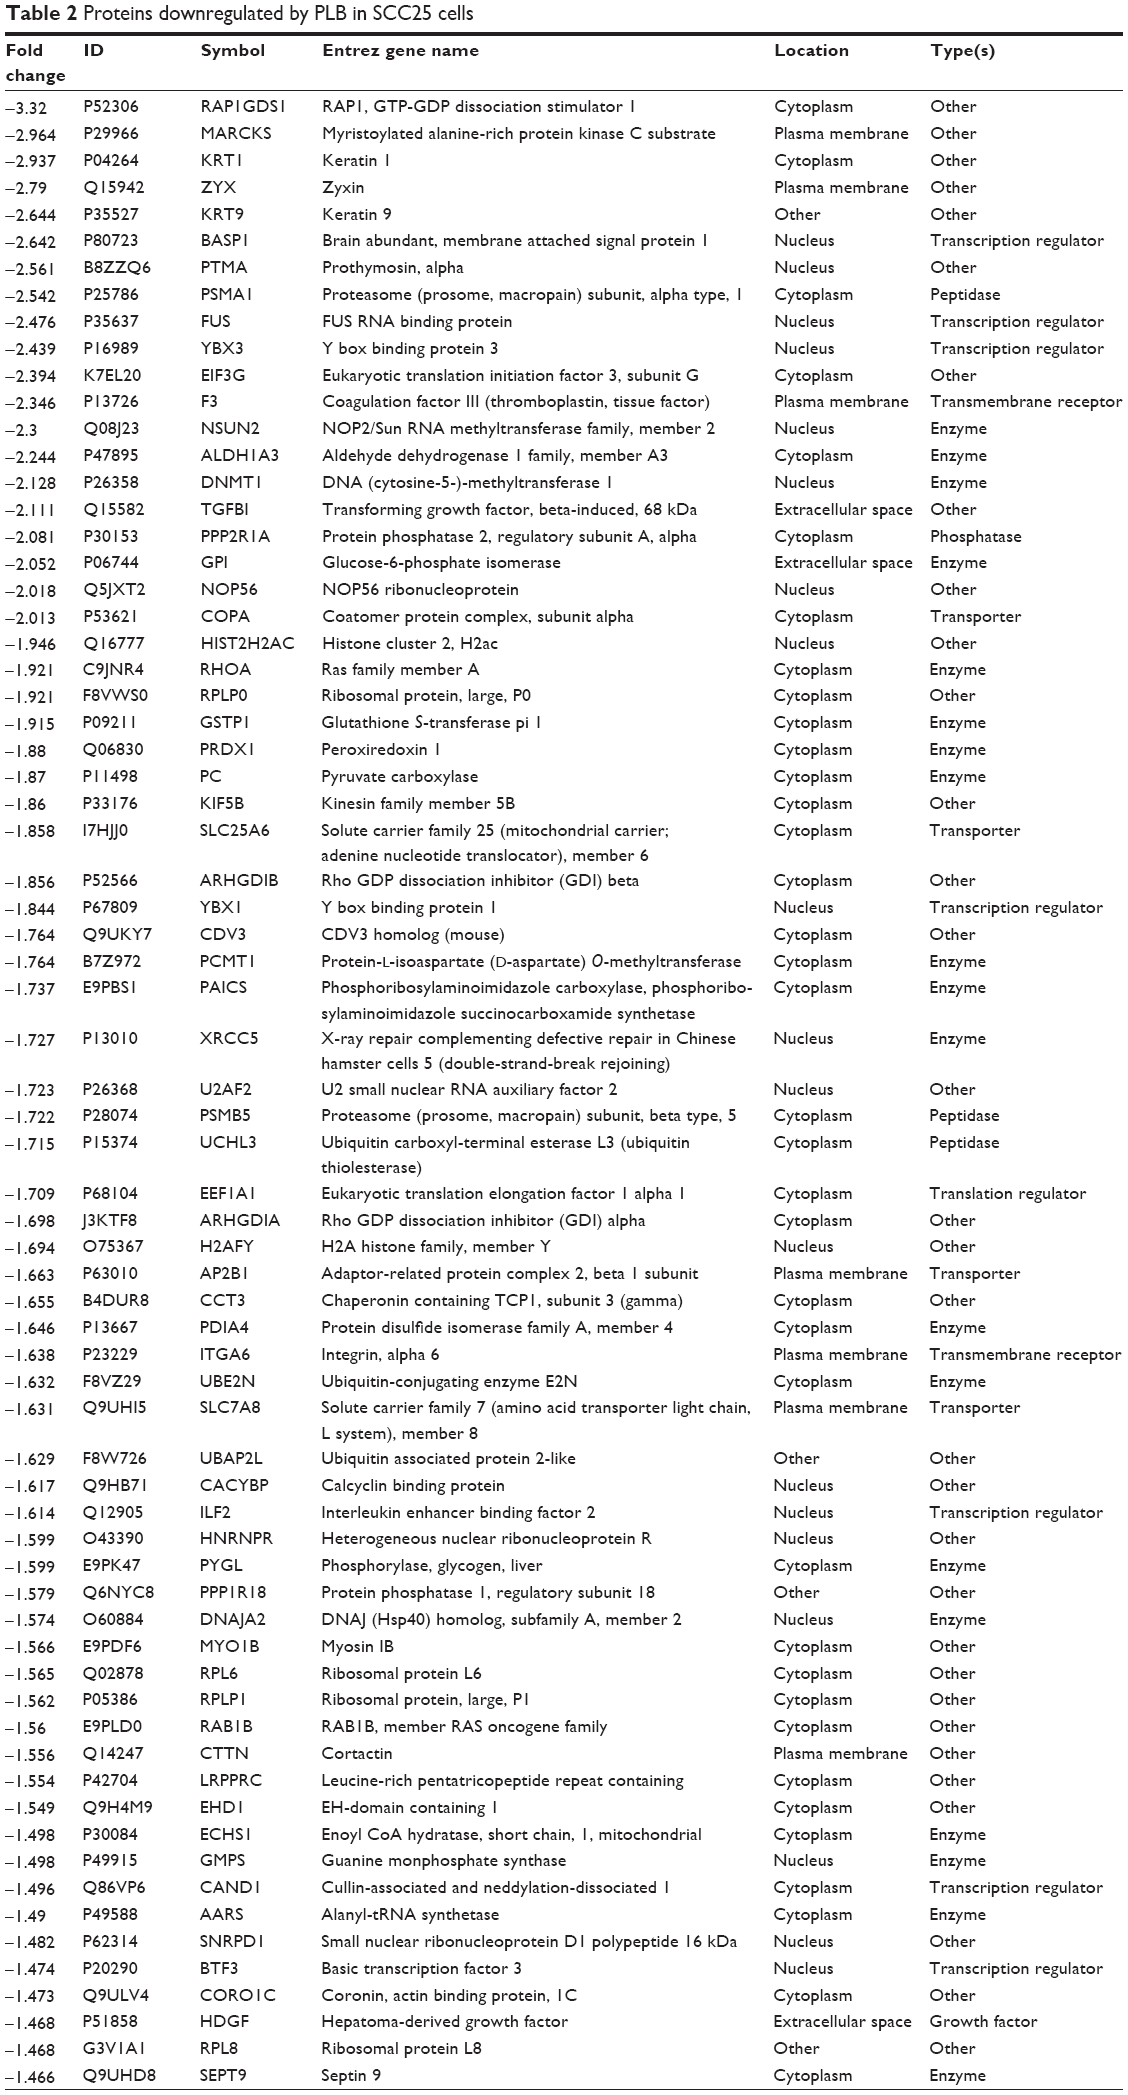  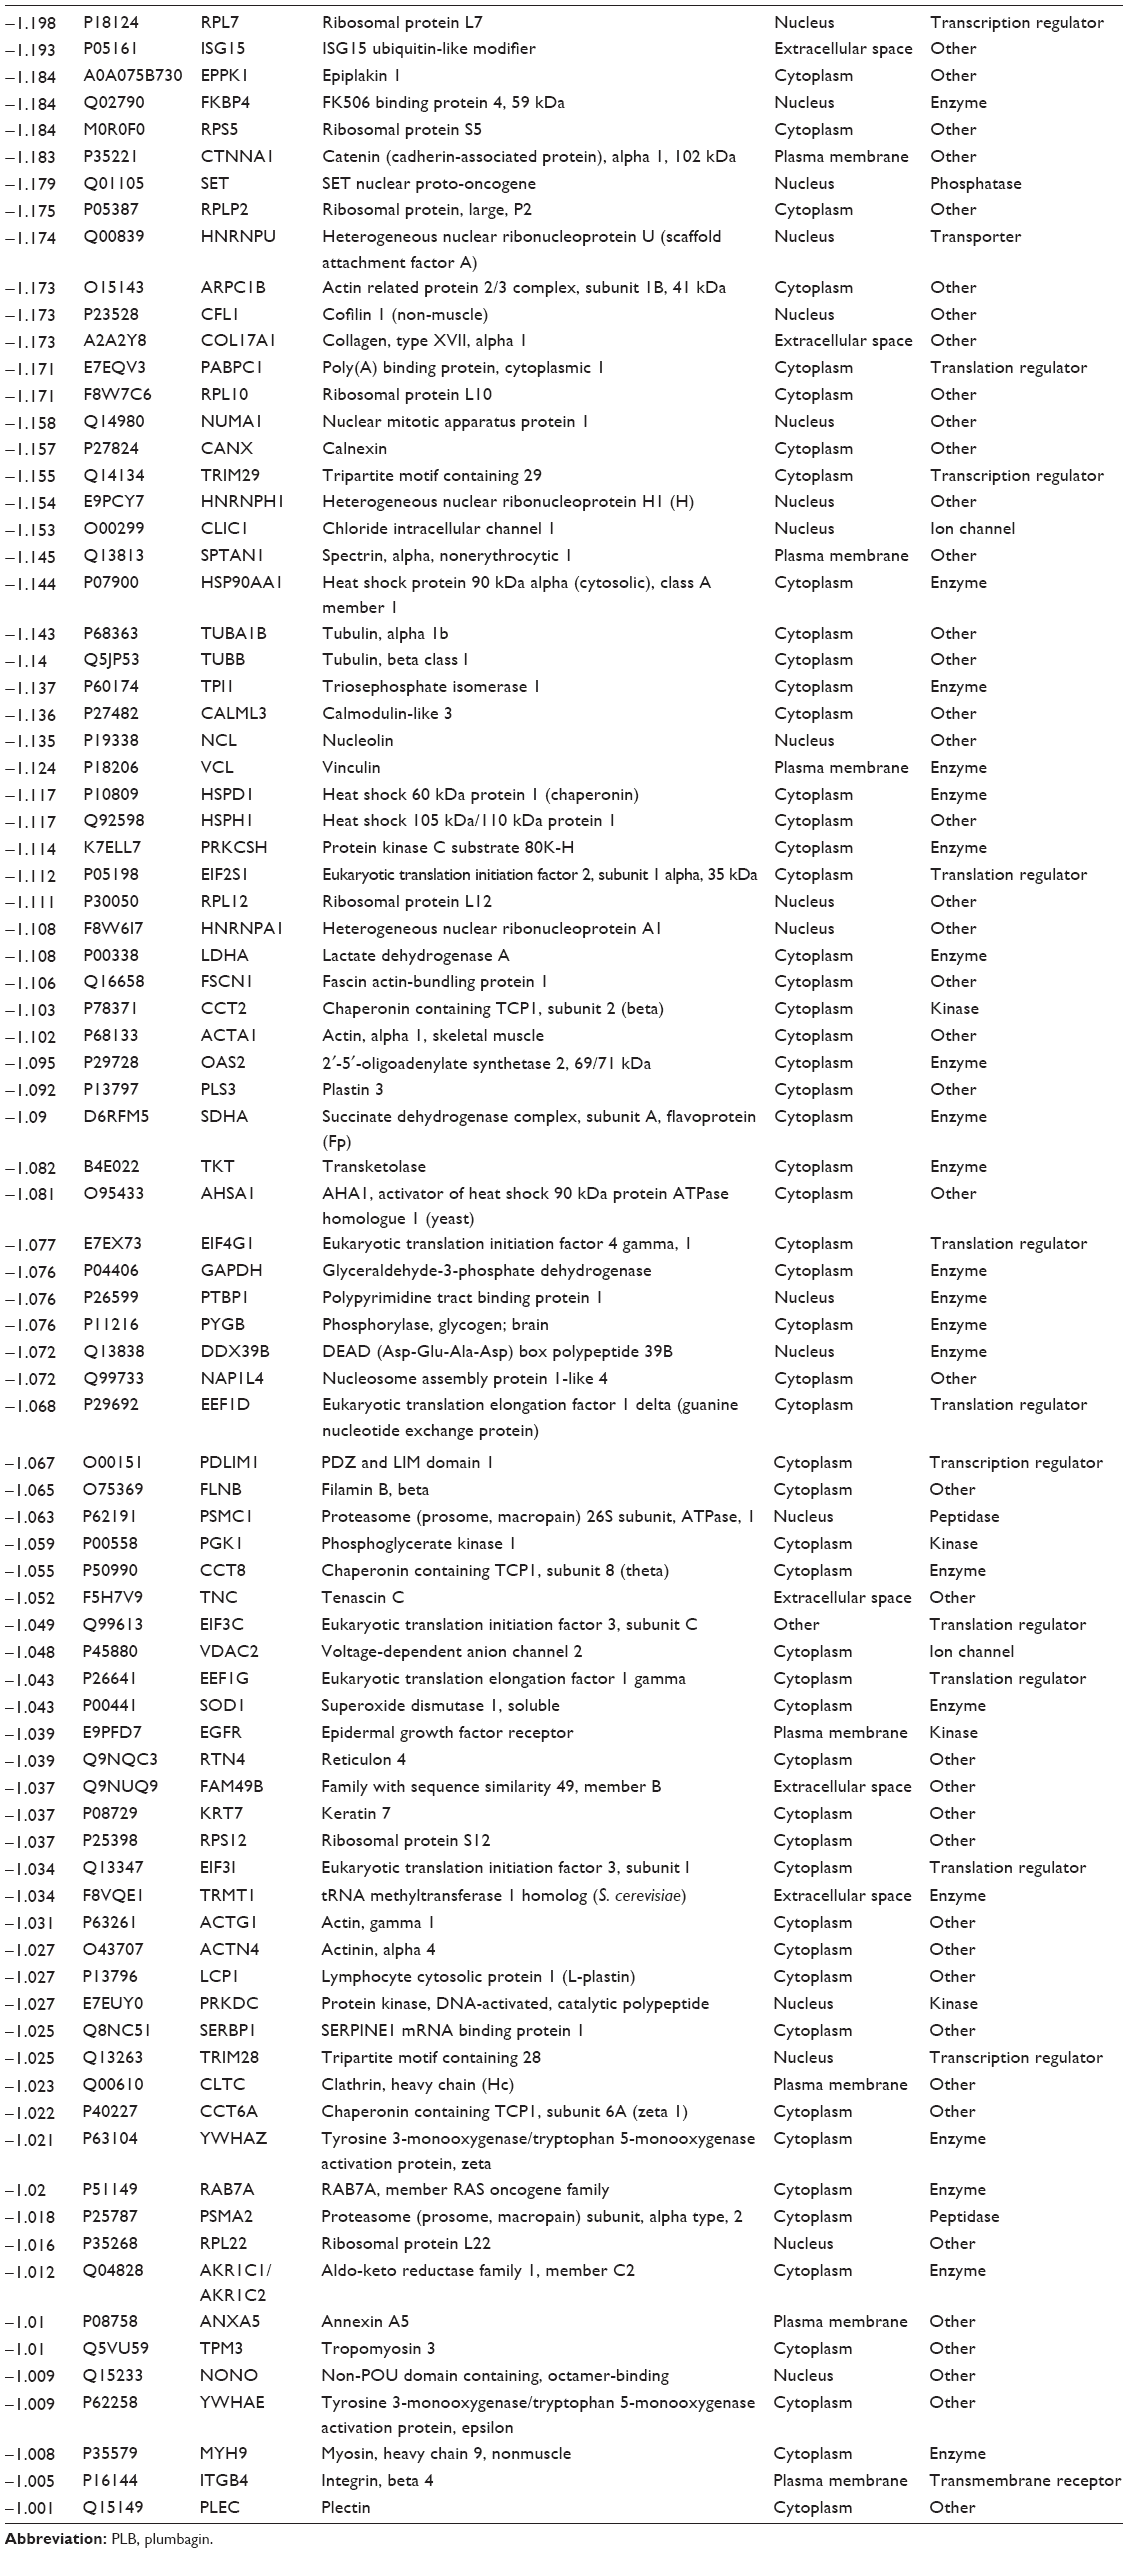 | Table 2 Proteins downregulated by PLB in SCC25 cells |
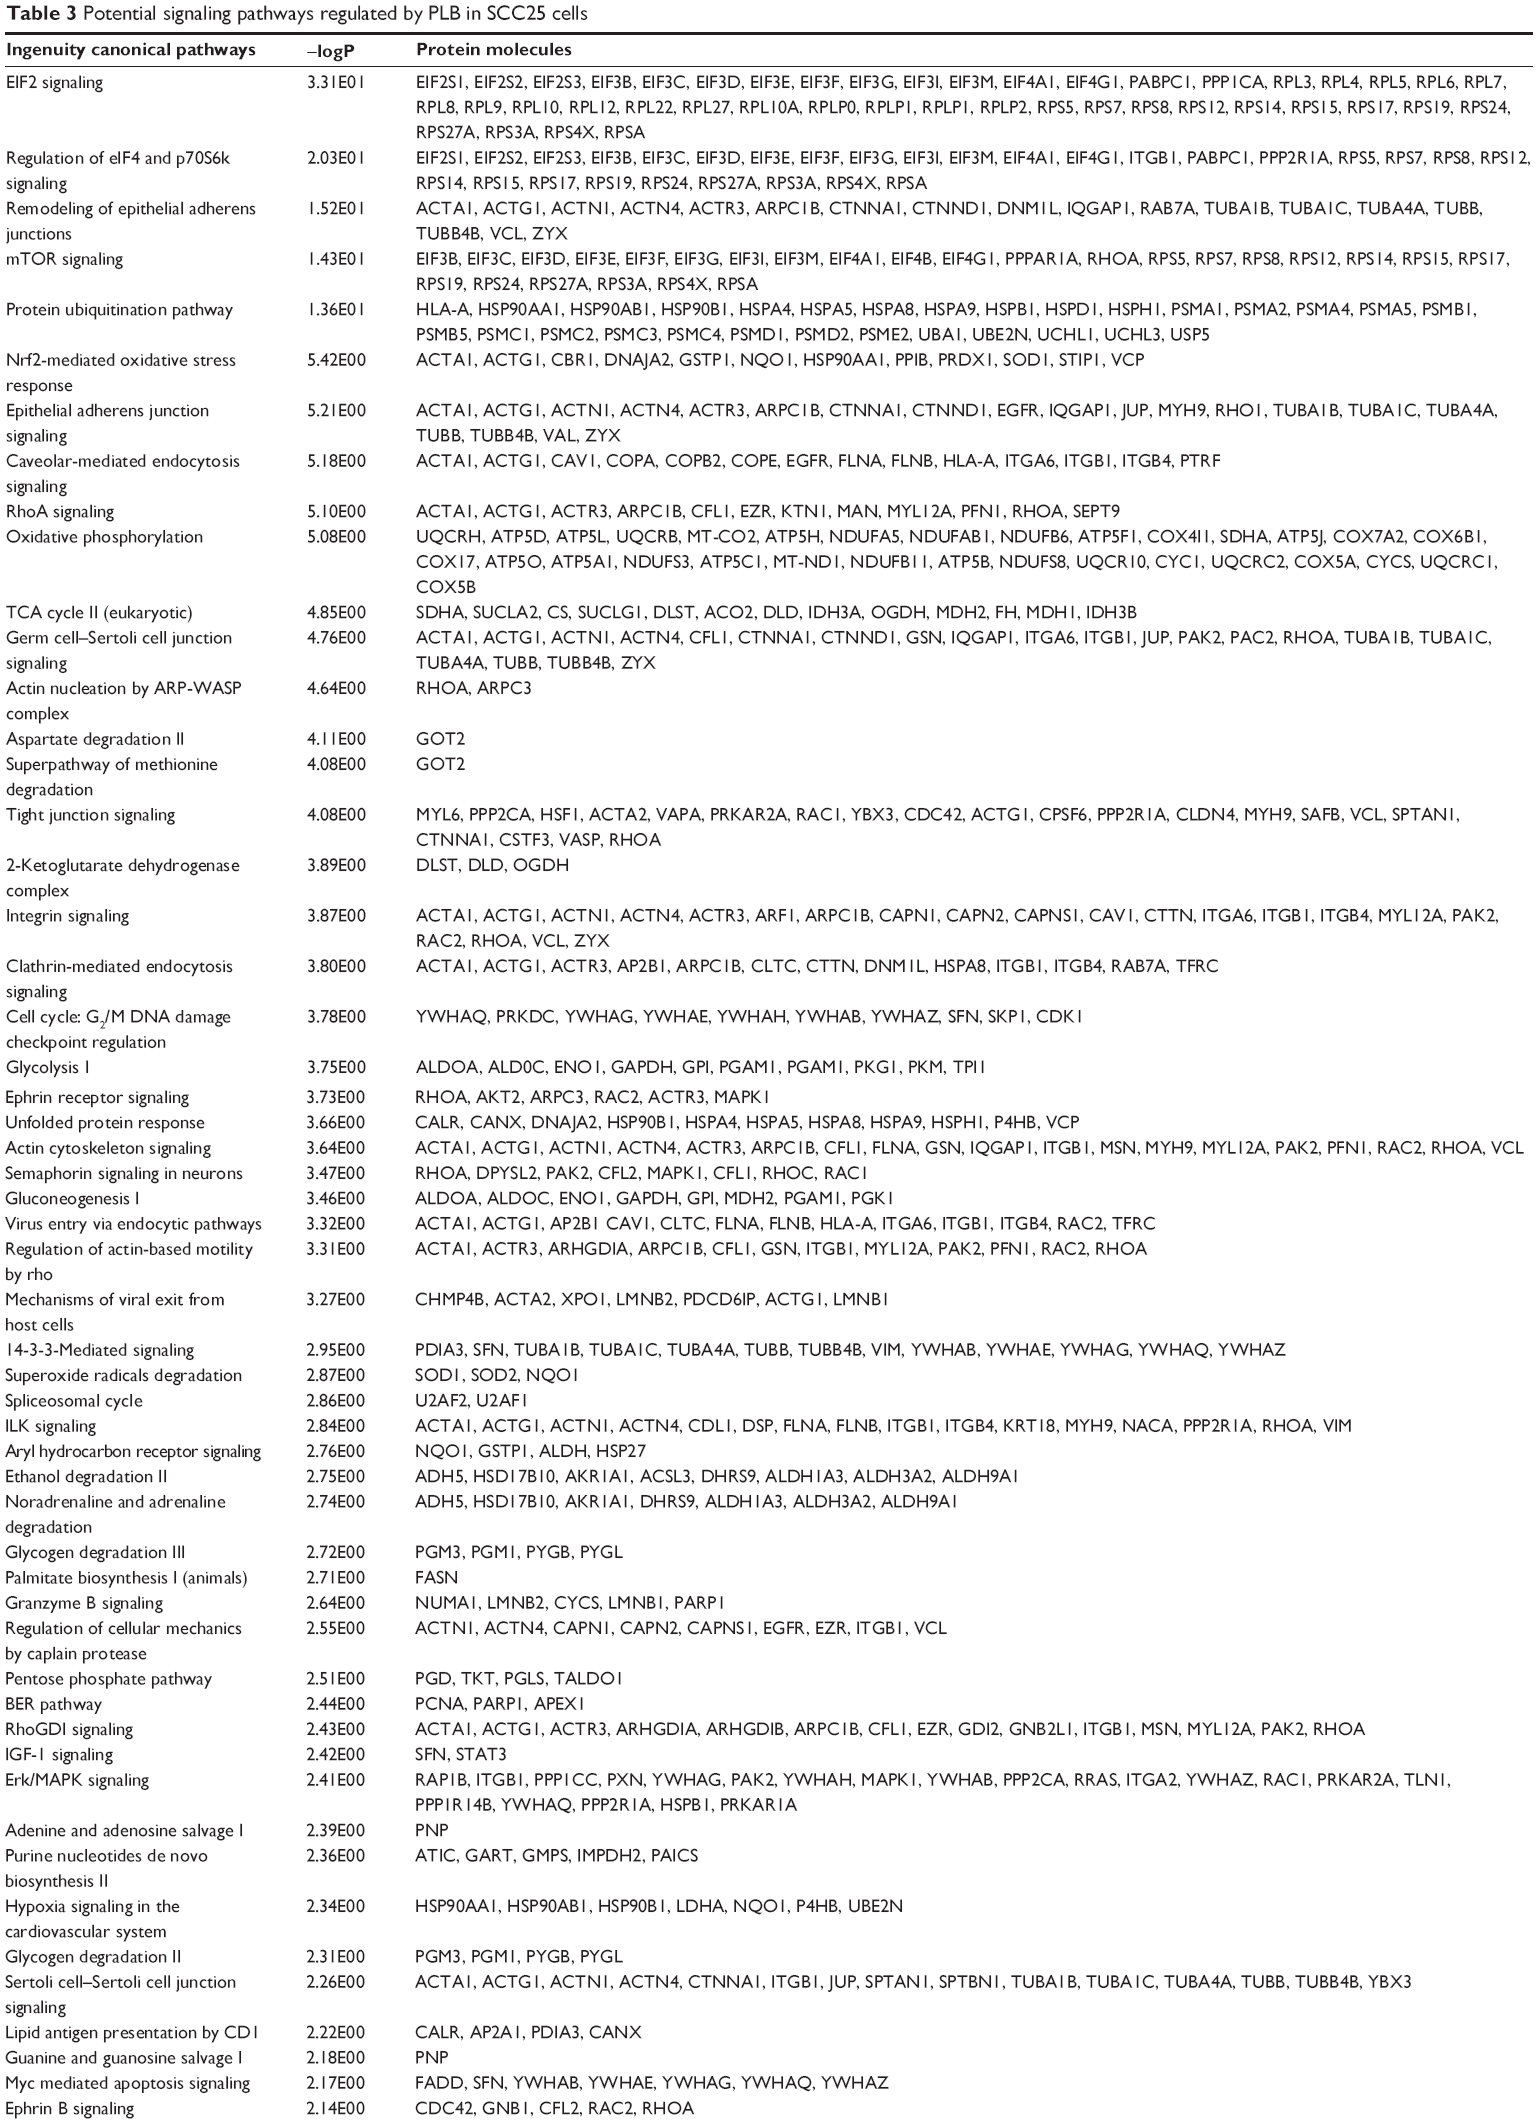  | Table 3 Potential signaling pathways regulated by PLB in SCC25 cells |
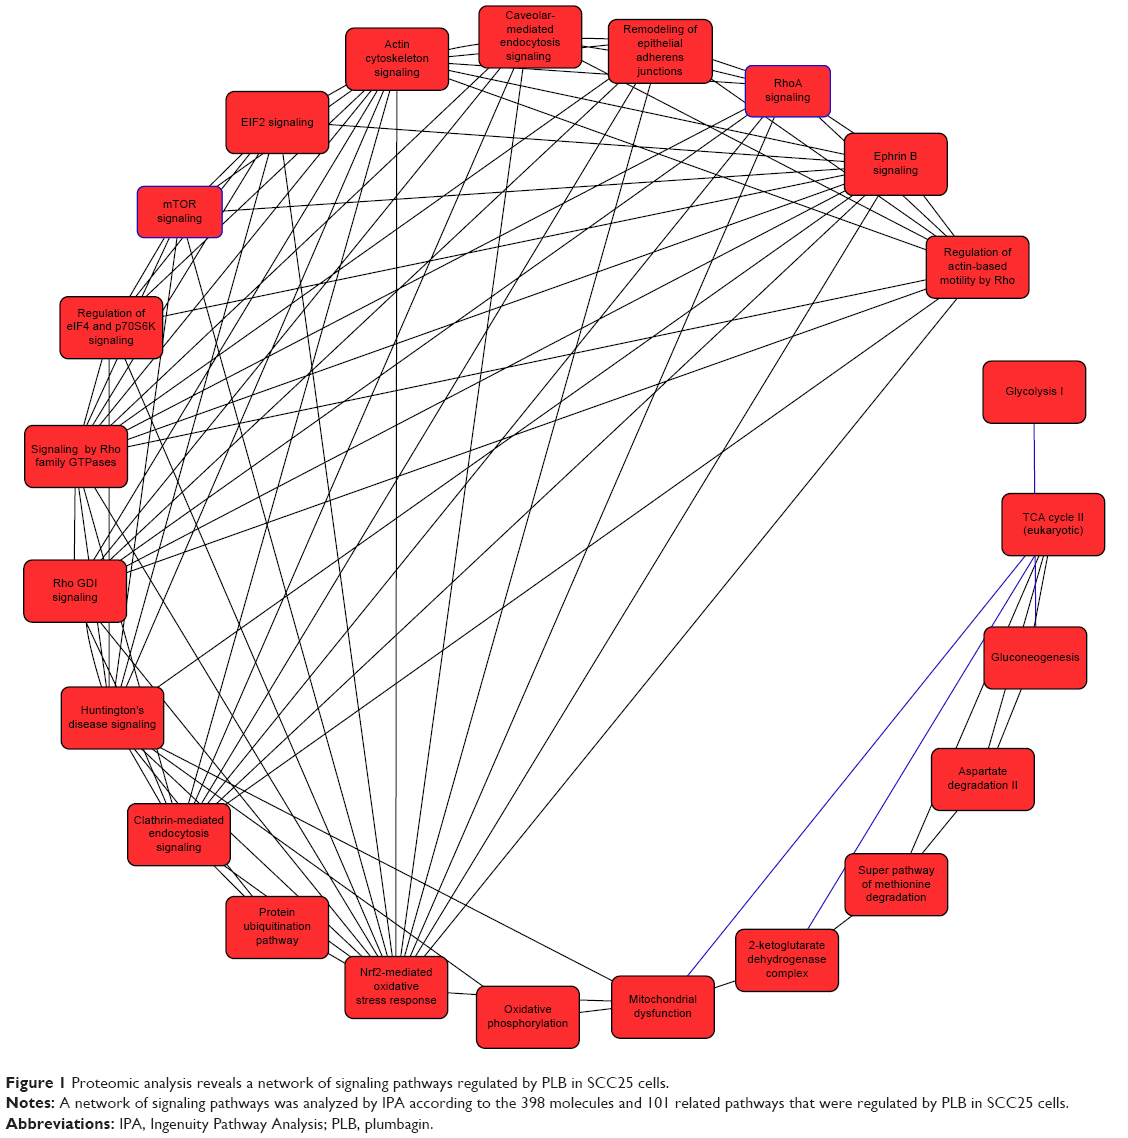 | Figure 1 Proteomic analysis reveals a network of signaling pathways regulated by PLB in SCC25 cells. |
PLB regulates cell cycle regulators of SCC25 cells
The cell cycle arresting effect of PLB is considered as a critical contributor to its anticancer activities. We treated SCC25 cells with 5 μM PLB for 24 hours, and then, cell samples were subject to quantitative proteomic analysis. The results showed that PLB regulated cell cycle at G2/M DNA damage checkpoint in SCC25 cells with the involvement of multiple functional proteins (Table 3). These included YWHAQ, PRKDC, YWHAG, YWHAE, YWHAH, YWHAB, YWHAZ, SFN, SKP1, and CDK1 at G2/M checkpoint (Figure 2).
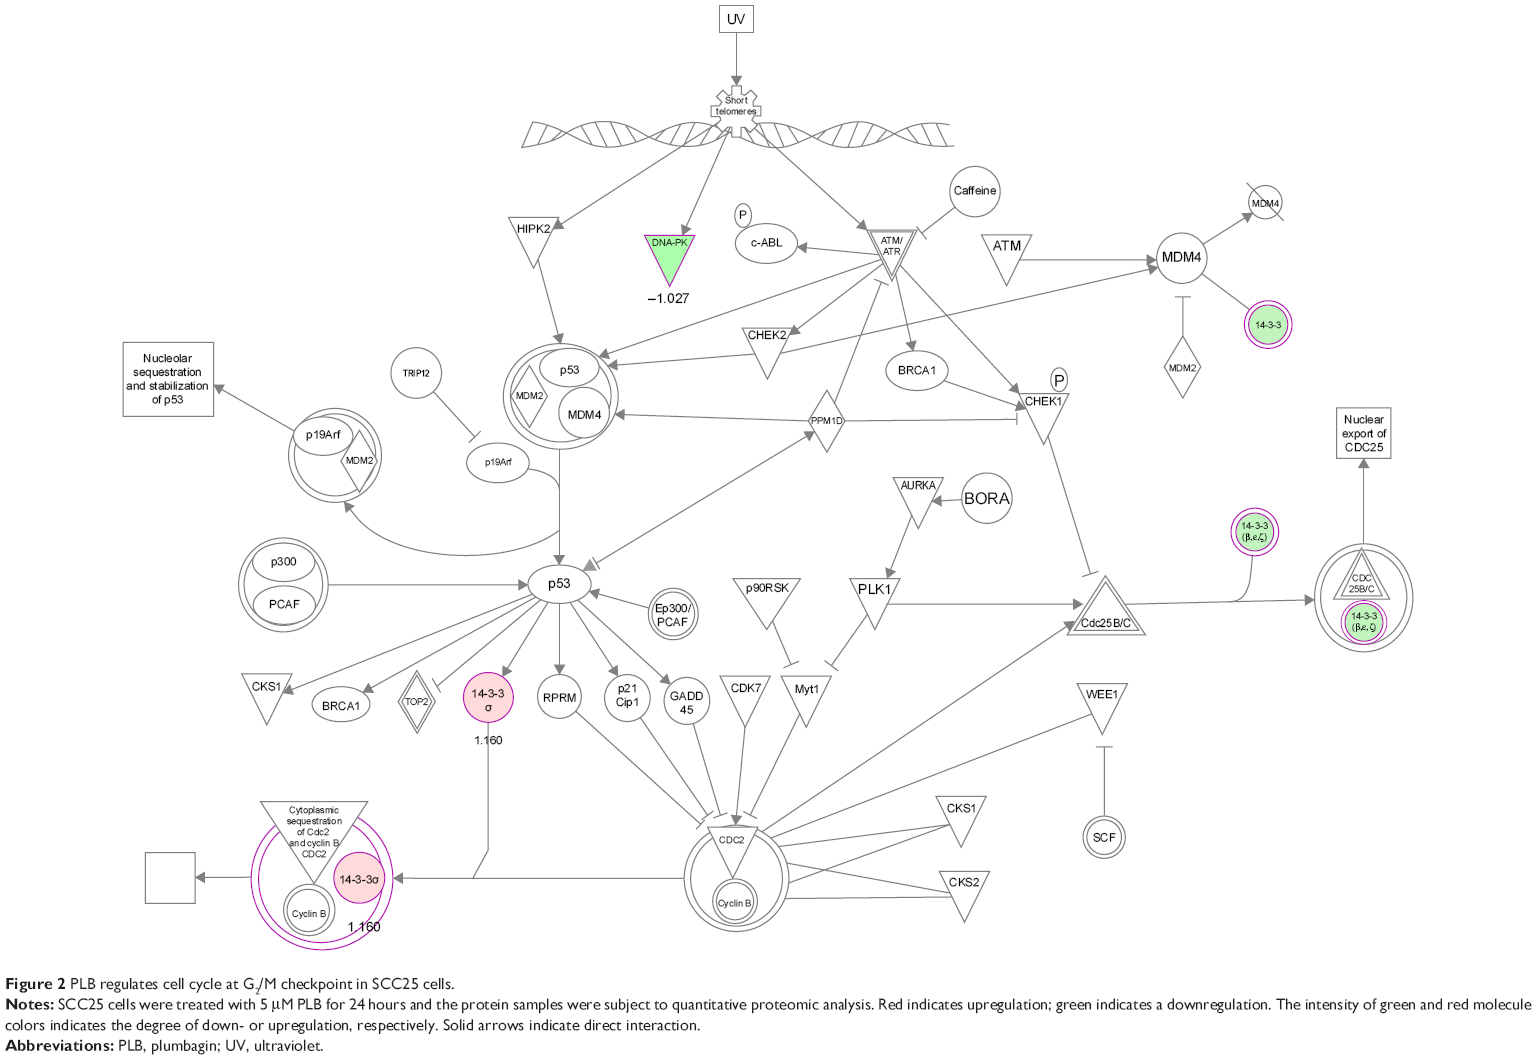 | Figure 2 PLB regulates cell cycle at G2/M checkpoint in SCC25 cells. |
PLB regulates apoptosis in SCC25 cells
Apoptosis is the type I programmed cell death pathway and has been considered as a promising target for the treatment of cancer either via intrinsic (mitochondrial-mediated) or extrinsic (death receptor-mediated) apoptosis pathways. As listed in Table 3, PLB regulated apoptotic signaling pathway and death receptor signaling pathway involving a number of functional proteins. These included ACIN1, CAPNS1, MAPK1, RRAS, LMNA, CAPN2, SPTAN1, CYCS, CDK1, PARP1, AIFM1, FADD, and ACTB. Moreover, the IPA results showed that mTOR signaling pathway played a central role in the regulation of cell metabolism, growth, proliferation, and survival through the integration of both intracellular and extracellular signals (Table 3). We subsequently investigated extrinsic apoptosis mediated by FADD in SCC25 cells with the treatment of PLB.
PLB regulates EMT pathways in SCC25 cells
EMT has a close association with cell migration, invasion, and stemness. Suppressing the progress of EMT is thought to be clinically helpful for cancer therapy. We analyzed the effect of PLB on EMT-related proteins and signaling pathways using SILAC-based proteomic approach. The proteomic data showed that PLB regulated epithelial adherens junction signaling pathway in SCC25 cells involving a number of functional proteins, including ACTA1, ACTG1, ACTN1, ACTN4, ACTR3, ARPC1B, CTNNA1, CTNND1, DNM1L, EGFR, IQGAP1, JUP, MYH9, RAB7A, RHO1, TUBA1B, TUBA1C, TUBA4A, TUBB, TUBB4B, VAL, VCL, and ZYX.
PLB regulates redox homeostasis involving Nrf2-mediated signaling pathways in SCC25 cells
Induction of ROS generation plays a critical role in the cytokine production, contributing to the cancer cell killing effect of PLB. However, the regulatory effect of PLB on ROS generation-related molecules and signaling pathways has not been fully understood. In this study, we observed that PLB regulated several critical signaling pathways related to ROS generation and redox homeostasis in SCC25 cells. Our quantitative proteomic study showed that PLB treatment regulated Nrf2-mediated oxidative stress response and oxidative phosphorylation in SCC25 cells (Table 2). A number of functional proteins were found to be involved in these pathways, including ACTA1, ACTG1, CBR, DNAJA2, GSTP1, NQO1, HSP90AA1, PPIB, SOD1, STIP1, and VCP (Table 2). Of note, Nrf2-mediated signaling pathways have critical roles in the maintenance of intracellular redox homeostasis in response to various stimuli via regulating antioxidant responsive elements. The quantitative proteomic data suggest that modulation of the expression of functional proteins involved in Nrf2-mediated signaling pathways may contribute to the anticancer effect of PLB in the treatment of TSCC. The results showed that PLB can efficiently induce ROS generation and that this can be abolished by NAC and GSH. Hence, we subsequently studied the relationship of ROS-generation-inducing effect of PLB with other cellular biological functions, including cell cycle arrest, cell apoptosis, and EMT.
Verification of molecular targets of PLB in SCC25 cells by Western blotting assay
Our aforementioned quantitative proteomic studies have predicted and shown that PLB can modulate a number of signaling pathways and functional proteins related to cell proliferation, cell migration, cell death, and cell survival. On the basis of our previous experimental and present proteomic data in SCC25 cells, we further examined the effect of PLB with a focus on cell cycle, apoptosis, EMT, and redox homeostasis and its related signaling pathways to delineate the underlying mechanisms.
PLB induces G2/M arrest in SCC25 cells via downregulation of cyclin B1, CDK1/cdc2, and cdc25
First, we examined the effect of PLB on cell cycle distribution of SCC25 cells using a flow cytometer. PLB markedly induced a G2/M phase arrest (P<0.05, 0.01, or 0.001; Figure 3). Compared with the control cells (2.4%), the percentage of SCC25 cells in G2/M phase was increased in a concentration-dependent manner after PLB treatment (Figure 3A and B). The percentage of cells in G2/M phase was 5.8%, 9.1%, and 13.1% when treated with PLB at 0.1, 1, and 5 μM, respectively. On the other hand, PLB significantly decreased the percentage of SCC25 cells in G1 phase when treated with 5 μM in comparison to the control cells (P<0.001; Figure 3B). In a separate experiment, the effect of 5 μM PLB on cell cycle distribution was examined in SCC25 cells over 48 hours (Figure 3C and D). Compared to the control cells, the percentage of SCC25 cells in the G2/M phase was increased from 2.7% at basal level to 8.1%, 9.4%, and 11.1% after 6-, 24-, and 48-hour treatment with 5 μM PLB, respectively (P<0.001; Figure 3D), whereas 5 μM PLB treatment decreased the percentage of SCC25 cells in G1 phase from 48.8% at basal level to 41.3% after 48 hours of treatment (P<0.05; Figure 3D).
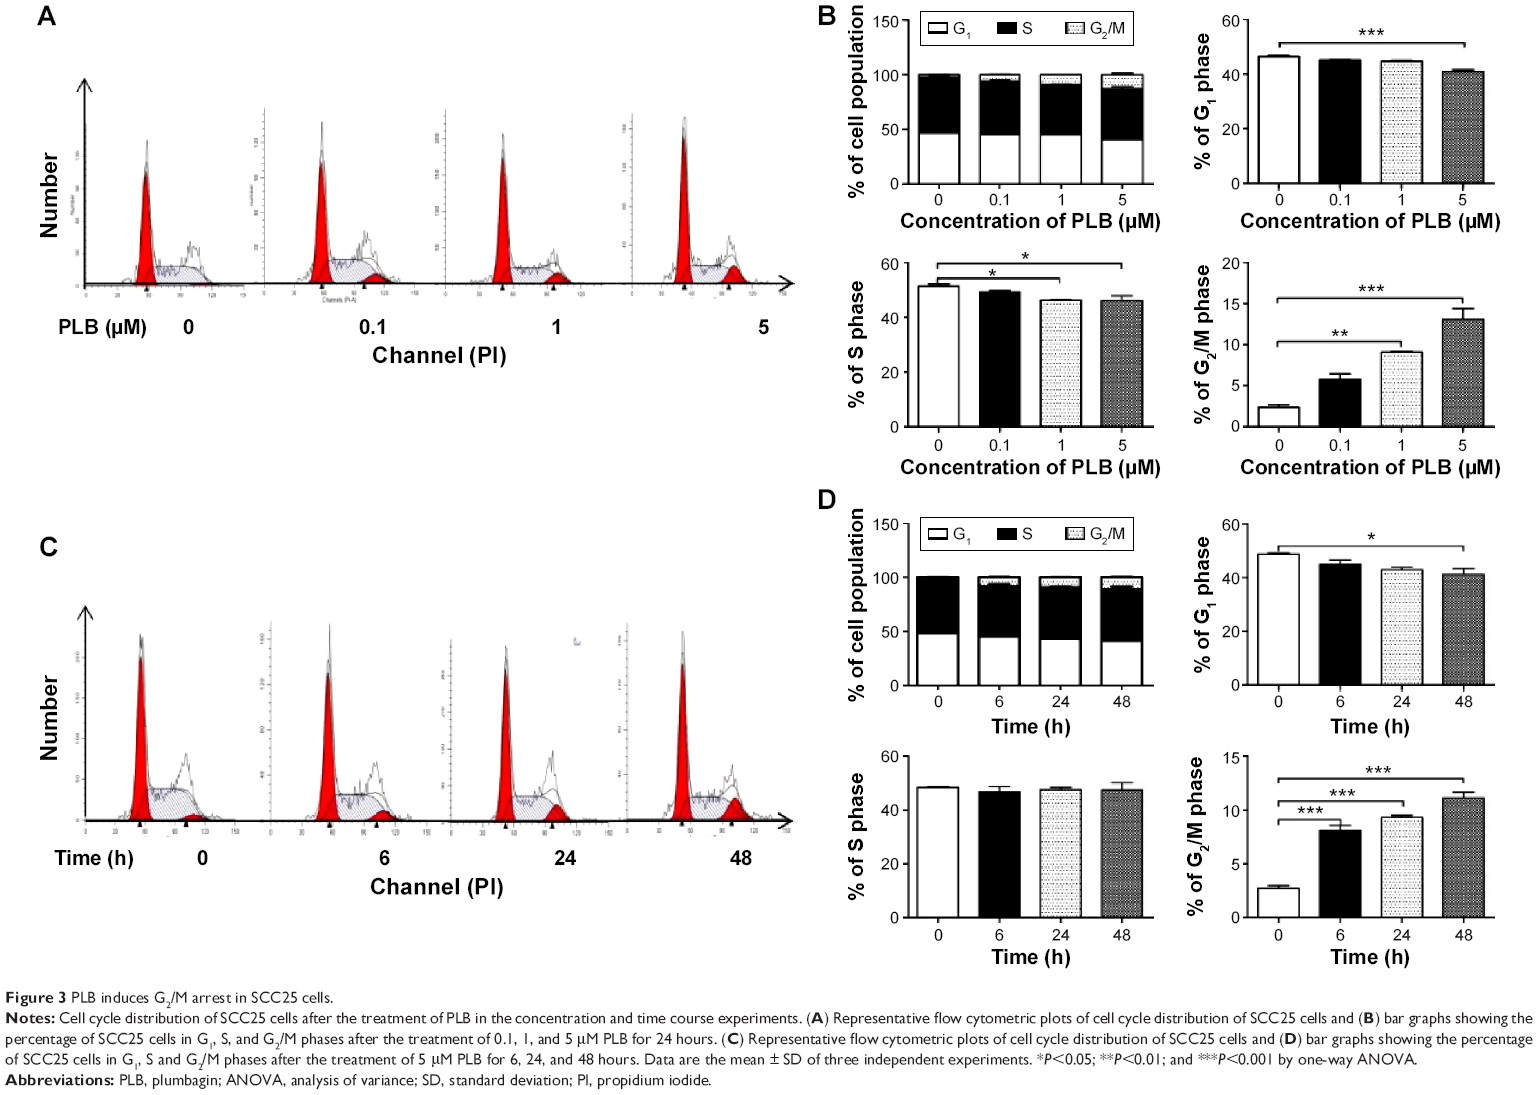 | Figure 3 PLB induces G2/M arrest in SCC25 cells. |
To explore the mechanisms for PLB-induced cell cycle arrest in SCC25 cells, the expression level of key regulators responsible for G2/M checkpoint was examined using Western blotting assay. CDK1/cdc2, cyclin B1, and cdc25 are important regulators for G2 to M phase transition and thus their expression level was determined in SCC25 cells. The expression level of cdc2 was marked suppressed in SCC25 cells after treatment with PLB at concentrations of 0.1, 1, and 5 μM for 24 hours (P<0.001; Figure 4A and C). Compared with the control cells, the expression level of cyclin B1 was decreased by 18.3%, 46.0%, and 62.3% when SCC25 cells were treated with 0.1, 1, and 5 μM PLB for 24 hours, respectively (P<0.01 or 0.001; Figure 4A and C). There was a 10.7%, 14.0%, and 35.3% reduction in the expression level of cdc25 in SCC25 cells when treated with PLB at 0.1, 1, and 5 μM for 24 hours, respectively (P<0.05, 0.01, or 0.001; Figure 4A and C). Next, we conducted separate experiment over 48 hours. In comparison to the control cells, the expression level of cdc2 was decreased by 18.3% and 19.0% when SCC25 cells were treated with 5 μM PLB for 24 and 48 hours, respectively (P<0.001; Figure 4B and D); there was a 34.3% and 49.3% reduction in the expression level of cyclin B1 when SCC25 cells were incubated with 5 μM PLB for 24 and 28 hours, respectively (P<0.001; Figure 4B and D); and the expression level of cdc25 was also markedly suppressed (P<0.01 or 0.001; Figure 4B and D). These results demonstrate that PLB downregulates cyclin B1, CDK1/cdc2, and cdc25 in SCC25 cells. Importantly, these results have confirmed the regulatory effect of PLB on cell proliferation-related signaling pathways, which was predicted by our proteomic studies.
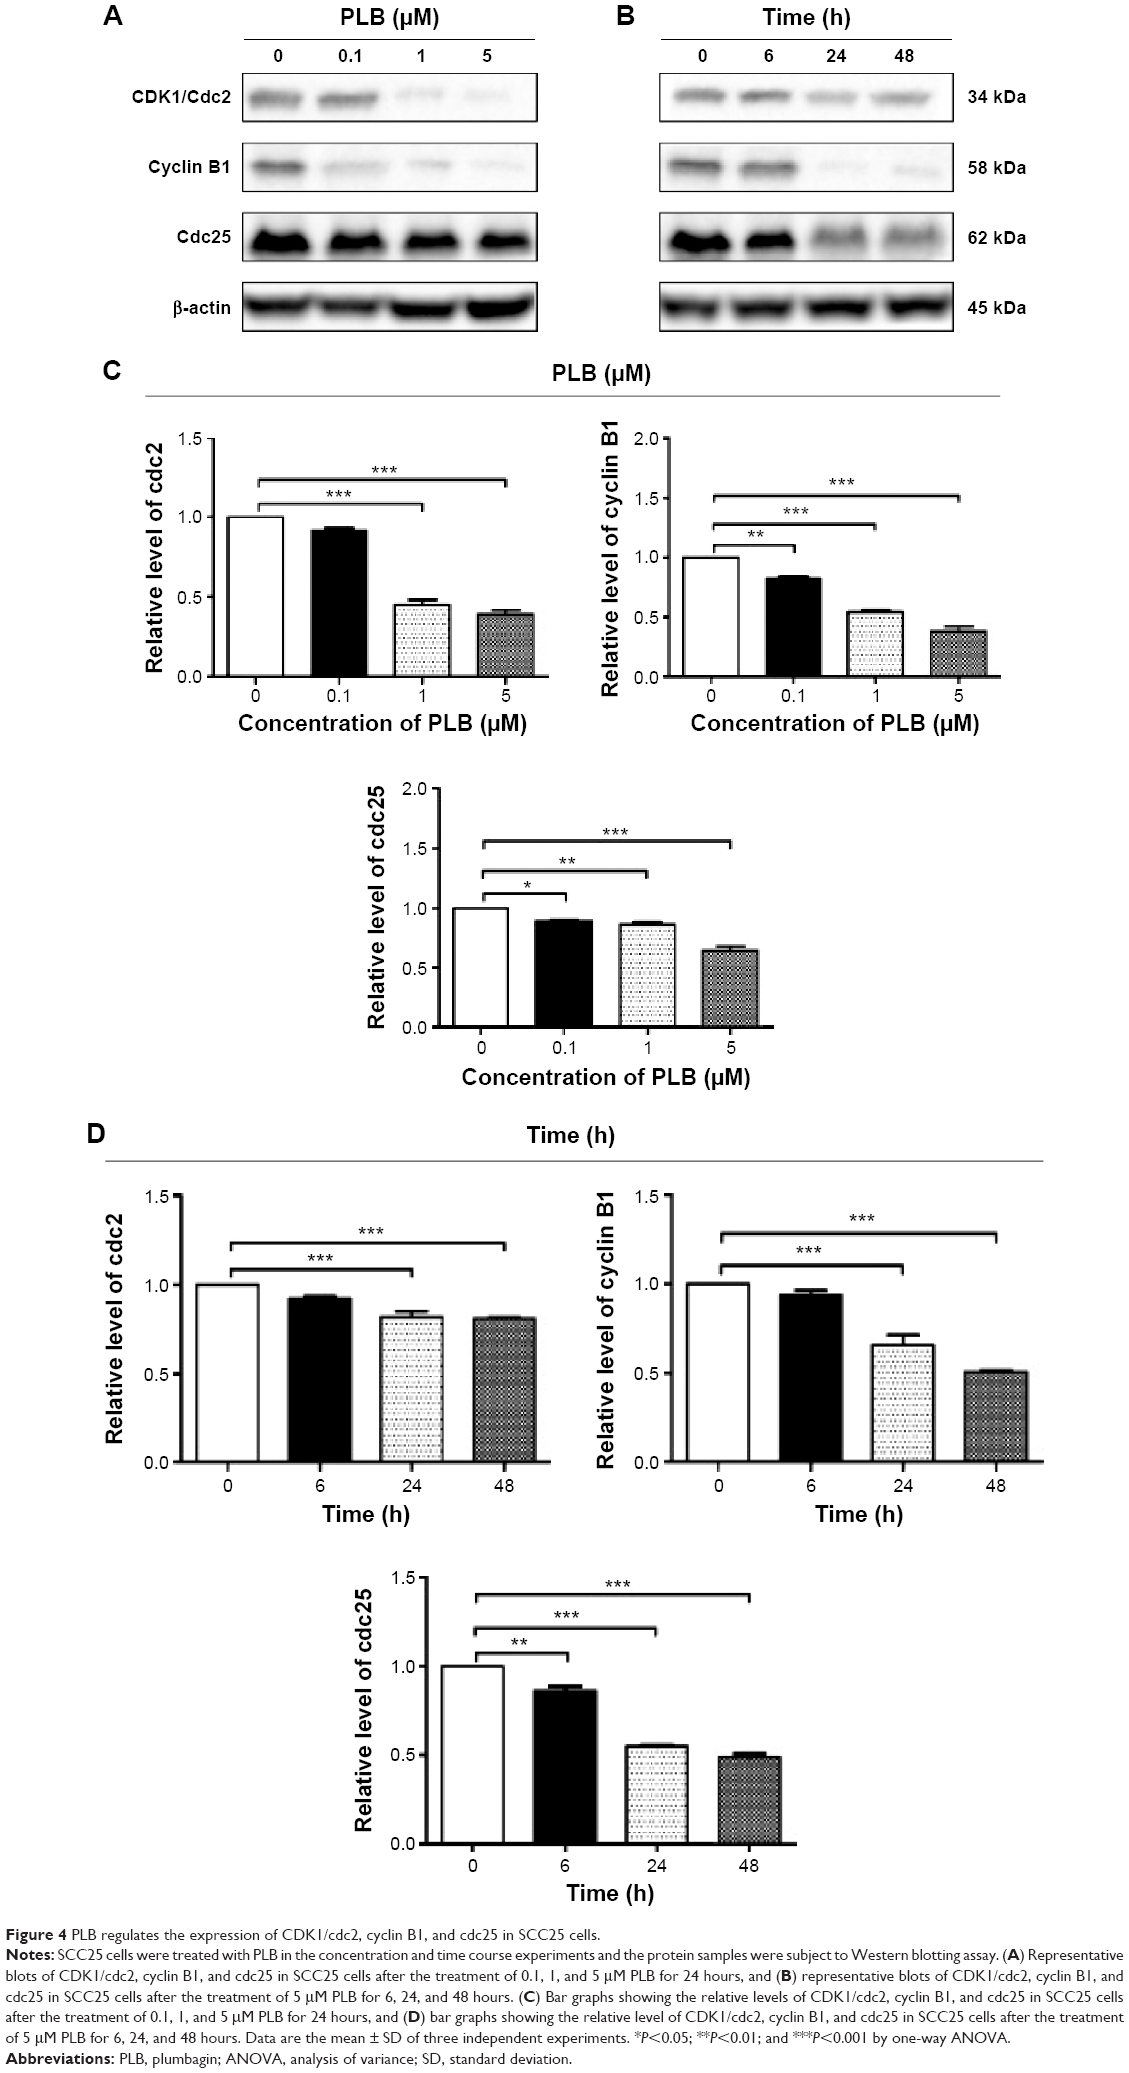 | Figure 4 PLB regulates the expression of CDK1/cdc2, cyclin B1, and cdc25 in SCC25 cells. |
PLB induces apoptosis via FADD-mediated extrinsic signaling pathway
Apoptosis is a typical type of programmed cell death that plays an important role in PLB-induced cancer cell death. Previously, we observed that PLB significantly induced intrinsic apoptosis in SCC25 cells in a concentration- and time-dependent manner.20 On the basis of the results hinted at by the proteomic results (Figure 5), we further tested the apoptosis inducing effect of PLB with a focus on FADD-mediated signaling pathway. First, we employed flow cytometry to analyze the apoptosis-inducing effect of PLB in SCC25 cells. Subsequently, the modulation effect of PLB on the expression of FADD, TRADD, DR5, and cleaved caspase 3 in SCC25 cells was measured with a consideration to fully understand the apoptosis-inducing effect of PLB via FADD-mediated extrinsic signaling pathway. Cells were treated with PLB at concentrations of 0.1, 1, and 5 μM for 24 hours. The apoptosis level was increased from 3.0% to 6.1%, 8.2%, and 20.3% when SCC25 cells were treated with 0.1, 1, and 5 μM for 24 hours, respectively (P<0.05, 0.01, or 0.001; Figure 6A and B). Next, we conducted the time course experiment, and the results showed that the apoptosis level was increased from 3.5% at basal level to 11.4%, 21.2%, and 35.7% when SCC25 cells were treated with 5 μM PLB for 6, 24, and 48 hours, respectively (P<0.001; Figure 6C and D). Furthermore, There was a 1.3- and 1.6-fold increase in the expression level of FADD after SCC25 cells were treated with 1 and 5 μM PLB for 24 hours, respectively (P<0.01 or 0.001; Figure 7A and C). The expression level of TRADD and DR5 was also increased when cells were treated with PLB (P<0.01 or 0.001; Figure 7A and C). The cleavage of caspase 3 is the determinant process in both intrinsic and extrinsic apoptosis. We found that PLB markedly increased the level of cleaved caspase 3 to 1.2- and 1.3-fold when SCC25 cells were treated with 1 and 5 μM for 24 hours, respectively (P<0.01 or 0.001; Figure 7A and C). In a separate experiment, we examined the apoptosis-inducing effect of PLB over 48 hours. The expression level of FADD was increased 1.5-, 1.5-, and 1.6-fold when SCC25 cells were treated with 5 μM for 6, 24, and 48 hours, respectively (P<0.001; Figure 7B and D). The expression level of DR5 was also markedly increased in comparison with the control cells (P<0.05 or 0.001; Figure 7B and D). Meanwhile, there was a 1.1-, 1.3-, and 1-2 fold rise in the expression level of cleaved caspase 3, when SCC25 cells were treated with 5 μM PLB for 6, 24, and 48 hours, respectively (P<0.01 or 0.001; Figure 7B and D). The expression level of TRADD was also remarkably increased when SCC25 cells were treated with 5 μM PLB for 48 hours. These results clearly show that PLB induces apoptosis by involving the FADD-mediated extrinsic pathway in SCC25 cells, and these data are in agreement with our proteomic findings.
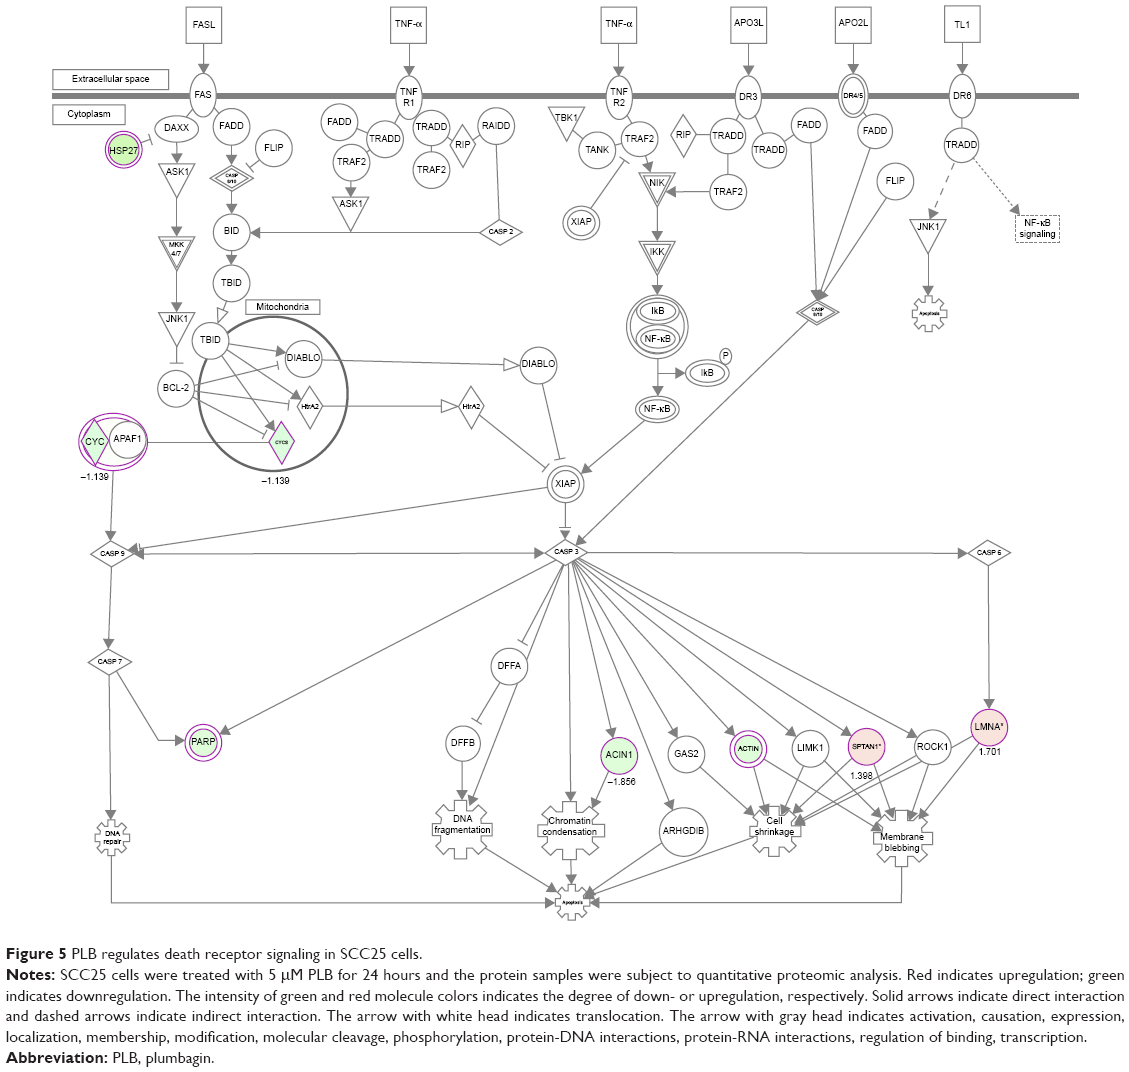 | Figure 5 PLB regulates death receptor signaling in SCC25 cells. |
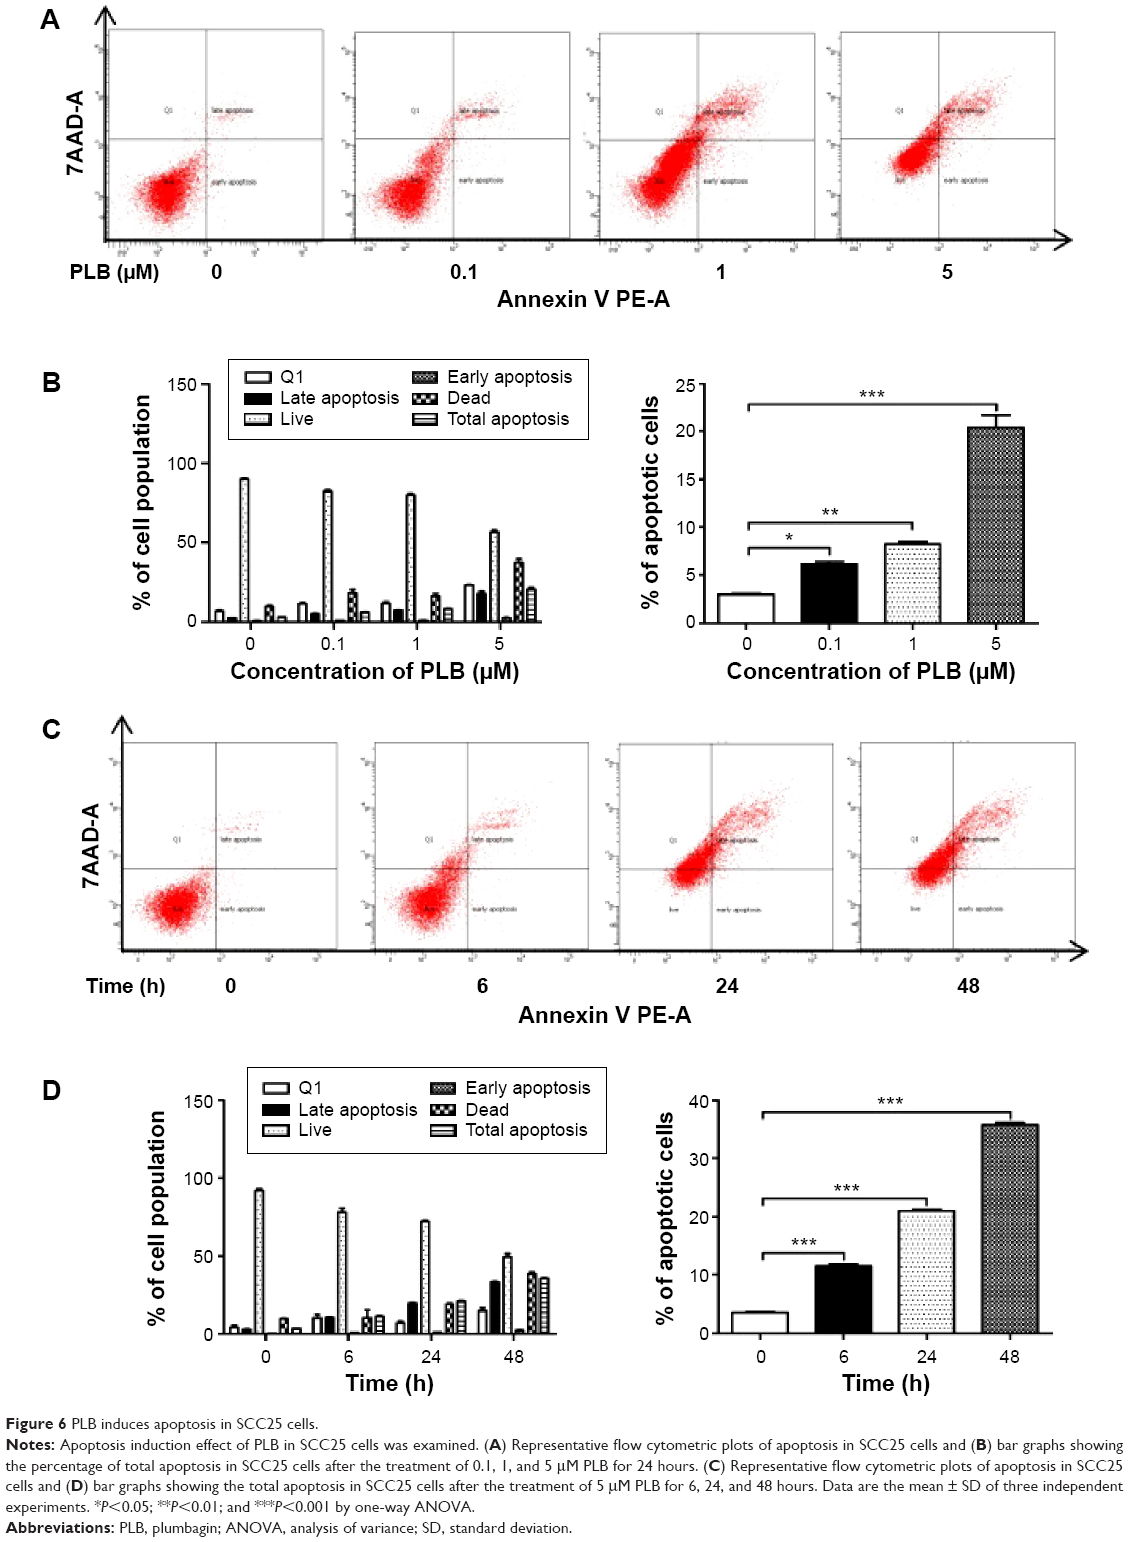 | Figure 6 PLB induces apoptosis in SCC25 cells. |
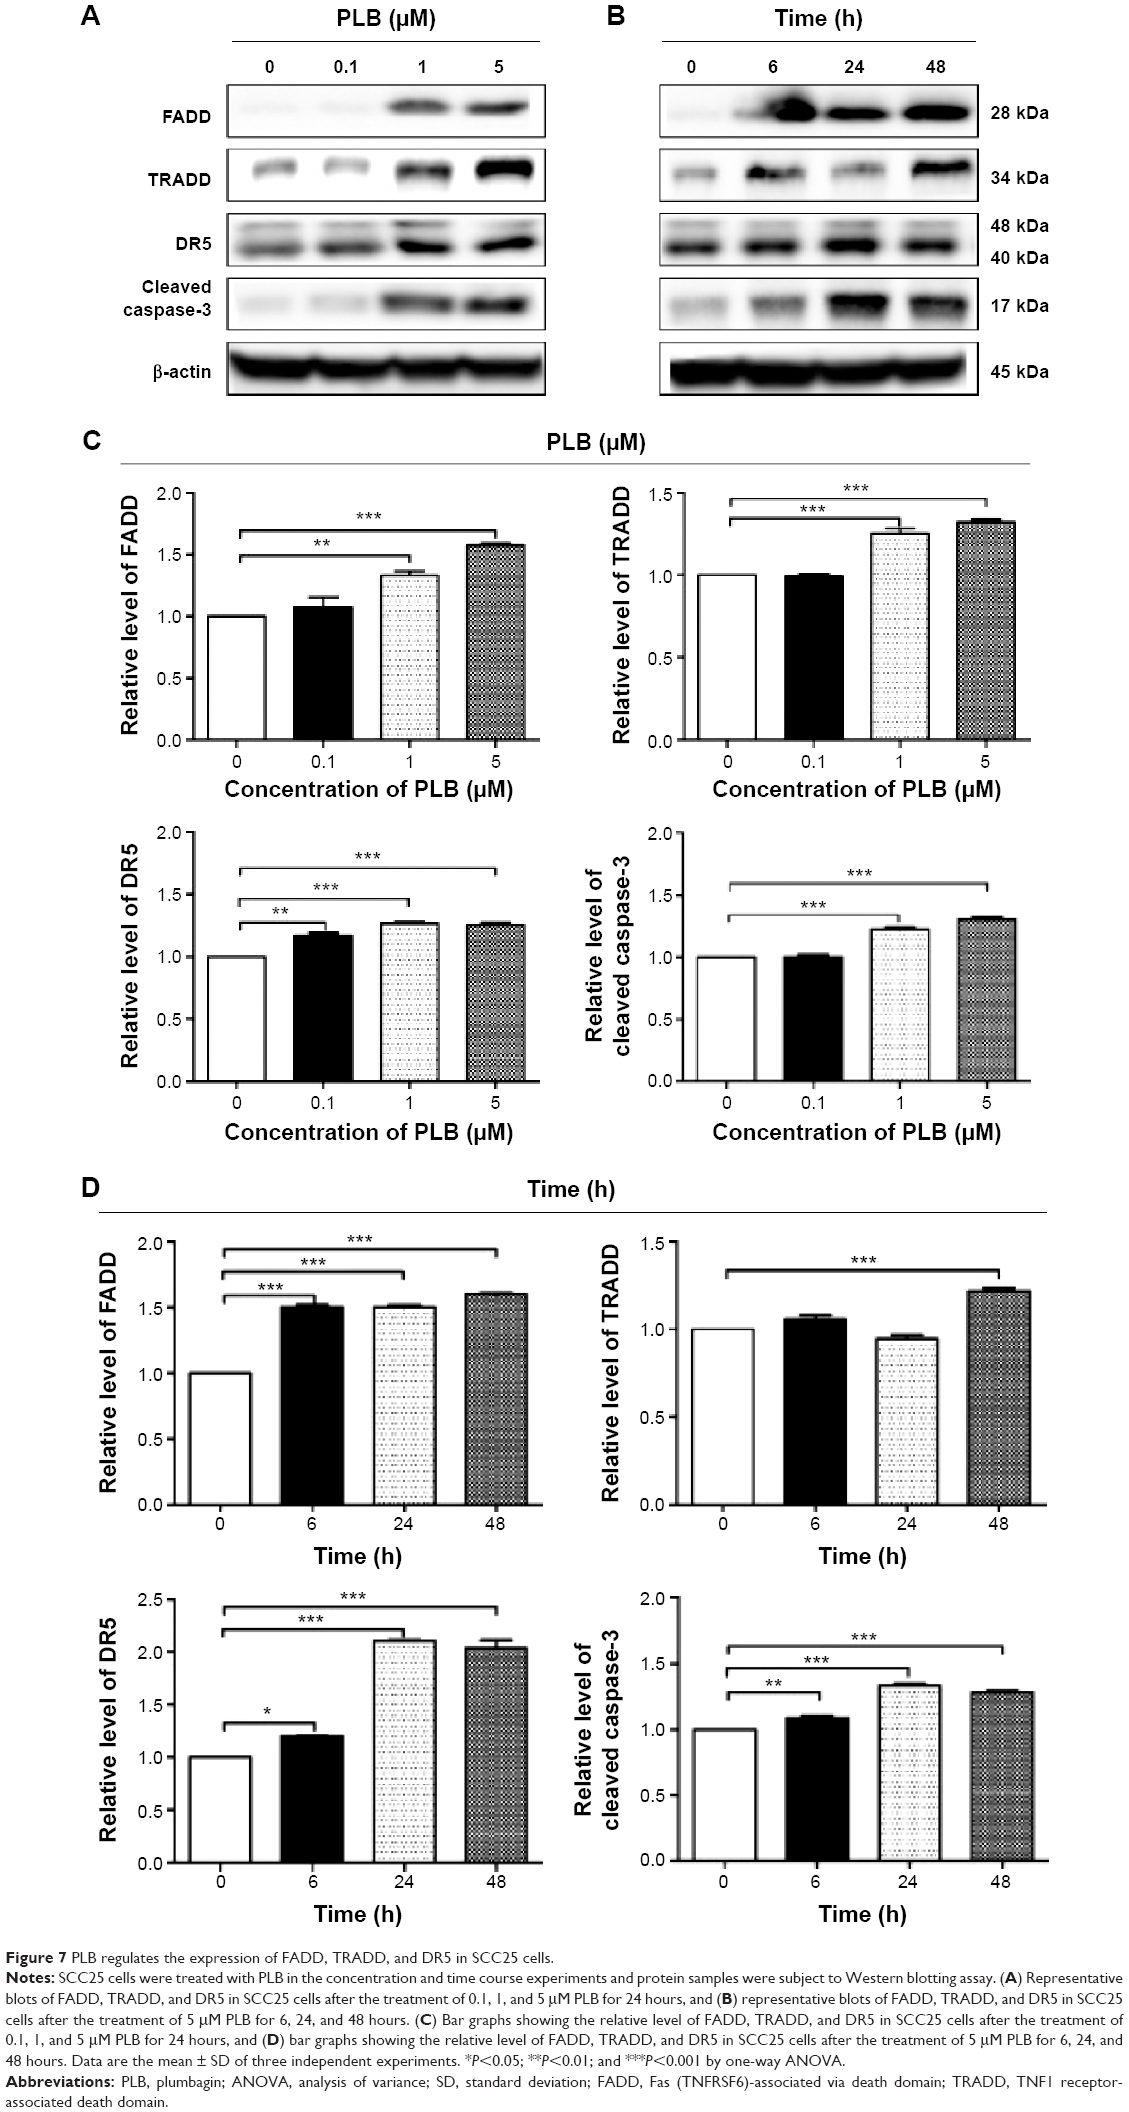 | Figure 7 PLB regulates the expression of FADD, TRADD, and DR5 in SCC25 cells. |
PLB inhibits EMT and stemness in SCC25 cells
EMT is a critical process involved in the invasion, metastasis, and stemness of cancer.35 EMT depends on a reduction in expression of cell adhesion molecules. Tight junctions function as complete barriers between epithelium and endothelium and contribute to the maintenance of cell polarity. Claudin and occludin proteins are integral structural and functional components of tight junctions.36,37 ZO-1, 2, and 3 are peripheral membrane adaptor proteins that link junctional transmembrane proteins to the actin cytoskeleton.38–40 Cadherins are a superfamily of transmembrane glycoproteins, which include N-, P-, R-, B-, and E-cadherins.41 E-cadherin is considered an active suppressor of invasion in many epithelial cancers.42 Cancer cells often have upregulated N-cadherin in addition to loss of E-cadherin.43 Furthermore, the cytoplasmic domain of classical cadherins interacts with β-catenin, γ-catenin, and p120 catenin.44,45 It is reported that snail can interact with β-catenin via Wnt signaling pathway.46 Herein, on the basis of the proteomic results (Figure 8), we verified the effect of PLB treatment on EMT-associated markers in SCC25 cells using Western blotting assay. Incubation of SCC25 cells with PLB resulted in a concentration- and time-dependent increase in the expression level of E-cadherin and a decrease in the expression level of N-cadherin (Figure 9A–D). There was a 1.2- and 1.8-fold increase in the expression of E-cadherin when treated with 1 and 5 μM PLB for 24 hours, respectively, whereas 5 μM PLB suppressed expression level of N-cadherin 23% (P<0.05 or 0.001; Figure 9A and C). When SCC25 cells were treated with 5 μM PLB over 48 hours, the expression level of E-cadherin was increased 1.2-, 1.4-, and 1.8-fold after the treatment of 5 μM PLB for 6, 24, and 48 hours, respectively (P<0.01 or 0.001; Figure 9B and D). The expression level of N-cadherin was decreased by 23.3% and 45.0% when SCC 25 cells were treated with 5 μM PLB for 24 and 48 hours, respectively (P<0.05 or 0.001; Figure 9B and D).
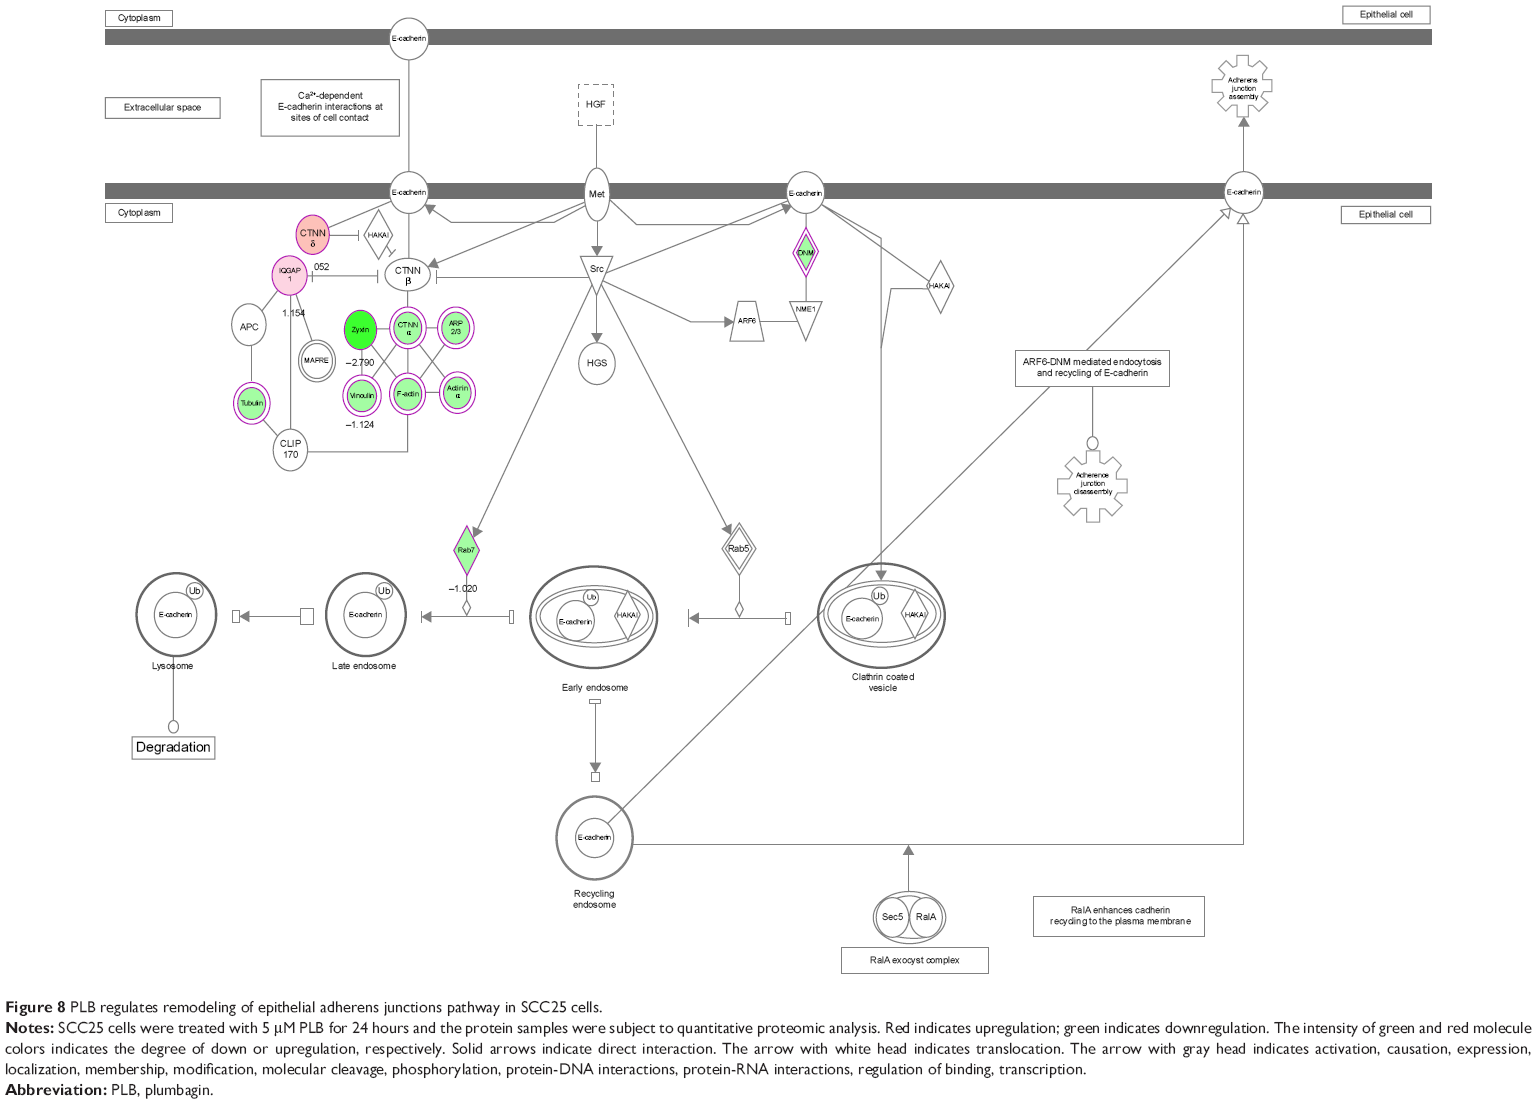 | Figure 8 PLB regulates remodeling of epithelial adherens junctions pathway in SCC25 cells. |
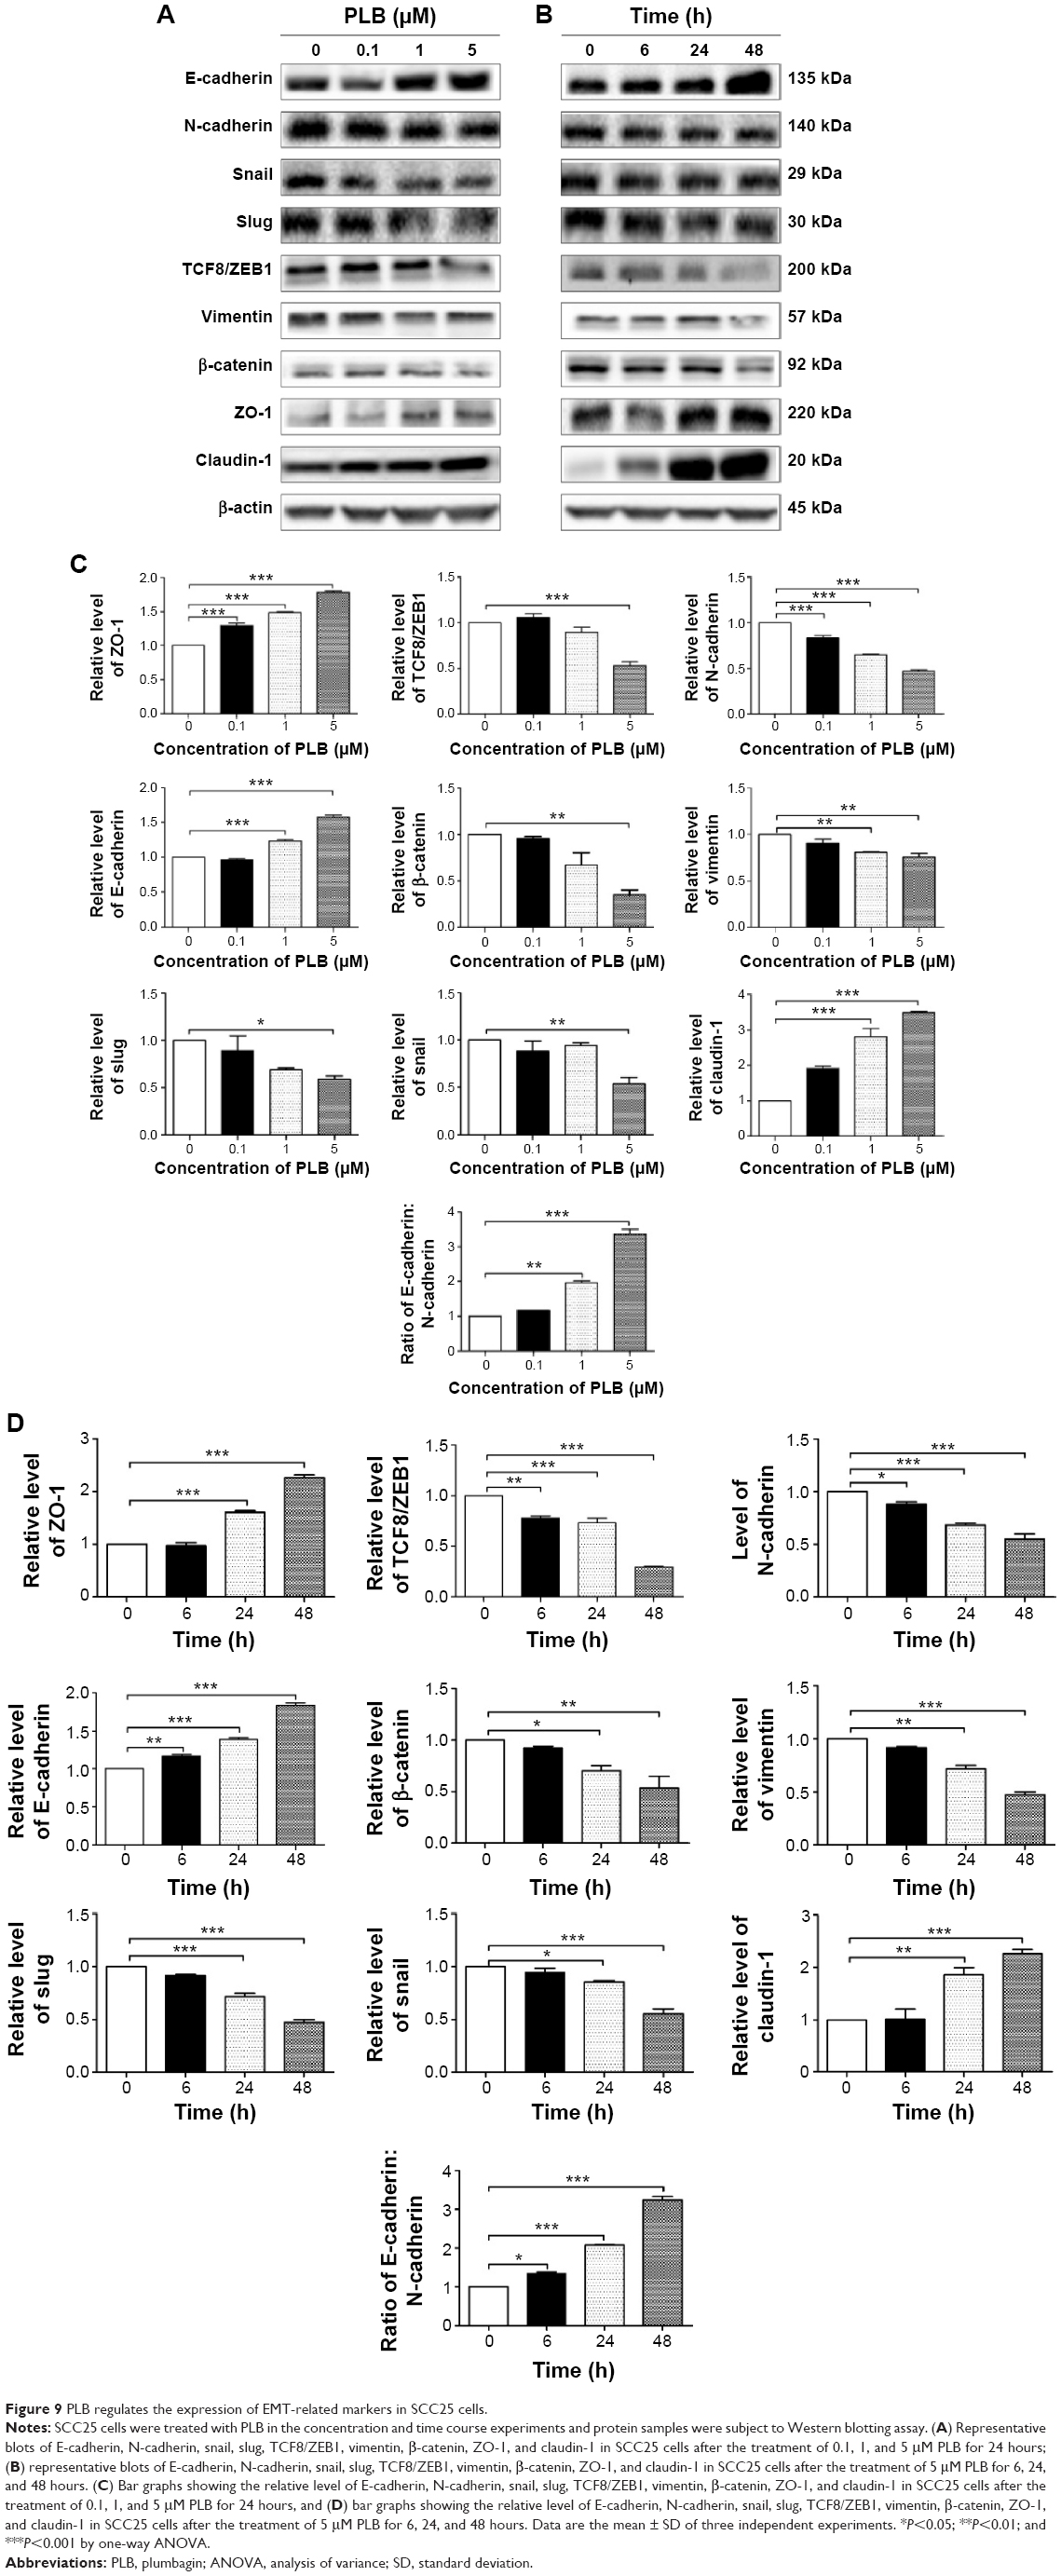 | Figure 9 PLB regulates the expression of EMT-related markers in SCC25 cells. |
In order to further examine the effect of PLB on EMT in SCC25 cells, we measured the expression level of several key regulators of E-cadherin. Snail and slug (both zinc finger transcriptional factors) together with TCF8/ZEB1 are suppressors of E-cadherin in EMT. PLB significantly reduced the expression level of snail and slug in SCC25 (Figure 9A and C). When SCC25 cells were treated with 5 μM PLB for 24 hours, the expression level of snail and slug was decreased by 46% and 41%, respectively (Figure 9A and C). Furthermore, PLB induced a time-dependent reduction in the expression level of TCF-8/ZEB1 in SCC25 cells. The expression level of TCF-8/ZEB1 was decreased by 22.0%, 27.0%, and 70.3% when SCC25 cells were treated with 5 μM PLB for 6, 24, and 48 hours, respectively (Figure 9B and D).
Vimentin is a type III intermediate filament protein in mesenchymal cells. β-Catenin can act as an integral component of a protein complex in adherens junctions that helps cells maintain epithelial layers, and β-catenin participates in the Wnt signaling pathway as a downstream target. In SCC25 cells, PLB inhibited the expression of vimentin in a concentration- and time-dependent manner. The expression level of vimentin was decreased by 19.3% and 24.7% when cells were treated with 1 and 5 μM PLB for 24 hours, respectively (P<0.01; Figure 9A and C). Consistently, the expression level of vimentin was decreased by 21.0% and 51.3% when SCC25 cells were incubated with 5 μM PLB for 24 and 48 hours, respectively (P<0.01 or 0.001; Figure 9B and D). There was also a significant reduction in the expression level of β-catenin in both the concentration and time course experiment when SCC25 cells were treated with 5 μM PLB. PLB at 5 μM markedly decreased the expression level of β-catenin by 24.7% with a 24-hour incubation period (P<0.01; Figure 9A and C). Finally, the expression of tight junction proteins ZO-1 and claudin-1 were examined in SCC25 cells after the treatment of PLB. ZO-1 and -2 are required for tight junction formation and function. The effect of PLB on the expression of ZO-1 and claudin-1 in SCC25 cells increased significantly in a concentration- and time-dependent manner (Figure 9A and B). Treatment of cells with 5 μM PLB for 24 hours led to a 1.8- and 3.5-fold rise in the expression level of ZO-1 and claudin-1, compared to the control cells, respectively (P<0.001; Figure 9A and C). These results from Western blotting assay verified our proteomic data.
In addition, there is increasing evidence showing that CSCs can display EMT characteristics such as loss of the adhesion protein E-cadherin. This relationship drives us to think about the stemness-attenuating effect of PLB in SCC25 cells. Therefore, we primarily conducted the Western blotting assay to examine the key stemness markers, including Oct-4, Bmi-1, Nanog, and Sox-2. Oct-4, also known as Oct-3, belongs to the POU (Pit-Oct-Unc) transcription factor family and plays an important role during early embryogenesis.47 Sox-2 is a member of the Sox gene family that encodes transcription factors and plays an important role in the maintenance of stemness.48 Nanog transcription factor cooperates with Oct-4 and Sox-2 and is identified as a key CSCs marker.49 Bmi-1 is a transcriptional repressor that belongs to the polycomb-group family of proteins that determine the proliferation and senescence of normal and CSCs.50 The Western blotting results showed that PLB significantly decreased the expression level of Oct-4, Sox-2, Nanog, and Bmi-1. Incubation of SCC25 cells with 5 μM PLB remarkably decreased the expression level of Oct-4, Sox-2, Nanog, and Bni-1 by 35.7%, 27.0%, 70.7%, and 38.3%, respectively, compared with the control cells (P<0.001; Figure 10A and C). In a separate experiment, we evaluated the effect of different incubation times with 5 μM PLB. Totally, the expression levels of Bmi-1, Nanog, and Sox-2 were decreased significantly after 6 hours of incubation, while the Oct-4 expression level was decreased significantly after 24 hours of incubation (Figure 10B and D). These results indicate that PLB suppresses the stemness of human TSCC cells.
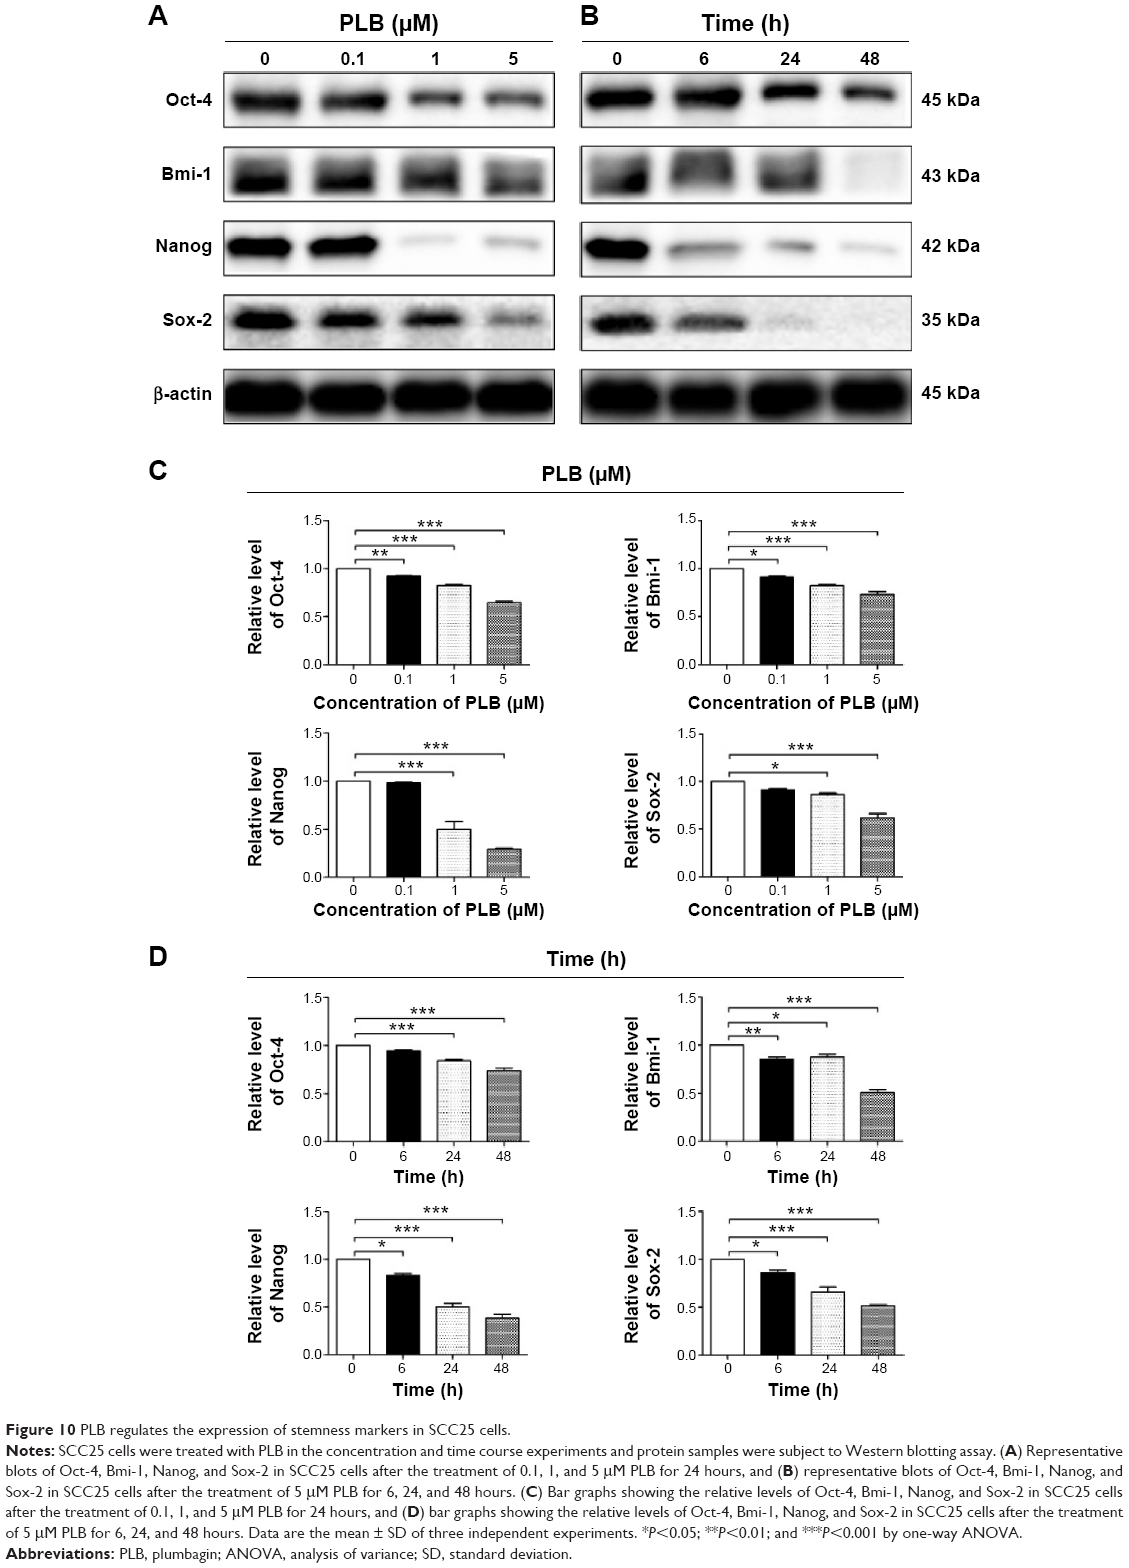 | Figure 10 PLB regulates the expression of stemness markers in SCC25 cells. |
PLB induces intracellular ROS generation and regulates redox homeostasis via suppressing Nrf2-mediated oxidative signaling pathway in SCC25 cells
As shown in the proteomic results, PLB exhibited a regulating effect on intracellular redox homeostasis in SCC25 cells, which may possibly contribute to the cell cycle arresting, apoptosis inducing, EMT inhibiting, and stemness-attenuating effects of PLB. Herein, we examined the role of Nrf2-mediated signaling pathway in PLB’s beneficial action in SCC25 cells. Nrf2, also known as Nfe2I2, is a nuclear factor that controls the expression of various detoxifying enzymes, ROS elimination proteins, drug transporters, and antiapoptotic proteins. Normally, Nrf2 is suppressed in the cytoplasm by the interaction with Kelch-like ECH-associated protein 1 (Keap1) and Cullin3. Once exposed to the antioxidant response element (ARE)-mediated inducers, Nrf2 will translocate to the nucleus where it forms a heterodimer with a small Maf protein and binds to other nuclear factors and initiates the transcription of antioxidative genes.51,52 As noted earlier, the proteomic results indicated that Nrf2-oxidative signaling pathway responded to the PLB treatment in SCC25 cells (Figure 11). Therefore, we analyzed this pathway using Western blotting assay. First, SCC25 cells were treated with 0.1, 1, and 5 μM PLB for 24 hours and their nuclear proteins were extracted. The results showed that the expression levels of nuclear (n)-Nrf2, NQO1, GST, and HSP90 were all decreased, while the expression level of cytosolic (c)-Nrf2 was increased in SCC25 cells, compared with the control cells (Figure 12A). The ratio of n-Nrf2 to c-Nrf2 was decreased by 13.3% and 37.0% when SCC25 cells were incubated with 1 and 5 μM PLB for 24 hours, respectively (P<0.01 or 0.001; Figure 12C). In addition, the expression levels of c-Nrf2, n-Nrf2, NQO1, GST, and HSP90 were also examined with the treatment of 5 μM PLB over a 48-hour treatment period. The ratio of n-Nrf2 to c-Nrf2 was decreased by 28.3% and 39.0% when SCC25 cells were incubated with 5 μM PLB for 24 and 48 hours, respectively (P<0.001; Figure 12D). The expression levels of NQO1, GST, and HSP90 were all markedly decreased (P<0.05 or 0.001; Figure 12D). Taken together, the results show that Nrf2-oxidative signaling pathway is involved in the ROS-generation-inducing effect of PLB, contributing to the regulatory activities of PLB on intracellular redox homeostasis in SCC25 cells (Figure 13).
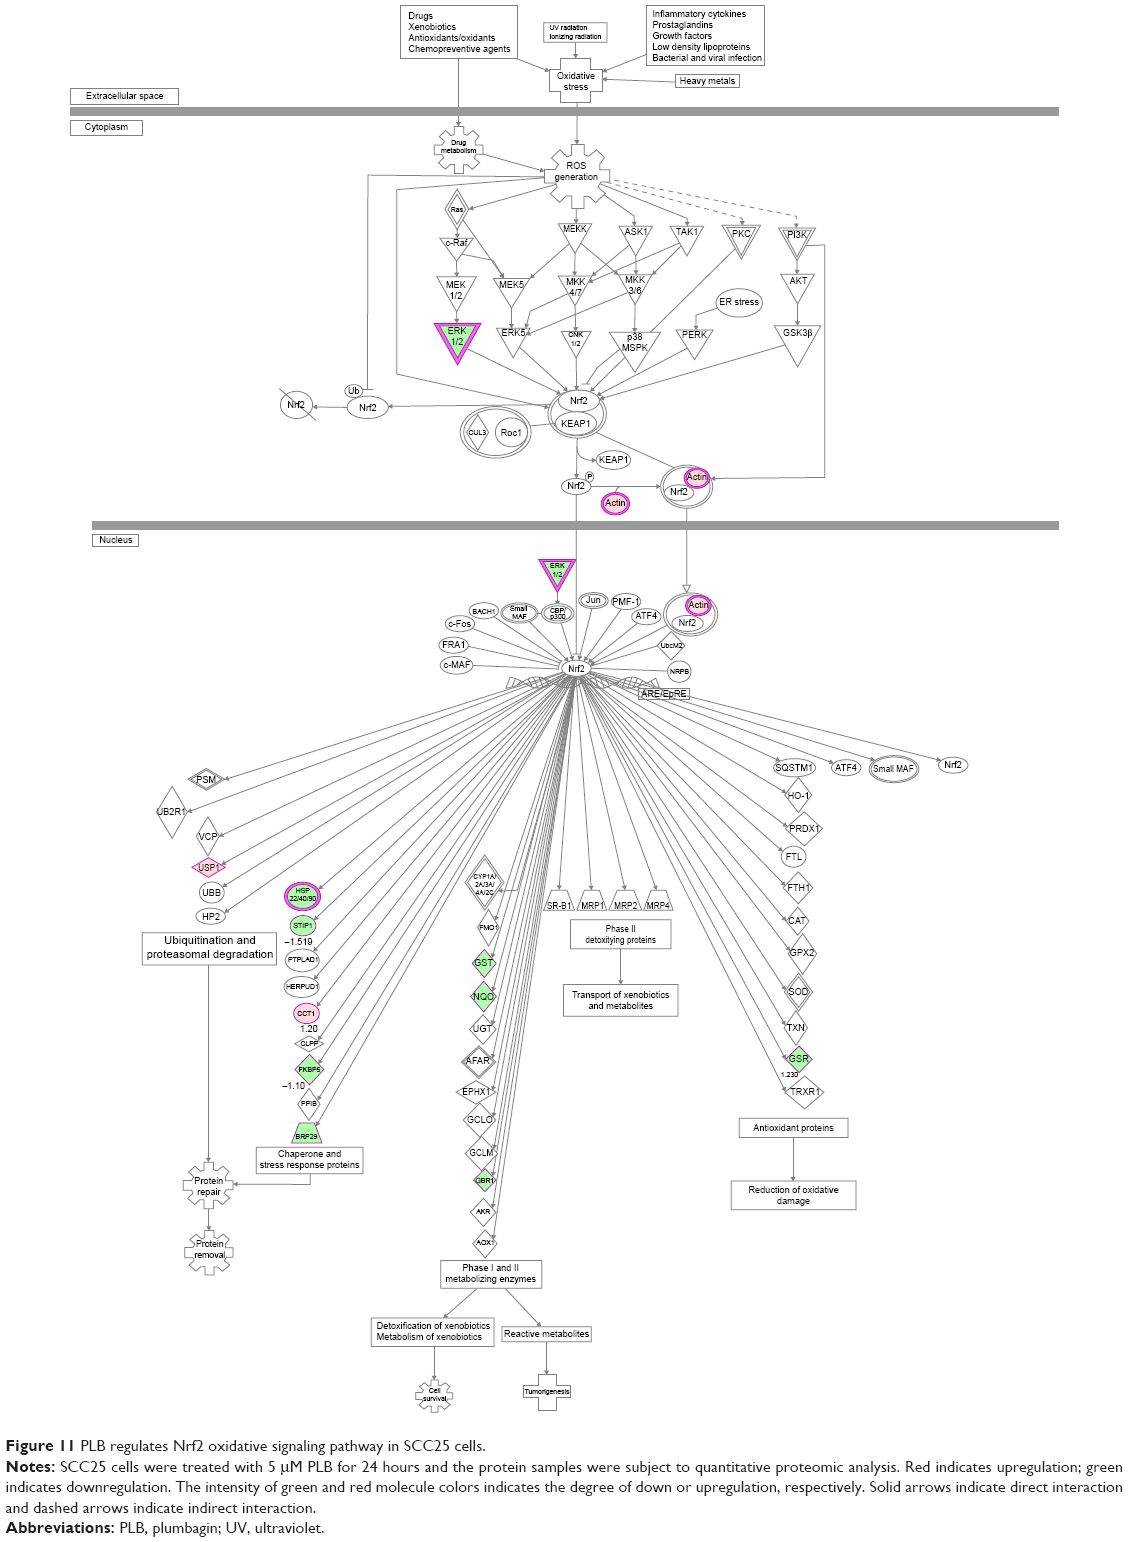 | Figure 11 PLB regulates Nrf2 oxidative signaling pathway in SCC25 cells. |
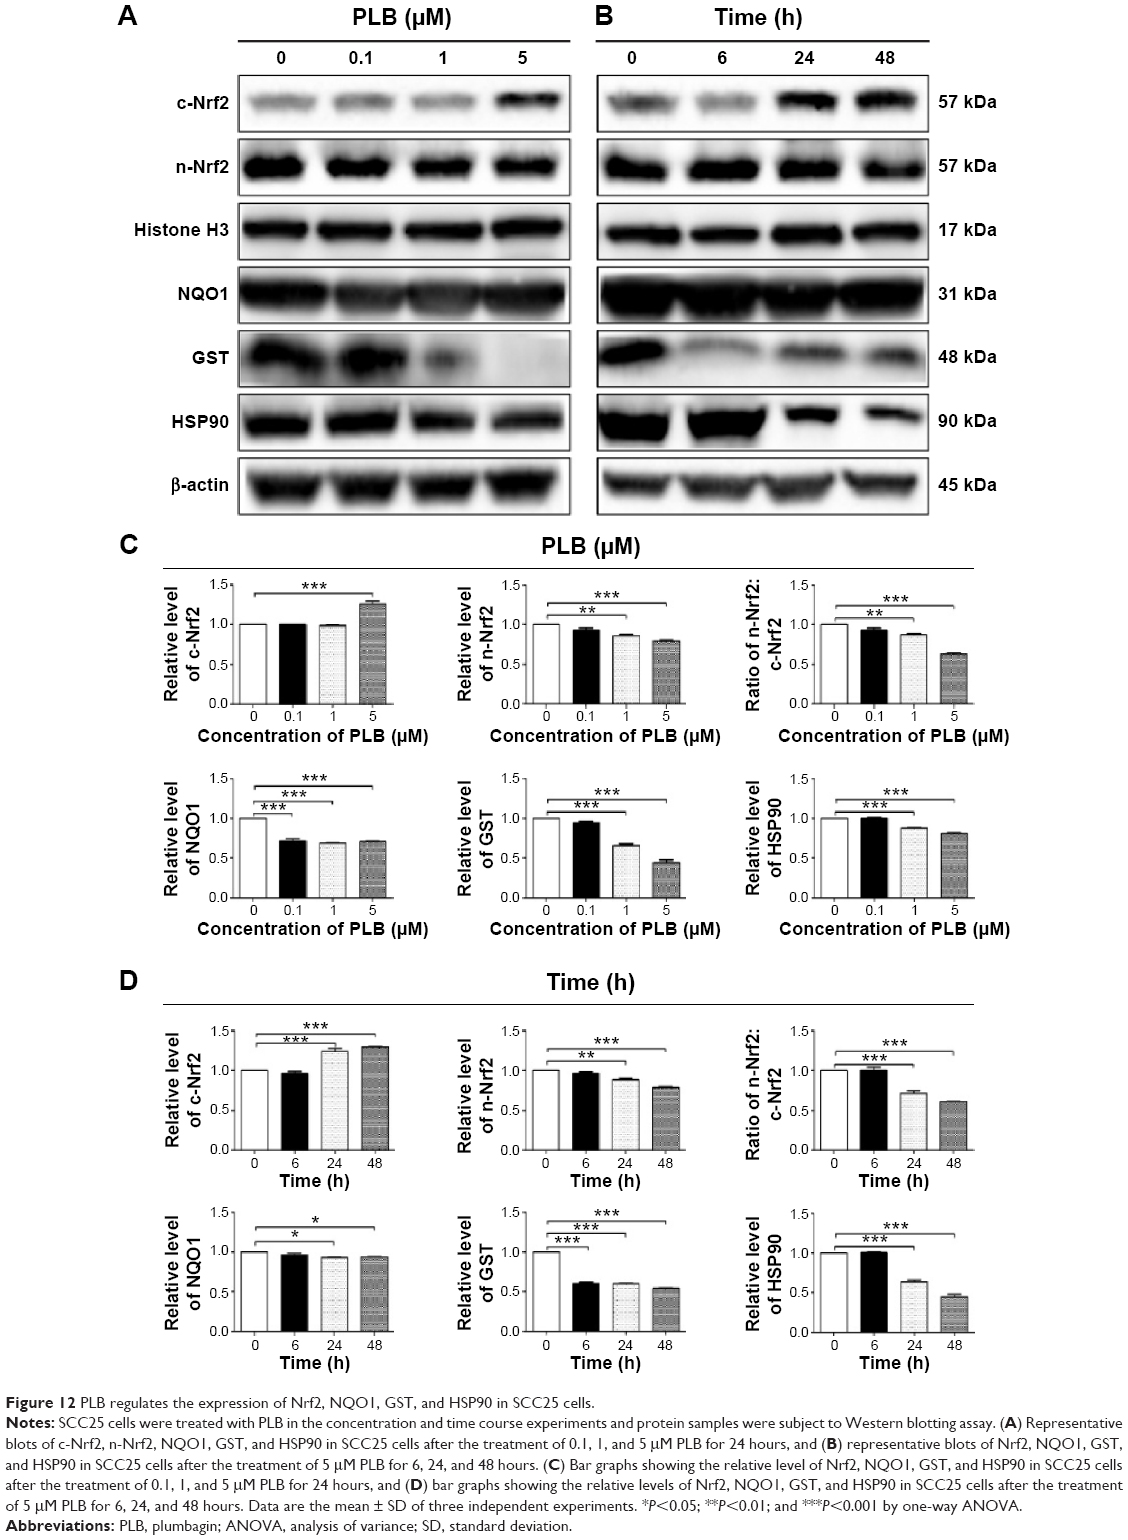 | Figure 12 PLB regulates the expression of Nrf2, NQO1, GST, and HSP90 in SCC25 cells. |
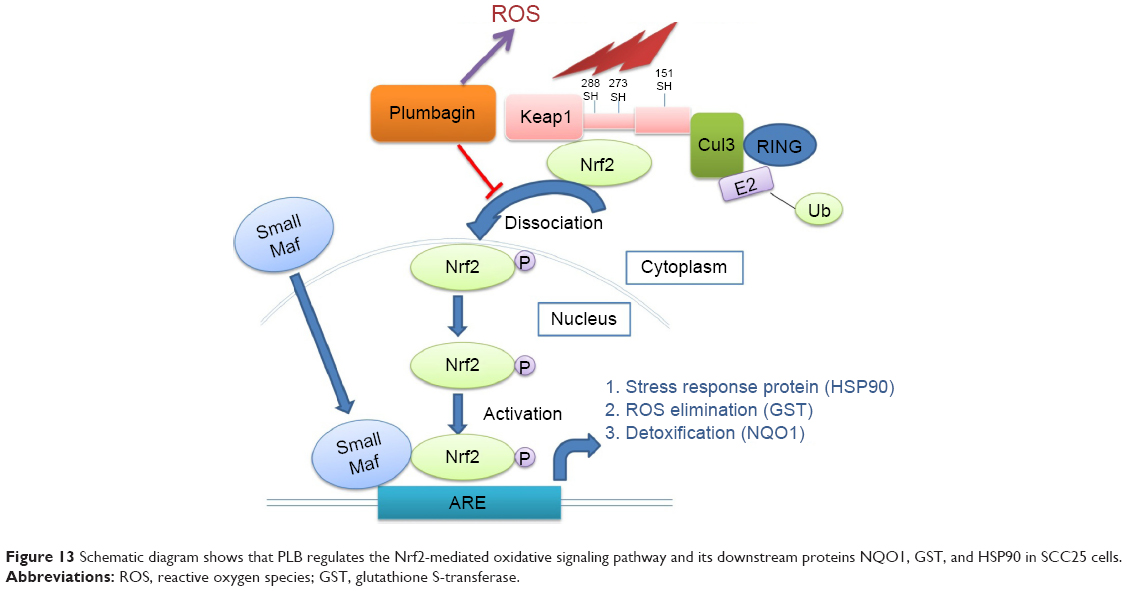 | Figure 13 Schematic diagram shows that PLB regulates the Nrf2-mediated oxidative signaling pathway and its downstream proteins NQO1, GST, and HSP90 in SCC25 cells. |
Relationship between PLB-induced ROS generation and PLB-mediated cell cycle arrest, apoptosis induction, EMT inhibition, and stemness attenuation
The relationship between PLB-induced ROS generation and PLB-mediated cell cycle arrest, apoptosis induction, EMT inhibition, and stemness attenuation was further examined in SCC25 cells with the application of ROS scavengers (NAC and GSH). SCC25 cells were treated with 5 μM PLB, 100 μM NAC, 1 mM GSH, 5 μM PLB plus 100 μM NAC, and 5 μM PLB plus 1 mM GSH, respectively. As shown in Figures 14–16, the cell cycle arresting, apoptosis inducing, EMT inhibiting, and stemness-attenuating effects of PLB were abolished by NAC and GSH. The percentage of cells in G2/M phase was decreased by 53.2% and 61.4% in SCC25 cells when cells were coincubated with NAC and PLB or GSH and PLB, compared to PLB-treated cells, respectively (P<0.01 or 0.001; Figure 14B). In addition, in comparison to PLB-treated cells, NAC and GSH ablated PLB-induced apoptosis 53.3% and 55.6%, respectively (P<0.001; Figure 15B). Furthermore, the expression of EMT and stemness representative markers were measured (Figure 16). Compared to PLB-treated cells, the expression level of E-cadherin was decreased by 30.4% and 36.2% when cells were cotreated with NAC and PLB or GSH and PLB, respectively (P<0.001; Figure 16A and B). On the contrary, the expression level of N-cadherin, Oct-4, Bmi-1, and Nanog was increased when cells were coincubated with NAC and PLB or GSH and PLB (Figure 16A and B). However, the expression level of Sox-2 did not show statistical significance (Figure 16A and B). This may be partially ascribed to PLB-mediated other pathways that downregulate the Sox-2 level. Taken together, PLB-induced ROS generation may interact with the actions of PLB-mediated cell cycle arrest, apoptosis induction, EMT inhibition, and stemness attenuation.
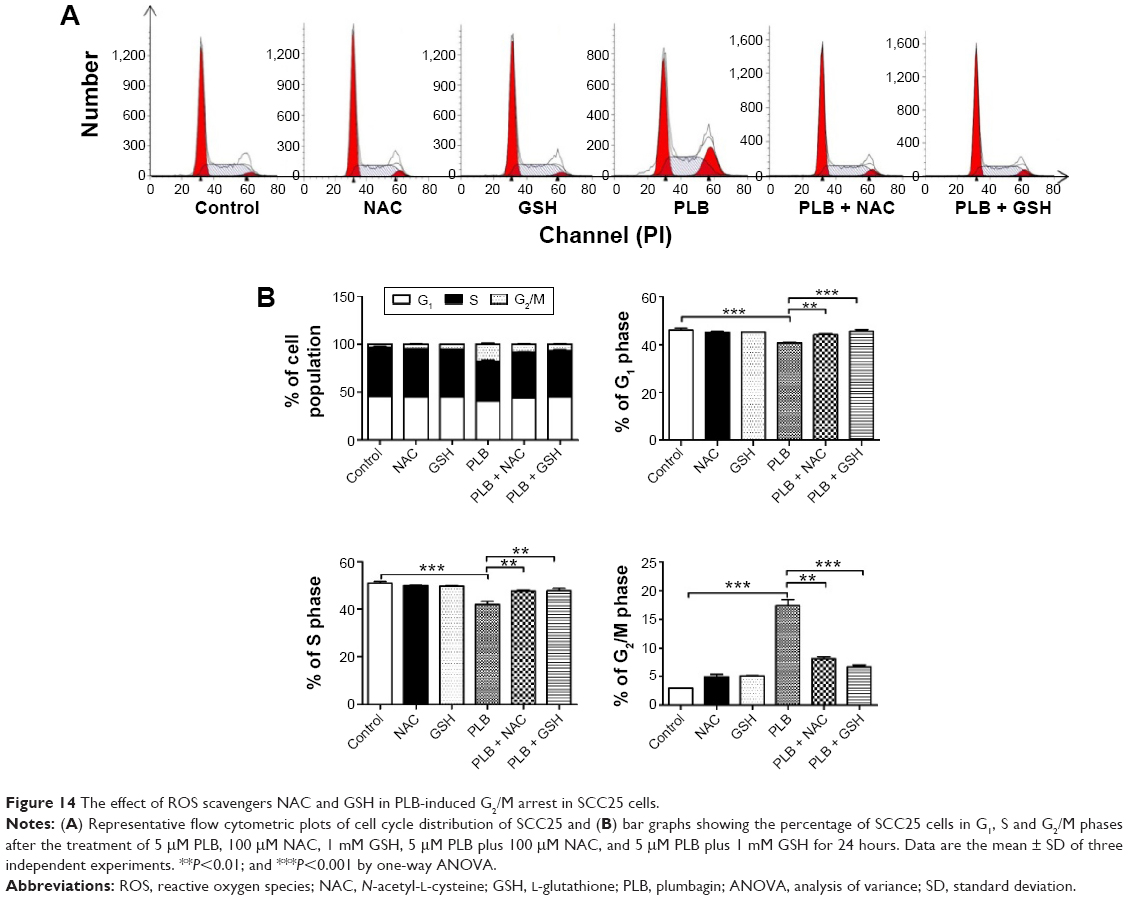 | Figure 14 The effect of ROS scavengers NAC and GSH in PLB-induced G2/M arrest in SCC25 cells. |
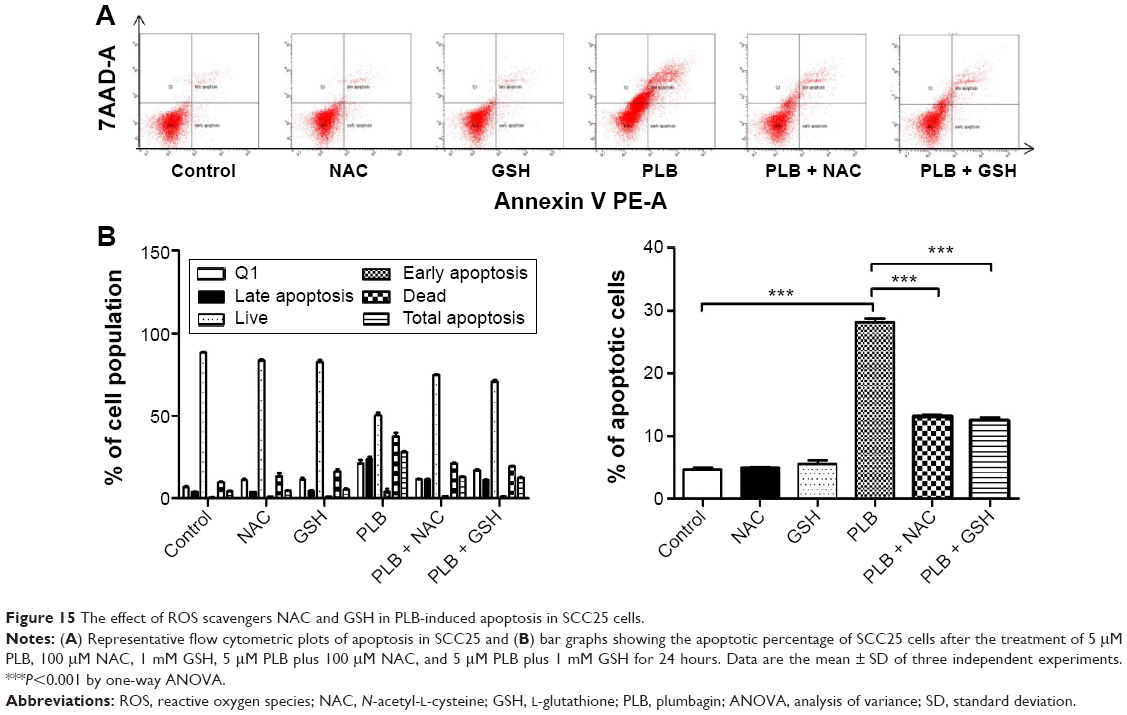 | Figure 15 The effect of ROS scavengers NAC and GSH in PLB-induced apoptosis in SCC25 cells. |
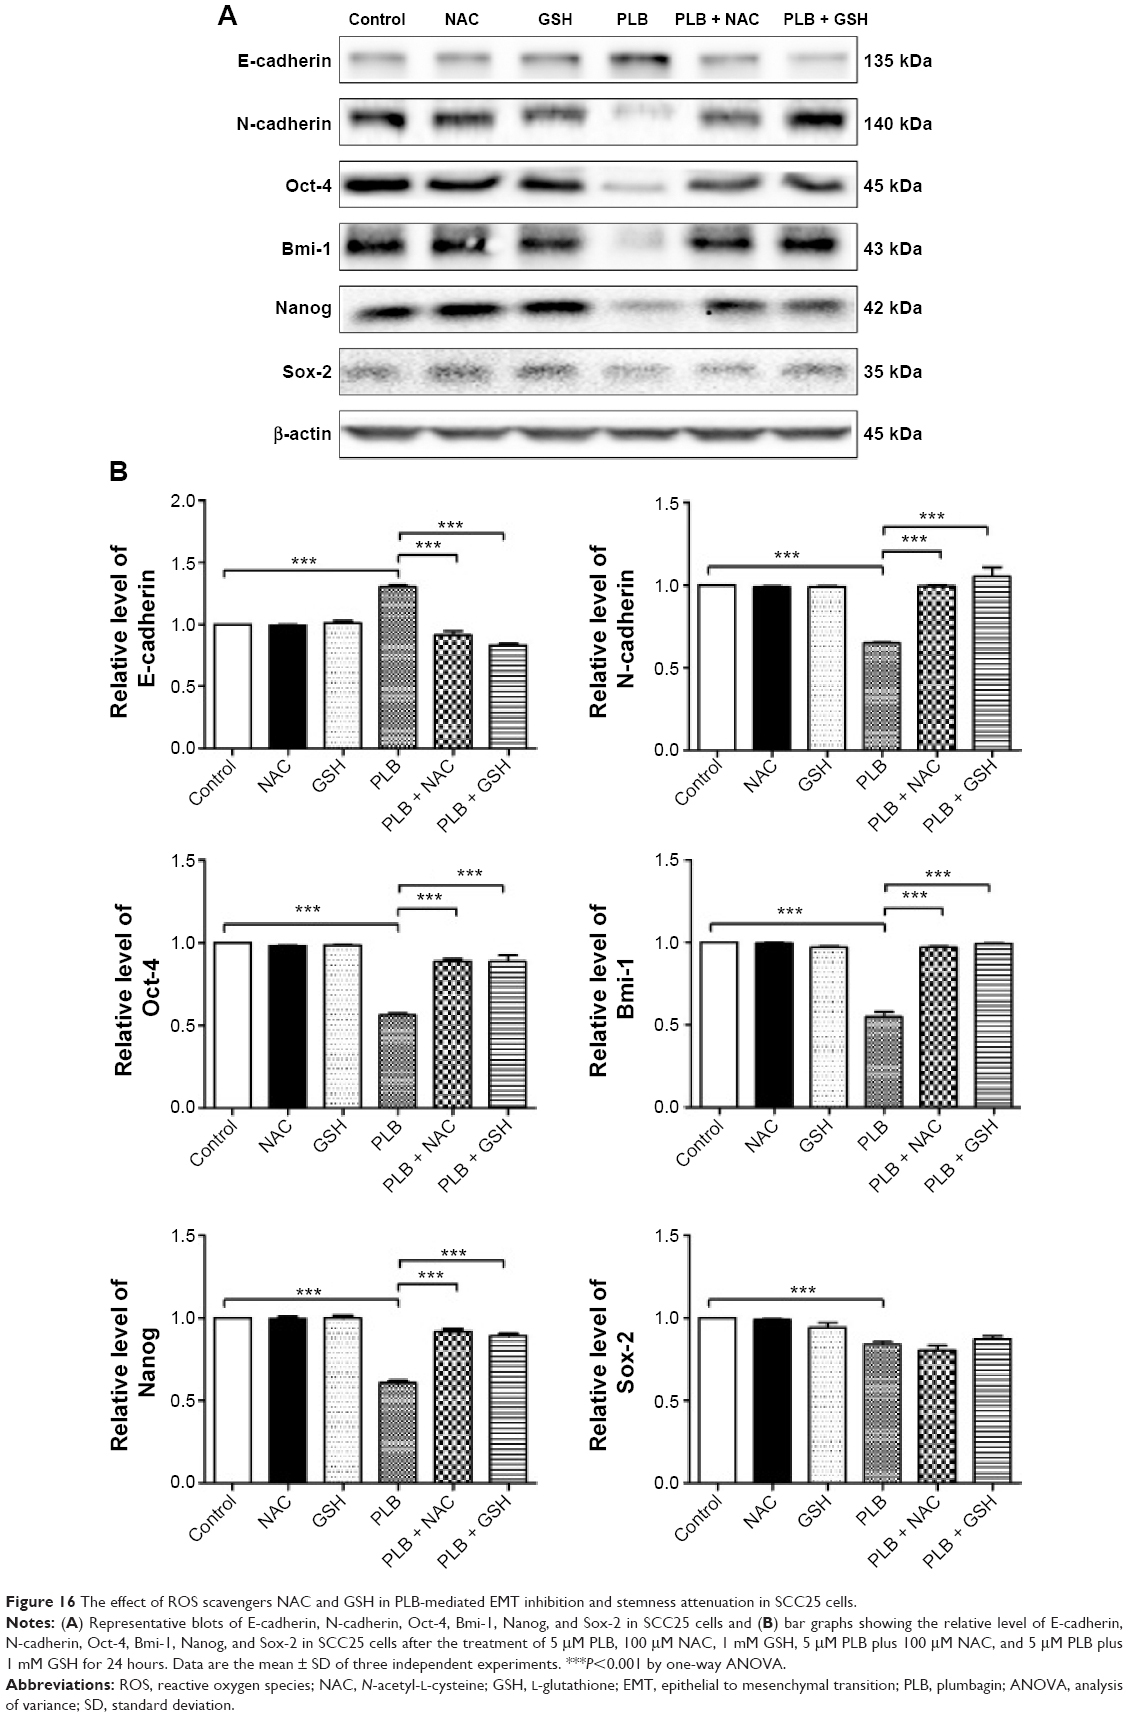 | Figure 16 The effect of ROS scavengers NAC and GSH in PLB-mediated EMT inhibition and stemness attenuation in SCC25 cells. |
Discussion
TSCC remains one of the devastating malignancies in oral and maxillofacial tumors. TSCC is notorious for its lymphatic metastasis and relapse. Although sequential treatments are available, including radiotherapy, surgery, and chemotherapy, the therapeutic efficacy is not so optimistic.1 This is partially due to hyperactive cell survival pathways and radiotherapy/chemotherapy resistance.53,54 It is urgent to probe into the corresponding molecular alterations and seek novel effective drugs for TSCC treatment. PLB is an active naphthoquinone constituent isolated from the roots of Plumbaginaceae plants.17 It has been reported that PLB exhibits anticancer activities with minimal side effect in vitro and in vivo, which is greatly ascribed to its effects on multiple signaling pathways related to ROS generation, apoptosis, and autophagy.23,55,56 In this study, we employed a SILAC-based quantitative proteomic study to obtain a comprehensive view of the proteomic response to PLB treatment in TSCC cell line SCC25, and the findings have shown that PLB regulates a variety of functional protein molecules and signaling pathways involved in critical cellular processes. Further validation results have shown that PLB induces G2/M arrest and extrinsic apoptosis, but inhibits EMT and stemness via ROS generation through Nrf2-mediated oxidative signaling pathway in TSCC cell line SCC25 cells.
The SILAC-based proteomic approach can provide a system-level analysis to tackle the challenges in cancer treatment, such as chemoresistance. One study applied SILAC-based quantitative proteomic approach to analyze differences in protein expression level between parental hepatocellular carcinoma cell line HuH-7 and sorafenib-acquired resistance HuH-7 (HuH-7R) cells. Results indicated that galectin-1 is a predictive marker of sorafenib resistance and a downstream target of the Akt/mTOR/HIF-1a signaling pathway.57 The SILAC-based proteomic approach can also quantitatively evaluate the effect of a given compound or drug and identify its potential molecular targets and related signaling pathways.58–60 For example, the SILAC-based proteomic approach was used to screen the therapeutic targets of histone deacetylases inhibitor vorinostat in human breast cancer MDA-MB-231 cell line, and the results found that 61 proteins were lysine acetylated by vironostat.30 This study demonstrated that PLB modulated a plethora of protein molecules, of which the expression levels of 143 protein molecules were increased while the levels of 255 protein molecules were decreased. Furthermore, 101 signaling pathways were potentially regulated by PLB in SCC25 cells. The following proteins are widely involved in cell survival, cell proliferation, redox homeostasis, cell metabolism, cell migration, and cell death: YWHAQ, PRKDC, YWHAG, YWHAE, YWHAH, YWHAB, YWHAZ, SFN, SKP1, CDK1, ACIN1, CAPNS1, MAPK1, RRAS, LMNA, CAPN2, SPTAN1, CYCS, PARP1, AIFM1, FADD, ACTB, ACTA1, ACTG1, ACTN1, ACTN4, ACTR3, ARPC1B, CTNNA1, CTNND1, DNM1L, EGFR, IQGAP1, JUP, MYH9, RAB7A, RHO1, TUBA1B, TUBA1C, TUBA4A, TUBB, TUBB4B, VAL, VCL, ZYX, CBR, DNAJA2, GSTP1, NQO1, HSP90AA1, PPIB, SOD1, STIP1, and VCP. The network of signaling pathways was mainly related to cell cycle distribution, cell migration, redox hemostasis, and cell death. The top ten targeted signaling pathways were EIF2 signaling pathway, regulation of eIF4 and p70S6K signaling, remodeling of epithelial adherens junctions pathway, mTOR signaling pathway, protein ubiquitination pathway, Nrf2-mediated oxidative stress response signaling pathway, epithelial adherens junction signaling pathway, caveolar-mediated endocytosis signaling pathway, RhoA signaling pathway, and oxidative phosphorylation pathway. The proteomic results indicate that PLB may target these molecules and related signaling pathways to elicit its anticancer effects in the treatment of TSCC. Notably, we have observed a differential effect of PLB on turmoral and nontumoral cells, with a higher half-maximal inhibitory concentration toward to nontumoral cells than that to the corresponding tumoral cells,20 which renders PLB a promising anticancer drug candidate.
Subsequently, we further validated the proteomic responses to PLB in SCC25 cells. We found that PLB induced G2/M arrest in SCC25 cells in a concentration- and time-dependent manner. Meanwhile, the expression level of key regulators of G2/M phase, such as cdc2, cyclin B1, and cdc25, were decreased after the treatment of PLB. It has been reported that cell cycle progression is tightly regulated by cyclins and CDKs.61 The complex formed by the association of CDK1/cdc2 and Cyclin B1 plays a major role in the entry of cells into mitosis. Phosphorylation of CDK1/cdc2 at Thr161 by CDK-activating kinase is essential for CDK1/cdc2 kinase activity. The process of the CDK1/cdc2 phosphorylation and dephosphorylation are mediated by the nuclear kinase Wee1 and the dual-specificity phosphatase cdc25. Wee1 can stop mitosis by inhibiting the CDK1/cdc2 phosphorylation, while cdc25 can help entry into mitosis by eliminating the inhibitory phosphorylation.61 Thus, taking the proteomic, flow cytometric, and Western blotting results into consideration, PLB-induced cell cycle arrest may be mediated through the regulation of key modulators controlling the G2/M check point in SCC25 cells.
Apoptosis is a conserved physiological mechanism that is important during embryogenesis and homeostasis of tissue. Dysregulated apoptosis has been implicated in many diseases including cancer.62 The successful execution of apoptosis is crucial for many chemotherapy drugs.63 It is widely accepted that there are two types of apoptosis: intrinsic apoptosis and extrinsic apoptosis. Mitochondrial disruption and the subsequent cytochrome c release can initiate the caspase-dependent apoptosis. Bcl-2 family plays an important role during this process.64,65 Previously, our findings showed that PLB triggered the mitochondrial-mediated apoptosis in SCC25 cells.20 In this study, the proteomic study showed that PLB regulated mitochondrial function and death receptor signaling pathway. We found that PLB could induce FADD-mediated extrinsic apoptosis in SCC25 cells. The proteomic results hinted that PLB regulated the death receptor signaling and that the protein molecule FADD was upregulated by PLB. FADD is a key adaptor protein for death receptor-mediated apoptosis. The death domain of FADD binds to the death domain of death receptor. Subsequently, procaspase-8 is recruited and caspase 3, 6, and 7 are cleaved. Finally, apoptosis is induced; and both intrinsic and extrinsic apoptosis converge into the cleavage of caspase 3. TRADD is a tumor necrosis factor receptor 1 (TNFR1) associated signal transducer that enhances association of FADD with TNFR1.66,67 DR5, also known as TRAIL-R2, can bind to adaptor molecules FADD and TRADD.68 In this study, we found that PLB increased the level of FADD, TRADD, and DR5. This indicated the extrinsic apoptosis-inducing effect of PLB in SCC25. Together with the results from our previous paper,20 it seems that PLB can efficiently induce both intrinsic and extrinsic apoptosis in SCC25 cells.
TSCC is notorious for its metastasis and relapse, and acquisition of EMT and induction of CSC-like properties are inevitably responsible for the metastasis and relapse.69 EMT is a highly conserved biological process that converts epithelial cells into mesenchymal cells via the modulation of various transcription factors.70–73 EMT has been classified into three types according to specific physiological context. Type I EMT plays an important role in embryogenesis and organ development. Type II EMT functions in wound healing and tissue regeneration. Type III EMT, the one we focus on, is involved in cancer metastasis and CSC formation.35,74 The EMT process is characterized by loss of epithelial markers such as E-cadherin, claudin, and occludin, and acquisition of mesenchymal markers such as N-cadherin, vimentin, snail, slug, and ZO-1.75,76 Many signaling pathways, such as Wnt, TGF-β, and STAT3, can mediate the EMT process via activating a plethora of transcriptional regulators of mesenchymal markers.75,76 Furthermore, CSCs can display EMT characteristics such as loss of adhesion protein E-cadherin.11 Static CSCs that have moved to distant sites might be responsible for metastases and relapse, especially after curative surgical treatment of a primary tumor.77 Seminal findings demonstrate that EMT activators, such as Twist1 and Prrx1, can serve as a direct molecular link between EMT and stemness.78,79 Our proteomic study showed that PLB could regulate the epithelial adherens junctions pathway in SCC25 cells. The Western blotting assay validated that PLB could increase the expression level of E-cadherin and decrease the level of N-cadherin in SCC25 cells. Furthermore, we examined other key regulators of EMT. We found that PLB significantly reduced the expression level of snail, slug, TCF-8/ZEB1, β-catenin, and vimentin, while increasing the expression level of claudin-1 and ZO-1. All these implied the EMT-inhibiting role of PLB in SCC25 cells. Subsequently, CSCs markers were also measured, and the expression levels of Oct-4, Bmi-1, Nanog, and Sox-2 were all found to be decreased by PLB in a concentration- and time-dependent manner in SCC25 cells. Taken together, PLB can inhibit EMT and attenuate stemness in SCC25 cells. We can speculate that there are interconnections between EMT and stemness, such as the loss of E-cadherin. Given that PLB can regulate the key factors in EMT, the stemness property may more or less be affected. However, the exact network between EMT and stemness needs further investigation. Importantly, it has been reported that ROS may link the EMT and stemness via glucose metabolism.80 In our previous paper,20 we found that PLB can efficiently induce ROS generation, which can be abolished by ROS scavengers NAC and GSH. On the basis of the results of the present proteomic analysis, PLB can efficiently regulate the Nrf2-mediated oxidative stress response signaling pathway. Nrf2, also known as Nfe2I2, is a nuclear factor that controls the expression of various detoxifying enzymes, ROS elimination proteins, drug transporters, and antiapoptotic proteins. Normally, Nrf2 is suppressed in the cytoplasm by combination with Keap1 and Cullin3. Once exposed to the ARE-mediated inducers, Nrf2 will translocate to the nucleus where it forms a heterodimer with a small Maf protein and binds to other nuclear factors and initiates the transcription of antioxidative genes.51,52 The Western blotting results showed that the ratio of n-Nrf2 to c-Nrf2 was significantly decreased. Furthermore, the downstream effectors NQO1, GST, and HSP90 were examined. These effectors are involved in ROS elimination and detoxification.81–83 Results showed that PLB can decrease the expression level of NQO1, GST, and HSP90 in SCC25 cells. We can carefully draw a conclusion that PLB can kill TSCC cells via ROS generation and attenuation of ROS elimination factors. Finally, we employed the ROS scavengers NAC and GSH to further examine the effect of PLB in cell cycle arrest, apoptosis induction, EMT inhibition, and stemness attenuation. Interestingly, results showed that the cell cycle arresting, apoptosis inducing, EMT inhibiting, and stemness-attenuating effect of PLB can be efficiently abolished by NAC and GSH. This highlights the ROS-generation-inducing effect of PLB as an upstream effector to regulate other downstream biological activities such as cell cycle arrest and apoptosis.
In summary, the quantitative SILAC-based proteomic approach showed that PLB inhibited cell proliferation, activated death receptor-mediated apoptotic pathway, remodeled epithelial adherens junctions pathway, and increased intracellular level of ROS via Nrf2-mediated oxidative stress response signaling pathway in human SCC25 cells involving a number of key functional proteins. This study may provide a clue to fully identify the molecular targets and elucidate the underlying mechanisms of PLB in the treatment of TSCC.
Acknowledgments
The authors appreciate the financial support by the National Natural Science Foundation of China (grant number: 81560440) and the Key Project of Chinese Medicine Research Plan of Jiangxi province (grant number: 2013Z010).
Disclosure
The authors report no conflicts of interest in the work.
References
Siegel RL, Miller KD, Jemal A. Cancer statistics, 2015. CA Cancer J Clin. 2015;65(1):5–29. | ||
Li R, Koch WM, Fakhry C, Gourin CG. Distinct epidemiologic characteristics of oral tongue cancer patients. Otolaryngol Head Neck Surg. 2013;148(5):792–796. | ||
Joseph LJ, Goodman M, Higgins K, et al. Racial disparities in squamous cell carcinoma of the oral tongue among women: a SEER data analysis. Oral Oncol. 2015;51(6):586–592. | ||
Markopoulos AK. Current aspects on oral squamous cell carcinoma. Open Dent J. 2012;6:126–130. | ||
Dogan E, Cetinayak HO, Sarioglu S, Erdag TK, Ikiz AO. Patterns of cervical lymph node metastases in oral tongue squamous cell carcinoma: implications for elective and therapeutic neck dissection. J Laryngol Otol. 2014;128(3):268–273. | ||
Liu F, Kong X, Lv L, Gao J. TGF-beta1 acts through miR-155 to down-regulate TP53INP1 in promoting epithelial-mesenchymal transition and cancer stem cell phenotypes. Cancer Lett. 2015;359(2):288–298. | ||
Donnenberg VS, Donnenberg AD. Stem cell state and the epithelial-to-mesenchymal transition: implications for cancer therapy. J Clin Pharmacol. 2015;55(6):603–619. | ||
Perdigao-Henriques R, Petrocca F, Altschuler G, et al. miR-200 promotes the mesenchymal to epithelial transition by suppressing multiple members of the Zeb2 and Snail1 transcriptional repressor complexes. Oncogene. Epub 2015. | ||
Brabletz T. EMT and MET in metastasis: where are the cancer stem cells? Cancer Cell. 2012;22(6):699–701. | ||
Morrison SJ, Kimble J. Asymmetric and symmetric stem-cell divisions in development and cancer. Nature. 2006;441(7097):1068–1074. | ||
Martin-Belmonte F, Perez-Moreno M. Epithelial cell polarity, stem cells and cancer. Nat Rev Cancer. 2012;12(1):23–38. | ||
Boumahdi S, Driessens G, Lapouge G, et al. SOX2 controls tumour initiation and cancer stem-cell functions in squamous-cell carcinoma. Nature. 2014;511(7508):246–250. | ||
Chiou SH, Yu CC, Huang CY, et al. Positive correlations of Oct-4 and Nanog in oral cancer stem-like cells and high-grade oral squamous cell carcinoma. Clin Cancer Res. 2008;14(13):4085–4095. | ||
Molofsky AV, Pardal R, Iwashita T, et al. Bmi-1 dependence distinguishes neural stem cell self-renewal from progenitor proliferation. Nature. 2003;425(6961):962–967. | ||
Kagias K, Ahier A, Fischer N, Jarriault S. Members of the NODE (Nanog and Oct4-associated deacetylase) complex and SOX-2 promote the initiation of a natural cellular reprogramming event in vivo. Proc Natl Acad Sci U S A. 2012;109(17):6596–6601. | ||
Stuckey DW, Shah K. Stem cell-based therapies for cancer treatment: separating hope from hype. Nat Rev Cancer. 2014;14(10):683–691. | ||
Padhye S, Dandawate P, Yusufi M, Ahmad A, Sarkar FH. Perspectives on medicinal properties of plumbagin and its analogs. Med Res Rev. 2012;32(6):1131–1158. | ||
Sung B, Oyajobi B, Aggarwal BB. Plumbagin inhibits osteoclastogenesis and reduces human breast cancer-induced osteolytic bone metastasis in mice through suppression of RANKL signaling. Mol Cancer Ther. 2012;11(2):350–359. | ||
Sinha S, Pal K, Elkhanany A, et al. Plumbagin inhibits tumorigenesis and angiogenesis of ovarian cancer cells in vivo. Int J Cancer. 2013;132(5):1201–1212. | ||
Pan ST, Qin Y, Zhou ZW, et al. Plumbagin induces G2/M arrest, apoptosis, and autophagy via p38 MAPK- and PI3K/Akt/mTOR-mediated pathways in human tongue squamous cell carcinoma cells. Drug Des Devel Ther. 2015;9:1601–1626. | ||
Li YC, He SM, He ZX, et al. Plumbagin induces apoptotic and autophagic cell death through inhibition of the PI3K/Akt/mTOR pathway in human non-small cell lung cancer cells. Cancer Lett. 2014;344(2):239–259. | ||
Sandur SK, Ichikawa H, Sethi G, Ahn KS, Aggarwal BB. Plumbagin (5-hydroxy-2-methyl-1,4-naphthoquinone) suppresses NF-kappaB activation and NF-kappaB-regulated gene products through modulation of p65 and IkappaBalpha kinase activation, leading to potentiation of apoptosis induced by cytokine and chemotherapeutic agents. J Biol Chem. 2006;281(25):17023–17033. | ||
Kuo PL, Hsu YL, Cho CY. Plumbagin induces G2-M arrest and autophagy by inhibiting the AKT/mammalian target of rapamycin pathway in breast cancer cells. Mol Cancer Ther. 2006;5(12):3209–3221. | ||
Wang F, Wang Q, Zhou ZW, et al. Plumbagin induces cell cycle arrest and autophagy and suppresses epithelial to mesenchymal transition involving PI3K/Akt/mTOR-mediated pathway in human pancreatic cancer cells. Drug Des Devel Ther. 2015;9:537–560. | ||
Zhou ZW, Li XX, He ZX, et al. Induction of apoptosis and autophagy via sirtuin1- and PI3K/Akt/mTOR-mediated pathways by plumbagin in human prostate cancer cells. Drug Des Devel Ther. 2015;9:1511–1554. | ||
Sun J, McKallip RJ. Plumbagin treatment leads to apoptosis in human K562 leukemia cells through increased ROS and elevated TRAIL receptor expression. Leuk Res. 2011;35(10):1402–1408. | ||
Xu KH, Lu DP. Plumbagin induces ROS-mediated apoptosis in human promyelocytic leukemia cells in vivo. Leuk Res. 2010;34(5):658–665. | ||
Lee JH, Yeon JH, Kim H, et al. The natural anticancer agent plumbagin induces potent cytotoxicity in MCF-7 human breast cancer cells by inhibiting a PI-5 kinase for ROS generation. PLoS One. 2012;7(9):e45023. | ||
Edelmann MJ, Shack LA, Naske CD, Walters KB, Nanduri B. SILAC-based quantitative proteomic analysis of human lung cell response to copper oxide nanoparticles. PLoS One. 2014;9(12):e114390. | ||
Zhou Q, Chaerkady R, Shaw PG, et al. Screening for therapeutic targets of vorinostat by SILAC-based proteomic analysis in human breast cancer cells. Proteomics. 2010;10(5):1029–1039. | ||
Ong SE, Mann M. A practical recipe for stable isotope labeling by amino acids in cell culture (SILAC). Nat Protoc. 2006;1(6):2650–2660. | ||
Pan ST, Zhou ZW, He ZX, et al. Proteomic response to 5,6-dimethylxanthenone 4-acetic acid (DMXAA, vadimezan) in human non-small cell lung cancer A549 cells determined by the stable-isotope labeling by amino acids in cell culture (SILAC) approach. Drug Des Devel Ther. 2015;9:937–968. | ||
Qiu JX, Zhou ZW, He ZX, et al. Plumbagin elicits differential proteomic responses mainly involving cell cycle, apoptosis, autophagy, and epithelial-to-mesenchymal transition pathways in human prostate cancer PC-3 and DU145 cells. Drug Des Devel Ther. 2015;9:349–417. | ||
Qin Y, Zhou ZW, Pan ST, et al. Graphene quantum dots induce apoptosis, autophagy, and inflammatory response via p38 mitogen-activated protein kinase and nuclear factor-kappaB mediated signaling pathways in activated THP-1 macrophages. Toxicology. 2015;327:62–76. | ||
Thiery JP, Lim CT. Tumor dissemination: an EMT affair. Cancer Cell. 2013;23(3):272–273. | ||
Stebbing J, Filipovic A, Giamas G. Claudin-1 as a promoter of EMT in hepatocellular carcinoma. Oncogene. 2013;32(41):4871–4872. | ||
Furuse M, Hirase T, Itoh M, et al. Occludin: a novel integral membrane protein localizing at tight junctions. J Cell Biol. 1993;123(6 Pt 2):1777–1788. | ||
Furuse M, Itoh M, Hirase T, et al. Direct association of occludin with ZO-1 and its possible involvement in the localization of occludin at tight junctions. J Cell Biol. 1994;127(6 Pt 1):1617–1626. | ||
Haskins J, Gu L, Wittchen ES, Hibbard J, Stevenson BR. ZO-3, a novel member of the MAGUK protein family found at the tight junction, interacts with ZO-1 and occludin. J Cell Biol. 1998;141(1):199–208. | ||
Umeda K, Ikenouchi J, Katahira-Tayama S, et al. ZO-1 and ZO-2 independently determine where claudins are polymerized in tight-junction strand formation. Cell. 2006;126(4):741–754. | ||
Gheldof A, Berx G. Cadherins and epithelial-to-mesenchymal transition. Prog Mol Biol Transl Sci. 2013;116:317–336. | ||
Janda E, Nevolo M, Lehmann K, et al. Raf plus TGFbeta-dependent EMT is initiated by endocytosis and lysosomal degradation of E-cadherin. Oncogene. 2006;25(54):7117–7130. | ||
Zhang X, Liu G, Kang Y, et al. N-cadherin expression is associated with acquisition of EMT phenotype and with enhanced invasion in erlotinib-resistant lung cancer cell lines. PLoS One. 2013;8(3):e57692. | ||
Polakis P. More than one way to skin a catenin. Cell. 2001;105(5):563–566. | ||
Eger A, Stockinger A, Park J, et al. Beta-Catenin and TGFbeta signalling cooperate to maintain a mesenchymal phenotype after FosER-induced epithelial to mesenchymal transition. Oncogene. 2004;23(15):2672–2680. | ||
Stemmer V, de Craene B, Berx G, Behrens J. Snail promotes Wnt target gene expression and interacts with beta-catenin. Oncogene. 2008;27(37):5075–5080. | ||
Koo BS, Lee SH, Kim JM, et al. Oct4 is a critical regulator of stemness in head and neck squamous carcinoma cells. Oncogene. 2015;34(18):2317–2324. | ||
Sarkar A, Hochedlinger K. The sox family of transcription factors: versatile regulators of stem and progenitor cell fate. Cell Stem Cell. 2013;12(1):15–30. | ||
Hayashi Y, Caboni L, Das D, et al. Structure-based discovery of NANOG variant with enhanced properties to promote self-renewal and reprogramming of pluripotent stem cells. Proc Natl Acad Sci U S A. 2015;112(15):4666–4671. | ||
Lessard J, Sauvageau G. Bmi-1 determines the proliferative capacity of normal and leukaemic stem cells. Nature. 2003;423(6937):255–260. | ||
DeNicola GM, Karreth FA, Humpton TJ, et al. Oncogene-induced Nrf2 transcription promotes ROS detoxification and tumorigenesis. Nature. 2011;475(7354):106–109. | ||
Zhang Y, Gordon GB. A strategy for cancer prevention: stimulation of the Nrf2-ARE signaling pathway. Mol Cancer Ther. 2004;3(7):885–893. | ||
Tsurutani J, West KA, Sayyah J, Gills JJ, Dennis PA. Inhibition of the phosphatidylinositol 3-kinase/Akt/mammalian target of rapamycin pathway but not the MEK/ERK pathway attenuates laminin-mediated small cell lung cancer cellular survival and resistance to imatinib mesylate or chemotherapy. Cancer Res. 2005;65(18):8423–8432. | ||
Zhao G, Cai C, Yang T, et al. MicroRNA-221 induces cell survival and cisplatin resistance through PI3K/Akt pathway in human osteosarcoma. PLoS One. 2013;8(1):e53906. | ||
Aziz MH, Dreckschmidt NE, Verma AK. Plumbagin, a medicinal plant-derived naphthoquinone, is a novel inhibitor of the growth and invasion of hormone-refractory prostate cancer. Cancer Res. 2008;68(21):9024–9032. | ||
Wang CC, Chiang YM, Sung SC, et al. Plumbagin induces cell cycle arrest and apoptosis through reactive oxygen species/c-Jun N-terminal kinase pathways in human melanoma A375.S2 cells. Cancer Lett. 2008;259(1):82–98. | ||
Yeh CC, Hsu CH, Shao YY, et al. Integrated SILAC and iTRAQ quantitative proteomic analysis identifies galectin-1 as a potential biomarker for predicting sorafenib resistance in liver cancer. Mol Cell Proteomics. 2015;14(6):1527–1545. | ||
Dolai S, Xu Q, Liu F, Molloy MP. Quantitative chemical proteomics in small-scale culture of phorbol ester stimulated basal breast cancer cells. Proteomics. 2011;11(13):2683–2692. | ||
Geiger T, Cox J, Ostasiewicz P, Wisniewski JR, Mann M. Super-SILAC mix for quantitative proteomics of human tumor tissue. Nat Methods. 2010;7(5):383–385. | ||
Everley PA, Krijgsveld J, Zetter BR, Gygi SP. Quantitative cancer proteomics: stable isotope labeling with amino acids in cell culture (SILAC) as a tool for prostate cancer research. Mol Cell Proteomics. 2004;3(7):729–735. | ||
Hunter T. Protein kinases and phosphatases: the yin and yang of protein phosphorylation and signaling. Cell. 1995;80(2):225–236. | ||
Evan GI, Vousden KH. Proliferation, cell cycle and apoptosis in cancer. Nature. 2001;411(6835):342–348. | ||
Reed JC. Apoptosis-based therapies. Nat Rev Drug Discov. 2002;1(2):111–121. | ||
Boehning D, Patterson RL, Sedaghat L, et al. Cytochrome c binds to inositol (1,4,5) trisphosphate receptors, amplifying calcium-dependent apoptosis. Nat Cell Biol. 2003;5(12):1051–1061. | ||
Yang J, Liu X, Bhalla K, et al. Prevention of apoptosis by Bcl-2: release of cytochrome c from mitochondria blocked. Science. 1997;275(5303):1129–1132. | ||
Pobezinskaya YL, Liu Z. The role of TRADD in death receptor signaling. Cell Cycle. 2012;11(5):871–876. | ||
Park YC, Ye H, Hsia C, et al. A novel mechanism of TRAF signaling revealed by structural and functional analyses of the TRADD-TRAF2 interaction. Cell. 2000;101(7):777–787. | ||
Zlotorynski E. Apoptosis. DR5 unfolds ER stress. Nat Rev Mol Cell Biol. 2014;15(8):498–499. | ||
Biddle A, Mackenzie IC. Cancer stem cells and EMT in carcinoma. Cancer Metastasis Rev. 2012;31(1–2):285–293. | ||
Okada T, Sinha S, Esposito I, et al. The Rho GTPase Rnd1 suppresses mammary tumorigenesis and EMT by restraining Ras-MAPK signalling. Nat Cell Biol. 2015;17(1):81–94. | ||
Kudo-Saito C, Shirako H, Takeuchi T, Kawakami Y. Cancer metastasis is accelerated through immunosuppression during Snail-induced EMT of cancer cells. Cancer Cell. 2009;15(3):195–206. | ||
Ansieau S, Bastid J, Doreau A, et al. Induction of EMT by twist proteins as a collateral effect of tumor-promoting inactivation of premature senescence. Cancer Cell. 2008;14(1):79–89. | ||
Waerner T, Alacakaptan M, Tamir I, et al. ILEI: a cytokine essential for EMT, tumor formation, and late events in metastasis in epithelial cells. Cancer Cell. 2006;10(3):227–239. | ||
Qureshi R, Arora H, Rizvi MA. EMT in cervical cancer: its role in tumour progression and response to therapy. Cancer Lett. 2015;356(2 Pt B):321–331. | ||
De Craene B, Berx G. Regulatory networks defining EMT during cancer initiation and progression. Nat Rev Cancer. 2013;13(2):97–110. | ||
Rhim AD, Mirek ET, Aiello NM, et al. EMT and dissemination precede pancreatic tumor formation. Cell. 2012;148(1–2):349–361. | ||
Clevers H. The cancer stem cell: premises, promises and challenges. Nat Med. 2011;17(3):313–319. | ||
Mani SA, Guo W, Liao MJ, et al. The epithelial-mesenchymal transition generates cells with properties of stem cells. Cell. 2008;133(4):704–715. | ||
Ocana OH, Corcoles R, Fabra A, et al. Metastatic colonization requires the repression of the epithelial-mesenchymal transition inducer Prrx1. Cancer Cell. 2012;22(6):709–724. | ||
Schieber MS, Chandel NS. ROS links glucose metabolism to breast cancer stem cell and EMT phenotype. Cancer Cell. 2013;23(3):265–267. | ||
Matsui A, Ikeda T, Enomoto K, et al. Increased formation of oxidative DNA damage, 8-hydroxy-2′-deoxyguanosine, in human breast cancer tissue and its relationship to GSTP1 and COMT genotypes. Cancer Lett. 2000;151(1):87–95. | ||
Beck R, Dejeans N, Glorieux C, et al. Hsp90 is cleaved by reactive oxygen species at a highly conserved N-terminal amino acid motif. PLoS One. 2012;7(7):e40795. | ||
Li L, Dong H, Song E, et al. Nrf2/ARE pathway activation, HO-1 and NQO1 induction by polychlorinated biphenyl quinone is associated with reactive oxygen species and PI3K/AKT signaling. Chem Biol Interact. 2014;209:56–67. |
 © 2015 The Author(s). This work is published and licensed by Dove Medical Press Limited. The full terms of this license are available at https://www.dovepress.com/terms.php and incorporate the Creative Commons Attribution - Non Commercial (unported, v3.0) License.
By accessing the work you hereby accept the Terms. Non-commercial uses of the work are permitted without any further permission from Dove Medical Press Limited, provided the work is properly attributed. For permission for commercial use of this work, please see paragraphs 4.2 and 5 of our Terms.
© 2015 The Author(s). This work is published and licensed by Dove Medical Press Limited. The full terms of this license are available at https://www.dovepress.com/terms.php and incorporate the Creative Commons Attribution - Non Commercial (unported, v3.0) License.
By accessing the work you hereby accept the Terms. Non-commercial uses of the work are permitted without any further permission from Dove Medical Press Limited, provided the work is properly attributed. For permission for commercial use of this work, please see paragraphs 4.2 and 5 of our Terms.