")
Back to Journals » Drug Design, Development and Therapy » Volume 13
Physicochemical properties and drug-release mechanisms of dual-release bilayer tablet containing mirabegron and fesoterodine fumarate
Authors Lee HG , Park YS , Jeong JH , Kwon YB, Shin DH , Kim JY, Rhee YS, Park ES, Kim DW, Park CW
Received 16 April 2019
Accepted for publication 1 July 2019
Published 23 July 2019 Volume 2019:13 Pages 2459—2474
DOI https://doi.org/10.2147/DDDT.S212520
Checked for plagiarism Yes
Review by Single anonymous peer review
Peer reviewer comments 2
Editor who approved publication: Dr Qiongyu Guo
Hong-Goo Lee,*,1 Yun-Sang Park,*,1 Jin-Hyuk Jeong,1 Yong-Bin Kwon,1 Dae Hwan Shin,1 Ju-Young Kim,2 Yun-Seok Rhee,3 Eun-Seok Park,4 Dong-Wook Kim,5 Chun-Woong Park1
1College of Pharmacy, Chungbuk National University, Cheongju 28160, South Korea; 2College of Pharmacy, Woosuk University, Wanju 55338, South Korea; 3College of Pharmacy and Research Institute of Pharmaceutical Sciences, Gyeongsang National University, Jinju 52828, South Korea; 4School of Pharmacy, Sungkyunkwan University, Suwon 16419, South Korea; 5Department of Pharmaceutical Engineering, Cheongju University, Cheongju 28530, South Korea
*These authors contributed equally to this work
Introduction: In this study, a dual release bi-layer tablet containing Fesoterodine fumarate (Fst) 5 mg and Mirabegron (Mrb) 50 mg was prepared to investigate the different release behavior of each drug in bilayer tablet. The bilayer tablet was prepared based on monolayer-tablet formulation of each drug.
Methods: The optimized bi-layer tablet showed an in vitro dissolution profile similar to commercial reference tablets Toviaz and Betmiga, based on a satisfactory similarity factor. Drug-release kinetics of each drug in the bilayer tablet were evaluated based on dissolution profiles. Drug-release behavior was evaluated by observing the surface of each layer by scanning electron microscopy and measuring the changes in weight and volume of the tablet during dissolution. Drug transfer between each layer was also investigated by Fourier -transform infrared spectroscopic imaging by observing the cross-section of the bilayer tablet cut vertically during dissolution.
Results: The release of Fst was well suited for the Higuchi model, and the release of Mrb was well suited for the Hixson-crowell model. Compared with dissolution rate of each monolayer tablet, that of Fst in the bilayer tablet was slightly reduced (5%), but the dissolution rate of Mrb in bilayer tablet was dramatically decreased (20%). Also, a drug-release study confirmed that polymer swelling was dominant in Fst layer compared with polymer erosion, and degradation was dominant in MRB layer. Fourier-transform infrared imaging and 3-D image reconstruction showed that drug transfer in the bilayer tablet correlates with the results of drug-release behavior.
Conclusion: These findings are expected to provide scientific insights in the development of a dual-release bilayer drug-delivery system for Fst and Mrb.
Keywords: mirabegron, fesoterodine fumarate, swelling property, erosion property, bilayer tablet, FT-IR imaging
Introduction
Overactive bladder (OAB) is a complex of lower urinary–tract storage symptoms with or without urgency incontinence. It is often accompanied by frequency and nocturia in the absence of proven infection or other pathology.1 Antimuscarinic agents are the mainstay of oral pharmacotherapy for OAB. However, persistent treatment is limited by insufficient efficacy and adverse events associated with antimuscarinic agents. In this study, fesoterodine fumarate (Fst), frequently used in OAB, was selected as an antimuscarinic agent. Approval of the β3-adrenoceptor agonist mirabegron (Mrb) added a new class of pharmacotherapy for OAB.2 Due to their different mechanisms of action, combining a β3-adrenoceptor agonist with an antimuscarinic agent may improve efficacy in OAB treatment. Fixed-dose combination is attractive not only due to its efficacy but also due to its high patient compliance. Fixed-dose combination of Fst and Mrb may deliver improved tolerability compared to monotherapy without compromising efficacy. The potential of combination therapy to modulate bladder function has already been demonstrated in preclinical models.2–4
Bilayer tablets are frequently used for fixed-dose combinations containing two active pharmaceutical ingredients (APIs). The fundamental structure of bilayer tablets allows a minimum degree of physical contact between APIs to avoid unwanted chemical reactivity.5–7 However, bilayer tablets containing Fst and Mrb have not been actively studied. One reason for the lack of research is that both drugs require extended release for optimal therapeutic effect.8,9 bilayer tablets have many problems in terms of controlled drug release. First, one side might be clogged with another drug layer, thereby inhibiting the dissolution rate. Second, the drug might move to another layer, and different release mechanisms of another drug layer can affect diffusion and dissolution rates of the drug. For example, drug release can be delayed by swelling of the other layer. A polymer matrix might also collapse after the other layer is eroded to a critical degree, thus delaying drug release in initial dissolution and causing rapid drug release in the latter dissolution.10–12
To investigate drug-release profiles, many researchers use the US Pharmacopeia (USP) to monitor the amount of drug released from the tablet to aqueous solution. This method gives a very useful means to characterize the release of APIs. However, it provides limited information on drug-release kinetics. Therefore, these studies are often combined with mathematical modeling to demonstrate the underlying drug-release mechanism.13,14 Several studies have been conducted during tablet dissolution to investigate such drug-release behavior as swelling, erosion, and degradation in each layer of bilayer tablets.10,15
Tracking and visualizing drug molecules is another way to reveal the release behavior of drugs in bilayer tablets. Approaches to visualize drug molecules in tablets include nuclear magnetic resonance and Fourier-transform infrared (FTIR) imaging. Both techniques can be used to monitor and investigate dissolved tablets. However, chemical specificity, spatial resolution, and acquisition times are very low and limited in nuclear magnetic resonance imaging.16,17 FTIR spectroscopic imaging reveals high resolution of chemical nature, thus allowing for a much broader range of drug analysis. In addition, FTIR images have the potential to be used for relatively high spatial resolution and accurate quantification. The short acquisition time required for FTIR imaging also allows time resolution in minutes. Based on these advantages, FTIR spectroscopic imaging is well suited for polymer wetting, swelling, and erosion studies and drug transfer between each layer of bilayer tablets.18,19
While previous studies on bilayer tablets have focused on delayed release, immediate release, stability, and formulation,20–23 this study attempted to investigate the effect of different release behavior on the release of bilayer tablets. The objective of this study was to prepare and evaluate bilayer tablets based on monolayer tablets with different release behavior. Monolayer tablets containing Fst 4 mg were prepared with a dissolution profile equivalent to the marketed tablet Toviaz and monolayer tablets containing Mrb 50 mg were prepared with a dissolution profile equivalent to the marketed tablet Betmiga. Morphology of bilayer tablets during dissolution for predetermined time was observed by camera images and scanning electron microscopy (SEM). Swelling and erosion properties of each monolayer tablet were studied and the effects of different release behavior in each monolayer evaluated in bilayer tablets. Furthermore, drug transfer between each layer in bilayer tablets was investigated using FTIR imaging and image reconstruction with ImageJ.
Methods
Materials
Fst and Mrb were purchased from Lupin Pharmaceuticals (Nagpur, India). Erythritol and magnesium stearate were purchased from Daejung Chemicals and Metals (Siheung, South Korea). Ludipress and Kolliphor P188 were purchased from BASF (Ludwigshafen, Germany). Hydroxypropyl methylcellulose (HPMC) 4,000 cP (metolose 90 SH-4000 SR) and HPMC 100,000 cP (metolose 90 SH-100000 SR) were obtained from Shin-Etsu Chemical (Tokyo, Japan). Xanthan gum (Xantural 180) was purchased from CP Kelco(Atlanta, GA, USA). Polyethylene oxide (PEO; Polyox WSR 301 LEO NF) was bought from Colorcon Asia Pacific (Singapore). Glyceryl behenate (Compritol 888 ATO) was provided by Gattefossé (Saint-Priest, France). Talc and ferric (III) oxide red were purchased from Samchun Chemical (Pyeongtaek, South Korea). Hydroxypropyl cellulose (HPC; Klucel JF Pharm) was obtained from Ashland (Covington, KY, USA). Low-substituted HPC (L-HPC) LH22 type was provided by Huzhou Zhanwang Tianming Pharmaceutical (Zhejiang, China). Potassium phosphate and sodium hydroxide were purchased from Sigma-Aldrich. HPLC-grade solvents were used for analysis.
Preparation of monolayer tablet containing Fst
Formulation of the Fst monolayer tablet is shown in Table 1. It was prepared by wet granulation through trial and error. Fst and erythritol sifted through a 355 µm sieve were kneaded with an adequate amount of distilled water. This damp mass was sifted through an 850 µm sieve, dried at 60°C for 3 hours, and resifted through the 850 µm sieve. Drieds granule were then blended with Ludipress, HPMC, and Compritol. The mixture was then finally mixed with talc. Preparation of tablets was conducted with a Carver hydraulic pressusing an 11 mm oblong punch and die set. Tablets were compressed at 1,000 kg.
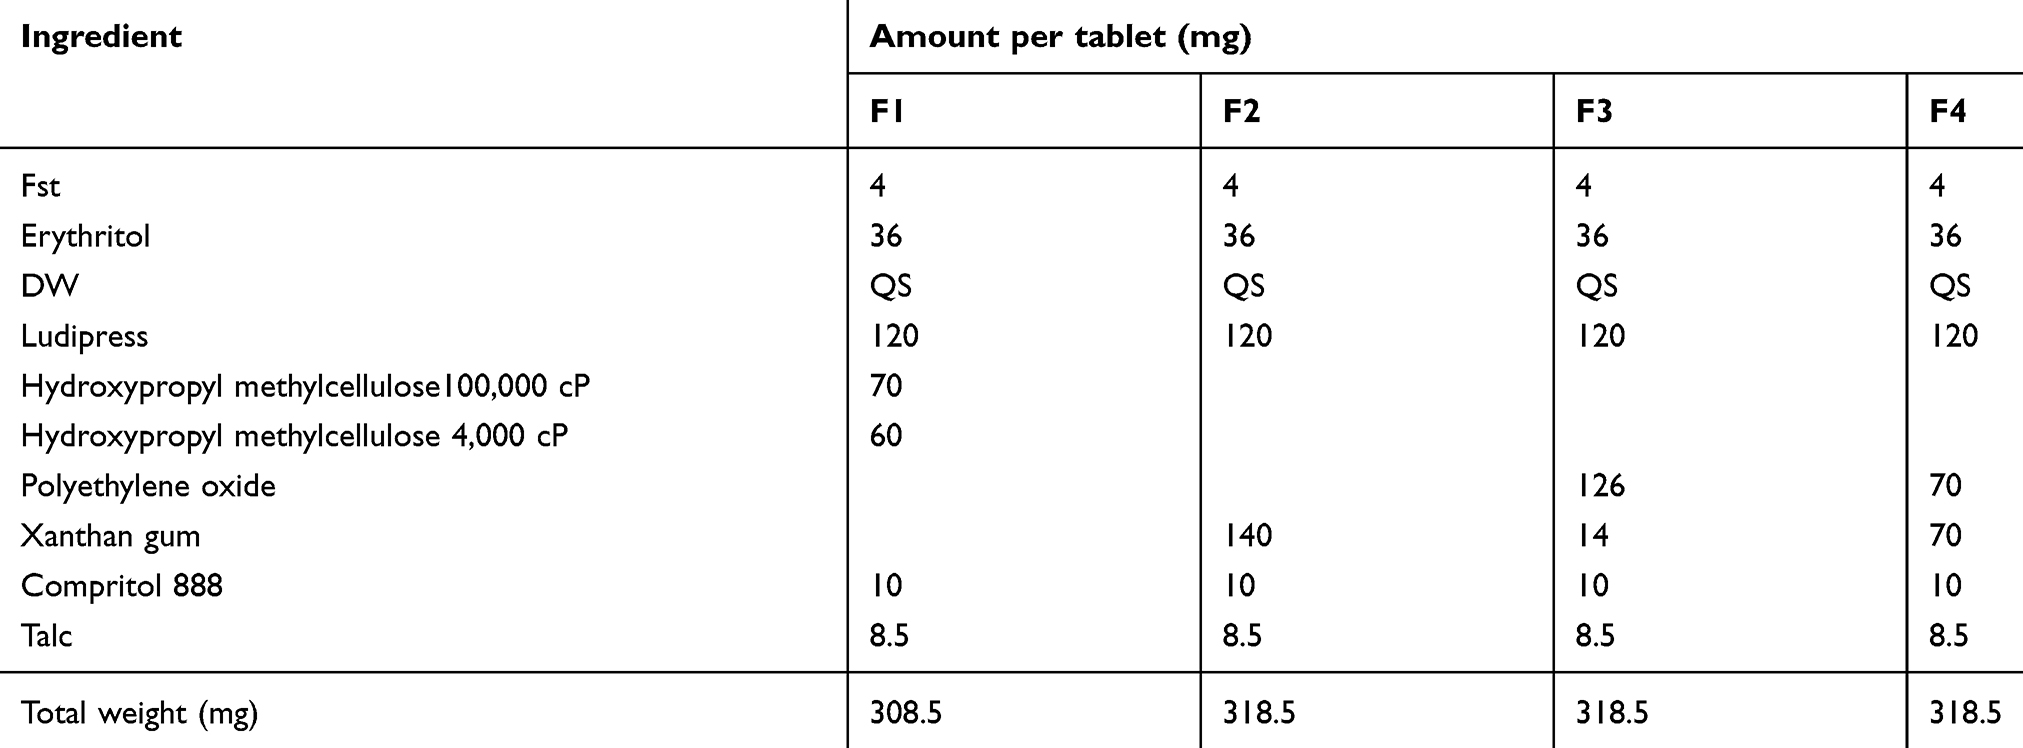 |
Table 1 Formulation (mg) of fesoterodine fumarate (Fst) extended-release monolayer tablet |
Preparation of monolayer tablet containing Mrb
Formulation of the Mrb monolayer tablet is shown in Table 2. It was prepared by direct compression through trial and error. PEO and HPC were prepared with extended-release agents. Kollipor P188 was prepared with a plasticizing agent to infiltrate the tablet. L-HPC was used as a disintegrant or binder. Ferric (III) oxide red was used as colorant to observe release behavior well. Preparation of tablets was conducted with the Carver hydraulic press using an 11 mm oblong punch and die set. Tablets were compressed at 1,000 kg.
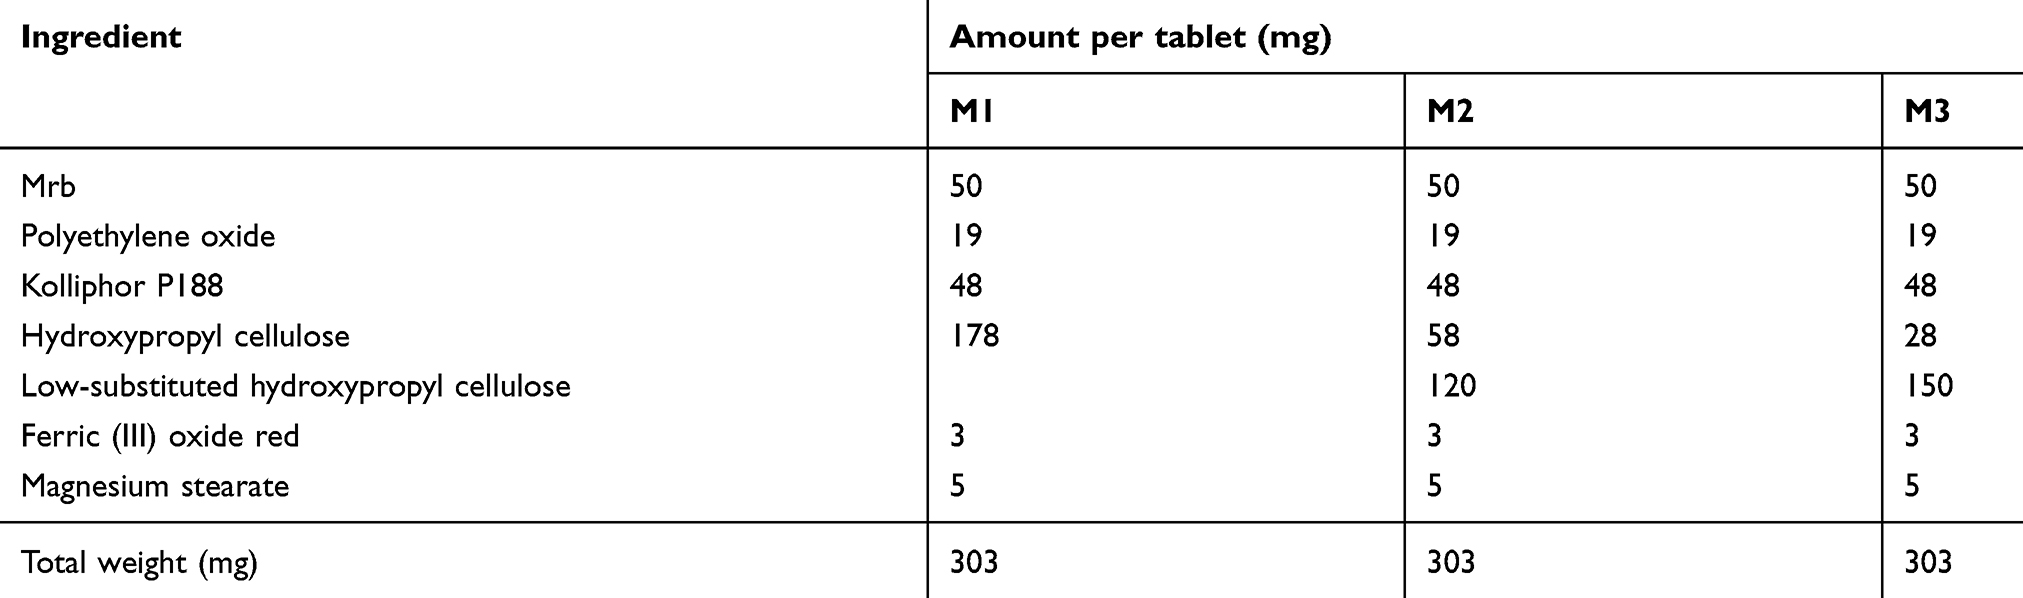 |
Table 2 Formulation (mg) of mirabegron (Mrb) extended-release monolayer tablet |
Preparation of bilayer tablet containing Fst and Mrb
The bilayer tablet was prepared by compressing the Fst formulation and the Mrb formulation together. First, the Mrb formulation was compressed at 500 kg using the Carver hydraulic press with a 14 mm oblong punch and die set. Then, the Fst formulation was added to the die, which was then compressed at 1,000 kg.
In vitro release
In vitro release studies were carried out based on USP dissolution with some modification. Every release study was performed using USP dissolution-test apparatus II (Vision 8 Elite, Hanson, Los Angeles, CA, USA). PBS (pH 6.8) was prepared by adding 6.81 g of potassium phosphate monobasic and 0.9 g of sodium hydroxide to 1 L of distilled water and used as dissolution medium for simulated intestinal fluid without enzymes.
To evaluate the release of Fst, Fst monolayer tablets and reference tablets were immersed in 900 mL dissolution medium and maintained at 37°C with paddle speed of 75 rpm. Samples were taken at 0.5, 1, 2, 4, 6, 8, 10, 12, and 20 hours. To evaluate the release of Mrb, Mrb monolayer tablets and reference tablets were immersed in dissolution medium and maintained at 37°C with paddle speed of 100 rpm. Samples were taken at 1, 3, 5, 7, and 8.5 hours. To evaluate the dissolution rate of bilayer tablets, Fst–Mrb bilayer tablets and reference tablets were immersed in 900 mL dissolution medium and maintained at 37°C with paddle speed of 75 rpm. The paddle speed was chosen to minimize the effect of paddle speed on the dissolution rate of both drugs in bilayer tablets. Samples were taken at 0.5, 1, 2, 4, 6, 8, 10, 12, and 20 hours. All tablets were sunk using a sinker. Samples (5 mL) were collected from all dissolution vessels and filtered through a 0.45 μm polyvinylidene difluoride syringe with glass microfiber filter (Whatman; GE Healthcare, Little Chalfont, UK). These samples were diluted with mobile phase and then analyzed by HPLC.
Drug-release kinetics
Release profiles of optimal bilayer tablets were obtained and the release mechanism was investigated using three kinetic models: zero-order, first-order, Higuchi, and Hixson–Crowell.
The zero-order equation24 used was:

where Q is the amount of drug released at time t and ko the zero-order release-rate constant.
The Higuchi model25 equation used was:

where Mt and M∞ are absolute cumulative amounts of drug released at time t and infinity, respectively, and kH the release-rate constant.
The Hixson–Crowell model26 equation used was:
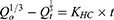
where Qt is the amount of drug released in time t, Qo the initial amount of the drug in the tablet, and KHC the release-rate constant.
Similarity factor
Dissolution profiles of monolayer tablets and bilayer tablets were compared with those of reference tablets using a similarity factor (f2):
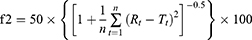
where n is the number of sampling time points and Rt and Tt percentages of cumulative drug release at time t of reference and test samples, respectively. Dissolution profiles of test samples were considered similar to those of the reference samples if f2>50.
Morphology
Camera images
After dissolution for 60 and 240 minutes, bilayer tablets were removed from dissolution vessels and lightly blotted with filter paper to remove surface medium. The initial tablet and the tablet that was being released were captured with a DSLR (digital single-lens reflex) camera (EOS 80D; Canon, Tokyo, Japan) at a certain distance. The length direction of tablets was set forward to observe the overall dissolution behavior of bilayer tablets.
SEM images
After dissolution for predetermined times — 0, 60, 240, and 480 minutes for the Fst layer and 0, 30, 60, and 240 minutes for the Mrb layer — bilayer tablets were removed from dissolution vessels, frozen at −75°C in a deep-freezer for 24 hours, and then lyophilized at −50°C, 0.07 mBar for 72 hours using a freeze-dryer (FreeZone 2.5; Labconco, Kansas City, MO, USA). After freeze-drying, the bilayer tablet was cut vertically down the center to observe the cross section. Cross sections of tablets were coated with a gold film (600 Å) using sputter deposition and observed with SEM at a same magnification (Ultra Plus; Carl Zeiss, Oberkochen, Germany).
Swelling and erosion
Swelling and erosion properties are important variables in drug release in bilayer tablets. Swelling is a relevant mechanism in delaying drug release, and erosion is also considered a desirable mechanism in drug delivery.27 After preparing optimal bilayer tablets, swelling and erosion were investigated for each monolayer tablet using equilibrium or gravimetric analysis.13,28–32
Water uptake and remaining rate
Monolayer tablets (n=3) were weighted at time t=0 (Winitial), placed in the vessel of apparatus II with sinkers, and then immersed in 900 mL PBS (pH 6.8) with paddle speed of 75 rpm at 37°C. After 2, 4, 8, and 20 hours for F1 and 2 and 4 hours for M3, monolayer tablets were removed from dissolution vessels, lightly blotted with filter paper to remove surface medium, then reweighed (Wwet). Water uptake was calculated:
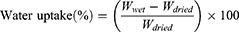
where Wdried is the weight after drying at 60°C in a drying oven until a constant weight had been achieved.
Tablet erosion at each time point was calculated from:
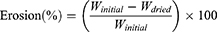
The percentage of the tablet remaining after erosion was calculated:

Tablet volume
Tablet volume was assessed by measuring the three diameters of each monolayer tablet (n=3) during dissolution for predetermined times to investigate swelling and erosion properties in detail. After 2, 4, 8, and 20 hours for F1 and 2 and 4 hours for M3, monolayer tablets were removed from vessels and lightly blotted with filter paper to remove surface medium. Tablet length, width, and height were then measured with a caliper (Digimatic CD-20APX, Mitutoyo, Kawasaki, Japan).
FTIR imaging
Attenuated total-reflection FTIR spectroscopy (Agilent Technologies) was performed in the range of 500–4,000 cm−1 using a Cary670 (main bench) and Cary620 (microscope). FTIR spectra of drug, excipients, and physical mixture in each layer were obtained and peaks that could trace the drug molecule identified. To confirm the effect of freeze-drying, physical mixtures of each layer were also evaluated after freeze-drying by FTIR. FTIR imaging was performed with the same instrument.17,33,34 After dissolution for predetermined times — 30, 240, and 480 minutes for both layers — bilayer tablets were removed from dissolution vessels, frozen at −75°C in a deep-freezer for 24 hours, then lyophilized at −50°C, 0.07 mBar for 72 hours with a freeze-dryer (FreeZone 2.5; Labconco). After freeze-drying, bilayer tablet was cut vertically down the center to observe the cross section. The outline of the cross-sectioned layer was observed under an IR field of view of 325×325 and IR pixel size of 5.5×5.5. Each image was analyzed using ImageJ (version 1.51j8) with Color Inspector 3-D version 2.0 (Internationale Medieninformatik, Berlin, Germany) plug-ins and three-dimensional color space was produced, giving an 8-bit red–green–blue value for each image to easily identify the distribution of each drug molecule.
HPLC analysis
Analysis of Fst was determined using HPLC (Ultimate; Thermo Fisher Scientific, Waltham, MA, USA) with a Spherisorb S5CN 5 µm 100 Å analytical column (250×4.6 mm; Supelco, Bellefonte, PA, USA). A mobile phase of acetonitrile:water:trifluoroacetic acid (550:450:1 v:v:v) was used at a flow rate of 0.8 mL/min. Ultraviolet detection was set at 220 nm to analyze column effluent. Analysis was carried out at a temperature of 35°C. Analysis of Mrb was determined using the Ultimate with an Aegispak C18-L 5 µm 100 Å analytical column (150×4.6 mm; Young Jn Biochrom, Seongnam, South Korea). A mobile phase of acetonitrile:0.01 M potassium dihydrogen PBS (30:70 v:v) was used at a flow rate of 0.1 mL/min. Ultraviolet detection was set at 249 nm to analyze the column effluent. Analysis was carried out at a temperature of 30°C. The entire solution was filtered through a 0.45 µm membrane filter (Whatman) and degassed prior to use. Each sample (20 µL) was injected into the HPLC system for analysis.
Results and discussion
In vitro release
Fst monolayer tablets were prepared based on the formulations in Table 1. In vitro release studies was performed in PBS (pH 6.8) for 20 hours. Dissolution profiles of Fst monolayer tablets and reference tablets are presented in Figure 1. F1 was composed of two kinds of HPMC as extended-release agent. F2 was composed of xanthan gum, and F3 and F4 were composed of different ratios of xanthan gum and PEO as extended-release agent. F2, which was composed only of xanthan gum, showed the most extended release. Its dissolution rate increased as the amount of xanthan gum decreased, and the amount of PEO increased. F1, composed of two types of HPMC, showed a slightly higher dissolution rate than the reference tablets. Similarity factors were evaluated by comparing the dissolution profiles of reference tablets. Similarity factors of f1, f2, f3, and f4 compared with reference tablets were 69.7, 44.8, 72.8, and 59.1, respectively. Dissolution profiles of F1 and F3 were the most similar to those of the reference tablets.
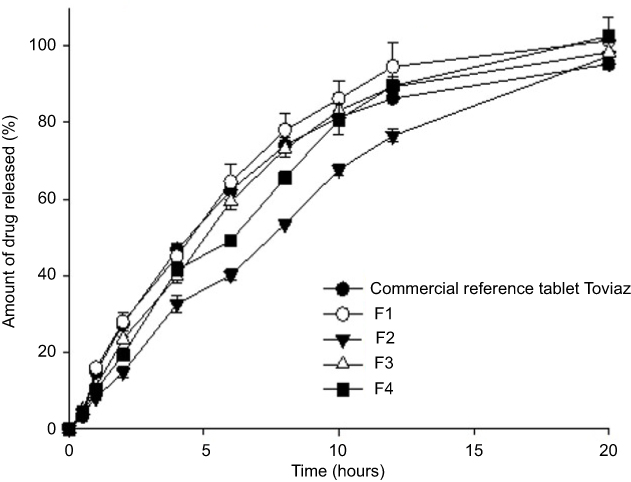 |
Figure 1 Dissolution profiles of fesoterodine fumarate monolayer tablets compared with commercial reference tablet Toviaz. Tablets were immersed in PBS (pH 6.8) for 20 hourrs (n=3, means ± SD). |
Mrb monolayer tablets were prepared based on the formulation in Table 2. In vitro release studies were performed in PBS (pH 6.8) for 8.5 hours. Dissolution profiles of Mrb monolayer tablets and reference tablets are presented in Figure 2. The Mrb formulation was prepared with different ratios of HPC and L-HPC. As the amount of HPC decreased and the amount of L-HPC increased, the dissolution rate increased. Similarity factors were evaluated by comparing dissolution profiles of reference tablets. Similarity factors of m1, m2, and m3 were 73.5, 52.0 and 36.7, respectively. Dissolution profiles of M1 were the most similar to those of the reference tablets.
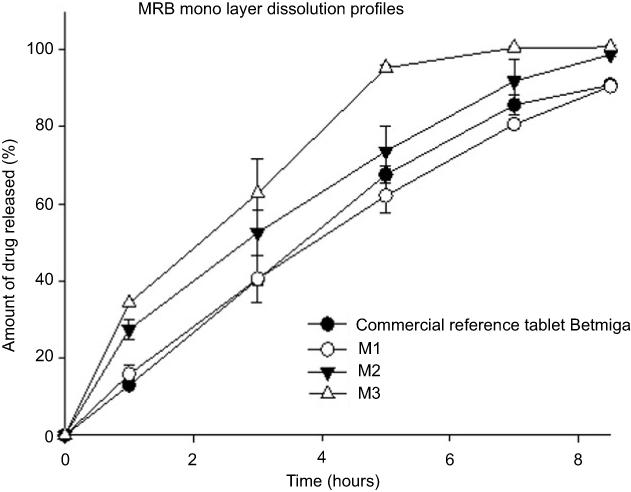 |
Figure 2 Dissolution profiles of mirabegron monolayer tablets compared with commercial reference tablet Betmiga. Tablets were immersed in PBS (pH 6.8) for 8.5 hours (n=3, means ± SD). |
Bilayer tablets were prepared based on the F1, F3, and M1 formulations with higher f2 values compared to each reference tablet. The dissolution rate of Fst in bilayer tablets slightly decreased by about 5%, and as a result bilayer tablet based on the F1 formulation showed more similar dissolution profiles compared with reference tablets than bilayer tablets based on the F3 formulation. The dissolution rate of Mrb in bilayer tablets decreased by about 20%. For this reason, contrary to dissolution profiles of monolayer tablets, bilayer tablets based on the M3 formulation showed more similar dissolution profiles with reference tablets than bilayer tablet based on the M1 formulation. Dissolution profiles of optimized bilayer tablets (F1-M3) and each reference tablet are presented in Figure 3. Similarity factors of f1 and m3 were 75.67 and 72.30 compared with reference tablets, respectively.
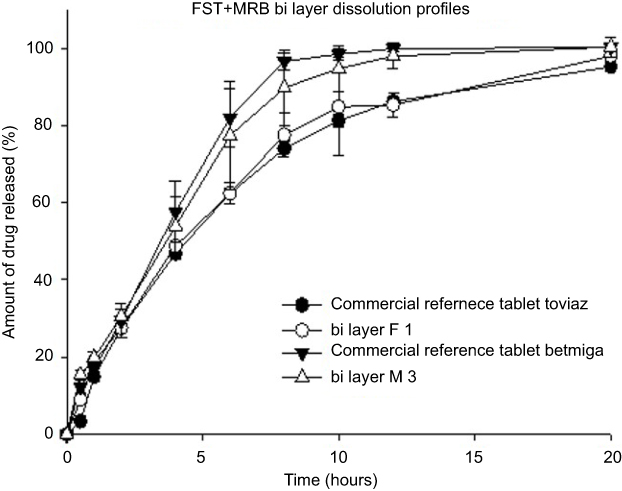 |
Figure 3 Dissolution profiles of fesoterodine fumarate–mirabegron bilayer tablets compared with commercial reference tablets Toviaz and Betmiga. Tablets were immersed in PBS (pH 6.8) for 20 hours (n=3, means ± SD). |
Drug-release kinetics
Release profiles of optimized bilayer tablets (F1–M3) were fitted to various mathematical models to evaluate the release kinetics of each layer. Drug-release kinetics, including coefficient of determination and release-rate constant, were evaluated up to 12 hours, the main release time of both layers. Results are summarized in Table 3. The release of Fst in bilayer tablets showed a good fit with the Higuchi model (R2=0.9880), while the release of Mrb in bilayer tablets showed a good fit with the Hixson–Crowell model (R2=0.9942). The Higuchi model can be used to describe modified drug release by diffusion, as in the case of some matrix tablets containing water-soluble drugs.25,35,36 The Higuchi model can also be applied to a swellable matrix formulation, such as F1 based on swelling polymer HPMC. The Hixson–Crowell model can be used to evaluate drug release with changes in surface area or tablet diameters. As such, the Hixson–Crowell model can be applied to erodible matrix formulations, which indicates that the M3 layer was eroded at a relatively constant rate.26,36,37
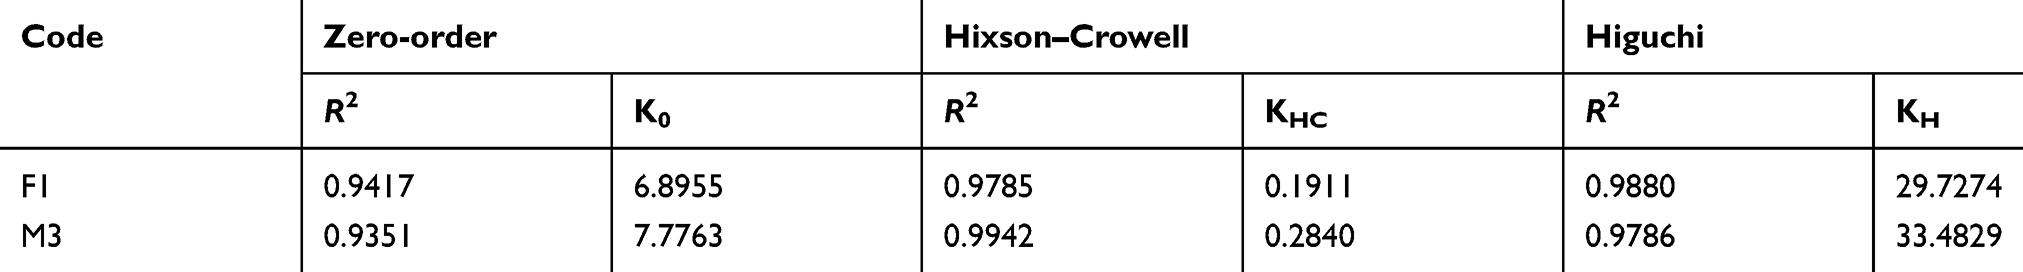 |
Table 3 Mathematical modeling and drug-release kinetics of fesoterodine fumarate layer and mirabegron layer |
Morphology
Camera images were taken to confirm the behavior of each layer in optimized bilayer tablets (F1–M3) during dissolution. Figure 4 shows tablet images taken before dissolution, after 60 minutes' dissolution, and after 240 minutes' dissolution of optimized bilayer tablets (F1–M3). Compared to the initial F1 layer (Figure 4A), the subsequent F1 layer showed swelling during dissolution over time more than the M3 layer (Figure 4, B and C). Compared to the initial M3 layer (Figure 4A), the subsequent M3 layer showed erosion during dissolution over time and slight swelling was also observed (Figure 4, B and C).
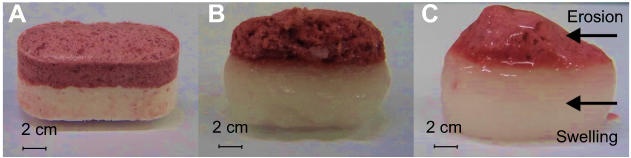 |
Figure 4 Bilayer tablet after dissolution of (A) 0, (B) 60, and (C) 240 minutes. |
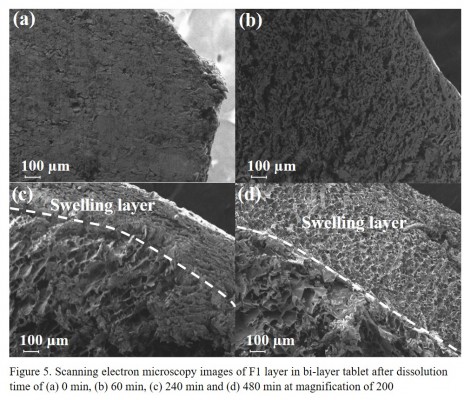
SEM images were taken to confirm the internal polymer behavior of each layer in optimized bilayer tablets (F1–M3) during dissolution. Figure 5 shows SEM of sectioned F1 layers in the bilayer tablets, taken before dissolution, after 60 minutes' dissolution, after 240 minutes' dissolution, and after 480 minutes' dissolution. Before dissolution, the Fst layer was densified (Figure 5A). After 60 minutes (Figure 5B), stem-like pores formed in the Fst layer. After 240 minutes, pores in the layer grew along the stem shape and the outer swelling layer could be distinguished from the inner layer (Figure 5C). After 480 minutes, pores had grown and the outer swelling layer was further developed (Figure 5D). Figure 6 shows SEM of sectioned M3 layers in the bilayer tablet taken before dissolution, after 30 utes', (c) after 60 minutes', and after 240 minutes' dissolution. Before dissolution, the M3 layer was densified like the Fst layer (Figure 6A). After 30 minutes pores had not formed, but the surface appeared rough (Figure 6B). After 60 minutes, pores had formed and their size had increased from the outer layer to the inner layer (Figure 6C). This correlated with the slight swelling of the M3 layer in Figure 4B. After 240 minutes, the sizes of these pores had also increased in the outer layer and particles appeared to fall off in the form of straws because of erosion (Figure 6D).
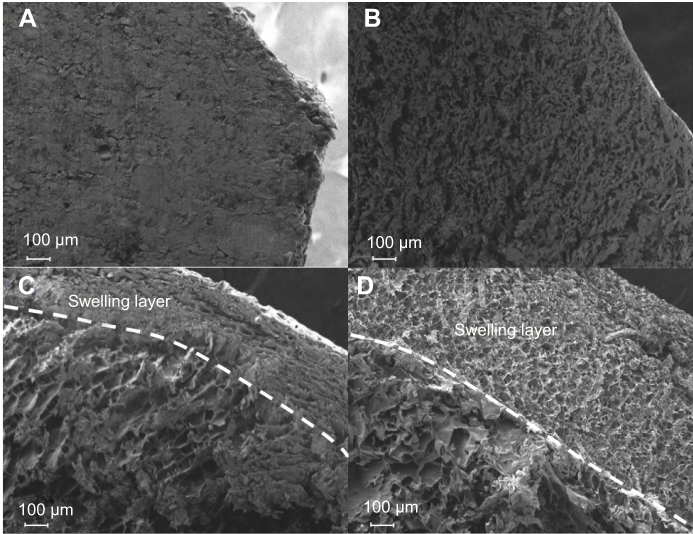 |
Figure 5 Scanning electron microscopy of F1 layer in bilayer tablet after dissolution of (A) 0, (B) 60, (C) 240, and (D) 480 minutes. Magnification 200×. |
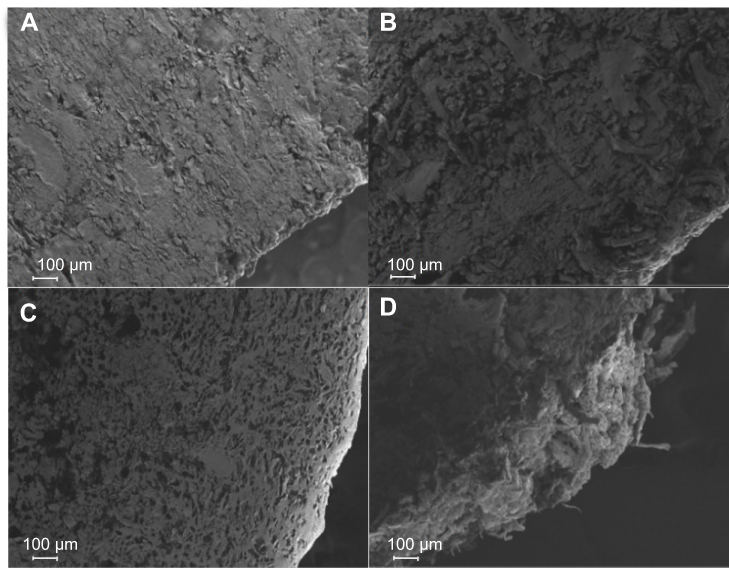 |
Figure 6 Scanning electron microscopy of M33 layer in bilayer tablet after dissolution of (A) 0, (B) 30, (C) 60, and (D) 240 minutes. Magnification 200×. |
Swelling and erosion
Morphology studies confirmed the behavior of each layer in optimized bilayer tablets (F1–M3) during dissolution. Water uptake, remaining rate study were tablet volume study were also carried out to investigate the swelling and erosion behavior of monolayer tablets of Fst and Mrb constituting the optimal bilayer tablet (F1–M3).
Water uptake and remaining rate
Water uptake represents the swelling rate as the polymer absorbs the surrounding fluid, and the remainder represents the erosion rate as the polymer disintegrates in fluid during dissolution.13 Water uptake and remainder of monolayer tablets of each drug during dissolution are shown in Figure 7. As shown in Figures 4 and 5, F1 monolayer tablets showed much swelling over 20 hours. Water uptake of F1 monolayer tablets was 286.9%±15.4% at 2 hours, 476.5%±45.7% at 4 hours, 701.7%±36.3% at 8 hours, and 988.7%±97.3% at 20 hours. The remainder was 70.9%±1.2% at 2 hours, 58.5%±3.0% at 4 hours, 45.1%±0.8% at 8 hours, and 28.1%±4.6% at 20 hours (Figure 7A). These results demonstrated that polymer swelling was dominant in dissolution of F1 monolayer tablets. As shown in Figures 4 and 6, M3 monolayer tablets showed much erosion over 4 hours. Water uptake of M3 monolayer tablets was 152.0%±21.0% at 2 hours, 302.1%±64.5% at 4 hours, and the remainder was 60.7%±1.4% at 2 hours, 14.9%±1.0% at 4 hours (Figure 7B). These results demonstrated that polymer erosion was dominant in dissolution of M3 monolayer tablets.
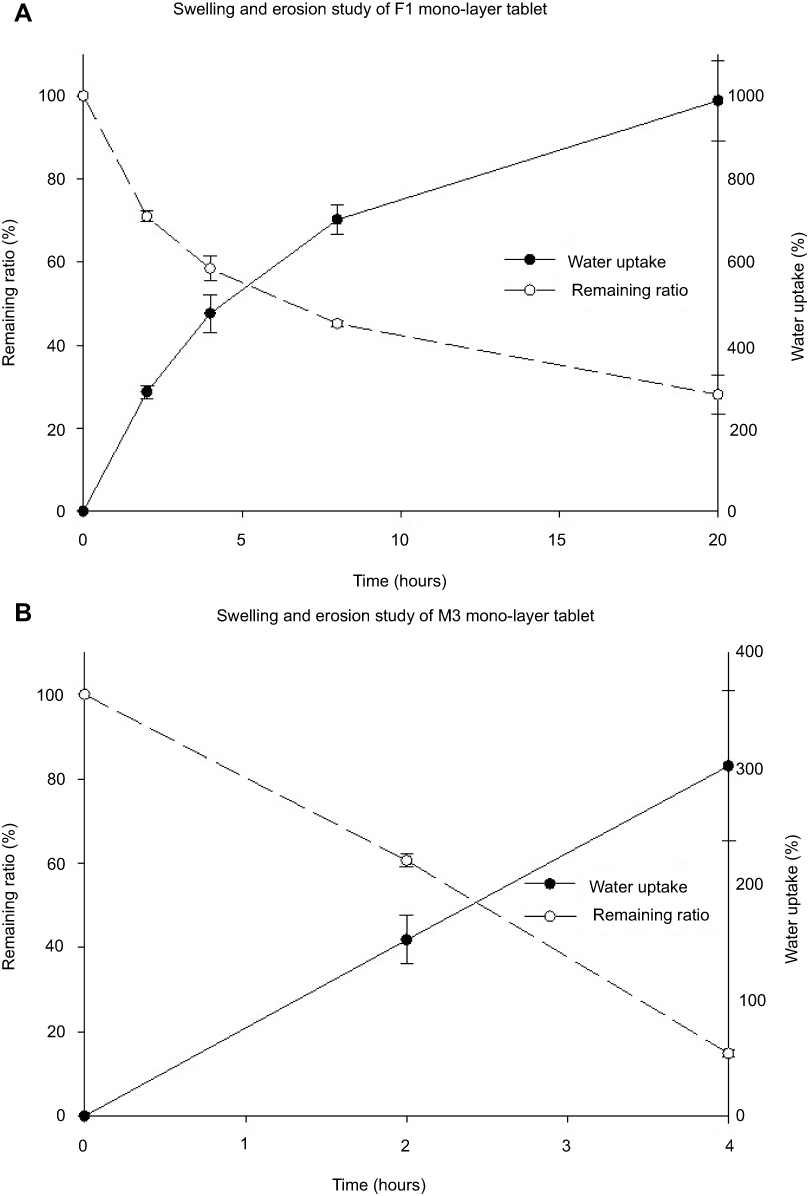 |
Figure 7 Water uptake (%) and remaining profiles of (A) F1 monolayer tablet and (B) 3 monolayer tablet (n=3, means ± SD). |
Tablet volume
In order to evaluate swelling and erosion in detail, three measures of each monolayer tablet were taken during dissolution. Diameters of tablet length, width, and height of F1 monolayer tablets were evaluated (Figure 8A). F1 monolayer tablet length had increased by 21.1%±1.6% at 2 hours, 25.7%±1.1% at 4 hours, 31.9%±2.9% at 8 hours, and 22.3%±9.6% at 20 hours. Tablet width had increased by 28.8%±3.3% at 2 hours, 33.6%±2.3% at 4 hours, 46.0%±6.2% at 8 hours, and 53.5%±9.4% at 20 hours. Tablet height had increased by 74.0%±9.3% at 2 hours, 111.8%±15.2% at 4 hours, 104.3%±12.5% at 8 hours, and 86.9%±13.0% at 20 hours. These results, which differed in radial change,were due to compression and the influence of shear strength during dissolution. The increase in tablet height, which was longer than the initial length in 4 hours, was extremely large and not suitable for the swelling study, because it is affected too much by compression. Since tablet length was initially too long, the increase was relatively small, which suggested inadequacy for the swelling study. The width of the tablet was less influenced by compression and swelling was stable. Therefore, radial change in width was considered suitable for swelling and erosion studies for F1 monolayer tablets. Swelling occurred actively in the first 2 hours and slowed constantly up to 20 hours.
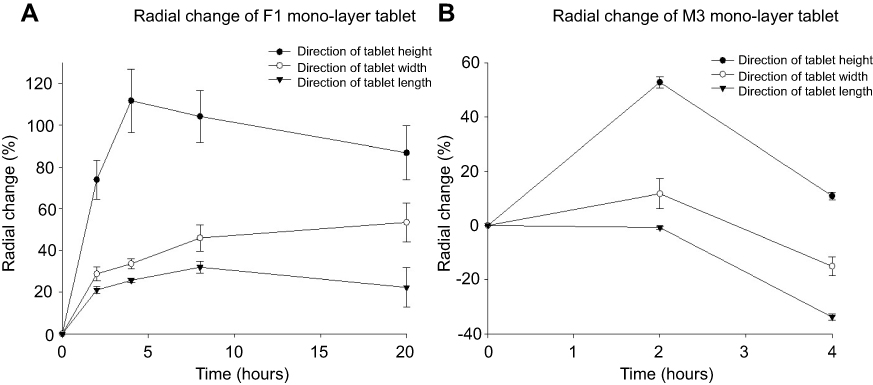 |
Figure 8 Radial change in (A) F1 monolayer tablet and (B) M3 monolayer tablet (n=3, means ± SD). |
Tablet length, width, and height of M3 monolayer tablets were evaluated during dissolution (Figure 8B). Length had decreased by 0.8%±0.6% at 2 hours and 33.8%±1.2% at 4 hours. Width had increased by 11.7%±5.6% at 2 hours, but had decreased by 15.1%±3.4% at 4 hours. Height had increased by 52.8%±2.1% at 2 hours and 10.9%±1.3% at 4 hours. For the same reason as that in F1 monolayer tablets, M3 monolayer tablets also showed the most swelling value in height and the least in length. Therefore, radial change in width direction was considered suitable for the swelling and erosion study for M3 monolayer tablets. Selling occurred up to 2 hours, and thereafter erosion was dominant up to 4 hours.
Figure 9 shows the correlation between water uptake (Figure 7A) and radial change in width (Figure 8A) of F1 monolayer tablets during dissolution up to 20 hours (n=3). There was significant correlation (R2=0.9882), which indicates that these two swelling parameters showed the same tendency, confirming that drug release in F1 was dominated by swelling.
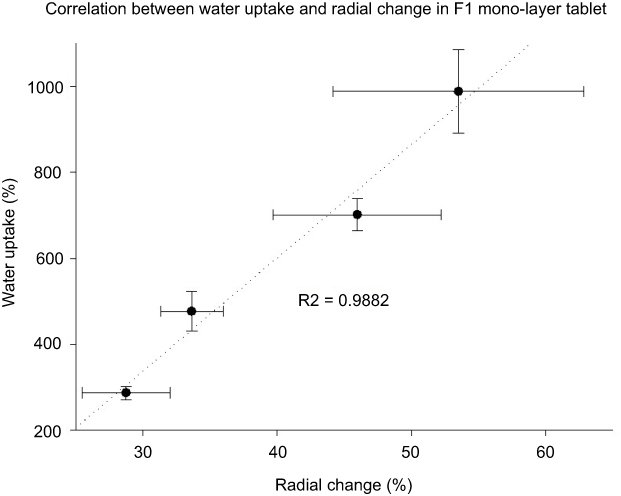 |
Figure 9 Correlation between water uptake and tablet-width diameter change in monolayer tablets (n=3, means ± SD). |
Drug transfer
FTIR spectra (Figure 10) were obtained to identify peaks that could trace the drug molecules in IR images. Figure 10A shows FTIR spectra of Fst and excipients in F1 formulation. FTIR spectra of F1 before and after freeze-drying were also investigated. The COO¯ group peak at 1,757 cm−1 was observed only in FTIR spectra of Fst and F1. To determine the effect of freeze-drying on FTIR spectra, the physical mixture after freeze-drying was also evaluated. The COO¯ group peak at 1,757 cm−1 was slightly reduced, but observed in physical mixture after freeze-drying. As a result, a wave number of 1757 cm−1 was selected to trace the Fst molecules in the drug-transfer study. Figure 10B shows FTIR spectra of Mrb and excipients in the M3 formulation. FTIR spectra of M3 before and after freeze-drying were also investigated. The C–NH2 group peak at 1,646 cm−1 was observed only in FTIR spectra of Mrb and M3. To determine the effect of freeze-drying on FTIR spectra, the physical mixture after freeze-drying was also evaluated. The C–NH2 group peak at 1,646 cm−1 was slightly reduced, but observed in physical mixture after freeze-drying. As a result, a wave number of 1,646 cm−1 was selected to trace Mrb molecules in the drug-transfer study.
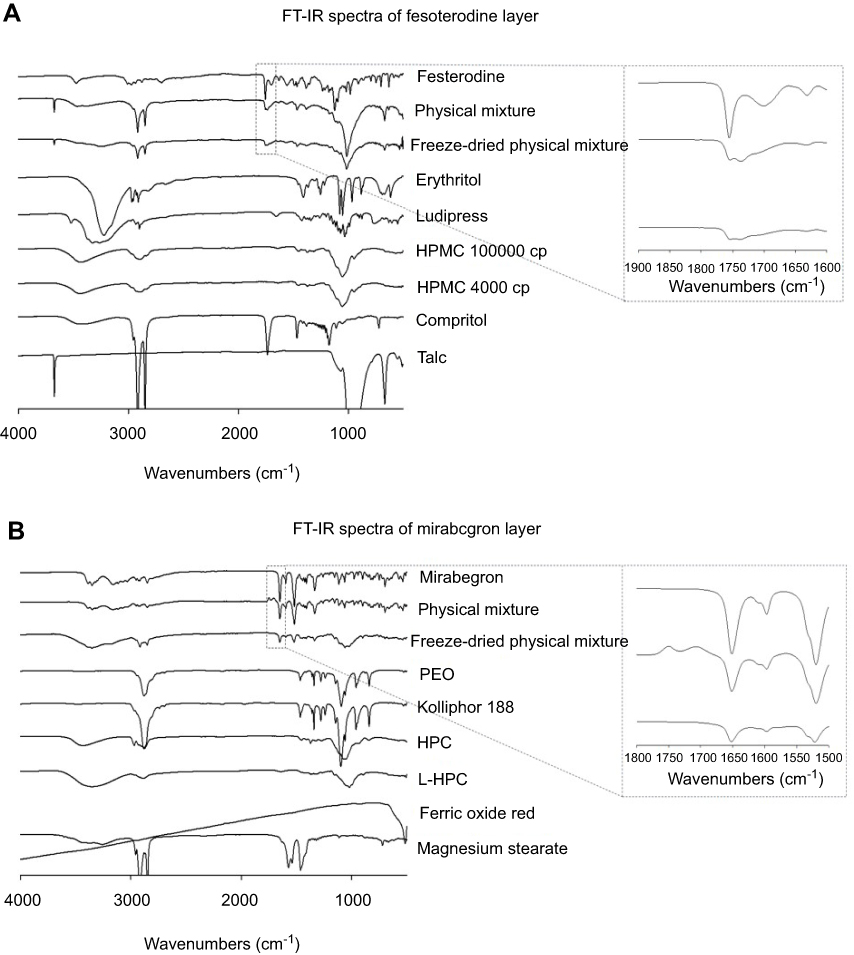 |
Figure 10 Fourier-transform infrared spectra of drug, excipients, physical mixture and freeze-dried physical mixture of (A) F1 layer and (B) M3 layer. |
FTIR imagesof cross sections were obtained for both layers to trace drug transfer. 3D reconstructions were visualized with ImageJ software based on FTIR imaging (Figures 11 and 12). FTIR images were taken at 30 minutes to represent the first stage, 240 minutes to represent the middle stage, and 480 minutes to represent the end stage of dissolution. As shown in Figure 11, FTIR images and 3-D Color Inspector indicated that the amount of Fst gradually decreased in the F1 layer and increased in the M3 layer over time. Swelling occurred in the F1 layer (Figure 5) and increased over time, which resulted in a decrease of Fst in the F1 layer (Figure 11A) and an increase of Fst in the M3 layer (Figure 11B). As a result, swelling in F1 transferred Fst to M3 and finally delayed the release of Fst. Although Fst release was clogged by M3 in bilayer tablets, the dissolution profile of Fst did not significantly decrease (5%) compared with monolayer tablets, unlike the Mrb-dissolution profile (Figures 1 and 3), which can be explained by the transfer of Fst through swelling. As shown in Figure 12A, FTIR images and 3-D Color Inspector indicated that the amount of Mrb in M3 was relatively constant during dissolution compared with the amount of Fst in F1, which showed a large change because Mrb was released in M3 with erosion. As shown in Figure 12B, FTIR images and 3-D Color Inspector indicated that Mrb was hardly visible in the Fst layer during dissolution, which suggested that Mrb had hardly transferred to the Fst layer. Also, this result indicated that Mrb release was clogged by the Fst layer. The clogging effect of the Fst layer on Mrb release was shown on the dissolution profile of Mrb in bilayer tablets, which was significantly decreased (20%) compared with monolayer tablets (Figures 2 and 3). In addition, as shown in Figure 12B, the small amount of Mrb transferred to the Fst layer during dissolution seemed to be accumulated in swelling of the Fst layer, which resulted in further suppression of Mrb release in bilayer tablets compared to monolayer tablets. To sum up, although each layer was clogged by each other layer in bilayer tablets, the release of Fst was less affected in changing monolayer tablets to bilayer tablets because of swelling in F1 and the release of Mrb was significantly suppressed in changing monolayer tablets to bilayer tablets because of erosion in M3.
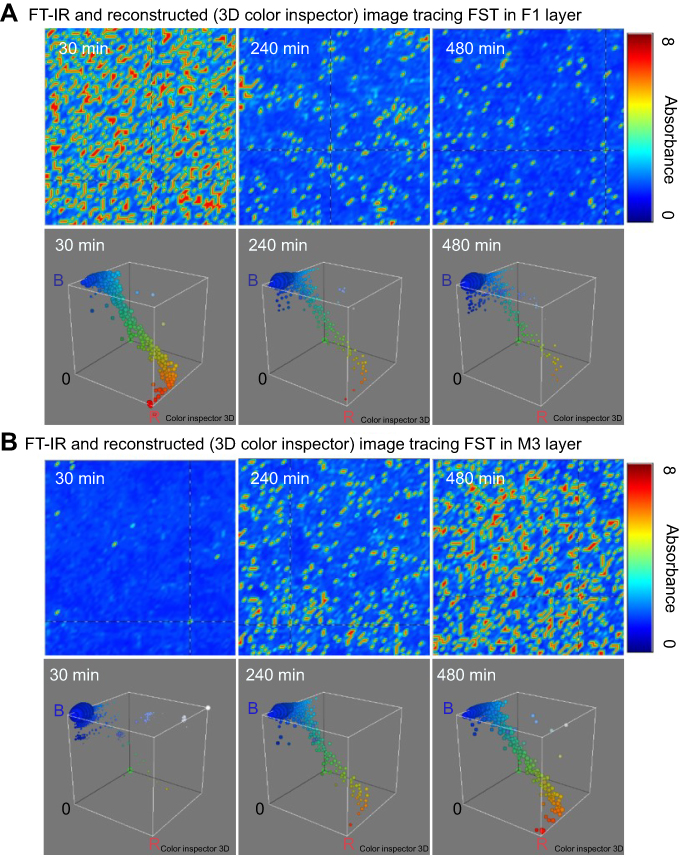 |
Figure 11 Fourier-transform infrared image and reconstructed (3-D color inspector) image tracing fesoterodine fumarate in (A) F1 layer and (B) M3 layer after dissolution for predetermined times. |
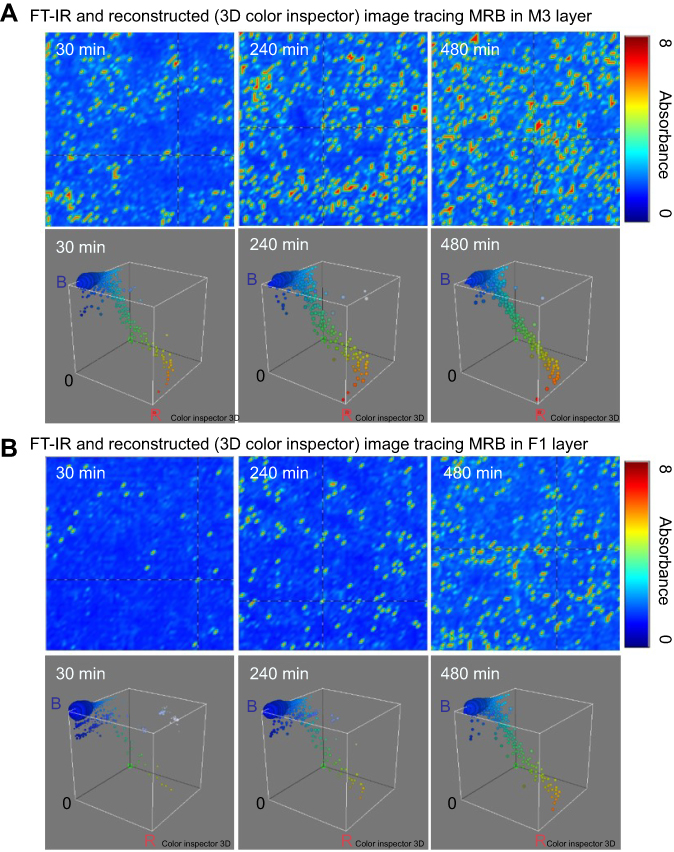 |
Figure 12 Fourier-transform infrared image and reconstructed (3-D color inspector) image tracing mirabegron in (A) M3 layer and (B) F1 layer after dissolution for predetermined times. |
Conclusion
This study was carried out to investigate the difference in dissolution patterns when preparing bilayer tablets based on monolayer tablets. Bilayer tablets containing Mrb and Fst were successfully prepared with a dual-release drug-delivery system. These bilayer tablets had similar in vitro dissolution profiles compared with commercial reference tablets based on similarity factor f2. Morphology study with camera images and SEM confirmed the behavior of bilayer tablets during dissolution over time. Several swelling and erosion studies confirmed that Fst was mainly released with swelling and Mrb mainly released by erosion. In particular, a relationship between water uptake and radial change in tablet width was identified. In addition, transfer of Fst and Mrb was visualized in bilayer tablets by FTIR imaging and 3-D image reconstruction. Visualization of drug-molecule tracing revealed the transfer of each drug during dissolution, providing a rationale for different dissolution profiles of bilayer tablets compared to monolayer tablets. In conclusion, the release of bilayer tablets based on monolayer tablets with different release behavior revealed that monolayers with swelling were affected slightly and monolayers with erosion affected significantly. These findings provide scientific insights into the development of a dual-release bilayer-tablet drug-delivery system.
Acknowledgments
This study was supported by National Research Foundation of Korea grants, funded by the South Korean government (NRF-2017R1A5A2015541, NRF-2018R1A1A1A05023012, and 2018R1D1A1B07050538).
Disclosure
The authors report no conflicts of interest in this work.
References
1. Chapple, CR, Nazir J, Hakimi Z. et al. Persistence and adherence with mirabegron versus antimuscarinic agents in patients with overactive bladder: a retrospective observational study in UK clinical practice. Eur Urol. 2017;72(3):389–399. doi:10.1016/j.eururo.2017.01.037
2. Abrams, P., Kelleher C, Staskin D. et al. Combination treatment with mirabegron and solifenacin in patients with overactive bladder: efficacy and safety results from a randomised, double-blind, dose-ranging, phase 2 study (Symphony). Eur Urol. 2015;67(3):577–588. doi:10.1016/j.eururo.2014.02.012
3. Kadekawa, K., Sugaya K, Nishijima S. et al. Effects of combination treatment with fesoterodine and mirabegron on urinary bladder functions of pelvic congestion model in rats. in neurourology and urodynamics. 111 River St, Hoboken 07030-5774, NJ, USA: Wiley-Blackwell; 2016.
4. Michel MC. Fesoterodine: a novel muscarinic receptor antagonist for the treatment of overactive bladder syndrome. Expert Opin Pharmacother. 2008;9(10):1787–1796. doi:10.1517/14656566.9.10.1787
5. Matsuzaki N, Yamamoto Y, Murayama D, et al. Evaluation of maltose-induced chemical degradation at the interface of bilayer tablets. Chem Pharm Bulletin. 2017;65(5):478–486. doi:10.1248/cpb.c16-00929
6. Abebe A, Akseli I, Sprockel O, Kottala N, Cuitiño AM. Review of bilayer tablet technology. Int J Pharm. 2014;461(1–2):549–558. doi:10.1016/j.ijpharm.2013.12.028
7. Panchal HA, Tiwari AK. A novel approach of bilayer tablet technology: a review. Int Res J Pharm. 2012;3(5):44–49.
8. Chapple C, Van Kerrebroeck P, Tubaro A, et al. Clinical efficacy, safety, and tolerability of once-daily fesoterodine in subjects with overactive bladder. Eur Urol. 2007;52(4):1204–1212. doi:10.1016/j.eururo.2007.07.009
9. Chapple CR, Kaplan SA, Mitcheson D, et al. Mirabegron 50 mg once‐daily for the treatment of symptoms of overactive bladder: an overview of efficacy and tolerability over 12 weeks and 1 year. Int J Urol. 2014;21(10):960–967. doi:10.1111/iju.12568
10. Göpferich A. Polymer bulk erosion. Macromolecules. 1997;30(9):2598–2604. doi:10.1021/ma961627y
11. Bose A, Wong TW, Singh N. Formulation development and optimization of sustained release matrix tablet of Itopride HCl by response surface methodology and its evaluation of release kinetics. Saudi Pharm J. 2013;21(2):201–213. doi:10.1016/j.jsps.2012.03.006
12. Bagde, SB, Bakde BV, Channawar MA, Chandewar AV. Formulation and evaluation of bi layer tablet of metoprolol succinate and Ramipril. Int J Pharm Pharm Res. 2011;6:1416–1428.
13. Van Nguyen H, Nguyen VH, Lee B-J. Dual release and molecular mechanism of bilayered aceclofenac tablet using polymer mixture. Int J Pharm. 2016;515(1–2):233–244. doi:10.1016/j.ijpharm.2016.10.021
14. Jun, H, Lee HJ, Shin BS, Park CW. Preparation and in vivo characterization of dual release tablet containing sarpogrelate hydrochloride. J Pharm Invest. 2018;48(3):363–372. doi:10.1007/s40005-017-0330-z
15. Coffel J, Gandhi S, Nuxoll E. Unified polymer erosion model for pulsatile drug delivery. J Memb Sci. 2016;512:61–72. doi:10.1016/j.memsci.2016.03.055
16. Kazarian SG, Chan KA. “Chemical photography” of drug release. Macromolecules. 2003;36(26):9866–9872. doi:10.1021/ma035210l
17. Ribar T, Bhargava R, Koenig JL. FT-IR imaging of polymer dissolution by solvent mixtures. 1. Solvents. Macromolecules. 2000;33(23):8842–8849. doi:10.1021/ma000851r
18. Coutts-Lendon C, Wright NA, Mieso EV, Koenig JL. The use of FT-IR imaging as an analytical tool for the characterization of drug delivery systems. J Control Release. 2003;93(3):223–248.
19. van der Weerd J, Chan KA, Kazarian SG. An innovative design of compaction cell for in situ FT-IR imaging of tablet dissolution. Vib Spectrosc. 2004;35(1–2):9–13. doi:10.1016/j.vibspec.2003.11.004
20. Hashem FM, Nasr M, Fathy G, Ismail A. Formulation and in vitro and in vivo evaluation of lipid-based terbutaline sulphate bi-layer tablets for once-daily administration. AAPS PharmSciTech. 2016;17(3):727–734. doi:10.1208/s12249-015-0404-z
21. Tambe ST,, Padekar HB, Dhobale SM, Jadhav SL. Design and characterisation of bi-layer tablets containing simvastatin as sustained release and labetalol HCl as immediate release. J Drug Deliv Ther. 2019;9(2 Suppl):263–270.
22. Aryal S, Škalko-Basnet N. Stability of amlodipine besylate and atenolol in multi-component tablets of mono-layer and bi-layer types. Acta Pharmaceutica. 2008;58(3):299–308. doi:10.2478/v10007-008-0012-5
23. Vaithiyalingam SR, Sayeed VA. Critical factors in manufacturing multi-layer tablets—assessing material attributes, in-process controls, manufacturing process and product performance. Int J Pharm. 2010;398(1–2):9–13. doi:10.1016/j.ijpharm.2010.07.025
24. Gurny R, Doelker E, Peppas N. Modelling of sustained release of water-soluble drugs from porous, hydrophobic polymers. Biomaterials. 1982;3(1):27–32.
25. Higuchi T. Mechanism of sustained‐action medication. Theoretical analysis of rate of release of solid drugs dispersed in solid matrices. J Pharm Sci. 1963;52(12):1145–1149.
26. Hixson A, Crowell J. Dependence of reaction velocity upon surface and agitation. Ind Eng Chem. 1931;23(8):923–931. doi:10.1021/ie50260a018
27. Uhrich KE, Cannizzaro SM, Langer RS, Shakesheff KM. Polymeric systems for controlled drug release. Chem Rev. 1999;99(11):3181–3198.
28. Lamoudi L, Chaumeil JC, Daoud K. Swelling, erosion and drug release characteristics of sodium diclofenac from heterogeneous matrix tablets. J Drug Delivery Sci Technol. 2016;31:93–100. doi:10.1016/j.jddst.2015.12.005
29. Nep E, Asare-Addo K, Ghori MU, Conway BR, Smith AM. Starch-free grewia gum matrices: compaction, swelling, erosion and drug release behaviour. Int J Pharm. 2015;496(2):689–698. doi:10.1016/j.ijpharm.2015.10.071
30. Chaibva FA, Khamanga SM, Walker RB. Swelling, erosion and drug release characteristics of salbutamol sulfate from hydroxypropyl methylcellulose-based matrix tablets. Drug Dev Ind Pharm. 2010;36(12):1497–1510. doi:10.3109/03639045.2010.488648
31. Sriamornsak P, Thirawong N, Weerapol Y, Nunthanid J, Sungthongjeen S. Swelling and erosion of pectin matrix tablets and their impact on drug release behavior. Eur J Pharm Biopharm. 2007;67(1):211–219. doi:10.1016/j.ejpb.2006.12.014
32. Yadav D, Survase S, Kumar N. Dual coating of swellable and rupturable polymers on Glipizide loaded MCC pellets for pulsatile delivery: formulation design and in vitro evaluation. Int J Pharm. 2011;419(1–2):121–130. doi:10.1016/j.ijpharm.2011.07.026
33. Punčochová K, Ewing AV, Gajdošová M, et al. Identifying the mechanisms of drug release from amorphous solid dispersions using MRI and ATR-FTIR spectroscopic imaging. Int J Pharm. 2015;483(1–2):256–267. doi:10.1016/j.ijpharm.2015.02.035
34. Hifumi H, Ewing AV, Kazarian SG. ATR-FTIR spectroscopic imaging to study the drying and dissolution of pharmaceutical polymer-based films. Int J Pharm. 2016;515(1–2):57–68. doi:10.1016/j.ijpharm.2016.09.085
35. Grassi M, Grassi G. Mathematical modelling and controlled drug delivery: matrix systems. Curr Drug Deliv. 2005;2(1):97–116.
36. Dash S, Murthy PN, Nath L, Chowdhury P. Kinetic modeling on drug release from controlled drug delivery systems. Acta Pol Pharm. 2010;67(3):217–223.
37. Chen S, Zhu J, Cheng J. Preparation and in vitro evaluation of a novel combined multiparticulate delayed-onset sustained-release formulation of diltiazem hydrochloride. Die Pharmazie-An Int J Pharm Sci. 2007;62(12):907–913.
 © 2019 The Author(s). This work is published and licensed by Dove Medical Press Limited. The full terms of this license are available at https://www.dovepress.com/terms.php and incorporate the Creative Commons Attribution - Non Commercial (unported, v3.0) License.
By accessing the work you hereby accept the Terms. Non-commercial uses of the work are permitted without any further permission from Dove Medical Press Limited, provided the work is properly attributed. For permission for commercial use of this work, please see paragraphs 4.2 and 5 of our Terms.
© 2019 The Author(s). This work is published and licensed by Dove Medical Press Limited. The full terms of this license are available at https://www.dovepress.com/terms.php and incorporate the Creative Commons Attribution - Non Commercial (unported, v3.0) License.
By accessing the work you hereby accept the Terms. Non-commercial uses of the work are permitted without any further permission from Dove Medical Press Limited, provided the work is properly attributed. For permission for commercial use of this work, please see paragraphs 4.2 and 5 of our Terms.