")
Back to Journals » International Journal of Nanomedicine » Volume 14
PEG-coated and Gd-loaded fluorescent silica nanoparticles for targeted prostate cancer magnetic resonance imaging and fluorescence imaging
Authors Jiang W, Fang H, Liu F, Zhou X, Zhao H, He X, Guo D
Received 28 February 2019
Accepted for publication 17 June 2019
Published 23 July 2019 Volume 2019:14 Pages 5611—5622
DOI https://doi.org/10.2147/IJN.S207098
Checked for plagiarism Yes
Review by Single anonymous peer review
Peer reviewer comments 2
Editor who approved publication: Dr Mian Wang
Wei Jiang,*,1 Huiying Fang,*,2 Fengqiu Liu,3 Xue Zhou,1 Hongyun Zhao,4 Xiaojing He,1 Dajing Guo1
1Department of Radiology, The Second Affiliated Hospital of Chongqing Medical University, Chongqing 400010, People’s Republic of China; 2Department of Breast Diseases, Chongqing University Cancer Hospital, Chongqing Cancer Institute and Chongqing Cancer Hospital, Chongqing 400030, People’s Republic of China; 3Institute of Ultrasound Imaging, Department of Ultrasound, The Second Affiliated Hospital of Chongqing Medical University, Chongqing 400010, People’s Republic of China; 4Department of Gastroenterology, The Second Affiliated Hospital of Chongqing Medical University, Chongqing 400010, People’s Republic of China
*These authors contributed equally to this work
Background: Multimodal imaging probes have become a powerful tool for improving detection sensitivity and accuracy, which are important in disease diagnosis and treatment.
Methods: In this study, novel bifunctional magnetic resonance imaging (MRI)/fluorescence probes were prepared by loading gadodiamide into fluorescent silica nanoparticles (NPs) ([email protected]@SiO2-PEG-Ab NPs) for targeting of prostate cancer (PCa). The physicochemical characteristics, biosafety and PCa cell targeting ability of the [email protected]@SiO2-PEG-Ab NPs were studied in vitro and in vivo.
Results: The [email protected]@SiO2-PEG-Ab NPs had a spherical morphology with a relatively uniform size distribution and demonstrated high efficiency for Gd loading. In vitro and in vivo cell-targeting experiments demonstrated a high potential for the synthesized NPs to target prostate-specific membrane antigen (PSMA) receptor-positive PCa cells, enabling MRI and fluorescence imaging. In vitro cytotoxicity assays and in vivo hematological and pathological assays showed that the prepared NPs exhibited good biological safety.
Conclusion: Our study demonstrates that the synthesized [email protected]@SiO2-PEG-Ab NPs have great potential as MRI/fluorescence contrast agents for specific identification of PSMA receptor-positive PCa cells.
Keywords: silica nanoparticles, prostate cancer, magnetic resonance imaging, fluorescence imaging, targeting
Introduction
Prostate cancer (PCa) is the second most common malignant tumor in men worldwide.1 Magnetic resonance imaging (MRI) has shown potential value in diagnosis of PCa due to its high soft tissue resolution.2 However, with conventional MRI, it is difficult to diagnose early PCa and distinguish PCa from chronic prostatitis.3,4 In addition, biochemical recurrence is common after initial treatment, primarily surgery or radiation therapy. Under these circumstances, searching for tumor recurrence and metastases is challenging for conventional imaging modalities, such as computed tomography (CT) and MRI, due to relatively low sensitivity and specificity.5 Therefore, developing techniques to improve PCa imaging is necessary. Compared with conventional imaging methods, multimodal molecular imaging combines multiple molecular imaging methods to achieve complementary advantages.6 Recently, discoveries based on multimodal molecular imaging probes have provided new and exciting possibilities in this field. Among them, MRI/fluorescence bimodal imaging probes have attracted increasing attention. MRI has multidirectionality and multiparameter imaging features that can improve the detail of anatomical structures and provide other information. Fluorescence imaging has high sensitivity but suffers from low spatial resolution.7 Therefore, MRI/fluorescence bimodal imaging can provide more useful information for diagnosis and treatment of disease.
With the development of nanomaterials, MRI/fluorescence bimodal imaging probes containing nanomaterials as carriers have been widely used. Commonly used carriers include liposomes, polymeric micelles, carbon nanotubes and silica nanoparticles (NPs). Silica-based composites are usually synthesized by the sol-gel method.8 But since Stöber first introduced solid silica micro-/nanoparticles through the hydrolysis and condensation process of silicates under basic conditions in 1968,9 the past several decades have witnessed an explosive growth in the synthesis of silica materials. Silica NPs display great promise in biomedical applications due to advantages such as high colloidal stability, adjustable particle size, high biocompatibility, low toxicity10,11 and transparency to light and magnetism; that is, silica NPs do not absorb light or interfere with magnetic fields, allowing a combination of components to maintain their original optical and/or magnetic properties.8 Additionally, silica has and contains a large number of hydroxyl groups,12 which can be modified with various chemical moieties for loading of antibodies and drugs.13,14 Considering these characteristics, we used silica as a carrier in this imaging system. In previous studies, gadolinium-doped silica NPs exhibited a high longitudinal relaxation rate.15 In the present study, gadodiamide and the fluorescent dye Cy5.5 were utilized to achieve MRI/fluorescence bimodal imaging. As a dye in the near-infrared (NIR) spectrum (650–950 nm), Cy5.5 has high imaging sensitivity and low intrinsic autofluorescence interference, enabling accurate probe positioning.16 In addition, one of the challenges in using NPs for targeted cell imaging is the high incidence of non-specific interactions between cells and particles. PEG has been used to increase the circulation times of NPs in vivo by reducing the aggregation of opsonins and proteins from blood serum on the surface of NPs that leads to endocytosis.17
To enhance the PCa targeting specificity, we designed a strategy involving [email protected]@SiO2 NPs conjugated with the monoclonal antibody (mAb) YPSMA-1 against prostate-specific membrane antigen (PSMA). PSMA is a type II transmembrane protein that is expressed at low levels in normal prostate tissue and other normal tissues but is highly specific to PCa cells.18,19 In addition, PSMA has high expression frequency and uniformity in PCa cells20 and is therefore an ideal target for PCa imaging or therapy. Although PSMA has previously been reported as a target for PCa imaging and treatment, as far as we know, PEG-coated and Gd-loaded targeted fluorescent silica NPs have not been reported in the literature for use in PCa MRI and fluorescence imaging.
In this study, Gd-doped targeted fluorescent silica NPs were prepared using a reverse microemulsion and carbodiimide method (Figure 1). Then, the physicochemical characteristics, biosafety and PCa cell targeting ability of the [email protected]@SiO2-PEG-Ab NPs were studied in vitro and in vivo. We hope that YPSMA-1 on the surface of prepared NPs can specifically recognize PSMA-positive PCa cells, allowing the NPs to be used as dual-mode probes for MRI/fluorescence imaging.
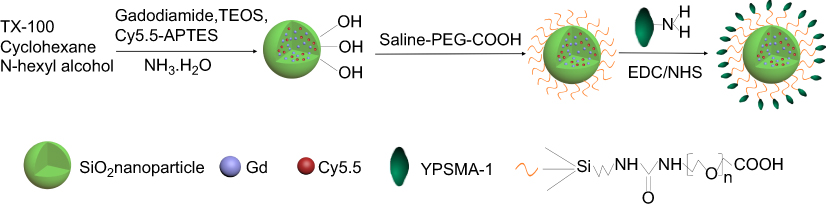 |
Figure 1 Schematic of the synthesis procedure for [email protected]@SiO2-PEG-Ab NPs. |
Materials and methods
Materials
Triton X-100 (TX-100), cyclohexane and n-hexyl alcohol were obtained from Alfa Aesar (Ward Hill, MA, USA). 1-Ethyl-3-(3-dimethylaminopropyl) carbodiimide/N-hydroxysuccinimide (EDC/NHS), tetraethyl orthosilicate (TEOS), 3-aminopropyltrimethoxysilane (APTES) and 2-N-morpholino-ethanesulfonic acid (MES) were purchased from Sigma-Aldrich (St. Louis, MO, USA). Cy5.5-NHS ester was purchased from Lumiprobe Corporation (Maryland, USA). Saline-PEG-COOH was purchased from Ponsurebio Co., Ltd. (Shanghai, China). Ammonia solution (25–28%), acetone and anhydrous ethanol (99.5 %) were purchased from Chuandong Chemical Co., Ltd. (Chongqing, China). Anti-PSMA antibody (YPSMA-1), goat anti-mouse IgG and goat anti-mouse IgG H&L (FITC) were purchased by Abcam (Cambridge, UK). Gadodiamide (OmniscanTM) was obtained from GE Healthcare (Cork, Ireland). Deionized water was provided by a Milli-Q system from Millipore (Millipore, USA). All chemicals were reagent grade.
Preparation of silica-based NPs
Preparation of [email protected]@SiO2 NPs
[email protected]@SiO2 NPs were synthesized using the reverse microemulsion method21,22 with slight modifications. Briefly, a mixture of Cy5.5-NHS ester (1 mg) and APTES (10 μL) in DMSO (0.5 mL) was stirred for 4 h to form Cy5.5-APTES. Then, [email protected]@SiO2 NPs were synthesized by mixing 1.77 mL of TX-100, 7.5 mL of cyclohexane, 1.8 mL of n-hexanol and 800 μL of gadodiamide solution. After stirring for 30 min, 100 μL of TEOS, 150 μL of Cy5.5-APTES and 0.5 mL of ammonia solution (25–28%) were added and stirred for 24 h at room temperature (RT). After addition of acetone, NPs were obtained by centrifugation and washed with anhydrous ethanol three times. The surfactant was removed under stirring in anhydrous ethanol (60 °C for 12 h). Then, the synthesized NPs were obtained by centrifugation and lyophilized for future use.
Preparation of carboxyl-modified [email protected]@SiO2 ([email protected]@SiO2-PEG-COOH) NPs
A mixture of anhydrous ethanol (20 mL), [email protected]@SiO2 NPs (30 mg) and saline-PEG-COOH (50 mg) was dispersed by ultrasound for 15 min. The mixture was centrifuged and washed four times with deionized water to obtain [email protected]@SiO2-COOH NPs after stirring for 8 h at RT. The sample was lyophilized for future use.
Preparation of [email protected]@SiO2-PEG-Ab NPs
[email protected]@SiO2-PEG-Ab NPs were prepared using the carbodiimide method. Briefly, a mixture of [email protected]@SiO2-PEG-COOH (30 mg), EDC (10 mg), NHS (15 mg) and MES solution (2 mL, 0.1 mol/L, pH =5.5) was stirred for 1 h at 4 °C. Then, the by-product and excess EDC/NHS were removed by centrifugation. The activated NPs were suspended in phosphate-buffered saline (PBS; 2 mL, pH =7.4) containing YPSMA-1 (20 μL) and shaken for 12 h at 4 °C. The mixture was centrifuged and washed with deionized water. The centrifugation and washing processes were repeated three times to remove unreacted YPSMA-1. The prepared NPs were resuspended in PBS for future use.
Characterization of the prepared NPs
Physicochemical characteristics analysis of NPs
Transmission electron microscopy (TEM; Philips CM-120, Eindhoven, The Netherlands) was used to observe the morphology and size of NPs at an accelerating voltage of 200 kV. Dynamic light scattering (DLS) was used to determine the zeta potential and mean diameter of the NPs with a Malvern Zetasizer Nano ZS90 instrument (Malvern Instruments, Ltd., UK). The presence of PEG and carboxyl groups on the surface of [email protected]@SiO2-PEG-COOH NPs was confirmed with Fourier transform infrared (FTIR) spectroscopy (Nicolet iS50, Thermo Fisher Scientific, MA, USA).
Analysis of YPSMA-1 conjugation with NPs
The ability of YPSMA-1 to bind to [email protected]@SiO2-PEG-COOH NPs was confirmed with immunofluorescence via confocal laser scanning microscopy (CLSM; Eclipse Ti, Nikon, Japan). A mixture of [email protected]@SiO2-PEG-Ab NPs (10 mg) and FITC-labeled goat anti-mouse mAb (20 μL) in PBS (2 mL) was rocked for 1 h at 4 °C in the dark. Then, to remove unreacted FITC and obtain NPs, the mixture was centrifuged and washed three times with PBS. Before addition of FITC-labeled goat anti-mouse antibody, goat anti-mouse IgG antibody was added to block YPSMA-1 to obtaining the control sample.
Assays of Gd content and Gd stability
Briefly, 1 mL hydrofluoric acid was used to dissolve 5 mg of [email protected]@SiO2 and [email protected]@SiO2-PEG-Ab NPs, separately. Then, these samples were each diluted to 10 mL with water and analyzed via inductively coupled plasma atomic emission spectrometry (ICP-AES; ICAP6300 DUO, Thermo Fisher Scientific, MA, USA). A standard curve of Gd was obtained using Gd standard solutions (Gd concentrations of 0, 6.25, 12.5, 25, 50 and 100 μg/mL).
Next, 5 mL PBS (pH =7.4) with 10% FBS containing either [email protected]@SiO2 or [email protected]@SiO2-PEG-Ab NPs (5 mg) was shaken at 37 °C in a water bath. The solutions were centrifuged at different intervals (1, 3, 6, 12, 24, 48, 72, 96 and 120 h), and the supernatants were collected and analyzed via ICP-AES.
In vitro MRI features of NPs
An MRI scanner (Achieva 3.0T TX, Philips Healthcare, Best, The Netherlands) with an eight-channel head coil was used to acquire T1-weighted MR images and r1 values for [email protected]@SiO2-PEG-Ab, [email protected]@SiO2 NPs and gadodiamide (Gd concentrations 0, 0.015, 0.03, 0.045, 0.06 and 0.075 mM). T1-weighted MR images and the signal intensity (SI) were acquired using a fast field echo (FFE) sequence with the following parameters: TR/TE, 190/2.2 ms; matrix, 420×264; slice thickness, 6 mm; and FOV, 180×34 mm. T1 maps were acquired using an inversion recovery turbo spin echo (IR-TSE) sequence with the following parameters: TE, 15/100 ms; TR-SE/TR-IR/TI, 1000/2260/500 ms; matrix, 160×224; slice thickness, 6 mm; and FOV, 232×13 mm. In addition, r1 values were then calculated based on the measured T1 values.
Absorbance and emission spectra assays
The absorbance spectra of Cy5.5, [email protected]@SiO2 NPs and [email protected]@SiO2-PEG-Ab NPs were acquired using a UV/Vis spectrophotometer (Shimadzu Corp., Kyoto, Japan) at 25 °C with the following parameters: scan range, 200–900 nm; scan speed, 200 nm/min. Fluorescence emission was analyzed using a fluorimeter (Shimadzu Corp., Kyoto, Japan) at 25 °C with the following parameters: excitation wavelength, 594 nm; slit width, 5.0 nm.
Cell experiments
Cell culture
The human PCa cell lines LNCaP and PC3 (Procell Life Science and Technology Co., Ltd., Hubei, China) were cultivated in RPMI 1640 medium containing 10% FBS and 1% penicillin-streptomycin and incubated at 37 °C under 5 % CO2.
Cellular uptake studies
LNCaP and PC3 cells were seeded into two separate glass-bottom dishes (1×10⁵ cells/well). After adherence overnight, the cells were washed twice in PBS and then fixed with 4 % paraformaldehyde for 15 min and permeabilized with 0.1% Tween-PBS for 20 min. To avoid non-specific binding, the cells were incubated with 10% goat serum before incubation with [email protected]@SiO2-PEG-Ab NPs (0.5 mL, 5.0 mg/mL) for 2 h. The cells were washed twice with PBS and incubated with 4ʹ,6-diamidino-2-phenylindole (DAPI) for 15 min. CLSM was applied to determine the targeting of NPs.
Flow cytometry was carried out using a FACScan flow cytometer (BD Influx, BD Biosciences, USA). The same steps described above were used, except the LNCaP and PC3 cells were seeded separately into two six-well plates (2×10⁵ cells/well), and DAPI was not used. Cells were trypsinized, washed three times with PBS and then resuspended in PBS. Untreated cells served as a blank control.
Cytotoxicity assay
To evaluate in vitro cytotoxicity of NPs, LNCaP and PC3 cells were separately plated in 96-well plates (5×10³ cells/well) with 100 μL medium. After adherence overnight, 10 μL of medium containing different NPs at various concentrations was added to each well, followed by incubation for 24 h. Then, CCK-8 solution (10 μL) was added, and the cells were incubated for 1.5 h. Culture medium without NPs was used as the control. Absorbance was measured at a wavelength of 450 nm using an ELX800 absorbance microplate reader (Bio-Tek Instruments, Inc., Winooski, VT, USA). Cytotoxicity was assessed by measuring cell viability relative to that of control group cells.
Animal experiments
Animals
BALB/c-nu mice (male) were purchased from the animal center at Chongqing Medical University. The animal experiments were approved by the Animal Ethics Committee of Chongqing Medical University and conducted in accordance with the guidelines of the Institutional Animal Care and Use Committee of Chongqing Medical University.
Thirty male BALB/c-nu mice at four weeks of age were randomly divided into two groups (groups A and B). Next, 0.2 mL of an LNCaP cell suspension containing 1×10⁷ cells was subcutaneously injected into the right buttock of each mouse in group A, and PC3 cells at the same volume and concentration were injected into nude mice in group B. Groups A and B were then randomly divided into three subgroups (A1-3 and B1-3) with five mice in each subgroup. The mice were housed in stainless steel cages in ventilated animal rooms with a typical environment (temperature: 23±1 °C; humidity: 55±15%; light: 12-h light/dark cycle) and had free access to water and food. All BALB/c-nu mice were anaesthetized with sodium pentobarbital anesthetic administered to the abdomen.
In vivo MRI studies
To investigate the ability of [email protected]@SiO2-PEG-Ab NPs and gadodiamide to accumulate in tumor tissue, we performed hematoxylin and eosin (HE) staining and MRI studies in the nude mouse tumor model when tumors reached 0.7–1 cm in diameter. Each mouse was anaesthetized and placed in an animal coil. [email protected]@SiO2-PEG-Ab NPs or gadodiamide (Gd concentration of 0.01 mmol/kg) were injected into mice in the A1–2 and B1–2 subgroups via the tail vein. T1-weighted images were acquired using an FFE sequence with the following parameters: TR/TE, 215/5.3 ms; matrix, 500×250; slice thickness, 2 mm; and FOV, 50×50 mm. MR images were analyzed before injection and at various timepoints after injection (pre, 15 min, 1 h, 3 h and 24 h). The SI of the tumor and muscle tissue in the T1-weighted images was obtained in each region of interest (ROI) with the same diameter in approximately the same slice. The signal-to-noise ratio (SNR) was calculated using the following equation: SNR = SI (tumor)/SI (muscle).
In vivo fluorescence imaging studies
After each mouse was anaesthetized, [email protected]@SiO2-PEG-Ab NPs (0.2 mL, 10 mg/mL) were injected into mice in the A3 and B3 subgroups via the tail vein. After respiratory stabilization, the nude mice were placed on a mouse plate, and live fluorescence images were acquired before and after the injection (pre, 15 min, 1 h, 3 h and 24 h) using a small animal live fluorescence imaging system. The fluorescence intensity of the tumors in the two groups was compared, and the images were quantitatively analyzed using the live imaging software system.
In vivo toxicity studies
To determine the toxicity of the NPs in vivo, blood samples for biochemical analysis were obtained from the retinal vein before and at 1 h and 3 d after injection of [email protected]@SiO2-PEG-Ab NPs (Chemray 240, Shenzhen Rayto Life Science & Technology Co., Ltd., Guangdong, China). Before,1 d and 3 d after injection of the [email protected]@SiO2-PEG-Ab NPs, the nude mice were dissected, and the main organs (heart, liver, spleen, lungs and kidneys) were collected for HE staining and histopathological analysis.
Statistical analysis
All results are presented as the mean ± standard deviation. Differences with P<0.05 according to a Student’s t-test were considered statistically significant.
Results and discussion
Characterization of NPs
As shown in the TEM images (Figure 2A and B), the [email protected]@SiO2 and [email protected]@SiO2-PEG-Ab NPs exhibited a spherical morphology with a relatively uniform size distribution. The morphology of NPs did not change significantly after loading of PEG and YPSMA-1, indicating that surface modification of [email protected]@SiO2 NPs did not change the structure of the parent material. DLS measurements showed that the average diameters of the [email protected]@SiO2 and [email protected]@SiO2-PEG-Ab NPs were 99.6±8.7 and 125.5±9.9 nm, respectively (Table 1), which is greater than the diameters observed by TEM. The possible cause of these differences in diameters is the presence of hydration layers. In addition, the diameter of [email protected]@SiO2-PEG-Ab NPs was larger than that of [email protected]@SiO2 NPs (P<0.05), possibly due to the attachment of PEG and antibodies to the surface of the NPs.23 The zeta potentials of the [email protected]@SiO2 and [email protected]@SiO2-PEG-Ab NPs were −35.9±5.7 and −21.1±4.0 mV, respectively, as shown in Table 1. The NPs were negatively charged, which is essential for preventing non-specific binding and allowing specific antibody-antigen interactions.17
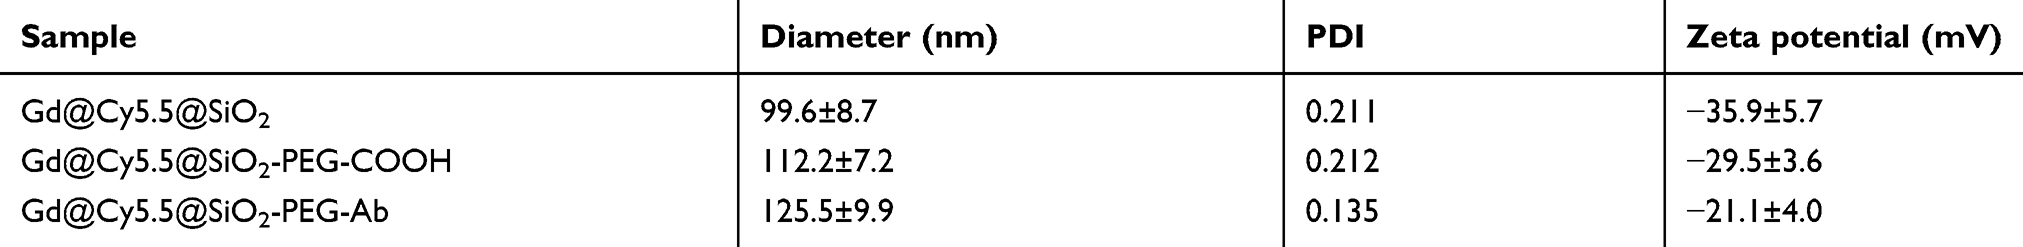 |
Table 1 Characteristics of silica-based NPs (n=4) |
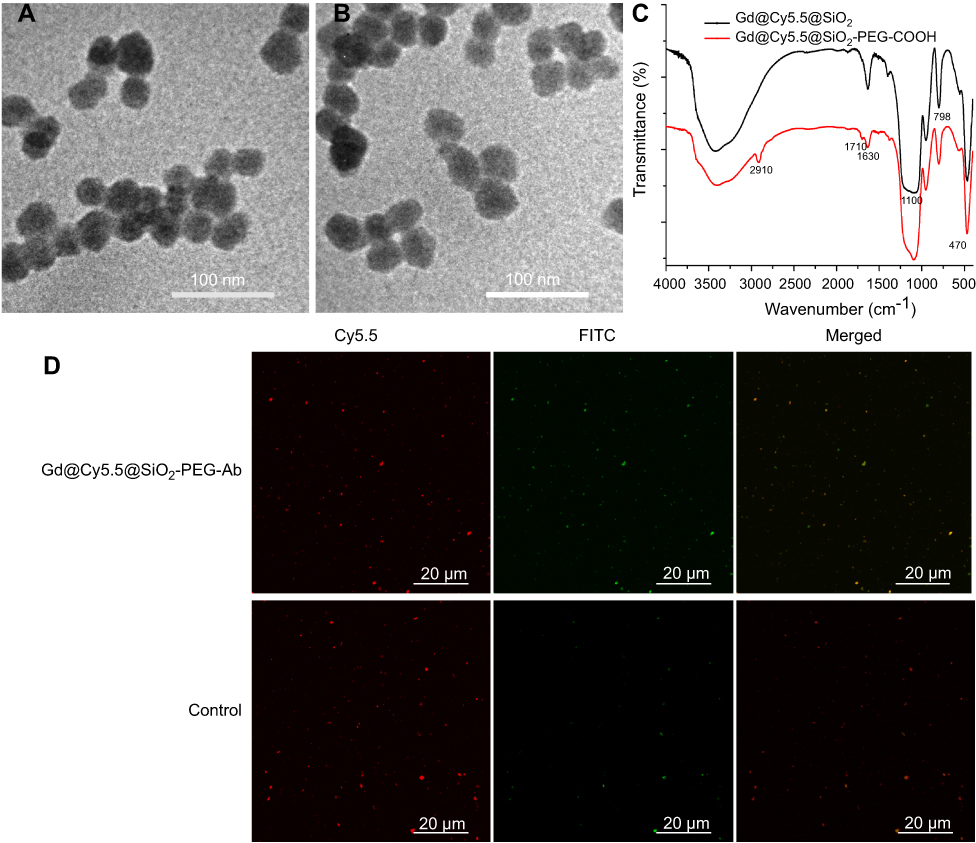 |
Figure 2 TEM images of [email protected]@SiO2 (A) and [email protected]@SiO2-PEG-Ab (B) NPs. FTIR spectra of [email protected]@SiO2 and [email protected]@SiO2-PEG-COOH NPs (C). CLSM images of the YPSMA-1 antibody on the surface of [email protected]@SiO2-PEG-Ab NPs (D). |
As shown in Figure 2C, the FTIR spectra of the [email protected]@SiO2 and [email protected]@SiO2-PEG-COOH NPs showed peaks at 1100 cm−1 corresponding to Si-O-Si vibration. The peaks at 1710 cm−1 and 2910 cm−1 correspond to C=O stretching of carboxyl groups and C-H alkyl stretching of PEG,24 respectively, confirming that PEG-COOH groups were introduced to the surface of the [email protected]@SiO2 NPs.
The ability of YPSMA-1 to bind to [email protected]@SiO2-PEG-COOH NPs was determined via immunofluorescence and CLSM, and the results are shown in Figure 2D. The [email protected]@SiO2-PEG-Ab NPs appeared red due to loading of the Cy5.5 dye, and strong green fluorescence was observed due to specific binding of the FITC-labeled secondary antibody to YPSMA-1, while no obvious green fluorescence was found in the control group. These results suggest that YPSMA-1 bound efficiently to the NP surface.
As shown in Figure 3A and B, the Gd content in the [email protected]@SiO2 and [email protected]@SiO2-PEG-Ab NPs was 56.6±4.3 and 38.2±3.7 μg/mL, respectively, and the corresponding weight percentages were 11.3±0.86 and 7.6±0.74%. Compared with the weight percentage of Gd in the [email protected]@SiO2 NPs, [email protected]@SiO2-PEG-Ab NPs exhibited a lower Gd weight percentage (P<0.05), possibly because combination of the PEG-COOH and mAbs with the NPs increased the molecular weight.
 |
Figure 3 Standard curve of Gd concentration (A). The Gd content in [email protected]@SiO2 and [email protected]@SiO2-PEG-Ab NPs determined by ICP-AES (B). Profiles of Gd3+ ion release from [email protected]@SiO2 and [email protected]@SiO2-PEG-Ab NPs in PBS with 10% FBS at 37 °C (C). T1-weighted MR images (D) and r1 curves (E) of [email protected]@SiO2-PEG-Ab NPs, [email protected]@SiO2 NPs and gadodiamide at several Gd concentrations. UV-Vis absorption spectra (F) and fluorescence spectra (G) of free Cy5.5, [email protected]@SiO2 and [email protected]@SiO2-PEG-Ab NPs. (*P<0.05). |
The stability of Gd3+ in the NPs is extremely important due to the high toxicity of free Gd3+ ions. Figure 3C shows that the quantity of Gd3+ ions released from the [email protected]@SiO2 and [email protected]@SiO2-PEG-Ab NPs was 2.38±0.1 and 1.28±0.09% after 120 h, respectively. Compared with the release of Gd3+ ions from the [email protected]@SiO2 NPs, the [email protected]@SiO2-PEG-Ab NPs released fewer Gd3+ ions after incubation for 120 h (P<0.05). The possible reason is that the PEG and antibodies coated the surface of NPs, slowing the release of Gd3+ ions from the NPs.25 In fact, the release rates of Gd3+ ions from both the [email protected]@SiO2 and [email protected]@SiO2-PEG-Ab NPs were lower than that from gadodiamide.26 These results indicate that the [email protected]@SiO2 and [email protected]@SiO2-PEG-Ab NPs were very stable in the simulated in vitro environment.
As shown in Figure 3D, T1-weighted MR images were brighter with increasing Gd concentration. The r1 values were determined by curve fitting of 1/T1 vs the Gd concentration, and the resulting values for [email protected]@SiO2-PEG-Ab and [email protected]@SiO2 NPs were 12.53 and 10.31 mM−1 s−1 (Figure 3E), respectively. Although the reason the r1 value of the [email protected]@SiO2-PEG-Ab NPs was greater than that of the [email protected]@SiO2 NPs (P<0.05) was not clear, one possibility is that the larger molecules with longer rotational correlation times had a higher MRI relaxivity.27 Compared with the r1 value of gadodiamide (3.82 mM−1 s−1 under the same conditions), the [email protected]@SiO2-PEG-Ab and [email protected]@SiO2 NPs had higher r1 values, which contribute to improved MR performance. Cao et al reported that the r1 value of Gd@SiO2-DOX/ICG-PDC NPs was greater than that of Magnevist®.25
UV/Vis absorption spectroscopy was used to confirm conjugation of Cy5.5-NHS to the NPs. As shown in Figure 3F and G, Cy5.5-NHS in ethanol primarily exhibited an absorption band at 677 nm, which was also present in the spectrum of the [email protected]@SiO2 and [email protected]@SiO2-PEG-Ab NPs. The fluorescence emission profile showed a peak at 710 nm in all the samples, indicating conjugation of Cy5.5 to the NPs.
In vitro cellular uptake studies
The cellular uptake efficiency of the [email protected]@SiO2-PEG-Ab NPs in LNCaP and PC3 cells was evaluated using CLSM. As shown in Figure 4A, the nuclei of all the cells were stained blue with DAPI. Red fluorescence was observed around the PSMA receptor-positive LNCaP cells.28,29 Because PC3 cells are PSMA receptor-negative cells,28 only a single cell showed a small amount of red fluorescence, suggesting that increased [email protected]@SiO2-PEG-Ab NP binding is due to receptor-mediated immunoreactions. These results, which provided the foundation for the in vivo experiments, indicate that the [email protected]@SiO2-PEG-Ab NPs successfully bound to the PSMA antigen in vitro.
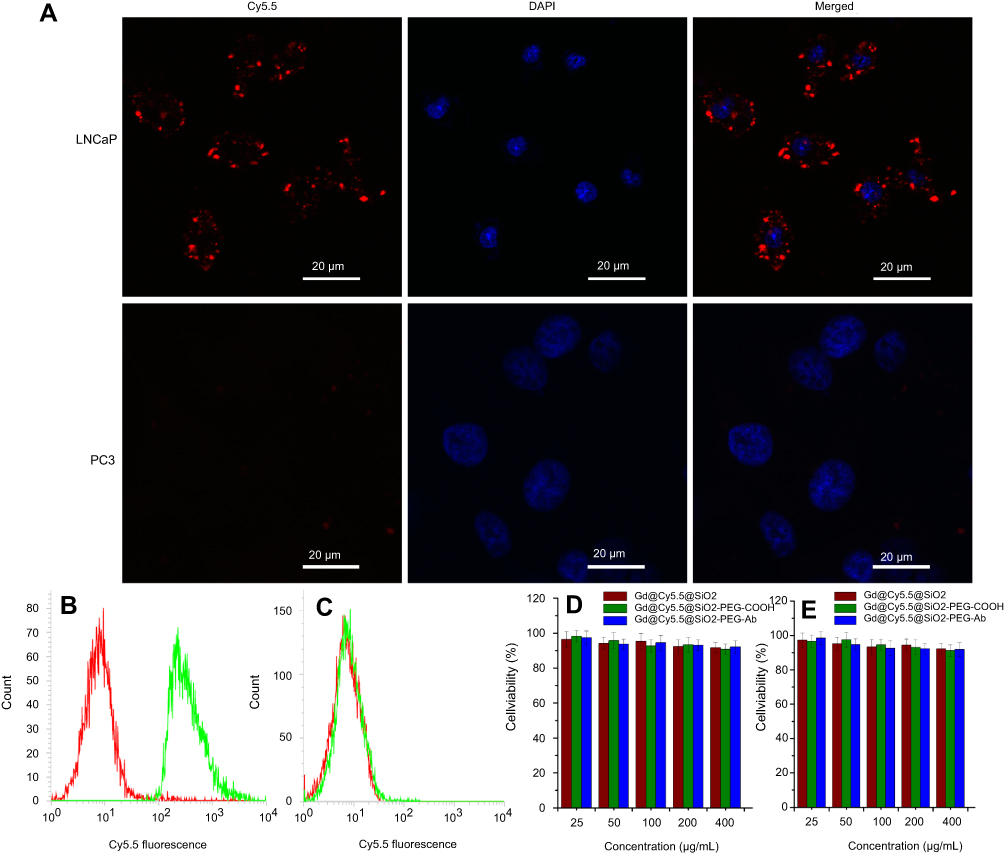 |
Figure 4 Fluorescence images of LNCaP and PC3 cells incubated with [email protected]@SiO2-PEG-Ab NPs for 2 h (A). Flow cytometry results for LNCaP (B) and PC3 cells (C) incubated with [email protected]@SiO2-PEG-Ab NPs. Cytotoxicity against LNCaP (D) and PC3 (E) cells after incubation with different concentrations of various NPs for 24 h. |
As shown in Figure 4B and C, the results of flow cytometric analysis showed that the binding rate of the [email protected]@SiO2-PEG-Ab NPs to LNCaP cells was 99.76%, whereas that of the [email protected]@SiO2-PEG-Ab NPs to PC3 cells was 1.75%. These results are in agreement with those observed in the CLSM images.
In vitro cytotoxicity studies
Figure 4D and E demonstrates that there was no significant cytotoxicity after 24 hrs of incubation with the various NPs within the detected concentration range, suggesting that these NPs exhibited little toxicity toward LNCaP and PC3 cells (P>0.05), which is in agreement with the results of other studies.30
In vivo MRI studies
Figure 5A and B showed HE staining images of PC3 and LNCaP PCa xenograft models in nude mice. The efficacy of the [email protected]@SiO2-PEG-Ab NPs as MR contrast agents in vivo is shown in Figure 5C. The SI of the tumors in subgroup A1 after injection of the [email protected]@SiO2-PEG-Ab NPs showed obvious enhancement and reached a maximum after 3 h. Then, the SI decreased, and the enhanced signal from the tumor tissue was not observed after 24 h (Figure 5C). The SI of tumors in subgroup B1 was slightly enhanced at 1 h after injection of the [email protected]@SiO2-PEG-Ab NPs, after which the degree of enhancement decreased (Figure 5C). The SI of the tumors in these two groups significantly differed at both 1 and 3 h (P<0.05). The SI of the tumors in subgroups A2 and B2 after injection of gadodiamide was not significantly enhanced. Figure 5D shows significant differences in subgroup A1 and A2 between 1 and 3 h after injection of the NPs and gadodiamide (P<0.05). One possible reason for these findings is that although gadodiamide has a non-specific enhancement effect, the concentration of gadodiamide injected in this experiment was very low (0.01 mmol/kg), and the enhancement effect of gadodiamide may be negligible. Due to the high relaxation rate of the [email protected]@SiO2-PEG-Ab NPs and the enhanced permeability and retention effect of the tumor tissue, we observed that the SI of subgroup A1 was significantly enhanced. The tumor tissue in subgroup A1 showed a significantly enhanced signal, whereas the tumor tissue in subgroup B1 showed a slightly enhanced signal, indicating that the [email protected]@SiO2-PEG-Ab NPs had a targeting effect and could accumulate in tumor tissue. In addition, the [email protected]@SiO2-PEG-Ab NP dose that was used was much lower than that required for common contrast agents (eg, 0.1 mmol/kg for gadodiamide),31 suggesting that the [email protected]@SiO2-PEG-Ab NPs have the potential to be used as a specific MR contrast agent for PCa detection.
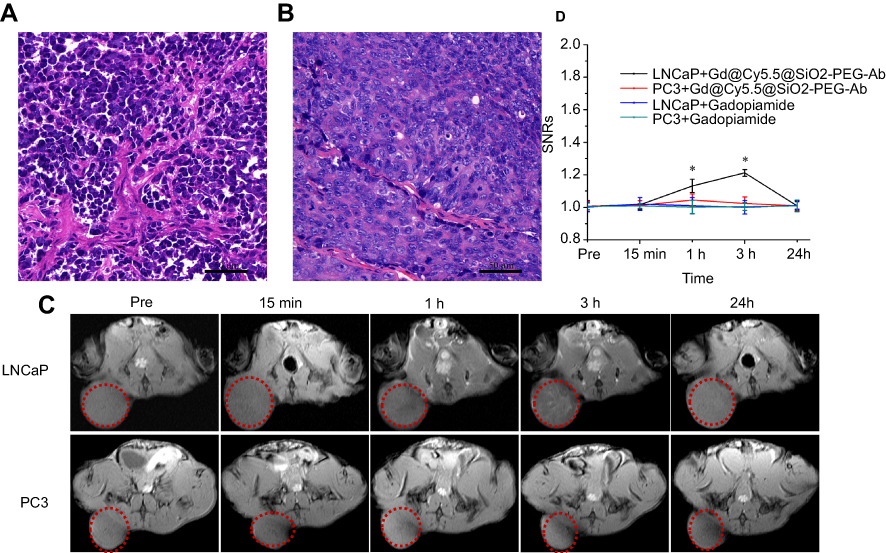 |
Figure 5 HE staining of PC3 (A) and LNCaP (B) xenografts in nude mice. T1-weighted in vivo MR images before and after injection of [email protected]@SiO2-PEG-Ab NPs in subgroups A1 and B1 (C). Time vs SNR curves of subgroups A1-2 and B1-2 before and after injection of [email protected]@SiO2-PEG-Ab NPs and gadodiamide (D) (*P<0.05). |
In vivo fluorescence imaging studies
The in vivo distribution and tumor targeting ability of the [email protected]@SiO2-PEG-Ab NPs in the LNCaP and PC3 groups were analyzed using a whole-animal near-infrared imaging system, and the results are shown in Figure 6. At 1 h post-injection, a fluorescence signal was observed at the tumor site in the A3 subgroup. Moreover, the fluorescence signal at the tumor site in the A3 subgroup was stronger than that at the tumor site in the B3 subgroup. The strong fluorescence signal was located in the abdomen in all the groups. At 3 h post-injection, the fluorescence signal at the tumor site in the A3 subgroup reached a maximum. In addition, the tumor fluorescence signal in the targeted group was significantly greater than that in the non-targeted groups. At 24 h post-injection, the fluorescence signal was not observed at the tumor site in any of the groups. These results indicate that the [email protected]@SiO2-PEG-Ab NPs have in vivo targeting ability.
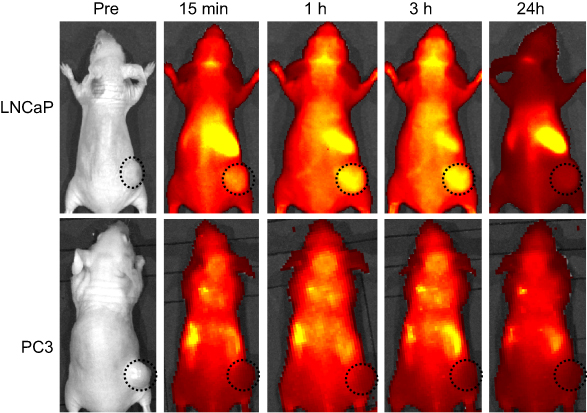 |
Figure 6 In vivo fluorescence images before and after injection of [email protected]@SiO2-PEG-Ab NPs in subgroups A3 and B3. |
In vivo toxicity of the [email protected]@SiO2-Ab NPs
All the mice survived until the end of the experiment. In addition, the body weight and psychological state of the mice did not significantly differ before and after injection. Table 2 shows that the aspartate transaminase (AST), alanine aminotransferase (ALT), total bilirubin (T-BIL), blood urea nitrogen (BUN) and creatinine (CREA) levels did not significantly change from before to after NP injection (P>0.05). Histopathological analysis showed that no obvious pathological changes were present in the major organs at 1 d and 3 d after injection of the NPs (Figure 7). Therefore, the in vivo toxicity evaluation suggests that the NPs are biocompatible.
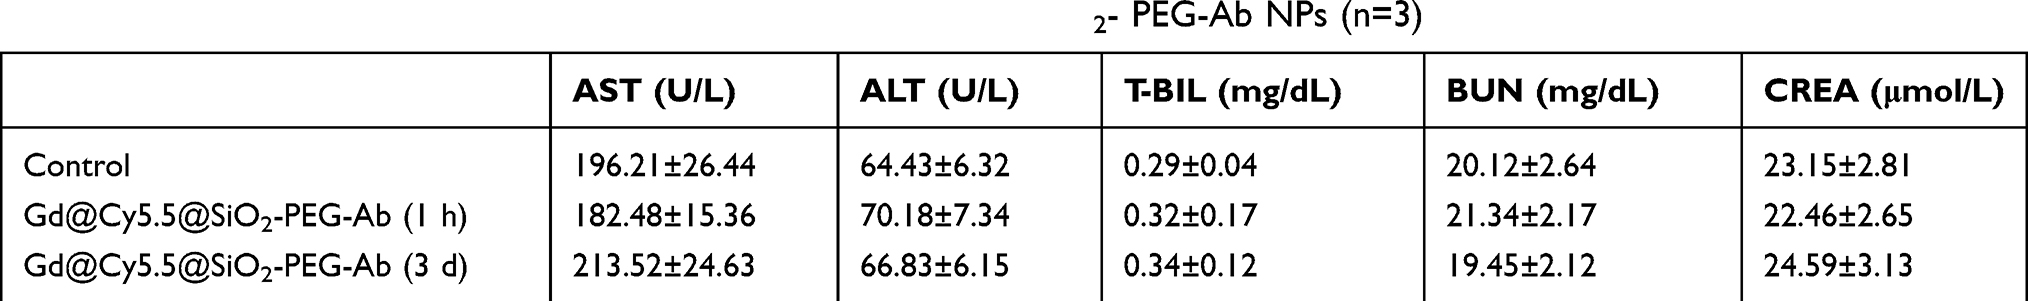 |
Table 2 Blood chemistry of nude mice injected with [email protected]@SiO2- PEG-Ab NPs (n=3) |
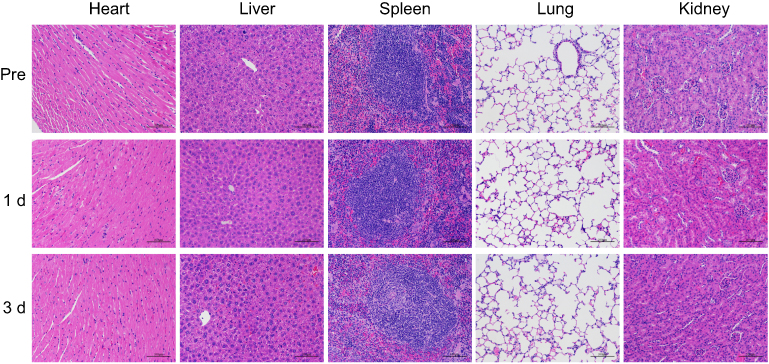 |
Figure 7 HE staining of heart, liver, spleen, lung and kidney samples before,1 d and 3 d after injection of [email protected]@SiO2-PEG-Ab NPs. |
Conclusion
As expected, we successfully synthesized [email protected]@SiO2-PEG-Ab NPs for targeting of PSMA-positive PCa cells. The r1 value of the NPs was higher than that of gadodiamide, reaching 12.53 mM−1 s−1. The NPs were high stability, and release of Gd3+ ions was only 1.28±0.09% after 120 h. Furthermore the NPs showed satisfactory biocompatibility and specific targeting against PSMA. Tumor tissues were significantly enhanced after injection of the NPs (Gd concentration of 0.01 mmol/kg). In addition, Strong optical imaging signals were observed for the [email protected]@SiO2-PEG-Ab NPs in PSMA-positive PCa model mice. We believe that this study provides a potentially useful method for specific diagnosis of PCa with a novel and specific dual-modal MRI/fluorescence contrast agent. The results show that the novel targeted NPs have potential as specific, dual-mode contrast agents in MRI and fluorescence imaging for PCa diagnosis.
Acknowledgments
This work was supported by the National Natural Science Foundation of China (81401382). The authors thank American Journal Experts (AJE) for their assistance with language editing.
Disclosure
The authors report no conflicts of interest in this work.
References
1. Bray F, Ferlay J, Soerjomataram I, Siegel RL, Torre LA, Jemal A. Global cancer statistics 2018: GLOBOCAN estimates of incidence and mortality worldwide for 36 cancers in 185 countries. CA Cancer J Clin. 2018;68(6):394–424. doi:10.3322/caac.21492
2. Kumar V, Bora GS, Kumar R, Jagannathan NR. Multiparametric (mp) MRI of prostate cancer. Prog Nucl Magn Reson Spectrosc. 2018;105:23–40. doi:10.1016/j.pnmrs.2018.01.001
3. Dou S, Bai Y, Shandil A, et al. Detecting prostate cancer and prostatic calcifications using advanced magnetic resonance imaging. Asian J Androl. 2017;19(4):439–443. doi:10.4103/1008-682X.177840
4. Quon JS, Moosavi B, Khanna M, Flood TA, Lim CS, Schieda N. False positive and false negative diagnoses of prostate cancer at multi-parametric prostate MRI in active surveillance. Insights Imaging. 2015;6(4):449–463. doi:10.1007/s13244-015-0411-3
5. Afshar-Oromieh A, Hetzheim H, Kratochwil C, et al. The theranostic PSMA ligand PSMA-617 in the diagnosis of prostate cancer by PET/CT: biodistribution in humans, radiation dosimetry, and first evaluation of tumor lesions. J Nucl Med. 2015;56(11):1697–1705. doi:10.2967/jnumed.115.161299
6. Xing H, Bu W, Zhang S, et al. Multifunctional nanoprobes for upconversion fluorescence, MR and CT trimodal imaging. Biomaterials. 2012;33(4):1079–1089. doi:10.1016/j.biomaterials.2011.10.039
7. Harrison VS, Carney CE, MacRenaris KW, Waters EA, Meade TJ. Multimeric near IR-MR contrast agent for multimodal in vivo imaging. J Am Chem Soc. 2015;137(28):9108–9116. doi:10.1021/jacs.5b04509
8. Wang J, Shah ZH, Zhang S, Lu R. Silica-based nanocomposites via reverse microemulsions: classifications, preparations, and applications. Nanoscale. 2014;6(9):4418–4437. doi:10.1039/c3nr06025j
9. Stöber W, Fink A, Bohn E. Controlled growth of monodisperse silica spheres in the micron size range. J Colloid Interface Sci. 1968;26(1):62–69. doi:10.1016/0021-9797(68)90272-5
10. Chen F, Hableel G, Zhao ER, Jokerst JV. Multifunctional nanomedicine with silica: role of silica in nanoparticles for theranostic, imaging, and drug monitoring. J Colloid Interface Sci. 2018;521:261–279. doi:10.1016/j.jcis.2018.02.053
11. González-Alvarez M, Coll C, Gonzalez-Alvarez I, et al. Gated mesoporous silica nanocarriers for a “two-step” targeted system to colonic tissue. Mol Pharm. 2017;14(12):4442–4453. doi:10.1021/acs.molpharmaceut.7b00565
12. Chen C, Feng N, Guo Q, et al. Template-directed fabrication of MIL-101(Cr)/mesoporous silica composite: layer-packed structure and enhanced performance for CO2 capture. J Colloid Interface Sci. 2018;513:891–902. doi:10.1016/j.jcis.2017.12.014
13. Gounani Z, Asadollahi MA, Pedersen JN, et al. Mesoporous silica nanoparticles carrying multiple antibiotics provide enhanced synergistic effect and improved biocompatibility. Colloids Surf B Biointerfaces. 2019;175:498–508. doi:10.1016/j.colsurfb.2018.12.035
14. Gonçalves MC. Sol-gel silica nanoparticles in medicine: a natural choice. Design, synthesis and products. Molecules. 2018;23(8):2021. doi:10.3390/molecules23082021
15. Jiang W, He X, Fang H, Zhou X, Ran H, Guo D. Novel gadopentetic acid-doped silica nanoparticles conjugated with YPSMA-1 targeting prostate cancer for MR imaging: an in vitro study. Biochem Biophys Res Commun. 2018;499(2):202–208. doi:10.1016/j.bbrc.2018.03.124
16. Nooney R, O’Connell C, Roy S, et al. Synthesis and characterisation of far-red fluorescent cyanine dye doped silica nanoparticles using a modified microemulsion method for application in bioassays. Sensor Actuat B Chem. 2015;221:470–479. doi:10.1016/j.snb.2015.06.117
17. O’Connell CL, Nooney R, McDonagh C. Cyanine5-doped silica nanoparticles as ultra-bright immunospecific labels for model circulating tumour cells in flow cytometry and microscopy. Biosens Bioelectron. 2017;91:190–198. doi:10.1016/j.bios.2016.12.023
18. Lake ST, Greene KL, Westphalen AC, et al. Optimal MRI sequences for 68Ga-PSMA-11 PET/MRI in evaluation of biochemically recurrent prostate cancer. EJNMMI Res. 2017;7(1):77. doi:10.1186/s13550-017-0327-7
19. Kiess AP, Banerjee SR, Mease RC, et al. Prostate-specific membrane antigen as a target for cancer imaging and therapy. Q J Nucl Med Mol Imaging. 2015;59(3):241–268.
20. Tsourlakis MC, Klein F, Kluth M, et al. PSMA expression is highly homogenous in primary prostate cancer. Appl Immunohistochem Mol Morphol. 2015;23(6):449–455. doi:10.1097/PAI.0000000000000110
21. Nandiyanto ABD, Kim SG, Iskandar F, Okuyama K. Synthesis of spherical mesoporous silica nanoparticles with nanometer-size controllable pores and outer diameters. Micropor Mesopor Mat. 2009;120(3):447–453. doi:10.1016/j.micromeso.2008.12.019
22. Tan J, Yang N, Zhong L, et al. A new theranostic system based on endoglin aptamer conjugated fluorescent silica nanoparticles. Theranostics. 2017;7(19):4862–4876. doi:10.7150/thno.19101
23. Koopaei MN, Dinarvand R, Amini M, et al. Docetaxel immunonanocarriers as targeted delivery systems for her 2-positive tumor cells: preparation, characterization, and cytotoxicity studies. Int J Nanomed. 2011;6:1903–1912.
24. Lee S, George Thomas R, Ju Moon M, et al. Near-infrared heptamethine cyanine based iron oxide nanoparticles for tumor targeted multimodal imaging and photothermal therapy. Sci Rep. 2017;7(1):2108. doi:10.1038/s41598-017-01108-5
25. Cao M, Wang P, Kou Y, et al. Gadolinium (III)-chelated silica nanospheres integrating chemotherapy and photothermal therapy for cancer treatment and magnetic resonance imaging. ACS Appl Mater Interfaces. 2015;7(45):25014–25023. doi:10.1021/acsami.5b06938
26. Frenzel T, Lengsfeld P, Schirmer H, Hütter J, Weinmann HJ. Stability of gadolinium-based magnetic resonance imaging contrast agents in human serum at 37 degrees C. Invest Radiol. 2008;43(12):817–828. doi:10.1097/RLI.0b013e3181852171
27. Xu W, Lu Y. A smart magnetic resonance imaging contrast agent responsive to adenosine based on a DNA aptamer-conjugated gadolinium complex. Chem Commun. 2011;47(17):4998–5000. doi:10.1039/c1cc10161g
28. Chatalic KL, Veldhoven-Zweistra J, Bolkestein M, et al. A novel 111In-labeled anti-prostate-specific membrane antigen nanobody for targeted SPECT/CT imaging of prostate cancer. J Nucl Med. 2015;56(7):1094–1099. doi:10.2967/jnumed.115.156729
29. Tykvart J, Navrátil V, Sedlák F, et al. Comparative analysis of monoclonal antibodies against prostate-specific membrane antigen (PSMA). Prostate. 2014;74(16):1674–1690. doi:10.1002/pros.22887
30. Zhao L, Ge X, Yan G, et al. Double-mesoporous core-shell nanosystems based on platinum nanoparticles functionalized with lanthanide complexes for in vivo magnetic resonance imaging and photothermal therapy. Nanoscale. 2017;9(41):16012–16023. doi:10.1039/c7nr04983h
31. Homayoon B, Diwakar H, Strovski E, et al. Half-dose gadobenate dimeglumine versus standard-dose gadodiamide in dynamic magnetic resonance imaging of non-cirrhotic livers: a retrospective intra-individual crossover comparison. Abdom Imaging. 2014;39(5):955–962. doi:10.1007/s00261-014-0123-z
 © 2019 The Author(s). This work is published and licensed by Dove Medical Press Limited. The full terms of this license are available at https://www.dovepress.com/terms.php and incorporate the Creative Commons Attribution - Non Commercial (unported, v3.0) License.
By accessing the work you hereby accept the Terms. Non-commercial uses of the work are permitted without any further permission from Dove Medical Press Limited, provided the work is properly attributed. For permission for commercial use of this work, please see paragraphs 4.2 and 5 of our Terms.
© 2019 The Author(s). This work is published and licensed by Dove Medical Press Limited. The full terms of this license are available at https://www.dovepress.com/terms.php and incorporate the Creative Commons Attribution - Non Commercial (unported, v3.0) License.
By accessing the work you hereby accept the Terms. Non-commercial uses of the work are permitted without any further permission from Dove Medical Press Limited, provided the work is properly attributed. For permission for commercial use of this work, please see paragraphs 4.2 and 5 of our Terms.