")
Back to Journals » Clinical Interventions in Aging » Volume 9
Pattern of cerebral hyperperfusion in Alzheimer's disease and amnestic mild cognitive impairment using voxel-based analysis of 3D arterial spin-labeling imaging: initial experience
Authors Ding B, Ling HW, Zhang Y, Huang J, Zhang H, Wang T, Yan FH
Received 7 December 2013
Accepted for publication 14 February 2014
Published 26 March 2014 Volume 2014:9 Pages 493—500
DOI https://doi.org/10.2147/CIA.S58879
Checked for plagiarism Yes
Review by Single anonymous peer review
Peer reviewer comments 3
Bei Ding,1 Hua-wei Ling,1 Yong Zhang,2 Juan Huang,1 Huan Zhang,1 Tao Wang,3 Fu Hua Yan1
1Department of Radiology, Ruijin Hospital, School of Medicine, Shanghai Jiao Tong University, 2Applied Science Laboratory, GE Healthcare, 3Department of Gerontology, Shanghai Mental Health Center, Shanghai, People's Republic of China
Purpose: A three-dimensional (3D) continuous pulse arterial spin labeling (ASL) technique was used to investigate cerebral blood flow (CBF) changes in patients with Alzheimer's disease (AD), amnestic mild cognitive impairment (aMCI), and age- and sex-matched healthy controls.
Materials and methods: Three groups were recruited for comparison, 24 AD patients, 17 MCI patients, and 21 age- and sex-matched control subjects. Three-dimensional ASL scans covering the entire brain were acquired with a 3.0 T magnetic resonance scanner. Spatial processing was performed with statistical parametric mapping 8. A second-level one-way analysis of variance analysis (threshold at P<0.05) was performed on the preprocessed ASL data. An average whole-brain CBF for each subject was also included as group-level covariates for the perfusion data, to control for individual CBF variations.
Results: Significantly increased CBF was detected in bilateral frontal lobes and right temporal subgyral regions in aMCI compared with controls. When comparing AD with aMCI, the major hyperperfusion regions were the right limbic lobe and basal ganglia regions, including the putamen, caudate, lentiform nucleus, and thalamus, and hypoperfusion was found in the left medial frontal lobe, parietal cortex, the right middle temporo-occipital lobe, and particularly, the left anterior cingulate gyrus. We also found decreased CBF in the bilateral temporo-parieto-occipital cortices and left limbic lobe in AD patients, relative to the control group. aMCI subjects showed decreased blood flow in the left occipital lobe, bilateral inferior temporal cortex, and right middle temporal cortex.
Conclusion: Our results indicated that ASL provided useful perfusion information in AD disease and may be used as an appealing alternative for further pathologic and neuropsychological studies, especially of compensatory mechanisms for cerebral hypoperfusion.
Keyword: Alzheimer's disease, amnestic mild cognitive impairment, perfusion image, arterial spin labeling
Introduction
Alzheimer’s disease (AD) shows gradual onset and is progressive. In addition to the fundamental pathological changes in AD, including senile plaques and neurofibrillary pathology,1 vascular factors also play a critical role in the pathogenesis of AD.2,3 Previous research found decreased regional cerebral blood flow (CBF) in AD.4 Indeed, perfusion deficiencies are present from very early preclinical phases of AD (ie, during mild cognitive impairment [MCI]) and persist well into the latest stages, demonstrating a pattern of increased hypoperfusion with disease development.
Positron emission tomography (PET) has been generally regarded as the gold standard for the evaluation of brain perfusion. Previous PET and single-photon emission computed tomography (SPECT) studies have shown metabolic and perfusion reductions in AD.5–7 However, PET scanning has several disadvantages, including the need for injection of radioactive tracers and limited availability in comparison with magnetic resonance imaging (MRI) scanners. Arterial spin-labeled (ASL) perfusion MRI uses the water in arteries as an endogenous contrast media to help visualize tissue perfusion and provide quantitative assessment of CBF, without radiation or need for an intravenous line, which eliminates the side effects of contrast media and exposure to radiation.8 Previous studies have found that ASL-MRI detects a regional pattern of hypoperfusion in AD similar to PET and SPECT.9–11
Most previous ASL research was based on either conventional two-dimensional multislice or three-dimensional (3D) gradient echo-based techniques and suffered from motion and reducing susceptibility artifacts.12–14 We now apply a new continuous pulse ASL (pCASL) method and 3D fast spin echo (3D-FSE) with spiral readout to further increase the signal-to-noise ratio and reduce motion artifacts and distortion in regions of high magnetic susceptibility.15,16 In this study, we used voxel-based analysis to test whether this new 3D-FSE pCASL MRI could detect regional patterns of perfusion changes in AD and MCI versus cognitively normal (CN) subjects.
Patients and methods
Subjects
We recruited 62 participants for this prospective study between December 2010 and February 2012, including 24 patients with AD,17 with amnestic mild cognitive impairment (aMCI), and 21 healthy age-matched CN controls. Participants were examined by structural MRI and 3D pCASL MRI.
All participants provided a detailed medical history and underwent neurologic examination, screening laboratory testing, and a standard battery of neuropsychological tests, which included the Mini-Mental Status Examination (MMSE)18 for global cognitive ability and the Clinical Dementia Rating Scale.17 A diagnosis of probable AD was made using the joint criteria from the National Institute of Neurological and Communicative Disorders and Stroke and Alzheimer’s Disease and Related Disorders Association.19 A diagnosis of aMCI was made according to the Petersen or the Alzheimer’s Disease Cooperative Study criteria.20 All participants were right-handed. The MMSE score for AD and MCI patients ranged from 9–23 and 24–26, respectively.
Exclusion criteria included the following: patients diagnosed with metabolic diseases that could interfere with cognitive functioning; patients with other brain diseases or pathological brain scan findings, including significant cerebrovascular diseases (cortical infarctions or multiple lacunas lesions); and patients with depression or dysthymia, according to the Diagnostic and Statistical Manual of Mental Disorders, Fourth Edition (DSM-IV) criteria.
CN subjects underwent a structured interview to exclude patients with cognitive dysfunction, substance abuse, psychiatric disease, neurologic disease, major heart disease, diabetes, vascular disease, or head trauma. All CN subjects scored above 27 out of 30 on the MMSE.
The study was approved by the local ethics committee, and all subjects provided written, informed consent.
Image acquisition
Images were acquired using a standard magnetic resonance scanner (Signa® Excite 3.0 T MRI; GE Healthcare, Little Chalfont, UK) with an 8-Channel Phased Array head coil for radiofrequency transmission and reception.
Routine protocols included axial diffusion-weighted echo planar sequences (b-value =1,000 s/mm2, repetition time (TR)/echo time (TE): 6,000/66.9), T1-weighted gradient-echo sequences (TR/TE/inversion time: 11.3/5.3/300), and T2-weighted FSE sequences (TR/TE: 5,000/72.5).
For brain tissue segmentation and image registration to a brain anatomy template, T1-weighted images were acquired using an axial 3D brain volume imaging (3D-BRAVO™) (GE Healthcare) sequence with a repetition time of 10 ms, echo time of 7 ms, inversion time of 300 ms, 15° flip angle, and 1.00 × 1.00 mm in-plane resolution.
ASL images were acquired with a 3D pCASL sequence that uses a pseudocontinuous labeling technique15 and an FSE acquisition with an interleaved stack of spiral (outward direction) readout and a centric ordering in the slice-encoding direction, as shown in Figure 1. Selective inversion and saturation pulses were applied to a slab containing the imaged region and ending at the labeling plane. In addition to the background suppression pulses, inferior saturation pulses were applied to suppress the inflowing arterial blood spins after labeling was completed. A continuous pulse scheme was employed with a labeling duration of 1 second. Other acquisition parameters were as follows: 8 arms with 512 points in each spiral arm, phase encoding in the left-right direction, bandwidth = ±62.5 kHz, section thickness =4 mm, TR =1,350 msec, TE =5 msec, flip angle =155°, postlabel delay =1.5 seconds, image reconstruction matrix =128 × 128, field of view =24 cm, and number of excitations =3.
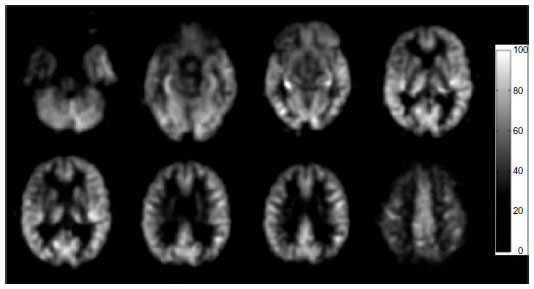 | Figure 1 A set of CBF images of one 68-year-old control subject, from a pCASL scan. |
Spatial processing
Following acquisition and image reconstruction, the data were transferred to an offline personal computer for image processing and analysis. All subsequent image processing was performed by one of the authors (YZ).
ASL difference maps between tag and control pairs were averaged for each subject, to form an individual whole-brain perfusion-weighted map. Quantitative CBF maps, in units of mL/100 g/min, were calculated based on a single-compartment ASL model, using the vender-provided toolbox.21 Voxel-based analysis was performed using statistical parametric mapping (SPM8; Wellcome Trust Centre for Neuroimaging, London, United Kingdom). Spatial transformation included a 3D rigid body registration to correct for head motion, followed by a nonlinear warping to spatially normalize CBF maps into a standard stereotaxic space, using the Montreal Neurological Institute template. The final CBF maps were resampled to a 2 × 2 × 2 mm3 isotropic voxel size. An isotropic Gaussian smoothing kernel (full width at half maximum =6 mm) was applied to improve the signal-to-noise ratio.
Statistical analysis
Group differences in age, education, and MMSE scores were analyzed using one-way analysis of variance with a least significant differences post hoc analysis. The sex effects were tested with Student’s t-tests.
A second-level one-way analysis of variance was performed to identify the perfusion differences between each pair of AD versus NC, aMCI versus NC, and AD versus aMCI. The average whole-brain CBF for each subject was included as group-level covariates for perfusion measurement, to control for the individual CBF variation. The significance level of perfusion differences was determined with Student’s t-tests between each pair of groups. The statistical results were further corrected for multiple comparisons. Monte Carlo simulations were performed using the AlphaSim program (http://afni.nimh.nih.gov/pub/dist/doc/manual/AlphaSim.pdf) implemented in AFNI to control the false-positive rate. The threshold for uncorrected statistics was set at P<0.01 for the cluster size of more than 125 contiguous voxels, resulting in a corrected significance level of P<0.05.
Results
Demographics, clinical data
Table 1 shows demographic information for the three study groups. All groups were of a similar age and were balanced for sex. The mean ages of the CN and AD patients were essentially equal (two-tailed grouped t-test: t=0.998, P=0.324). The groups showed a similar sex distribution (χ2=−0.405, P>0.05). Education level was similar in the CN and AD patients (P>0.05). The mean MMSE scores of the two groups were significantly different (P<0.01).
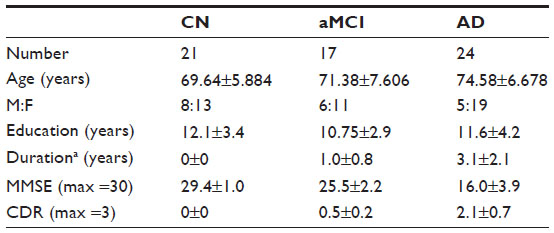 | Table 1 Demographic characteristics of patients and controls |
The mean MMSE score in the AD group was 21.0 (range: 17–26), which represents mild to moderate dementia.
AD group versus CN group
Figure 2 shows the differences in absolute CBF between patients with AD and the CN patients, and the cluster-level statistics for all rendered clusters are summarized in Table 2. At an AlphaSim-corrected significance level of P<0.05, in AD, hypoperfusion was demonstrated in the bilateral parieto-occipital cortices (including both sides of the superior, middle, and inferior occipital gyri, the cuneus, superior parietal lobule, left inferior occipital lobe, right precuneus, and left parahippocampal gyrus), right fusiform gyrus, and left splenium of the corpus callosum. Significant hyperperfusion was found in the bilateral thalami, right caudate nucleus and putamen, paracentral lobule, and the right side of the white matter in the temporal lobe (Figure 2). There were no clusters of significant hypoperfusion seen in the primary motor or sensory cortices.
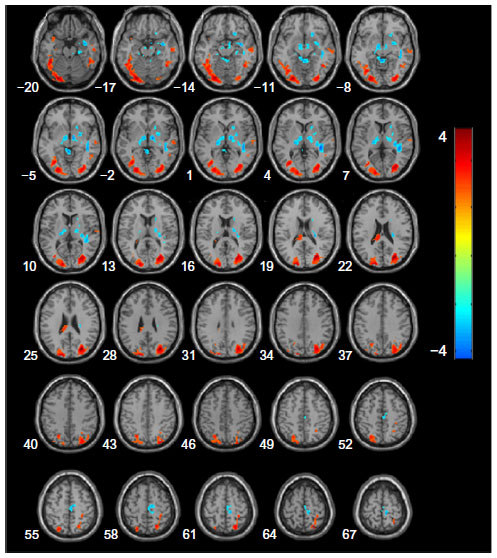 | Figure 2 Statistical parametric map of significant cerebral blood flow differences between AD and CN patients. |
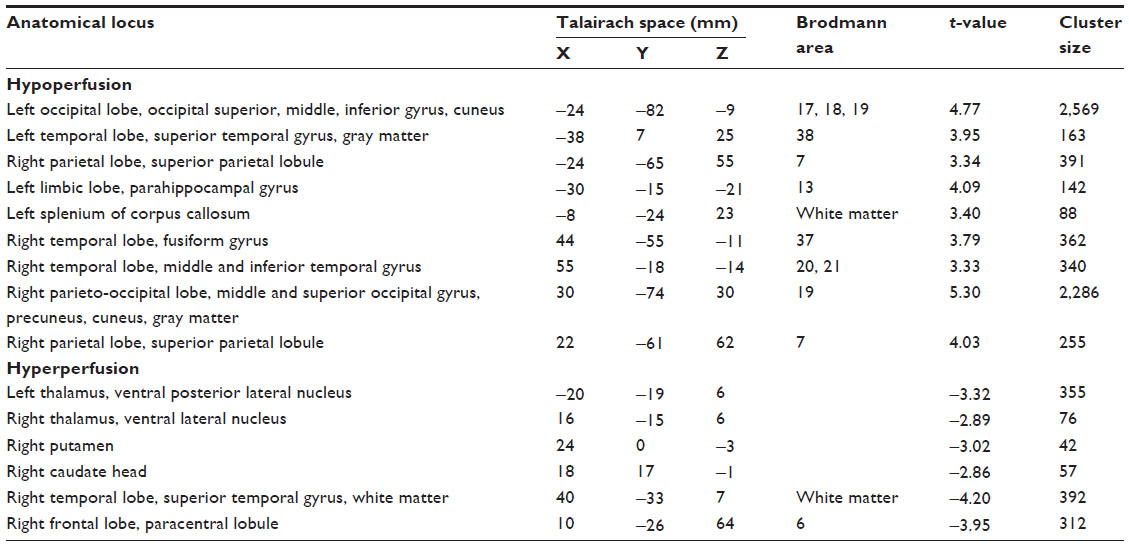 | Table 2 Regional perfusion differences in contrast in AD and CN patients |
MCI group versus CN group
Figure 3 shows the results of a direct comparison of perfusion in patients with aMCI and CN, and the coordinates of the peaks are listed in Table 3. At an AlphaSim-corrected significance level of P<0.05, a lower CBF was seen in aMCI than CN, in the left cuneus, left fusiform gyrus, bilateral inferior temporal cortices, right middle temporal cortex, and the right superior parietal lobe. Meanwhile, increased CBF was detected in bilateral frontal lobes and right temporal subgyral regions.
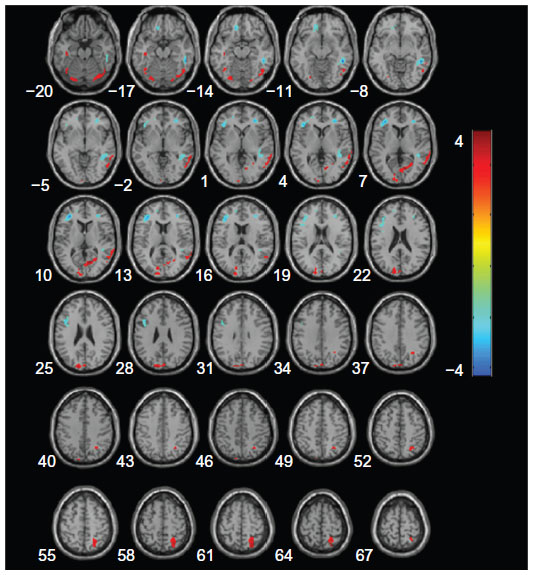 | Figure 3 Statistical parametric map of significant cerebral blood flow differences between aMCI and CN patients. |
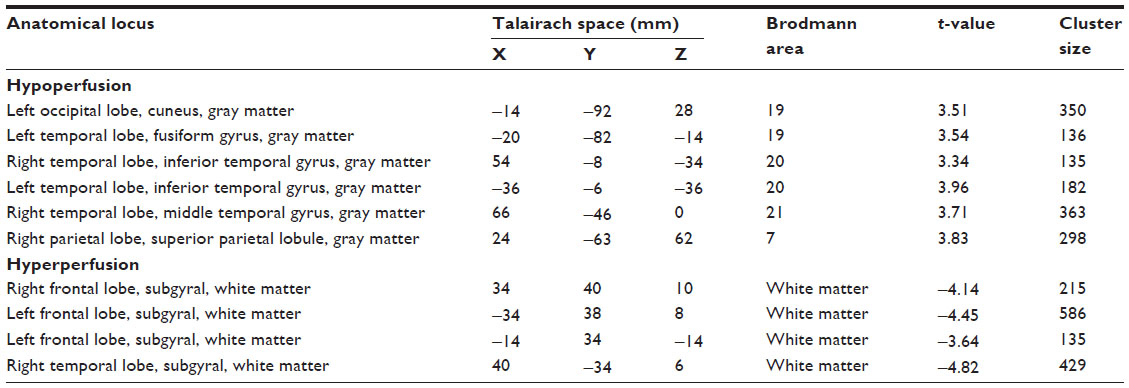 | Table 3 Regional perfusion differences in contrast in aMCI and CN patients |
MCI group versus AD group
A significant cluster of hypoperfusion was found encompassing portions of the left medial frontal lobe, left parietal cortex, right middle temporo-occipital lobe, and in particular, the left side of the anterior cingulate gyrus (Figure 4), and the coordinates of the peaks are listed in Table 4. Compared with the aMCI group, hyperperfusion in AD was shown in the right medial frontal gyrus, right paracentral lobule, right limbic lobe (including the posterior cingulate and cuneus, right fusiform, and parahippocampal gyrus), and the right basal ganglia region (putamen, caudate, lentiform nucleus, and thalamus).
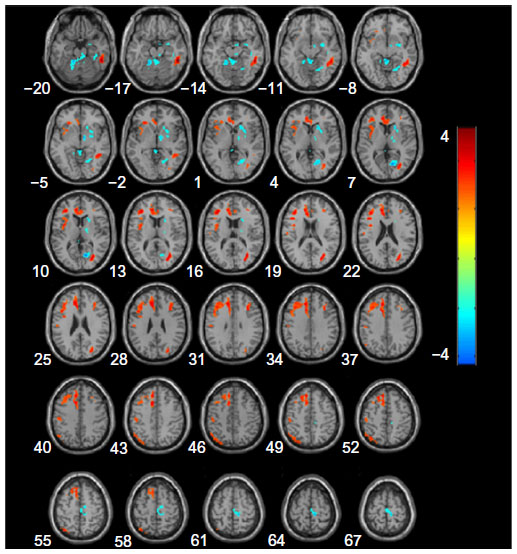 | Figure 4 Statistical parametric map of significant cerebral blood flow differences between patients with aMCI and AD. |
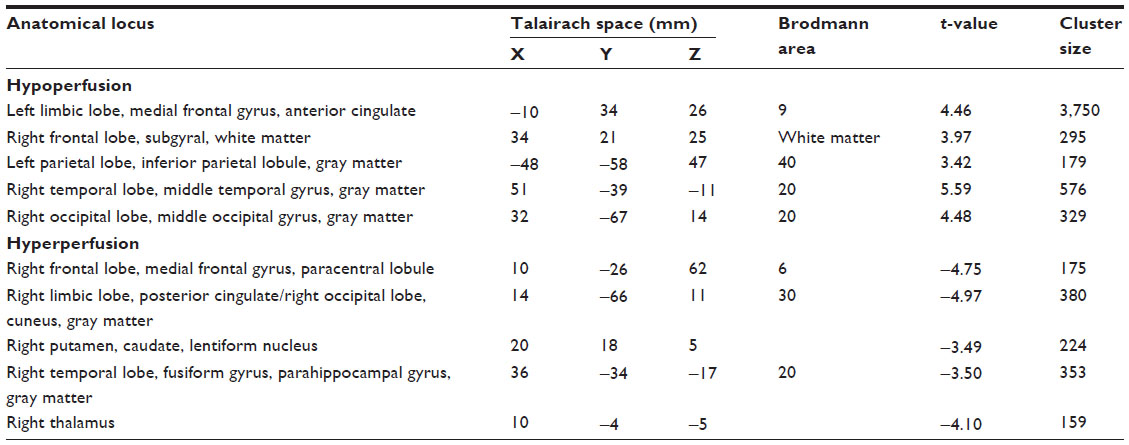 | Table 4 Regional perfusion differences in contrast, in patients with aMCI and AD |
Discussion
The most important findings in our 3D ASL research were the hyperperfusion patterns in the aMCI and AD groups. Compared with CN, aMCI showed increased CBF in the bilateral frontal lobes and right temporal subgyral regions. When AD patients were compared with aMCI, the major hyperperfusion regions were the right limbic lobe and basal ganglia regions, including putamen, caudate, and thalamus, and hypoperfusion was found in the left medial frontal lobe, parietal cortex, right middle temporo-occipital lobe, and in particular, the left anterior cingulate gyrus. The results may suggest that different patterns of hyperperfusion correspond to different stages of cognitive decline.
Hyperperfusion can serve as a compensatory mechanism against cognitive decline in normal aging, MCI, and early stages of AD.22–25 A previous study demonstrated hyperperfusion in the prefrontal cortex (PFC).26 Models of neurocognitive aging suggest that the PFC is the seat of compensatory recruitment in older adults and sometimes in MCI.22,25 Mozolic et al have recently demonstrated that cognitive training increases regional (r)CBF in the rostrolateral PFC in older adults and that this increase in rCBF correlates with an increase in these patients’ performance on attention tasks.23 All these reports support our findings in aMCI, suggesting hyperperfusion in the frontal lobe may compensate for early cognitive decline.
A recent study reported elevated blood flow in the hippocampus, parahippocampal gyrus, temporal pole, and superior temporal gyrus in AD compared with healthy controls, which is in agreement with our findings.27 In addition to these similar findings, we have found that the CBF in the right basal ganglia regions increased with decreasing CBF in the frontal lobe.
Clement and Belleville reported a functional MRI study in which MCI patients were divided into two groups based on the Mattis Dementia Rating Scale scores. Higher-cognition MCI patients showed activation of the right prefrontal cortex during verbal memory tasks, while lower-cognition MCI patients and control subjects did not.24 This suggests that PFC compensation is present at the beginning of the MCI continuum but eventually breaks down as symptoms increase in severity. Hypoperfusion in the frontal lobe may be the main cause of the decompensation according to our results. Fortunately, there is another compensatory pathway – the basal ganglia.
The basal ganglia play important roles in higher-cognitive functions, such as in reinforcement learning and procedural memory. An anatomical study of the neuronal connections between the basal ganglia, cerebral cortex, and thalamus have demonstrated that these nuclei and cortical areas are interconnected via independent parallel loop circuits.28 The associations and limbic cortices project to specific domains in the striatum, which projects back to the corresponding cortical areas via the substantia nigra/globus pallidus and the thalamus.29 Therefore, when the frontal cortices undergo atrophy and dysfunction, the basal ganglia and thalamic inhibitory activity will decline, and high perfusion in this region will be noted. The increased rCBF occurring in the fronto-striato-thalamic circuitry may play an essential role in the modulation of behavior and cognition in the stages of AD.
Furthermore, in this study, we also observed high perfusion changes in the right paracentral lobule in patients with AD, suggesting that the lobule might be associated with delusions and other psychiatric symptoms.30
Concerning hypoperfusion in AD, our study demonstrated significantly decreased CBF regions in the bilateral temporo-parieto-occipital cortex in AD compared with CN, which is consistent with previous research that showed remarkable hypoperfusion patterns in the posterior temporo-parietal cortex and the surrounding regions.31–33 We also found regions of hypoperfusion in the left parahippocampal gyrus and right medial temporal lobe. These similar results were also found in recent ASL studies.34–36
In comparison with normal controls, the aMCI group showed similar parieto-occipital lobe hypoperfusion, but the range sizes were relatively smaller, indicating that these patients were still at the initial stage of the disease.
Some differences exist between our results and previous studies. Hypoperfusion of the anterior cingulated region in AD patients is in contrast with the previously discussed hyperperfusion in that region.27 Dai et al found that MCI was associated with increased blood flow in the right basal ganglia compared with healthy controls, while we found this similar hyperperfusion region in the AD group.34 Several factors, including different subject populations, different imaging techniques (magnetic resonance equipment and sequences), statistical analysis, and different standards of reference may account for this discrepancy.
There are several limitations to our study. First, variability related to the conditions of imaging, alertness, and physiologic state of the research participant, medications, and diet (including caffeine and nicotine) may affect CBF. Second, because of our small sampling numbers, we investigated only one stage of dementia (either MCI or AD) and healthy controls, and we did not test within multiple stages of AD. Further study based on a large population is necessary to validate our results in the future. Finally, we did not estimate the effect of partial volume in our rCBF measurements. Observed hypoperfusion in the bilateral precunei and posterior cingulate gyri might be partly due to local gray matter volume loss. This would not have directly affected the results of the diagnostic evaluation of ASL in our study or the hyperperfusion results because there was no significant difference in the basal ganglia and frontal atrophy between AD, MCI, and the aging CN group. However, such an estimate would be important when the synergetic effects of functional assessment by ASL and morphometric assessment by structural images are evaluated in future studies.
In conclusion, our study indicates that the new 3D ASL technique with 3T MRI can be used to reveal rCBF changes in individuals with AD and aMCI patients, helping to discriminate from cognitively healthy subjects. The investigation of hyperperfusion may provide valuable information for the understanding of the compensatory mechanisms in AD disease.
Disclosure
The authors report no conflicts of interest in this work.
References
Geddes JW, Tekirian TL, Soultanian NS, Ashford JW, Davis DG, Markesbery WR. Comparison of neuropathologic criteria for the diagnosis of Alzheimer’s disease. Neurobiol Aging. 1997;18(Suppl 4):S99–S105. | |
Dede DS, Yavuz B, Yavuz BB, et al. Assessment of endothelial function in Alzheimer’s disease: is Alzheimer’s disease a vascular disease? J Am Geriatr Soc. 2007;55(10):1613–1617. | |
Zhu X, Smith MA, Honda K, et al. Vascular oxidative stress in Alzheimer disease. J Neurol Sci. 2007;257(1–2):240–246. | |
Mazza M, Marano G, Traversi G, Bria P, Mazza S. Primary cerebral blood flow deficiency and Alzheimer’s disease: shadows and lights. J Alzheimers Dis. 2011;23(3):375–389. | |
Kim EJ, Cho SS, Jeong Y, et al. Glucose metabolism in early onset versus late onset Alzheimer’s disease: an SPM analysis of 120 patients. Brain. 2005;128(Pt 8):1790–1801. | |
Shin J, Lee SY, Kim SJ, Kim SH, Cho SJ, Kim YB. Voxel-based analysis of Alzheimer’s disease PET imaging using a triplet of radiotracers: PIB, FDDNP, and FDG. Neuroimage. 2010;52(2):488–496. | |
Gray KR, Wolz R, Heckemann RA, Aljabar P, Hammers A, Rueckert D; Alzheimer’s Disease Neuroimaging Initiative. Multi-region analysis of longitudinal FDG-PET for the classification of Alzheimer’s disease. Neuroimage. 2012;60(1):221–229. | |
Roberts DA, Detre JA, Bolinger L, Insko EK, Leigh JS Jr. Quantitative magnetic resonance imaging of human brain perfusion at 1.5 T using steady-state inversion of arterial water. Proc Natl Acad Sci U S A. 1994;91(1):33–37. | |
Chen Y, Wolk DA, Reddin JS, et al. Voxel-level comparison of arterial spin-labeled perfusion MRI and FDG-PET in Alzheimer disease. Neurology. 2011;77(22):1977–1985. | |
Musiek ES, Chen Y, Korczykowski M, et al. Direct comparison of fluorodeoxyglucose positron emission tomography and arterial spin labeling magnetic resonance imaging in Alzheimer’s disease. Alzheimers Dement. 2012;8(1):51–59. | |
Xu G, Rowley HA, Wu G, et al. Reliability and precision of pseudo-continuous arterial spin labeling perfusion MRI on 3.0 T and comparison with 15O-water PET in elderly subjects at risk for Alzheimer’s disease. NMR Biomed. 2010;23(3):286–293. | |
Johnson NA, Jahng GH, Weiner MW, et al. Pattern of cerebral hypoperfusion in Alzheimer disease and mild cognitive impairment measured with arterial spin-labeling MR imaging: initial experience. Radiology. 2005;234(3):851–859. | |
Austin BP, Nair VA, Meier TB, et al. Effects of hypoperfusion in Alzheimer’s disease. J Alzheimers Dis. 2011;26 Suppl 3:S123–S133. | |
Detre JA, Wang J, Wang Z, Rao H. Arterial spin-labeled perfusion MRI in basic and clinical neuroscience. Curr Opin Neurol. 2009;22(4):348–355. | |
Dai W, Garcia D, de Bazelaire C, Alsop DC. Continuous flow-driven inversion for arterial spin labeling using pulsed radio frequency and gradient fields. Magn Reson Med. 2008;60(6):1488–1497. | |
Huang D, Wu B, Shi K, Ma L, Cai Y, Lou X. Reliability of three-dimensional pseudo-continuous arterial spin labeling MR imaging for measuring visual cortex perfusion on two 3T scanners. PLoS One. 2013;8(11):e79471. | |
Morris JC. The Clinical Dementia Rating (CDR): current version and scoring rules. Neurology. 1993;43(11):2412–2414. | |
Folstein MF, Folstein SE, McHugh PR. Mini-mental-state: a practical method for grading the cognitive state of patients for the clinician. J. Psychiatr. Res. 1975;12:189–198. | |
McKhann G, Drachman D, Folstein M, Katzman R, Price D, Stadlan EM. Clinical diagnosis of Alzheimer’s disease: report of the NINCDS-ADRDA Work Group under the auspices of Department of Health and Human Services Task Force on Alzheimer’s Disease. Neurology. 1984;34(7):939–944. | |
Petersen RC, Doody R, Kurz A, et al. Current concepts in mild cognitive impairment. Arch Neurol. 2001;58(12):1985–1992. | |
Wang J, Alsop DC, Song HK, et al. Arterial transit time imaging with flow encoding arterial spin tagging (FEAST). Magn Reson Med. 2003;50(3):599–607. | |
Park DC, Reuter-Lorenz P. The adaptive brain: aging and neurocognitive scaffolding. Annu Rev Psychol. 2009;60:173–196. | |
Mozolic JL, Hayasaka S, Laurienti PJ. A cognitive training intervention increases resting cerebral blood flow in healthy older adults. Front Hum Neurosci. 2010;4:16. | |
Clément F, Belleville S. Compensation and disease severity on the memory-related activations in mild cognitive impairment. Biol Psychiatry. 2010;68(10):894–902. | |
Cabeza R. Hemispheric asymmetry reduction in older adults: the HAROLD model. Psychol Aging. 2002;17(1):85–100. | |
Chen W, Song X, Beyea S, D’Arcy R, Zhang Y, Rockwood K. Advances in perfusion magnetic resonance imaging in Alzheimer’s disease. Alzheimers Dement. 2011;7(2):185–196. | |
Alsop DC, Casement M, de Bazelaire C, Fong T, Press DZ. Hippocampal hyperperfusion in Alzheimer’s disease. Neuroimage. 2008;42(4):1267–1274. | |
Alexander GE, DeLong MR, Strick PL. Parallel organization of functionally segregated circuits linking basal ganglia and cortex. Annu Rev Neurosci. 1986;9:357–381. | |
Haber SN, Calzavara R. The cortico-basal ganglia integrative network: the role of the thalamus. Brain Res Bull. 2009;78(2–3):69–74. | |
Spalletta G, Musicco M, Padovani A, et al. Neuropsychiatric symptoms and syndromes in a large cohort of newly diagnosed, untreated patients with Alzheimer disease. Am J Geriatr Psychiatry. 2010;18(11):1026–1035. | |
Matsuda H. Role of neuroimaging in Alzheimer’s disease, with emphasis on brain perfusion SPECT. J Nucl Med. 2007;48(8):1289–1300. | |
Bradley KM, O’Sullivan VT, Soper ND, et al. Cerebral perfusion SPET correlated with Braak pathological stage in Alzheimer’s disease. Brain. 2002;125(Pt 8):1772–1781. | |
O’Brien JT. Role of imaging techniques in the diagnosis of dementia. Br J Radiol. 2007;80(2):S71–S77. | |
Dai W, Lopez OL, Carmichael OT, Becker JT, Kuller LH, Gach HM. Mild cognitive impairment and Alzheimer disease: patterns of altered cerebral blood flow at MR imaging. Radiology. 2009;250(3):856–866. | |
Kim SM, Kim MJ, Rhee HY, et al. Regional cerebral perfusion in patients with Alzheimer’s disease and mild cognitive impairment: effect of APOE epsilon4 allele. Neuroradiology. 2013;55(1):25–34. | |
Asllani I, Habeck C, Scarmeas N, Borogovac A, Brown TR, Stern Y. Multivariate and univariate analysis of continuous arterial spin labeling perfusion MRI in Alzheimer’s disease. J Cereb Blood Flow Metab. 2008;28(4):725–736. |
 © 2014 The Author(s). This work is published and licensed by Dove Medical Press Limited. The full terms of this license are available at https://www.dovepress.com/terms.php and incorporate the Creative Commons Attribution - Non Commercial (unported, v3.0) License.
By accessing the work you hereby accept the Terms. Non-commercial uses of the work are permitted without any further permission from Dove Medical Press Limited, provided the work is properly attributed. For permission for commercial use of this work, please see paragraphs 4.2 and 5 of our Terms.
© 2014 The Author(s). This work is published and licensed by Dove Medical Press Limited. The full terms of this license are available at https://www.dovepress.com/terms.php and incorporate the Creative Commons Attribution - Non Commercial (unported, v3.0) License.
By accessing the work you hereby accept the Terms. Non-commercial uses of the work are permitted without any further permission from Dove Medical Press Limited, provided the work is properly attributed. For permission for commercial use of this work, please see paragraphs 4.2 and 5 of our Terms.