")
Back to Journals » Drug Design, Development and Therapy » Volume 12
Optimization of a combined wet milling process in order to produce poly(vinyl alcohol) stabilized nanosuspension
Authors Bartos C, Jójárt-Laczkovich O, Katona G, Budai-Szűcs M, Ambrus R, Bocsik A, Gróf I, Deli MA , Szabó-Révész P
Received 16 December 2017
Accepted for publication 20 March 2018
Published 31 May 2018 Volume 2018:12 Pages 1567—1580
DOI https://doi.org/10.2147/DDDT.S159965
Checked for plagiarism Yes
Review by Single anonymous peer review
Peer reviewer comments 3
Editor who approved publication: Dr Tuo Deng
Csaba Bartos,1 Orsolya Jójárt-Laczkovich,1 Gábor Katona,1 Mária Budai-Szűcs,1 Rita Ambrus,1 Alexandra Bocsik,2 Ilona Gróf,2 Mária Anna Deli,2 Piroska Szabó-Révész1
1Faculty of Pharmacy, Institute of Pharmaceutical Technology and Regulatory Affairs, University of Szeged, Szeged, Hungary; 2Institute of Biophysics, Biological Research Centre, Hungarian Academy of Sciences, Szeged, Hungary
Purpose: The article reports a wet milling process, where the planetary ball mill was combined with pearl milling technology to reach nanosize range of meloxicam (Mel; 100–500 nm). The main purpose was to increase the dissolution rate and extent of a poorly water-soluble Mel as nonsteroidal anti-inflammatory drug as well as to study its permeability across cultured intestinal epithelial cell layers.
Methods: Viscosity of milled dispersion and particle size distribution and zeta potential of Mel were investigated and differential scanning calorimeter and X-ray powder diffractometer were used to analyse the structure of the suspended Mel. Finally in vitro dissolution test and in vitro cell culture studies were made.
Results: It was found that the ratio of predispersion and pearls 1:1 (w/w) resulted in the most effective grinding system (200-fold particle size reduction in one step) with optimized process parameters, 437 rpm and 43 min. Nanosuspension (1% Mel and 0.5% poly[vinyl alcohol]) as an intermediate product showed a stable system with 2 weeks of holding time. This optimized nanosuspension enhanced the penetration of Mel across cultured intestinal epithelial cell layers without toxic effects.
Conclusion: The dissolution rate of Mel from the poly(vinyl alcohol) stabilized nanosuspension justified its applicability in the design of innovative per oral dosage form (capsule) in order to ensure/give a rapid analgesia.
Keywords: nanonization, meloxicam, milled dispersion, milling efficiency, zeta potential, intermediate product
Introduction
The planetary ball milling belongs to the group of high-energy milling methods. The process is mainly used in laboratory-scale research work. It is a common technique for dry milling,1,2 nevertheless it is also suitable for wet grind.3–5 Dry milling with this technique is usually used for micronization with a particle size range of 1–2,000 μm.6 In general, additives are not required for micronization, but for dry nanonization, application of them and a long milling time (2–4 h) can be necessary. Additives decrease the cohesion between the nanosize particles and the collision energy during the milling process; thereby, the risk of the decomposition of the active agent can be reduced.7
Wet milling is a top–down process, where the raw material is broken down via mechanical forces. In this method, a sufficiently concentrated dispersion of drug particles in an aqueous or nonaqueous liquid medium is treated. Increased mill capacity, lower energy consumption, and easier handling of materials can be perceived as advantages of the process. However, it must be said, in the course of the milling process, increased wear of the milling medium and corrosion can occur, and the instability of the active agent must be taken into account. Wet milling is applicable for micronization in the particle size range of 1–50 μm, in this case, colloid mill, toothed high-shear inline mixers, and cone mill can be used,8 but for nanonization, high-pressure homogenization (1–20 μm) and pearl milling technique (20–200 nm)9–11 can be applied. It should be noted that in case of high-pressure homogenization and pearl milling techniques, the preparation of pretreated dispersions (particle size reduction to 1–10 μm) is required to reach the nanosize range.
The pearl milling process has been proven to be a robust technique for the production of nanoparticle suspension of poorly water-soluble drugs.12 With this method, nanosuspensions are produced through the use of high-shear media or pearl mills. Pearl milling is a continuous process wherein the drug suspension is pumped through the milling chamber in order to reduce the particle size of the suspended material. The milling medium consists of glass, zirconia, or highly cross-linked polystyrene resin.13 The physical characteristics of the resulting nanocrystals depend on the number and size of the milling pearls, the amount of the drug, and the stabilizer(s).14,15
Thanks to the high efficiency of a smaller pearl size16 and the high mechanical forces of the planetary mill, Retsch GmbH (Haan, Germany) recommends the combination of the planetary ball and pearl milling as a novel milling technique in order to prepare drug nanodispersions.17 In the literature, there are few articles about the combinative method, where various active agents were co-milled. In the presence of d-tocopherol polyethylene glycol 1000 succinate as a stabilizer agent, nanoparticle range was achieved; however, the production efficiency was very low.18,19
Our team uses different milling techniques (dry and wet) in order to nanonize different water-insoluble drugs, eg, meloxicam (Mel), to provide a faster dissolution, a higher saturated concentration, a faster absorption, and, in this context, a better bioavailability. Mel as a nonsteroidal anti-inflammatory agent is often used in malignant and nonmalignant pain therapy, but its bioavailability is unsatisfactory thanks to its poor solubility in the gastrointestinal tract. One strategy to address these problems is the particle size reduction (eg, nanonization), which increases the dissolution rate of the poorly soluble drug resulting in faster absorption and faster action in pain therapy.
In our earlier studies, we investigated the applicability of the combined wet milling technique,20–23 and these preliminary studies showed that for the nanonization of Mel, PVA as a stabilizer agent and an increased milling time (>50 min) were required. The influence of milling time was also studied on the particle size distribution, crystallinity, and dissolution rate of Mel.
During the use of the combined wet milling technique, the type and amount of PVA are very important because it has a dual role. On the one hand, it promotes the grinding efficiency in the concentrated predispersion, and on the other hand, it stabilizes the milled dispersion and later the final nanosuspension in a diluted medium.
PVA is a nonionic polymer with very different molecular weights. It is frequently used as a stabilizer agent.20 Polymer adsorption on the solid–liquid interface can be influenced by the various conformations of the polymer chains and the interaction of the polymer segments with the solvent and the surface of the solid as well. PVA with low molecular weight (about 20,000 g/mol) is adsorbed on the colloid particles and thus stabilizes the colloid suspension (coating the particles and providing the repulsion among them), whereas PVA with high molecular weight (about 1,000,000 g/mol) flocculates the dispersed systems.24
The prediction of permeability features of drug candidates across biological barriers is of great importance in the early phase of drug development.25 Oral drug formulations are the most widespread in human therapy, and therefore intestinal drug absorption is the most studied in pharmaceutical research. The human Caco-2 cell line, presenting many of the structural and functional aspects of the epithelium of small intestine, is a routinely used culture model of intestinal drug penetration showing good correlation with in vivo data.26
The aim of this work was to optimize the process parameters (pearl amount, milling time, and rotation speed) of the combined wet milling technique (planetary ball and pearl milling), using Mel as an active agent and PVA as a stabilizing agent in the predispersion. We basically investigated the influence of the amount of low molecular weight PVA on the grinding efficiency in concentrated predispersion. Our aim was also to get to know the effect of mechanical forces on polymer viscosity and drug–polymer interaction as well. To describe the stability of nanosuspensions, their particle size was monitored for 2 weeks. Furthermore, the optimized Mel formulations were tested on the cell culture model of intestinal epithelium.
The novelty of this study is the application of PVA and the combined wet milling process and optimization of the amount of the additive and the process parameters in order to produce Mel nanosuspension (particle size range of 100–500 nm) without any pretreating procedure.
Materials and methods
Materials
Mel was obtained from EGIS Ltd. (Budapest, Hungary). PVA-Mowiol 4-98 (Mw ~27,000) (Sigma-Aldrich Co. LLC, St Louis, MO, USA) was used as a stabilizing agent. Reagents were purchased also from Sigma-Aldrich. Zirconium oxide (ZrO2) beds with a diameter of 0.3 mm were obtained from Netsch (Netsch GmbH, Selb, Germany). All reagents were purchased from Sigma-Aldrich, Ltd. (Budapest, Hungary) for the in vitro cell culture experiments, unless otherwise indicated.
Methods
Combined wet media milling
Optimization of process parameters
The samples were milled with the steel jar with 50 mL volume of the Retsch PM 100 planetary ball mill (Retsch PM 100 MA, Retsch GmbH) combined with 0.3 mm ZrO2 beads as the grinding media. The concentrated (10% w/w) predispersions (2 g of Mel suspended in 18 g of dispersant medium containing PVA) were added to the ZrO2 beads. In the first step, the effect of different amount of ZnO2 pearls on the particle size reduction was investigated. The ratio of the amount of predispersion and pearls (w/w) was 1:0.5, 1:1, 1:2, and 1:4; and the milling times were 10, 30, and 50 min. In these cases, the concentration of PVA solution was 2.5% (w/w), and the rotation speed was 400 rpm. In the second step, design and analysis of experiments with 3 levels were used to optimize the milling time (10, 30, and 50 min) and the rotation speed (200, 350, and 500 rpm) as independent variables. The amount of the pearls was chosen on the basis of the optimization study. The temperature of the samples was measured immediately after milling. This value did not exceed 39°C.
Optimization of PVA concentration
Various amounts of PVA (2.5%–7.5%) were applied to prepare the concentrated predispersions. The concentration of the PVA solutions was increased in the half percent range. Mel content was 10% (w/w), and the optimized process parameters were used during the milling. The degree of particle size reduction and particle size distribution were the main factors for the optimization of the PVA concentration (Figure 1).
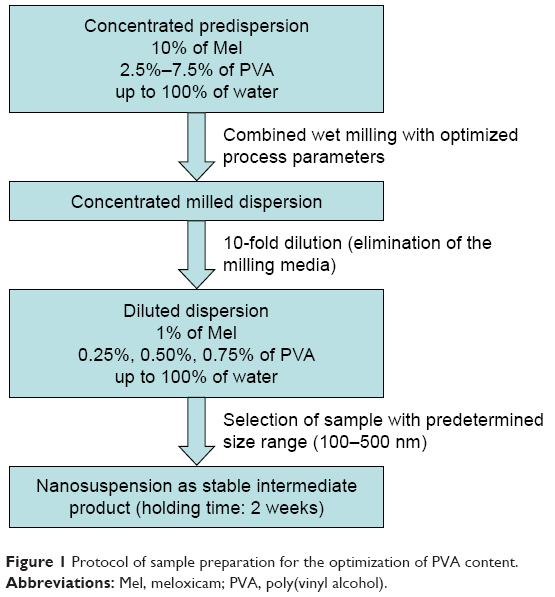 | Figure 1 Protocol of sample preparation for the optimization of PVA content. |
The concentrated milled dispersions were filtered by a sieve with 150 μm mesh size in order to remove the pearls. For the washing of the pearls, 180 g of distilled water was used. In all cases, the milled dispersions were 10-fold diluted products with 1% of Mel (w/w) content. The samples were selected on the basis of the particle size range (100–500 nm) and the holding time (2 weeks).
Investigation of the samples
Particle size measurement
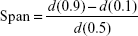
The volume-based particle size distribution was measured by laser diffraction (Mastersizer S 2000, Malvern Instruments Ltd, Worcestershire, UK) with the following parameters: 300RF lens; small volume dispersion unit (1,000 rpm); refractive index for dispersed particles 1.596; and refractive index for dispersion medium 1.330. Water was used as a dispersant, and the obscuration was in the range of 11%–16% for all measurements. In all cases, the particle size distributions were characterized by the d(0.1), d(0.5), and d(0.9) (where, eg, d(0.5) is the maximum particle diameter below which 50% of the sample volume exists), and the Span values were calculated according to equation. A high Span value (>1) denotes a broad particle size distribution.27
|
Rheological measurement
To investigate the viscosity changes during the milling process, the initial and milled PVA solutions and the concentrated milled dispersions were used. Rheological measurements were carried out with Physica MCR101 rheometer (Anton Paar, Graz, Austria). A concentric cylinder measuring device with a diameter of 17 mm was used. The flow curves of the samples were determined at 25°C, where the shear rate was increased from 0.1 to 100 L/s. The shearing time was 300 sec. In this paper, viscosity values were given at 100 L/s shear rate. Two parallel measurements were run.
Zeta potential
The zeta potential of the dispersions was measured using a Malvern Zeta Nano ZS (Malvern Instruments Ltd). For the zeta potential determination, Malvern DTS 1070 folded capillary cell was used. The diluted milled dispersions were further diluted with water (25-fold) for the measurements.
Raman spectroscopy
For the investigation of Mel degradation as a function of the pearl amount and milling time in the dispersion, Raman spectra were acquired with a Thermo Fisher DXR Dispersive Raman (Thermo Fisher Scientific Inc., Waltham, MA, USA) equipped with a CCD camera and a diode laser operating at a wavelength of 532 nm. Raman measurements were carried out with a laser power of 4 and 8 mW at 25-μm slit aperture size on a 2 μm spot size. The spectra of the individual substances as Mel and PVA were collected using a 2-sec exposure time, a total of 48 scanning in the spectral range of 3,300–200 cm−1 with cosmic ray and fluorescence corrections.
Morphology of the particles (scanning electron microscopy)
For the investigation of the morphology of the particles, the diluted milled dispersions were dried in a vacuum dryer (Binder GmbH, Tuttlingen, Germany) at 40°C in order to obtain solid products for physicochemical investigations. After drying, the shape and surface characteristics of the samples were visualized using a scanning electron microscope (Hitachi S4700, Hitachi Scientific Ltd., Tokyo, Japan). The samples were sputter-coated with gold–palladium under an argon atmosphere, using a gold sputter module in a high-vacuum evaporator, and the samples were examined at 10 kV and 10 mA. The air pressure was 1.3–13 MPa.
Differential scanning calorimetry (DSC)
DSC measurements were carried out with a Mettler Toledo DSC 821e thermal analysis system with the STARe thermal analysis software V9.0 (Mettler Inc., Schwerzenbach, Switzerland). Approximately 2–5 mg of pure Mel and PVA as well as dried samples were examined in the temperature range of 25°C–270°C. The heating rate was 10°C/min in the presence of argon as a carrier gas with a flow rate of 10 L/h.
X-ray powder diffraction analysis (XRPD)
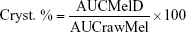
The crystallinity state of Mel in the dried samples was evaluated by XRPD. XRPD patterns were produced by a Bruker D8 Advance diffractometer (Bruker AXS GmbH, Karlsruhe, Germany) system with Cu K λI radiation (λ=1.5406 Å). The samples were scanned at 40 kV and 40 mA from 3 to 40 2θ, at a step time of 0.1 sec, and a step size of 0.010°. The instrument was calibrated by using SI standard. The semiquantitative determination of Mel crystallinity (Cryst. %) was performed using the total area under the curve of 3 characteristic peaks (13.06, 14.94, and 18.61 2θ) of Mel. The area under the curve value of the peak of raw material without milling (rawMel) and the dried milled dispersions (MelD) was calculated and compared according the following formula:
|
Drug content determination
The loss of weight of Mel was controlled in the milled suspension. Seventy-five milligram of the liquid products with 0.75 mg of theoretical Mel was dissolved in 100 mL of phosphate buffer pH 7.4±0.1. The sample was stirred with a magnetic stirrer at 25°C for 24 h and then filtered (0.1 μm, FilterBio PES Syringe Filter) (Labex Ltd., Budapest, Hungary), and the concentration of the dissolved Mel was analyzed spectrophotometrically (Unicam UV/VIS) (Thermo Fisher Scientific Inc.) at 364 nm wavelength. The investigations were repeated 3 times.
In vitro dissolution test
To determine the dissolution extent of Mel from dispersions, the paddle method (USP dissolution apparatus, type II Pharma Test, Heinburg, Germany) was used. About 750 mg of the dispersion with 7.5 mg of Mel (therapeutic dose) was filled into hard gelatin capsules within 5 sec and put promptly into the medium. The medium contained 900 mL of artificial gastric fluid at pH 1.2±0.1 and intestinal fluid (pH 6.8±0.1). The paddle was rotated at 100 rpm, and sampling was performed up to 60 min. The Mel contents of the samples were determined using a spectrophotometer (ATI-UNICAM UV/VIS Spectrophotometer) at 362 nm (gastric juice) and 364 nm (enteric fluid). The number of parallel runs was 3.
In vitro cell culture studies
Human Caco-2 intestinal epithelial cell line
Caco-2 intestinal epithelial cell line was purchased from ATCC (Manassas, VA, USA) (cat. no HTB-37) and used until passage 60 for the experiments. The cells were grown in DMEM (Gibco, Life Technologies, Carlsbad, CA, USA) and supplemented with 10% fetal bovine serum (Pan-Biotech GmbH, Aidenbach, Germany) and 50 μg/mL gentamycin in a humidified incubator with 5% CO2 at 37°C. All plastic surfaces were coated with 0.05% rat tail collagen in sterile distilled water before cell seeding in culture dishes and the medium was changed every 2 days. The stock solutions for cell culture experiments were the following: Mel, 100 mg/mL; PVA, 5% (w/w), and 3 products containing 100 mg/mL Mel with various amounts of PVA (2.5%, 5%, or 7.5%). The working solutions were diluted in the cell culture medium or Ringer–Hepes buffer and contained 1 mg/mL of Mel for the Mel and formulation groups. The final concentrations of PVA were 0.025%, 0.05%, and 0.075% (w/w).
Cell viability measurement by impedance
Impedance was measured at 10 kHz using the RTCA-SP instrument (RTCA-SP instrument, ACEA Biosciences, San Diego, CA, USA). This method is label-free, noninvasive and follows cell adherence, growth, number, and viability real time. We have successfully tested the cellular effects of peptides and pharmaceutical excipients by impedance kinetics.28–30 For background measurements, a 50 μL cell culture medium was added to the wells; then, cells were seeded at a density of 6×10³ cells/well to 96-well plate with gold electrodes (E-plate 96, ACEA Biosciences) coated with collagen. Cells were cultured for 5 days in a CO2 incubator at 37°C and monitored every 10 min until the end of experiments. When cells reached the plateau phase of growth, they were treated with Mel, PVA, and Mel+PVA samples diluted in a cell culture medium, and the effects were followed for 8 h. Triton X-100 detergent (1 mg/mL) was used as a reference compound to induce cell toxicity. Cell index was defined as Rn−Rb at each time point of measurement, where Rn is the cell–electrode impedance of the well when it contains cells and Rb is the background impedance of the well with the medium alone.
Permeability study on cell culture model
Transepithelial electrical resistance (TEER) reflects the tightness of the intercellular junctions closing the paracellular cleft, and therefore reflects the overall tightness of cell layers of biological barriers. TEER was measured every 2 days to check the barrier integrity by an epithelial volt-ohmmeter (World Precision Instruments, Sarasota, FL, USA) combined with STX-2 electrodes and was expressed relative to the surface area of the monolayers as Ω×cm2.
Caco-2 cells were seeded onto Transwell inserts (polycarbonate membrane, 0.4 μm pore size, 1.12 cm2 surface area; Corning Life Sciences, Tewksbury, MA, USA) and cultured for 3 weeks.31,32 The culture medium was changed and TEER was checked every second day.
For the permeability experiment, inserts were transferred to 12-well plates containing 1.5 mL Ringer–Hepes buffer in the lower (basal) compartments. In the upper (apical) compartments, the culture medium was replaced by 0.5 mL buffer containing treatment solutions of Mel, PVA, and Mel formulation groups for 1 h. Permeability marker molecules fluorescein (10 μg/mL; Mw: 376 Da) and albumin (10 mg/mL; Mw: 65 kDa) labeled with Evans blue (167.5 μg/mL) were used for verifying the cell layer integrity. Treatment solutions from both compartments were collected and the Mel level was detected using a Thermo Spectronic Helios Alpha UV-Vis spectrophotometer (Thermo Fisher Scientific Inc.).
The concentrations of the permeability marker molecules of collected samples were determined by a fluorescence multi-well plate reader (Fluostar Optima, BMG Labtech, Offenburg, Germany; for fluorescein: excitation wavelength, 485 nm; emission wavelength, 535 nm and for Evans blue-labeled albumin: excitation wavelength, 584 nm; emission wavelength, 680 nm).
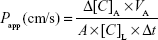
The apparent permeability coefficients (Papp) were calculated as described previously.28 Briefly, the cleared volume was calculated from the concentration difference of the tracer in the lower/basal compartment (Δ[C]B) after 30 min and upper/apical compartments at 0 h ([C]A), the volume of the lower/basal compartment (VB, 1.5 mL) and the surface area available for permeability (A, 1.1 cm2) using the following equation:
|
Determination of holding time
Since the diluted dispersions are intermediate products, it was necessary to specify the “holding time” of the sample through the particle size distribution. The products were stored in sealed glass bottles at room temperature (25°C±1°C) for 2 weeks. The particle size distribution of the Mel in the samples was analyzed on the day of production (day 0) and after 14 days of storage.
Statistical analyses
Data were expressed as mean±SD, and groups were compared by using Student’s t-test. For the evaluation of cell culture results, GraphPad Prism 5.0 software (GraphPad Software Inc., San Diego, CA, USA) was used. All culture data presented are mean±SD; values were compared using analysis of variance followed by Bonferroni posttest. Differences were considered statistically significant when p<0.05.
Results and discussion
Optimization of process parameters (pearl amount, milling time, and rotation speed)
The effect of pearl amount and milling time on particle size of d(0.5) was investigated. This study was performed using 2.5% PVA solution.23 The ratio of the concentrated predispersion (2.0 g of Mel+18.0 g of PVA aqueous solution) and pearl amount was different: 1:0.5, 1:1, 1:2, and 1:4 (w/w). It can be established that the pearl amount and the milling time have a great effect of on the d(0.5) value (Table 1). The milling efficiency was not satisfactory in case of ratio 1:0.5, but it increased linearly on increasing the amount of the milling media and the milling time except in case of ratio 1:4. It was found that the increase of the amount of the milling media (up to 1:2 w/w or more) causes gray coloring because of the high friction between the pearls and the wall of the steel jar. Therefore, the pearl milling amount was optimized at the ratio of 1:1 (20 g of concentrated predispersion and 20 g of pearls), and the milling time was investigated as an independent variable in the factorial experimental design. Another advantage of the small amount of the grinding media may be the reduction of the product loss.
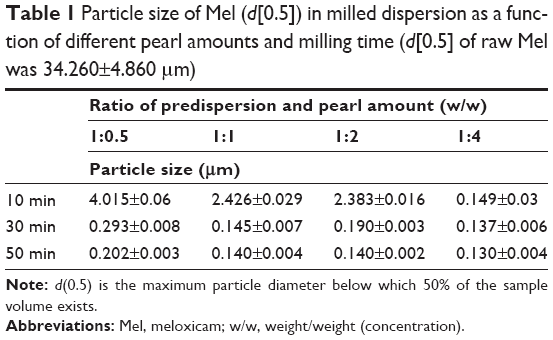 | Table 1 Particle size of Mel (d[0.5]) in milled dispersion as a function of different pearl amounts and milling time (d[0.5] of raw Mel was 34.260±4.860 μm) |
During the factorial experimental design, the influence of the milling time and the rotation speed on the particle size reduction was investigated. The ratio of the predispersion and the pearls was also 1:1 (w/w). Figure 2 shows that the efficiency of the particle size reduction was improved by increasing the milling time and the rotation speed. Based on the results, 437 rpm and 43 min are the optimal parameters of the milling process.
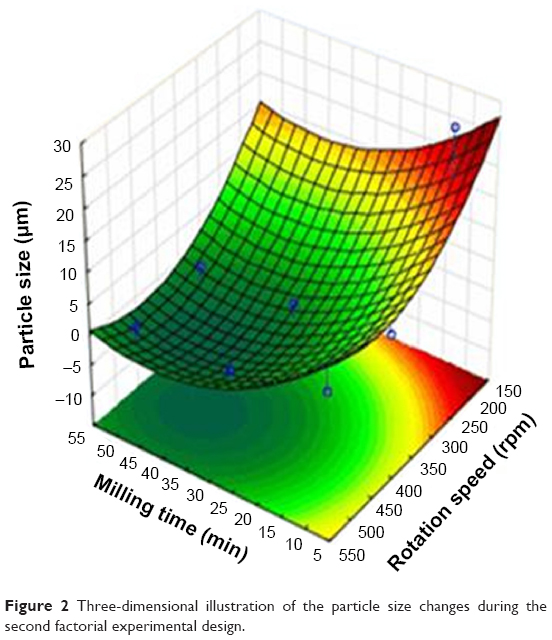 | Figure 2 Three-dimensional illustration of the particle size changes during the second factorial experimental design. |
Optimization of PVA concentration
Influence of PVA amount on the milling effectiveness
Concentrated predispersions with different PVA amounts (2.5%–7.5%) were milled with optimized parameters (2 g of Mel+18 g of PVA aqueous solution, 20 g pearls, 437 rpm, 43 min). The results show (Figure 3) that the lower concentration of PVA (from 2.5% to 3.5%) was not suitable to reach the nanosize range (100–500 nm). A higher concentration of PVA (6.0%–6.5%) also resulted in unsatisfactory milling effectiveness. Over 6.5% a robust protecting layer was probably formed on the solid particles, and nanonization was not possible. The curve of the Span follows the different particle size distribution of the samples. The best particle size distribution was measured in the range of 4.0% and 5.5% of PVA. Based on the results, the concentrated milled dispersion containing 5.0% of PVA was selected as the optimized PVA amount.
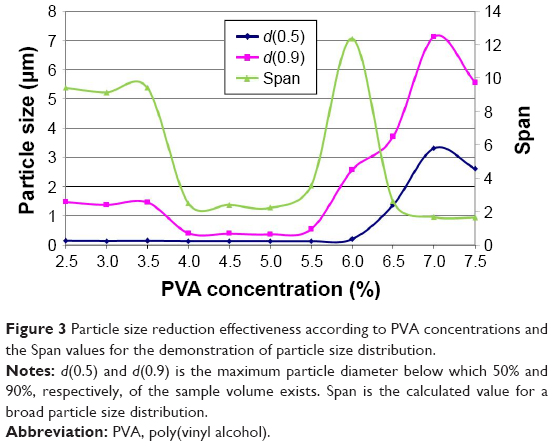 | Figure 3 Particle size reduction effectiveness according to PVA concentrations and the Span values for the demonstration of particle size distribution. |
Influence of PVA amount on the physicochemical properties of milled dispersions
After the optimization of the wet milling process and the PVA amount, in order to understand the influence of the amount of PVA on the physicochemical properties of the samples, the milled dispersions with 3 different concentrations of PVA were investigated. These were the following: 2.5%, 5.0% (as optimized), and 7.5% of PVA.
Viscosity changes during the milling
In order to exclude the viscosity changes because of the high mechanical forces during the milling, the viscosity of 3 raw PVA solutions (2.5%, 5%, and 7.5%) was investigated before the milling process, after the process (437 rpm, 43 min), and after the milling with the addition of Mel. The polymer solutions showed Newtonian flow behavior as their shear viscosity was independent of the applied shear rate. The viscosity of the polymer solutions increased with increasing the polymer concentration (Table 2). There were no remarkable differences between the viscosity of the polymer solution before and after the milling procedure, which may indicate there are no changes in the polymer structure. 10% Mel amount in the dispersions increased the viscosity of the systems and did not change the flow behavior – they remained Newtonian. Adding Mel to the polymer solutions, the smallest shift in the viscosity could be detected in case of the highest polymer concentration. This can be explained by the more considerable viscosity changing effect of the polymer concentration than that of the Mel particles. It can be concluded that the mechanical influence did not change the viscosity of the polymer solutions, and therefore, the structure of the PVA chains did not change.
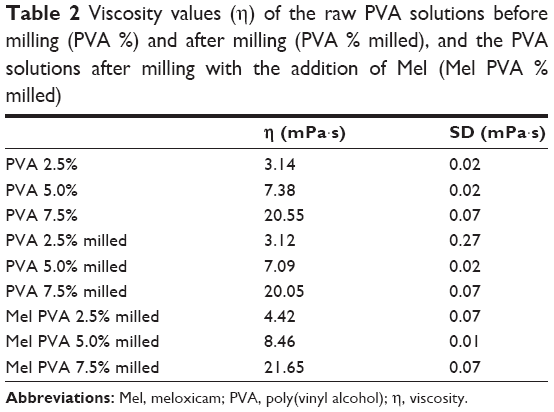 | Table 2 Viscosity values (η) of the raw PVA solutions before milling (PVA %) and after milling (PVA % milled), and the PVA solutions after milling with the addition of Mel (Mel PVA % milled) |
Zeta potential changes
To determine the electrokinetic changes of the diluted dispersions, the zeta potential of the samples was measured. The results show that the increase of the PVA amount decreases the zeta potential in comparison to the sample without PVA (Table 3). The main reason for the zeta potential reduction can be linked to the nonionic polymer adsorption on the surface of the solid particles, which causes a decrease of the diffuse layer charge. A greater zeta potential-lowering effect can be observed between 0% and 0.25% of PVA than between 0.25% and 0.50. At 0.50% of PVA, the surface of particles is saturated by the PVA chain; therefore, the change of zeta potential is smaller. In case of a higher concentration of PVA (>0.50%), the steric hindrance stabilizes the system but hampers the disintegration/abrasion of the particles.
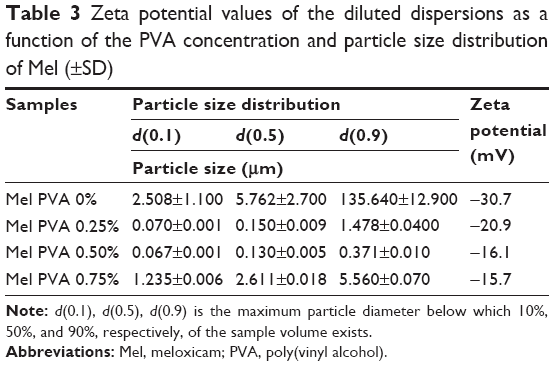 | Table 3 Zeta potential values of the diluted dispersions as a function of the PVA concentration and particle size distribution of Mel (±SD) |
Investigation of the diluted dispersions to select nanosuspension as an intermediate product
Raman investigation
Raman spectrograms and chemical maps of raw materials and products are presented in Figures 4 and 5. The individual spectrum of Mel (a) shows that the absorption peaks are concentrated in the region from 1,600 to 1,000 cm−1 (fingerprint region), whereas the individual spectra of PVA (b and c) show just 1 characteristic and extended peak from 3,000 to 2,800 cm−1. This is the CH stretching vibration region that results a medium-to-strong intensity in Raman spectra. The spectrograms of diluted dispersions (d, e, and f) show the same characteristic region with the spectra of Mel – there are no detectable differences among them. Two peaks (one more characteristic in 2,437 cm−1 and another smaller one in 482 cm−1) appear in the spectra of PVA-containing dispersions and in spectra of aqueous Mel dispersion as well. The chemical mapping of dried dispersions profiled to this peak in 2,437 cm−1 shows that this peak cannot detected in this map. This peak can show a dissociated −OH group of Enol which is presented when Mel is in an aqueous medium, but it is disappeared in dried form, so the change is reversible. The chemical map of dispersion profiled to Mel spectrogram shows homogenous distribution of Mel. It can be summarized that there is no chemical degradation or interaction in dispersion which could be detectable with Raman technique.
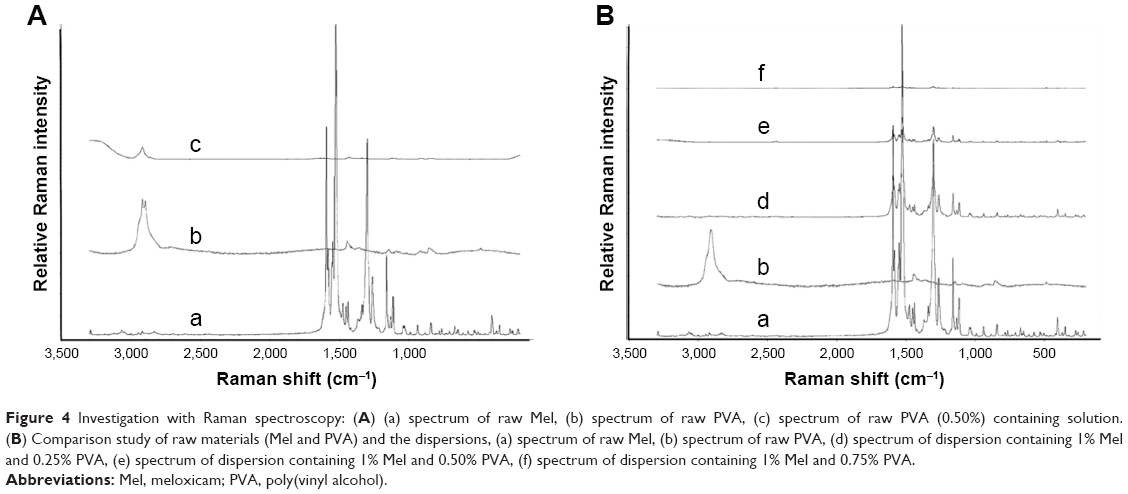 | Figure 4 Investigation with Raman spectroscopy: (A) (a) spectrum of raw Mel, (b) spectrum of raw PVA, (c) spectrum of raw PVA (0.50%) containing solution. (B) Comparison study of raw materials (Mel and PVA) and the dispersions, (a) spectrum of raw Mel, (b) spectrum of raw PVA, (d) spectrum of dispersion containing 1% Mel and 0.25% PVA, (e) spectrum of dispersion containing 1% Mel and 0.50% PVA, (f) spectrum of dispersion containing 1% Mel and 0.75% PVA. |
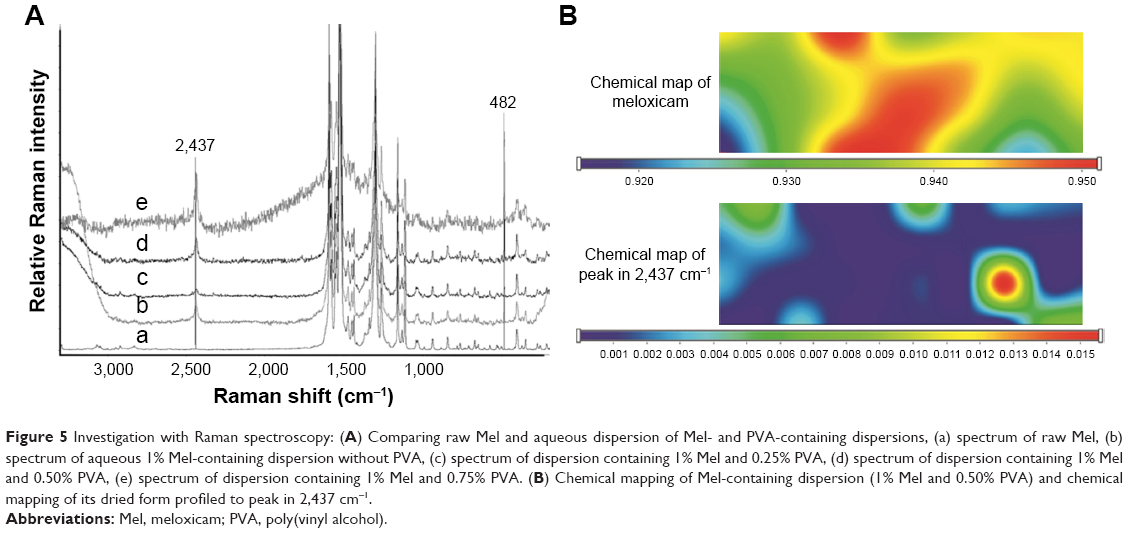 | Figure 5 Investigation with Raman spectroscopy: (A) Comparing raw Mel and aqueous dispersion of Mel- and PVA-containing dispersions, (a) spectrum of raw Mel, (b) spectrum of aqueous 1% Mel-containing dispersion without PVA, (c) spectrum of dispersion containing 1% Mel and 0.25% PVA, (d) spectrum of dispersion containing 1% Mel and 0.50% PVA, (e) spectrum of dispersion containing 1% Mel and 0.75% PVA. (B) Chemical mapping of Mel-containing dispersion (1% Mel and 0.50% PVA) and chemical mapping of its dried form profiled to peak in 2,437 cm−1. |
Morphology of particles (scanning electron microscopy)
In order to investigate the effect of milling and PVA amount on the morphology of milled Mel, the water was evaporated from dispersion and the dried samples were characterized.
Figure 6 shows the raw Mel in physical mixture (Mel PVA 0.50% PM) which has an irregular shape with 34.260±4.860 μm as average particle size. In this PM, the PVA particles with size <6 μm are located on the surface of Mel crystals. After drying of the aqueous dispersions, the polymer formed non-coherent and coherent think film with Mel particles. In case of 0.25% containing PVA (Mel PVA 0.25%), the particle size of Mel has decreased, but aggregation of the fragmented particles can be observed. Mel particles are in homogeneous disperse distribution in sample (Mel PVA 0.50%), resulting in <500 nm (average particle size: 0.130±0.005 μm). High concentration of PVA (Mel PVA 0.75%) helped the recrystallization of Mel (nanocrystals with smooth surface) thanks to increased solubility of Mel in aqueous PVA solution. Otherwise, the sample shows heterogeneous disperse system with nano- and microparticles.
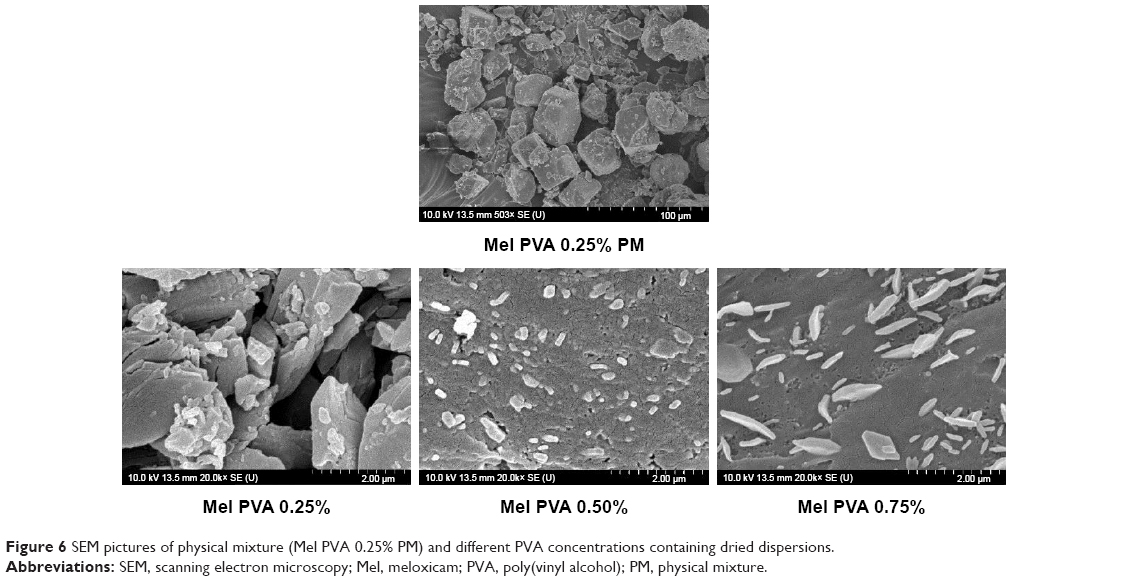 | Figure 6 SEM pictures of physical mixture (Mel PVA 0.25% PM) and different PVA concentrations containing dried dispersions. |
Crystallinity characterization of Mel in the dried dispersions (DSC and XRPD)
DSC was used to investigate the melting of raw Mel and raw PVA and the dried samples (Figure 7). The DSC curve of the raw Mel revealed a sharp endothermic peak at 268.66°C, reflecting its melting point and an instantly following exothermic peak at 278.09°C can be observed. The DSC curve of raw PVA as a semi-crystalline polymer has 2 endothermic peaks at 169.51°C and at 222.74°C. The first peak of PVA signifies a particular decrystallization of PVA and the second peak is the melting temperature.33 The DSC curves of the dried products exhibited lower melting points of Mel than that of raw Mel. It is connected to the premelting of PVA, which induces the earlier melting of Mel in proportion to the amount of PVA and decreases the crystallinity degree of Mel. Therefore, the XRPD investigation was used to check the amorphization of the active agent.
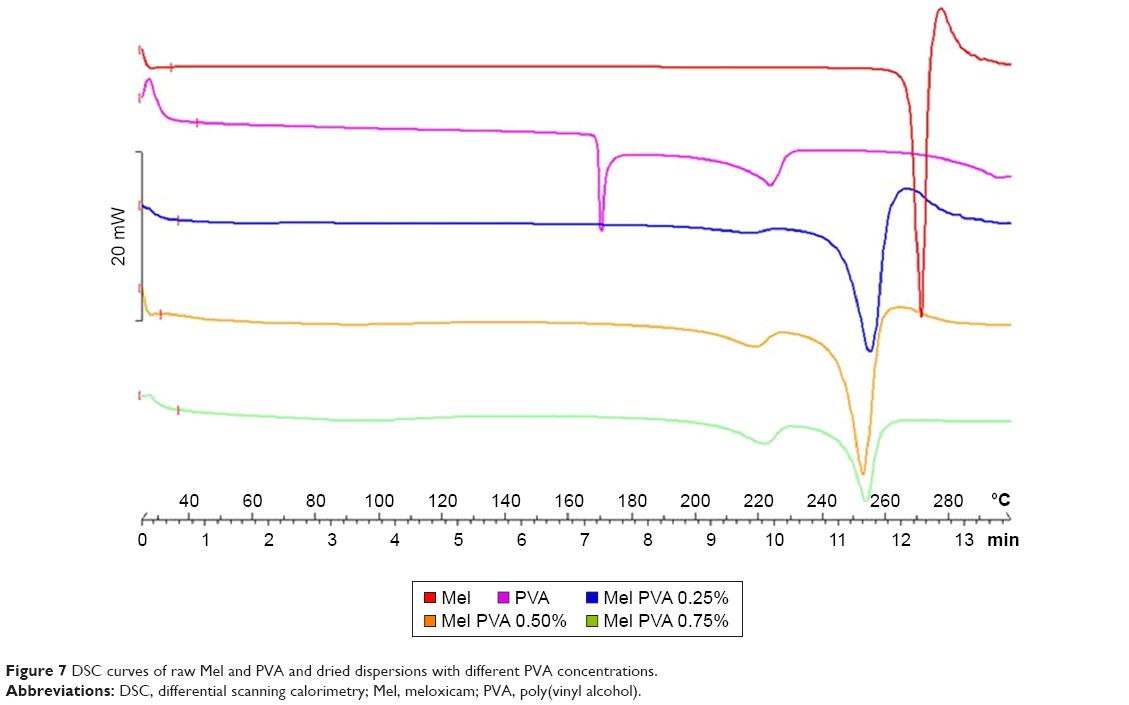 | Figure 7 DSC curves of raw Mel and PVA and dried dispersions with different PVA concentrations. |
The XRPD investigations justified the change of crystallinity degree of Mel in the dispersions with different PVA amounts. Figure 8 shows the fingerprints of raw materials (Mel and PVA) and the dried dispersions. The samples show the characteristic peaks of Mel at 2θ values: 13.06°, 14.94°, and 18.61°. It was found that the PVA content of the samples fundamentally influenced the decrease of the crystallinity degree of Mel. As it was established earlier in this study, low (2.5%) and high (7.5%) concentrations of PVA in the milled dispersion did not result in suitable milling efficiency. In this case, the crystallinity degree of Mel was 75.82% at low PVA content (2.5%), and it decreased to 51.44% at high concentration of PVA (7.5%). These results are connected to the milling effectiveness. In this study, the 5.0% PVA-containing milled dispersions showed smaller crystallinity (13.43%) and the highest milling efficiency.
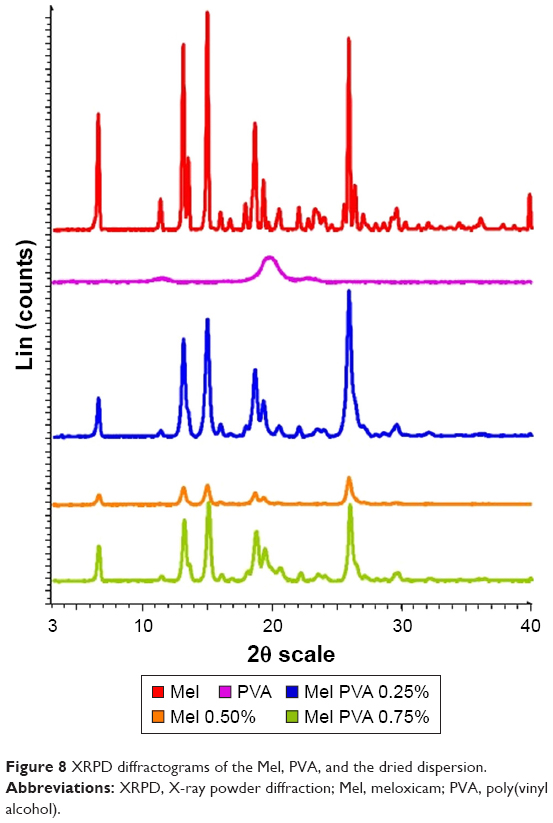 | Figure 8 XRPD diffractograms of the Mel, PVA, and the dried dispersion. |
Drug content determination
The spectrophotometrically measured drug content of the samples was less than the theoretical value (7.5 mg Mel). The drug contents, converted to 750 mg dispersion quantity, are as follows: 7.36 mg for aqueous sample (without PVA), 7.19 mg for 0.25% PVA, 7.12 mg for 0.50% PVA, and 7.23 mg for 0.75%. It can be stated that the washing method of the pearls resulted in greater loss of Mel in PVA-containing dispersion (3.60%–5.06%) than in case of the aqueous sample without PVA (1.80%). The amount of PVA did not significantly affect the loss of weight of Mel.
In vitro dissolution study
In case of each sample, the liberation from the hard gelatin capsules occurred within 2 sec. Mel has a weak acidic character (pKa 4.8), and therefore, its solubility in gastric juice (pH=1.2) is very poor (1.6±0.2 mg/L, at 37°C). In this medium, the greatest dissolved amount of Mel with 0.25% and 0.50% PVA content was maximum, 37%, within 20 min (Figure 9A). This result is due to the wetting effect of PVA (0.25% and 0.50%), which could increase the solubility of Mel, and the reduction of the particle size of Mel in the dispersions. In contrast, a higher amount of PVA (0.75%) hinders the dissolution because a thicker polymer layer is formed on the Mel particles.
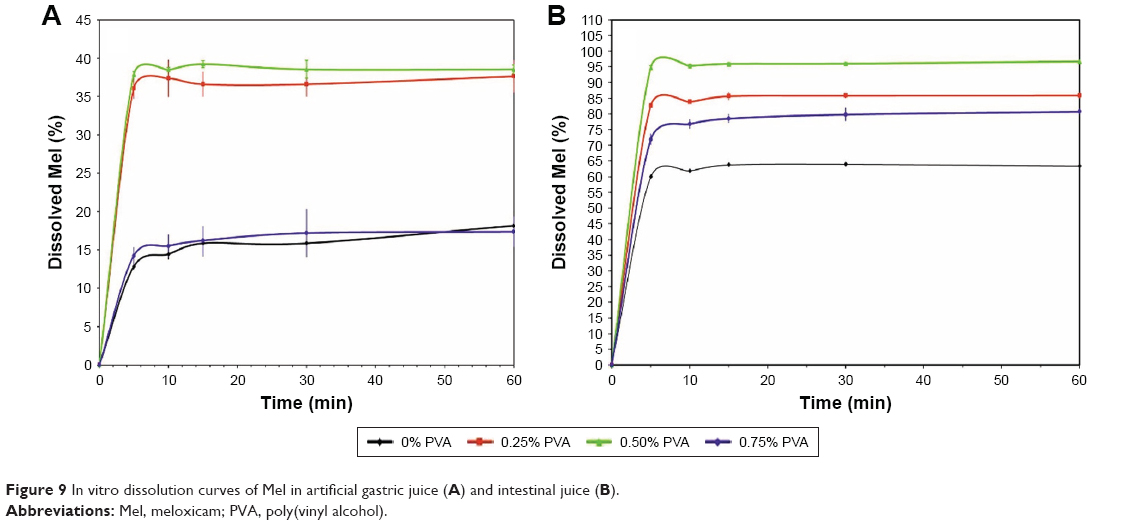 | Figure 9 In vitro dissolution curves of Mel in artificial gastric juice (A) and intestinal juice (B). |
In intestinal fluid (pH=6.8), the dissolved amount was higher in all cases because of the better solubility of Mel (0.272±0.001 mg/mL, at 37°C). Figure 9B shows that the concentration of PVA influences the amount of dissolved Mel as in the case of gastric juice, but its extent is bigger. In this study, the dispersion containing 0.50% of PVA had the most satisfying dissolution behavior from among the 4 samples. It is followed by the dispersions containing 0.25% and 0.75% of PVA, and finally the dispersion without PVA. The results justify the need of the polymer (PVA) and the correct choice of its quantity.
Cell viability assay
Impedance measurement, as a sensitive method to detect cellular effects, did not show significant cell damage after treatments with Mel, PVA, and Mel formulation groups, as reflected by unchanged cell index values (Figure 10). As a comparison, cells treated with the detergent Triton X-100 were lysed and a 100% toxicity was measured. The curves show the kinetics of the cellular effects of treatment solutions (Figure 10A), whereas the columns show the effect of Mel, PVA and Mel formulations at the 8-h time point (Figure 10B).
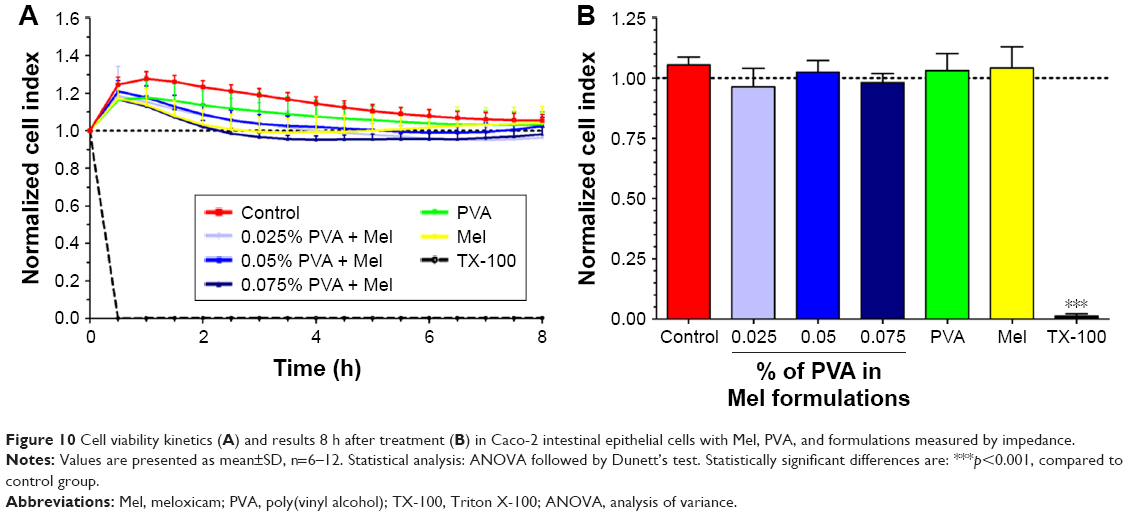 | Figure 10 Cell viability kinetics (A) and results 8 h after treatment (B) in Caco-2 intestinal epithelial cells with Mel, PVA, and formulations measured by impedance. |
Permeability study on intestinal barrier model
Caco-2 monolayers showed high TEER values (2,660±181 Ω×cm2, n=20) before permeability experiments, indicating tight barrier properties. The average apparent permeability coefficients of marker molecules were also low (fluorescein: 0.81±0.13×10⁻⁶ cm/s; albumin: 0.08±0.03×10⁻⁶ cm/s), in agreement with the TEER values and the formation of tight cell layers.
The permeability of Mel suspension and Mel formulations was significantly higher than that of marker molecules. The penetration of Mel from the 3 investigated products across cell layers was significantly increased as compared to Mel suspension. From all the tested samples, the Papp value of Mel was the highest in the formulation containing 0.05% PVA (Figure 11).
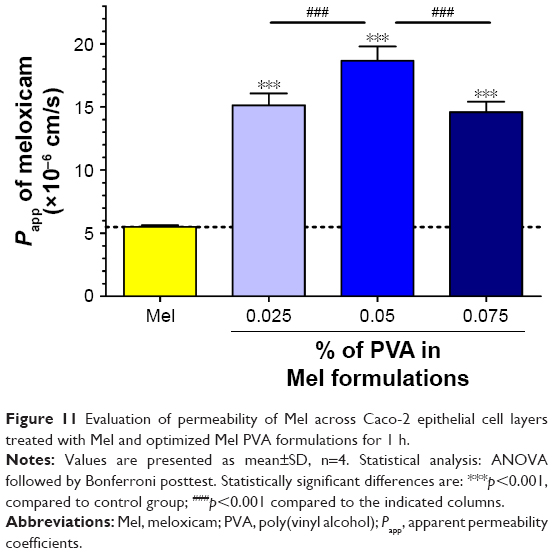 | Figure 11 Evaluation of permeability of Mel across Caco-2 epithelial cell layers treated with Mel and optimized Mel PVA formulations for 1 h. |
Holding time determination
Since the investigated dispersions are intermediate products, the change of particle size distribution and the crystallinity index are very important during storage. In general, the time period before the dispersion used for the preparation of different dosage forms is 1 or 2 h, or possibly longer. The measurements have proven that 0.50% of PVA-containing dispersion had no significant changes in the particle size, particle size distribution, and crystallinity up to 2 weeks (Table 4).
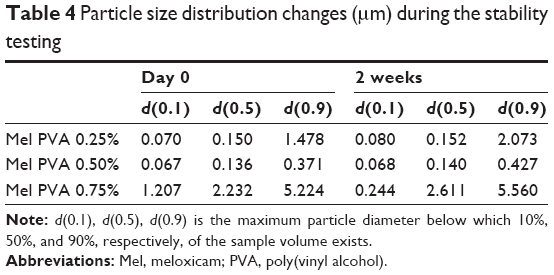 | Table 4 Particle size distribution changes (μm) during the stability testing |
Conclusion
Based on our results, it can be stated that the combination of planetary ball mill and the pearl milling technology is a new possibility to nanonize the Mel as a nonsteroidal anti-inflammatory agent to reach the particle size range of 100–500 nm. This combinative wet technology resulted in significant particle size reduction without premilling (pretreatment of raw agent). In addition to the process parameters (the pearl amount, the milling time, and the rotation speed of jar), the amount of PVA was also a critical parameter because it affected the milling effectiveness, the particle size distribution, and the crystallinity of Mel. The different concentrations of PVA in the aqueous dispersion also influenced the viscosity and the electrokinetic property of the particle, according the DLVO theory,34 and thus, the stability of the dispersions.
It was found that the milling effectiveness of low concentration of PVA (<4%) was not satisfactory, because the crushing/breaking effect of the pearls was less prevalent. High concentration of PVA (>5%) also resulted in unsatisfactory milling effectiveness because of the formation of polymer layer on surface of particles, which protects the particles from the fragmentation. In connection with this, the crystallinity of Mel decreased with the increase of milling effectiveness, which plays an important role in the fast drug release.
In this work, the combined wet milling process was also used successfully to prepare Mel-containing nanosuspension as an intermediate product to design the final dosage form(s) for per oral administration. The optimized process parameters (1:1 ratio of predispersion and pearls, 437 rpm, and 43 min) resulted in 200-fold particle size reduction of Mel. Considering the effectiveness of milling, 5% PVA was proved to be an optimal quantity to meet the expected value (100–500 nm). The optimized nanosuspension (1% Mel and 0.50% PVA) as an intermediate product showed a stable system with 2 weeks of holding time.
The human Caco-2 cell culture studies justified that the penetration of Mel from different PVA-containing products was significantly increased as compared to Mel suspension without toxic effects. From all the tested samples, the Papp value of Mel was the highest in the investigated sample containing 0.05% PVA, which belongs to the optimized nanosuspension.
Based on the above results, the milling process and the composition of the nanosuspension can be recommended to produce innovative dosage forms (eg, capsule) with fast dissolution rate of Mel. During the development of dosage form(s), the stabilization of the amorphous Mel particle may also be an important viewpoint to ensure the dissolution profile of the active ingredient.
Author contribution
All authors contributed toward data analysis, drafting and critically revising the paper and agree to be accountable for all aspects of the work.
Acknowledgment
This work was supported by Gedeon Richter Ltd – GINOP project (2.2.1-15-2016-00007).
Disclosure
The authors report no conflicts of interest in this work.
References
Andric L, Terzic A, Timovic-Pavlovic Z, Trumic M, Petrov M, Pavlovic L. A kinetic study of micronization grinding of dry mica in a planetary ball mill. Adv Mater Sci Eng. 2013;2013:543857. | ||
Szafraniec J, Antosika A, Knapik-Kowalczuk J, et al. Planetary ball milling and supercritical fluid technology as a way to enhance dissolution of bicalutamide. Int J Pharm. 2017;533(2):470–479. | ||
Liu P, Rong X, Laru J, et al. Nanosuspensions of poorly soluble drugs: preparation and development by wet milling. Int J Pharm. 2011;411(1–2):215–222. | ||
Ghosh I, Schenck D, Bose S, Ruegger C. Optimization of formulation and process parameters for the production of nanosuspension by wet media milling technique: effect of vitamin E TPGS and nanocrystal particle size on oral absorption. Eur J Pharm Sci. 2012;47(4):718–728. | ||
George M, Ghosh I. Identifying the correlation between drug/stabilizer properties and critical quality attributes (CQAs) of nanosuspension formulation prepared by wet media milling technology. Eur J Pharm Sci. 2013;48(1–2):142–152. | ||
Sushant S, Archana K. Methods of size reduction and factors affecting size reduction in pharmaceutics. Int Res J Pharm. 2013;4(8):57–64. | ||
Bhakay A, Merwade M, Bilgili E, Dave RN. Novel aspects of wet milling for the production of microsuspensions and nanosuspensions of poorly water-soluble drugs. Drug Dev Ind Pharm. 2011;37(8):963–976. | ||
Rasenack N, Müller BW. Micron-size drug particles: common and novel micronization techniques. Pharm Dev Technol. 2004;9(1):1–13. | ||
Bilgili E, Hamey R, Scarlett B. Nano-milling of pigment agglomerates using a wet stirred media mill: elucidation of the kinetics and breakage mechanisms. Chem Eng Sci. 2006;61(1):149–157. | ||
Loh ZH, Samanta AK, Heng PWS. Overview of milling techniques for improving the solubility of poorly water-soluble drugs. Asian J Pharm Sci. 2015;10(4):255–274. | ||
Pawar VK, Singh Y, Meher JG, Gupta S, Chourasia MK. Engineered nanocrystal technology: in-vivo fate, targeting and applications in drug delivery. J Control Release. 2014;183:51–66. | ||
Azad AM, Afolabi A, Patel N, Dave R, Bilgili E. Preparation of stable colloidal suspensions of superdisintegrants via wet stirred media milling. Particuology. 2014;14:76–82. | ||
Patravale VB, Date AA, Kulkarni RM. Nanosuspensions: a promising drug delivery strategy. J Pharm Pharmacol. 2004;56(7):827–840. | ||
Peltonen L, Hirvonen J. Pharmaceutical nanocrystals by nanomilling: critical process parameters, particle fracturing and stabilization methods. J Pharm Pharmacol. 2010;62(11):1569–1579. | ||
Chen H, Khemtong C, Yang X, Chang X, Gao J. Nanonization strategies for poorly water-soluble drugs. Drug Discov Today. 2011;16(7–8):354–360. | ||
Johansson A. Correlation Between Process Parameters and Milling Efficiency [dissertation]. Uppsala: Uppsala University; 2012. | ||
Web reference 6 Retsch®. Available from: http://pdf.directindustry.com/pdf/retsch/the-sample-high-energy-ballmills/19308-518973.html. Accessed on March 20, 2016. | ||
Van Eerdenbrugh B, Froyen L, Van Humbeeck J, Martensc JA, Augustijnsa P, Van Den Mootera G. Alternative matrix formers for nanosuspension solidification: dissolution performance and X-ray microanalysis as an evaluation tool for powder dispersion. Eur J Pharm Sci. 2008;35(4):344–353. | ||
Van Eerdenbrugh B, Froyen L, Van Humbeeck J, Martens JA, Augustijns P, Van den Mooter G. Drying of crystalline drug nanosuspensions – the importance of surface hydrophobicity on dissolution behavior upon redispersion. Eur J Pharm Sci. 2008;35(1–2):127–135. | ||
Mártha C, Kürti L, Farkas G, et al. Effects of polymers on the crystallinity of nanonized meloxicam during a co-grinding process. Eur Polym J. 2013;49(9):2426–2432. | ||
Bartos C, Ambrus R, Sipos P, et al. Study of sodium hyaluronate-based intranasal formulations containing micro- or nanosized meloxicam particles. Int J Pharm. 2015;491(1–2):198–207. | ||
Gieszinger P, Csóka I, Pallagi E, et al. Preliminary study of nanonized lamotrigine containing products for nasal powder formulation. Drug Des Devel Ther. 2017;11:2453–2466. | ||
Bartos C, Szabó-Révész P, Bartos C, Katona G, Jójárt-Laczkovich O, Ambrus R. The effect of an optimized wet milling technology on the crystallinity, morphology and dissolution properties of micro- and nanonized meloxicam. Molecules. 2016;21(4):507–518. | ||
Chibowski S, Paszkiewicz M, Krupa M. Investigation of the influence of the polyvinyl alcohol adsorption on the electrical properties of Al2O3 solution interface, thickness of the adsorption layers of PVA. Powder Technol. 2000;107(3):251–255. | ||
Vastag M, Keseru GM. Current in vitro and in silico models of blood-brain barrier penetration: a practical view. Curr Opin Drug Discov Devel. 2009;12(1):115–124. | ||
Hellinger E, Bakk ML, Pocza P, Tihanyi K, Vastag M. Drug penetration model of vinblastine-treated Caco-2 cultures. Eur J Pharm Sci. 2010;41(1):96–106. | ||
Li Q, Wang K, Zheng Y, Ruan M, Mei X, Lin B. Experimental research of particle size and size dispersity on the explosibility characteristics of coal dust. Powder Technol. 2016;292:290–297. | ||
Bocsik A, Walter FR, Gyebrovszki A, et al. Reversible opening of intercellular junctions of intestinal epithelial and brain endothelial cells with tight junction modulator peptides. J Pharm Sci. 2016;105(2):754–765. | ||
Kiss L, Walter FR, Bocsik A, et al. Kinetic analysis of the toxicity of pharmaceutical excipients Cremophor EL and RH40 on endothelial and epithelial cells. J Pharm Sci. 2013;102(4):1173–1181. | ||
Kürti L, Veszelka S, Bocsik A, et al. The effect of sucrose esters on a culture model of the nasal barrier. Toxicol In Vitro. 2012;26(3):445–454. | ||
Hellinger E, Veszelka S, Tóth AE, et al. Comparison of brain capillary endothelial cell-based and epithelial (MDCK-MDR1, Caco-2, and VB-Caco-2) cell-based surrogate blood-brain barrier penetration models. Eur J Pharm Biopharm. 2012;82(2):340–351. | ||
Kiss L, Hellinger É, Pilbat AM, et al. Sucrose esters increase drug penetration, but do not inhibit p-glycoprotein in caco-2 intestinal epithelial cells. J Pharm Sci. 2014;103(10):3107–3119. | ||
Tretinnikov ON, Zagorskaya SA. Determination of the degree of crystallinity of poly(vinyl alcohol) by FTIR spectroscopy. J Appl Spectrosc. 2012;79(4):521–526. | ||
Derjaguin B, Landau L. Theory of the stability of strongly charged lyophobic sols and of the adhesion of strongly charged particles in solutions of electrolytes. Acta Physicochim URSS. 1941;14:633–662. |
 © 2018 The Author(s). This work is published and licensed by Dove Medical Press Limited. The full terms of this license are available at https://www.dovepress.com/terms.php and incorporate the Creative Commons Attribution - Non Commercial (unported, v3.0) License.
By accessing the work you hereby accept the Terms. Non-commercial uses of the work are permitted without any further permission from Dove Medical Press Limited, provided the work is properly attributed. For permission for commercial use of this work, please see paragraphs 4.2 and 5 of our Terms.
© 2018 The Author(s). This work is published and licensed by Dove Medical Press Limited. The full terms of this license are available at https://www.dovepress.com/terms.php and incorporate the Creative Commons Attribution - Non Commercial (unported, v3.0) License.
By accessing the work you hereby accept the Terms. Non-commercial uses of the work are permitted without any further permission from Dove Medical Press Limited, provided the work is properly attributed. For permission for commercial use of this work, please see paragraphs 4.2 and 5 of our Terms.