")
Back to Journals » International Journal of Nanomedicine » Volume 13
Novel pH-sensitive zinc phthalocyanine assembled with albumin for tumor targeting and treatment
Authors Wang Y, Zheng K , Xuan G, Huang M, Xue J
Received 23 July 2018
Accepted for publication 9 October 2018
Published 19 November 2018 Volume 2018:13 Pages 7681—7695
DOI https://doi.org/10.2147/IJN.S181199
Checked for plagiarism Yes
Review by Single anonymous peer review
Peer reviewer comments 3
Editor who approved publication: Dr Linlin Sun
Ying Wang,1,2 Ke Zheng,1 Guangshan Xuan,1 Mingdong Huang,3 Jinping Xue3
1College of Chemical Engineering, Qingdao University of Science and Technology, Qingdao, Shandong, China; 2Key Lab of Inorganic Synthetic and Applied Chemistry, State Key Lab Base of Eco-Chemical Engineering, College of Chemistry and Molecular Engineering, Qingdao University of Science and Technology, Qingdao, Shandong, China; 3College of Chemistry, Fuzhou University, Fuzhou, Fujian, China
Purpose: Zinc phthalocyanine (ZnPc) has been applied widely in photodynamic therapy (PDT) with high ROS-production capacity and intense absorption in the near-infrared region. However, weak tumor targeting and the aggregation tendency of ZnPc seriously affect the therapeutic effect of PDT. Therefore, overcoming the aggregation of ZnPc and enhancing its antitumor effect were the purpose of this study.
Methods: In this study, we first found that the aggregation behaviors of the photosensitizer ZnPc(TAP)4, ZnPc substituted by tertiary amine groups, were regulated finely by pH and that ZnPc(TAP)4 could be disaggregated gradually as the pH descended. ZnPc(TAP)4 and human serum albumin (HSA) molecules were assembled into nanoparticles (NPs) for tumor targeting. Meanwhile, the chemotherapy drug paclitaxel (Ptx) was loaded into HSA NPs together with ZnPc(TAP)4 for dual antitumor effects. HSA NPs loading both ZnPc(TAP)4 and Ptx (NP–ZnPc[TAP]4–Ptx) were characterized by particle size and in vitro release. Cytotoxicity, subcellular localization, tumor targeting, and anticancer effect in vivo were investigated respectively.
Results: We found that NP–ZnPc(TAP)4–Ptx had good stability with qualifying particle size. Interestingly, ZnPc(TAP)4 was released from the NPs and the photodynamic activity enhanced in the acidic environment of tumor. In addition, NP–ZnPc(TAP)4–Ptx had prominent cytotoxicity and time-dependent subcellular localization characteristics. Through a three-dimensional animal imaging system, NP–ZnPc(TAP)4–Ptx showed much-enhanced tumor targeting in tumor-bearing mice. Above all, NP–ZnPc(TAP)4–Ptx was demonstrated to have the synergistic anticancer effect of PDT and chemotherapy.
Conclusion: NP–ZnPc(TAP)4–Ptx had enhanced tumor targeting for the pH-sensitive property of ZnPc(TAP)4 and the transport function of HSA. NP–ZnPc(TAP)4–Ptx possessed a double-anticancer effect through the combination of ZnPc(TAP)4 and Ptx. This drug-delivery system may also be used to carry chemotherapy drugs other than Ptx for improving antitumor effects.
Keywords: photodynamic therapy, drug-delivery system, controlled release, chemotherapy, antitumor activity, combination therapy
Introduction
Photodynamic therapy (PDT) has emerged as an effective and minimally invasive treatment method for tumor.1 Zinc phthalocyanine (ZnPc), known as a second-generation photosensitizer, has excellent photochemical properties with high ROS production ability and intense absorption in the near-infrared region, and gathers much attention for PDT nowadays.2 However, its weak tumor targeting and aggregation tendency3 seriously affect PDT’s therapeutic effect.
Drug-delivery systems enable drugs to be more efficient.4 Nanodrug carriers are widely applied to deliver ZnPc to tumor tissue for the enhanced permeability and retention effect.5 A number of drug carriers have emerged, including polymeric nanoparticles (NPs), nanocapsules, liposomes, micelles, gold NPs, ceramic NPs, magnetic NPs, and dendrimers.6 However, most of these drug carriers are exogenous materials for humans and may have some side effects. Human serum albumin (HSA) is one kind of natural polymer material with atoxic and metabolizable characteristics, and is an excellent drug-carrier material.7 The US Food and Drug Administration has approved Abraxane (NP albumin-bound paclitaxel) for treating metastatic breast cancer. Abraxane is prepared by high-shear homogenization, which can disrupt disulfide bonds and form new disulfide bonds.7
The aggregation property of ZnPc causes not only fluorescence quenching but also a significantly reduced ROS-production rate. Surfactant Cremophor EL can make phthalocyanines disaggregated, but its application is limited by its side effects of hypersensitivity reactions.8 Bulky substituents can inhibit aggregation of ZnPc only in organic solvents, rather than water solution.9 Some ion substituents (eg, sulfo-, carboxy-, and quaternary ammonium salt groups)10–12 can overcome the aggregation of phthalocyanines based on electrostatic interaction in water solution. As such, ZnPc modified by ionic groups shows great application prospects for PDT.
In our current study, the aggregation behavior of substituted ZnPc containing 12 tertiary amine groups, 2,9,16,23-tetrakis[2,4,6-tris(N,N-dimethylaminomethyl)phenoxy]ZnPc(TAP)4, was first found to be regulated by pH in solution. ZnPc(TAP)4 was loaded into HSA NPs prepared by sulfhydryl self-assembly together with the chemotherapeutic anticancer drug paclitaxel (Ptx) to obtain the complex NP–ZnPc(TAP)4–Ptx. Particle size and stability of NP–ZnPc(TAP)4–Ptx were characterized. NP–ZnPc(TAP)4–Ptx was demonstrated to have pH-sensitive properties for ZnPc(TAP)4 release. NP–ZnPc(TAP)4–Ptx was found to have a potent cytotoxicity effect in vitro. Interestingly, NP–ZnPc(TAP)4–Ptx had different subcellular localization following extended time. H22 tumor-bearing Kunming mice were established and tumor-targeting experiments carried using a three-dimensional (3D) imaging system. It was demonstrated that NP–ZnPc(TAP)4–Ptx had an enhanced tumor targeting effect over ZnPc(TAP)4 through HSA-NP loading. Most of all, NP–ZnPc(TAP)4–Ptx showed a higher antitumor effect, which could be attributable to combined application of phototherapy and chemotherapy. This pH-sensitive drug-delivery system loading ZnPc(TAP)4 may be applied to simultaneous delivery of other chemotherapy drugs for synergistic anticancer purposes.
Methods
Materials
ZnPc(TAP)4 (Figure 1A) was synthesized and characterized as per a previous method reported by our group.13 Ptx was purchased from DKY Technology (Wuhan, China). HSA was purchased from Shanghai RAAS Blood Products (Shanghai, China). Non-small-cell lung carcinoma cells (H1299) were obtained from the American Type Culture Collection (ATCC) (Manassas, VA, USA). Mouse H22 hepatoma cells were purchased from the Cell Bank of the Chinese Academy of Sciences (Shanghai, China). RPMI 1640 medium and FBS used for cell culture were purchased from Thermo Fisher Scientific (Waltham, MA, USA). Other chemicals were purchased from either Sigma-Aldrich Co. (St Louis, MO, USA) or Sinopharm Chemical Reagent (Shanghai, China). Clean-level Kunming mice were purchased from Shanghai SLAC Laboratory Animal, Chinese Academy of Sciences (Shanghai, China).
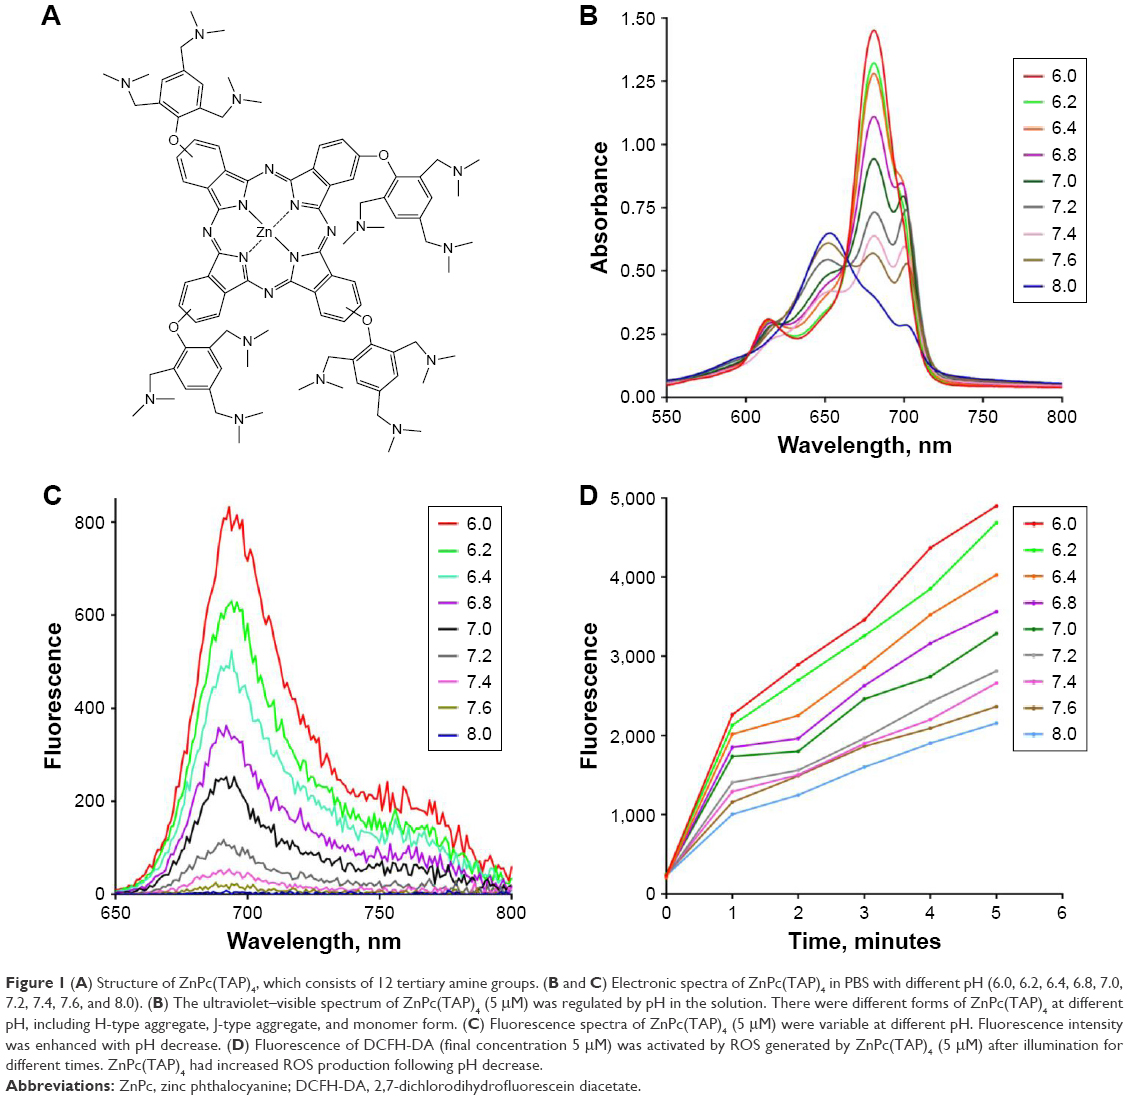 | Figure 1 (A) Structure of ZnPc(TAP)4, which consists of 12 tertiary amine groups. (B and C) Electronic spectra of ZnPc(TAP)4 in PBS with different pH (6.0, 6.2, 6.4, 6.8, 7.0, 7.2, 7.4, 7.6, and 8.0). (B) The ultraviolet–visible spectrum of ZnPc(TAP)4 (5 μM) was regulated by pH in the solution. There were different forms of ZnPc(TAP)4 at different pH, including H-type aggregate, J-type aggregate, and monomer form. (C) Fluorescence spectra of ZnPc(TAP)4 (5 μM) were variable at different pH. Fluorescence intensity was enhanced with pH decrease. (D) Fluorescence of DCFH-DA (final concentration 5 μM) was activated by ROS generated by ZnPc(TAP)4 (5 μM) after illumination for different times. ZnPc(TAP)4 had increased ROS production following pH decrease. |
Ultraviolet–visible and fluorescence spectra of ZnPc(TAP)4
PBS (180 μL, pH 6.0, 6.2, 6.4, 6.8, 7.0, 7.2, 7.4, 7.6, 8.0) was added to 96-well plates that contained 20 μL ZnPc(TAP)4 (50 μM in ethanol solution). Ultraviolet–visible and fluorescence spectra (excitation wavelength 610 nm) of the mixed solution were detected by a microplate reader (BioTek Instruments, Winooski, VT, USA).
ROS measurement of ZnPc(TAP)4 with different pH
PBS (198 μL, pH 6.0, 6.2, 6.4, 6.8, 7.0, 7.2, 7.4, 7.6, 8.0) containing ZnPc(TAP)4 5 μM was added to 96-well plates. Then, 2 μL dimethyl sulfoxide (DMSO) solution of 2,7-dichlorodihydrofluorescein diacetate (DCFH-DA; 500 μM) was added to the PBS with different pH. Mixed solutions were irradiated using an LED light source (20 mW/cm2) for 5 minutes in total. Fluorescence maximum-emission intensity was detected by a microplate reader (BioTek Instruments) with excitation wavelength at 480 nm every 1 minute during the whole 5 minutes.
Preparation of NP–ZnPc(TAP)4–Ptx
β-Mercaptoethanol (2 μL), PBS (750 μL, pH 8), and HSA solution (250 μL, 200 mg/mL) were mixed together. After being stirred for 15 minutes, the solution was diluted using 1 mL PBS (pH 8). Then, ZnPc(TAP)4 ethanol solution (0.5 mL, 7.6 mM) was added to the solution. After incubation for 5 minutes, Ptx DMSO solution (15.2 mM, 100 μL) was also added to the solution and mixed for another 5 minutes. Finally, another 2 mL ethanol was added dropwise into the solution. After being stirred for 4 hours, PBS (5 mL, pH 8) was added to the reaction solution and the solution dialyzed to PBS (pH 7.4) by dialysis bag with molecular-weight cutoff 8–10 kDa. After the dialysis, the solution was centrifuged at 12,000 rpm for 30 minutes and NP–ZnPc(TAP)4–Ptx precipitated. NP–ZnPc(TAP)4–Ptx was resuspended three times for purification. The NP–ZnPc(TAP)4–Ptx solution was then applied to a diethylaminoethyl anion-exchange (DEAE) column (GE Healthcare UK Ltd, Little Chalfont, UK) for further purification. NP–ZnPc(TAP)4 or NP–Ptx was prepared by the same method, except for the addition of Ptx or ZnPc(TAP)4, respectively.
Characterization of NP–ZnPc(TAP)4–Ptx
Ultraviolet–visible spectra of NP–ZnPc(TAP)4–Ptx and NP–ZnPc(TAP)4 were monitored by the microplate reader. Singlet-oxygen quantum yields (ΦΔ) of NP–ZnPc(TAP)4–Ptx and ZnPc(TAP)4 were detected using 1,3-diphenylisobenzofuran as chemical quencher. Particle size and potential were characterized with a Malvern Zetasizer ZS (Malvern Instruments, Malvern, UK). Concentrations of HSA, ZnPc(TAP)4, and Ptx in NP–ZnPc(TAP)4–Ptx were detected for defining the coupling ratio. NP–ZnPc(TAP)4–Ptx was degraded by lysate containing 2% SDS (w:v) and 0.1 M NaOH. The concentration of HSA in the lysate was checked with a BCA protein-assay kit (BioTek Instruments). Ptx concentration was detected using HPLC by establishing a calibration curve for Ptx. Then, DMSO was added to the lysate to a final concentration of 90%. ZnPc(TAP)4 concentration in the 90% DMSO solution was quantified using its fluorescence quantitative calibration curve (excitation wavelength 610 nm).
Drug-release curve
NP–ZnPc(TAP)4–Ptx solution (5 mL, containing ZnPc[TAP]4 50 μM) was stored in PBS with pH 7.4, 7.2, 7.0, 6,8, 6.4, or 6.2. The coupling ratio of Ptx:HSA was detected by the aforementioned methods. After the solution had been centrifuged for 30 minutes at 12,000 rpm, supernatant was removed and the coupling ratio of precipitate for ZnPc(TAP)4:Ptx:HSA detected by the same method. The coupling ratio of NP–ZnPc(TAP)4–Ptx at pH 7.4 was monitored for 14 days.
Cytotoxicity
Non-small-cell lung cancer (H1299) cells were cultivated in the RPMI 1640 medium supplemented with 10% FBS at 37°C in a humidified incubator with 5% CO2 atmosphere. The viability of cells was determined by trypan-blue dye exclusion. Cells were maintained in the logarithmic phase with viability. After dissociation of the cells by trypsin, suspended cells were added to 96-well Costar plates, with 8,000 cells in each well. After cell attachment, NP–ZnPc(TAP)4–Ptx, NP–ZnPc(TAP)4, or ZnPc(TAP)4 was added to the wells, and final concentrations of ZnPc(TAP)4 in the wells were 0.5 μM, 1 μM, 5 μM, 10 μM, and 50 μM. After 24 hours, medium was replaced by fresh medium without samples. Then, cells in the 96-well plates were illuminated by an LED light source (680 nm, 100 mW, Sundynamic, Qingdao, China) with light fluence of 1.5 J/cm2 for 1 minute. After 24 hours, viable cells were checked by MTT. Each experiment was repeated three times, with four replicates at each time point. Dark toxicity of cells was detected in the same way, just without illumination. The cytotoxicity of NP–ZnPc(TAP)4–Ptx and NP–Ptx with illumination was detected by the same method at Ptx concentrations of 0.3 μM, 0.6 μM, 3 μM, 6 μM, 12 μM, and 30 μM.
Cellular localization
The suspended cells (H1299) were plated onto confocal chamber slides (Nest Biotechnology Wuxi, Jiangsu, China) at 37°C centigrade and incubated for 24 hours. Then, NP–ZnPc(TAP)4–Ptx was added to the medium, and the final concentration of ZnPc(TAP)4 was 10 μM. After incubation for 30 minutes or 2 hours, adherent cells were washed with PBS to remove unbound NP–ZnPc(TAP)4–Ptx and then incubated in medium containing MitoTracker green (40 nM) or LysoTracker (75 nM) for 30 minutes. Cells were then washed with PBS and incubated in fresh medium. Laser-scanning confocal microscopy (FluoView FV1000; Olympus Corporation, Tokyo, Japan) was used for cell imaging. The fluorescence of MitoTracker green, LysoTracker, or ZnPc(TAP)4 in the cells on the confocal chamber slides was excited by an argon-ion laser light (wavelength 488 nm, 550 nm, or 633 nm), while emitted fluorescence was filtered with barrier filters (420/30 nm, 590/30 nm, or 640–700 nm band pass). All parameters, including laser-line intensity, photometric gain, settings of photomultiplier tube, and filter attenuation, were kept constant throughout the entire imaging experiment. All images were analyzed with FluoView v2.1 software.
Establishment of H22 tumor-bearing mouse model
Male Kunming mice (4 weeks old and weighing 18–22 g) were purchased from Shanghai SLAC Laboratory Animal. Mouse H22 cells (5×10⁶) were injected into the mice’s abdominal cavities. After cultivation for 6 days, mice were executed by breaking the neck. Ascetic fluid was collected and cell quantity counted. Then, H22 cells (2×10⁶) from the ascetic fluid in normal saline (200 μL) were injected into the back. Typically, tumor volume reached around 50 mm3 in 5–7 days after inoculation, and the mouse model was established successfully. All animal experiments were approved by the Animal Care Committee of Qingdao University of Science and Technology, and all animal studies were performed in compliance with the guidelines of the committee.
Fluorescence imaging in vivo
The H22 tumor-bearing Kunming mice were randomly divided into two groups (five mice per group) with equivalent average starting tumor size (50 mm3) and body weight (23 g). NP–ZnPc(TAP)4–Ptx and ZnPc(TAP)4 (each sample contained ZnPc[TAP]4 25 μmol/L) in normal saline solution were prepared and injected into H22 tumor-bearing Kunming mice via tail vein (0.2 μmol/kg ZnPc[TAP]4). Then, at 1, 2, 4, 12, 24, and 48 hours, mice were anaesthetized with isoflurane and NP–ZnPc(TAP)4–Ptx or ZnPc(TAP)4 fluorescence monitored by a fluorescence molecular tomography (FMT) 2500LX instrument (PerkinElmer Inc., Waltham, MA, USA). Throughout the experiment, all mice were kept in a dark room and light exposure avoided. ZnPc(TAP)4 solution (0.2 μmol/L) in PBS containing 5% Cremophor EL was used as a standard to calibrate the instrument for the quantification of ZnPc(TAP)4 concentration. Data collected were reconstructed by the software TrueQuant version 3.0 (PerkinElmer Inc.) to 3D and quantitative information was analyzed by creating regions of interest around the tumor sites after the subtraction of fluorescence background.
Antitumor efficacy of NP–ZnPc(TAP)4–Ptx in H22 tumor-bearing Kunming mice
H22 tumor-bearing mice were randomly divided into three groups (ten mice per group) as described earlier. Every mouse had equivalent tumor volume (50 mm3) and weight (23 g). NP–ZnPc(TAP)4–Ptx, NP–ZnPc(TAP)4, or ZnPc(TAP)4 solution in normal saline (each solution contained 25 μmol/L ZnPc[TAP]4) was injected into the mice’s via tail veins at a dose of 0.2 μmol/kg ZnPc(TAP)4. All mice were fed in a dark room, and every 24 hours the tumor site was illuminated by a 680 nm light source (1 W, LumaCare Medical, Newport Beach, CA, USA) for 3 minutes to a light dose of 50 J/cm2. PDT lasted for 7 days and tumor volume in every mouse measured each day by a caliper through an ellipsoid-volume formula: π/6 × (length × width × height). The weight of mice was measured using an electronic scale on a daily basis.
Statistical analysis
All data represent group mean and SEM. The experimental data were analyzed using unpaired two-tailed Student’s t-tests. Differences at the 95% confidence level (P<0.05) were considered statistically significant.
Results
Electronic spectra of ZnPc(TAP)4 regulated by solution pH
Ultraviolet–visible and fluorescence-emission spectra of ZnPc(TAP)4 were detected in PBS with different pH (6.0, 6.2, 6.4, 6.8, 7.0, 7.2, 7.4, 7.6, 8.0). Figure 1B shows that ZnPc(TAP)4 had typical absorption peaks of phthalocyanine, while the peak shape was changed with different pH. The maximum-absorption peak was at 680 nm (pH 6.0), which suggested a monomer form of ZnPc(TAP)4. The maximum-absorption peak gradually decreased following elevated pH and was blue-shifted to 653 nm when pH was raised to 8.0, which indicated ZnPc(TAP)4 aggregated gradually. It is noteworthy that the third peak at 700 nm rose from pH 6.8 to 7.6. The double peaks (at 680 nm and 700 nm) suggested that J-aggregation occurred among molecules of ZnPc(TAP)4. Figure 1C shows fluorescence-emission spectra with excitation wavelength 610 nm. pH went decreased 8.0 to 6.0, and fluorescence intensity was gradually enhanced. During just the two pH changes, fluorescence intensity increased more than 200 times from about 4 to 830. Fluorescence quenching was caused by aggregation of molecules. Changes in ultraviolet–visible and fluorescence spectra exhibited a response sensitive to pH.
Higher ROS productivity following pH decrease
DCFH-DA is a probe of ROS and can be transformed into 2,7-dichlorofluorescein (DCF) in the presence of ROS. Though DCFH-DA had no fluorescence properties, DCF fluorescence was excited at 485 nm, and the fluorescence intensity was proportional to DCF concentration, so DCF fluorescence intensity was used to monitor ROS generation. Figure 1D shows that DCF fluorescence intensity was gradually enhanced as the illumination time was prolonged in all solutions with different pH. At any point of illumination time, lower pH in PBS could generate stronger fluorescence-emission intensity of DCF, which suggested more ROS productivity through ZnPc(TAP)4 in an acidic environment.
Preparation and characterization of NP–ZnPc(TAP)4–Ptx
The method of sulfhydryl self-assembly was used for preparing HSA NPs. The disulfide bonds of HSA molecules were firstly cleaved by mercaptoethanol. HSA molecules were gathered by dehydration of ethanol and the free-sulfhydryl groups obtained further cross-linked to form HSA NPs. Through the hydrophobic interaction, ZnPc(TAP)4 and Ptx molecules were loaded into the HSA NPs. Ultraviolet–visible spectra of NP–ZnPc(TAP)4–Ptx and NP–ZnPc(TAP)4 (Figure S1) showed that both had maximum-absorption wavelength at 686 nm in PBS with pH 7.4, which was different from that of ZnPc(TAP)4 at pH 7.4 without HSA (650 nm, 681 nm, 702 nm). The difference suggested an interaction between ZnPc(TAP)4 and HSA. More detailed data of ultraviolet–visible and singlet-oxygen generation were shown in Table S1. The result indicated that ZnPc(TAP)4 and NP–ZnPc(TAP)4–Ptx ΦΔ increased with reduced pH. The coupling ratio of HSA, ZnPc(TAP)4, and Ptx in NP–ZnPc(TAP)4–Ptx was about 1:3:1.8, which demonstrated ZnPc(TAP)4 and Ptx were successfully loaded into HSA NPs. Dynamic light-scattering measurement showed that the average diameter of NP–ZnPc(TAP)4–Ptx was 107 nm (Figure 2A) and remained almost unchanged until 14 days, which demonstrated reasonable stability. The ζ-potential of NP–ZnPc(TAP)4–Ptx was −28 mV (Figure 2B), which indicated high colloidal stability.
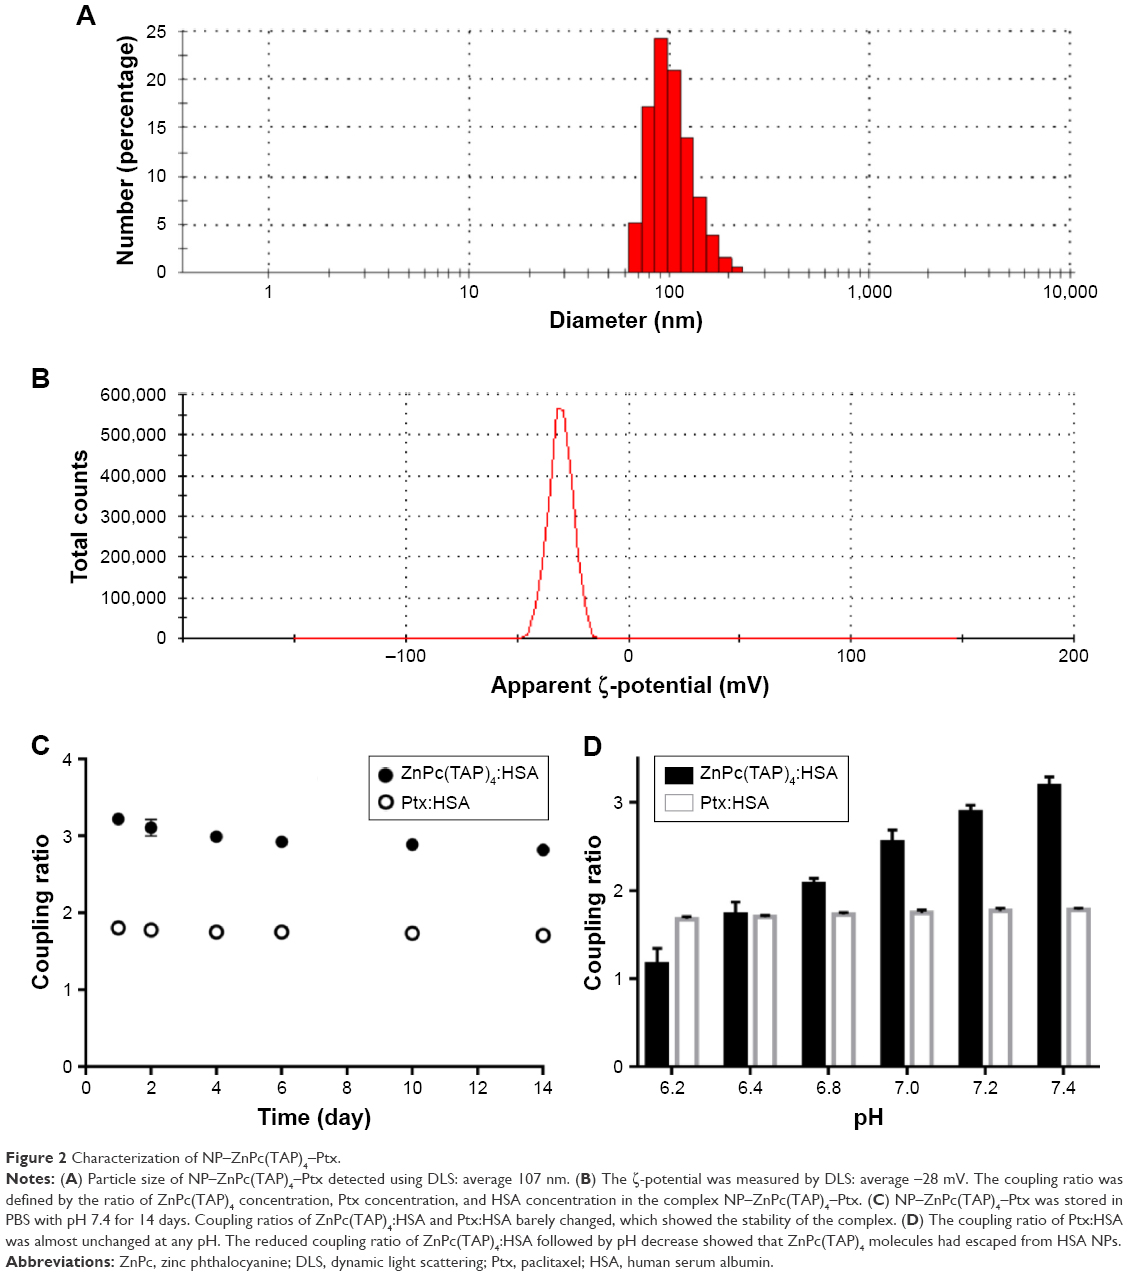 | Figure 2 Characterization of NP–ZnPc(TAP)4–Ptx. |
Drug release controlled by pH
An ideal NP-mediated drug-delivery system would not only transport drugs to diseased organs/cells but also release them in the target organ. Less leakage of drugs in NPs during transport and more release from NPs at the target location could enhance therapeutic effect and safety. Therefore, the drug-release behavior from the HSA NPs was detected. If ZnPc(TAP)4 was separated from HSA NPs, the coupling ratio of HSA and ZnPc(TAP)4 would change, so change in coupling ratio was used to monitor the release of ZnPc(TAP)4. The coupling ratio of HSA and ZnPc(TAP)4 was 1:3 in PBS with pH 7.4, which approached pH under physiological conditions. The coupling ratio barely changed during continuous monitoring for 14 days (Figure 2C), which showed favorable stability. Conversely, the coupling ratio was gradually transformed to 1:2 following pH dropping to 6.8. When the pH was reduced to 6.2, the coupling ratio became 1:1.2 (Figure 2D). These results suggested that ZnPc(TAP)4 was released from the HSA nanocarrier in an acidic environment. The coupling ratio of HSA and Ptx was unchanged during detection lasting for 14 days (Figure 2C), and Ptx release was not affected by pH in PBS (Figure 2D).
Obvious cytotoxicity of NP–ZnPc(TAP)4–Ptx
The cytotoxicity of drugs in vivo was the foundation of antitumor effects in vitro. H1299 cells were taken as research objects, and the cytotoxicity of NP–ZnPc(TAP)4–Ptx was detected using NP–ZnPc(TAP)4 and ZnPc(TAP)4 as contrast. After uptake for 24 hours, H1299 cells were illuminated by an LED light source (680 nm, 100 mW). Then, cell viability was measured through apoptosis for another 24 hours. Figure 3A shows the phototoxicity of NP–ZnPc(TAP)4, ZnPc(TAP)4, and NP–ZnPc(TAP)4–Ptx for H1299 cells. Their dark toxicity was also measured with the same method, just without light, and the results are shown in Figure 3B. Both ZnPc(TAP)4 and NP–ZnPc(TAP)4 had little dark toxicity, and the cell-survival rate was ~90% at 50 μM concentration, which reflected the nontoxicity of HSA NPs as drug carriers. However, ZnPc(TAP)4 showed distinct phototoxicity and the cell-survival rate gradually decreased as the concentration of ZnPc(TAP)4 increased, which demonstrated the photodynamic activity of ZnPc(TAP)4. NP–ZnPc(TAP)4 showed enhanced phototoxicity compared with ZnPc(TAP)4, which may have been due to the loading capacity of HSA NPs for a mass of ZnPc(TAP)4. It was noteworthy that NP–ZnPc(TAP)4–Ptx with an additional therapeutic agent, the chemotherapy drug Ptx, had stronger cytotoxicity, including phototoxicity and dark toxicity, than NP–ZnPc(TAP)4 and ZnPc(TAP)4, with phototoxicity IC50 4±0.23 μM. In addition, NP–ZnPc(TAP)4–Ptx still had enhanced cytotoxicity over NP–Ptx under illumination conditions (Figure S2). It illustrated that the combined application of Ptx and ZnPc(TAP)4 created a synergistic effect.
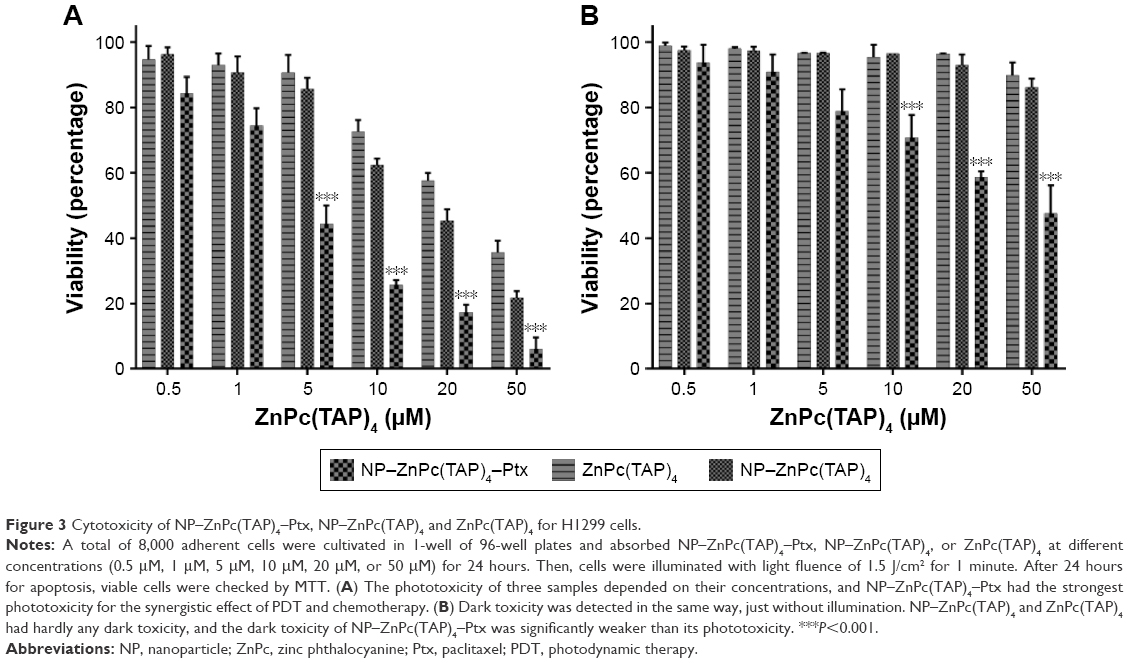 | Figure 3 Cytotoxicity of NP–ZnPc(TAP)4–Ptx, NP–ZnPc(TAP)4 and ZnPc(TAP)4 for H1299 cells. |
Time-dependent cellular localization of NP–ZnPc(TAP)4–Ptx
ROS generated by PDT migrated only <0.02 μm after formation,11 so the cellular localization of the photosensitizer was most probably its active site. In addition, the difference in subcellular localization possibly led to the different cytotoxic mechanisms and effects. After H1299 cells had been incubated with NP–ZnPc(TAP)4–Ptx for 30 minutes or 2 hours, mitochondria and lysosomes were marked by relevant probes. The subcellular localization of NP–ZnPc(TAP)4–Ptx in mitochondria and lysosomes was detected by laser-scanning confocal microscopy (Figure 4). Figure 4A shows the fluorescence of lysosomes and NP–ZnPc(TAP)4–Ptx, and the merger of the two after 30 minutes’ incubation, which indicated almost complete coincidence. Fluorescence-intensity profiles of NP–ZnPc(TAP)4–Ptx and lysosomes (Figure 4A) further proved that NP–ZnPc(TAP)4–Ptx was located mainly in lysosomes. Similarly, Figure 4B shows the fluorescence of mitochondria and NP–ZnPc(TAP)4–Ptx and the merger of the two. Fluorescence-intensity profiles reflected that most NP–ZnPc(TAP)4–Ptx had not located at mitochondria. While H1299 cells were incubated with NP–ZnPc(TAP)4–Ptx for 2 hours, NP–ZnPc(TAP)4–Ptx was not only distributed in lysosomes but also in mitochondria from the results of subcellular localization (Figure 4C and D).
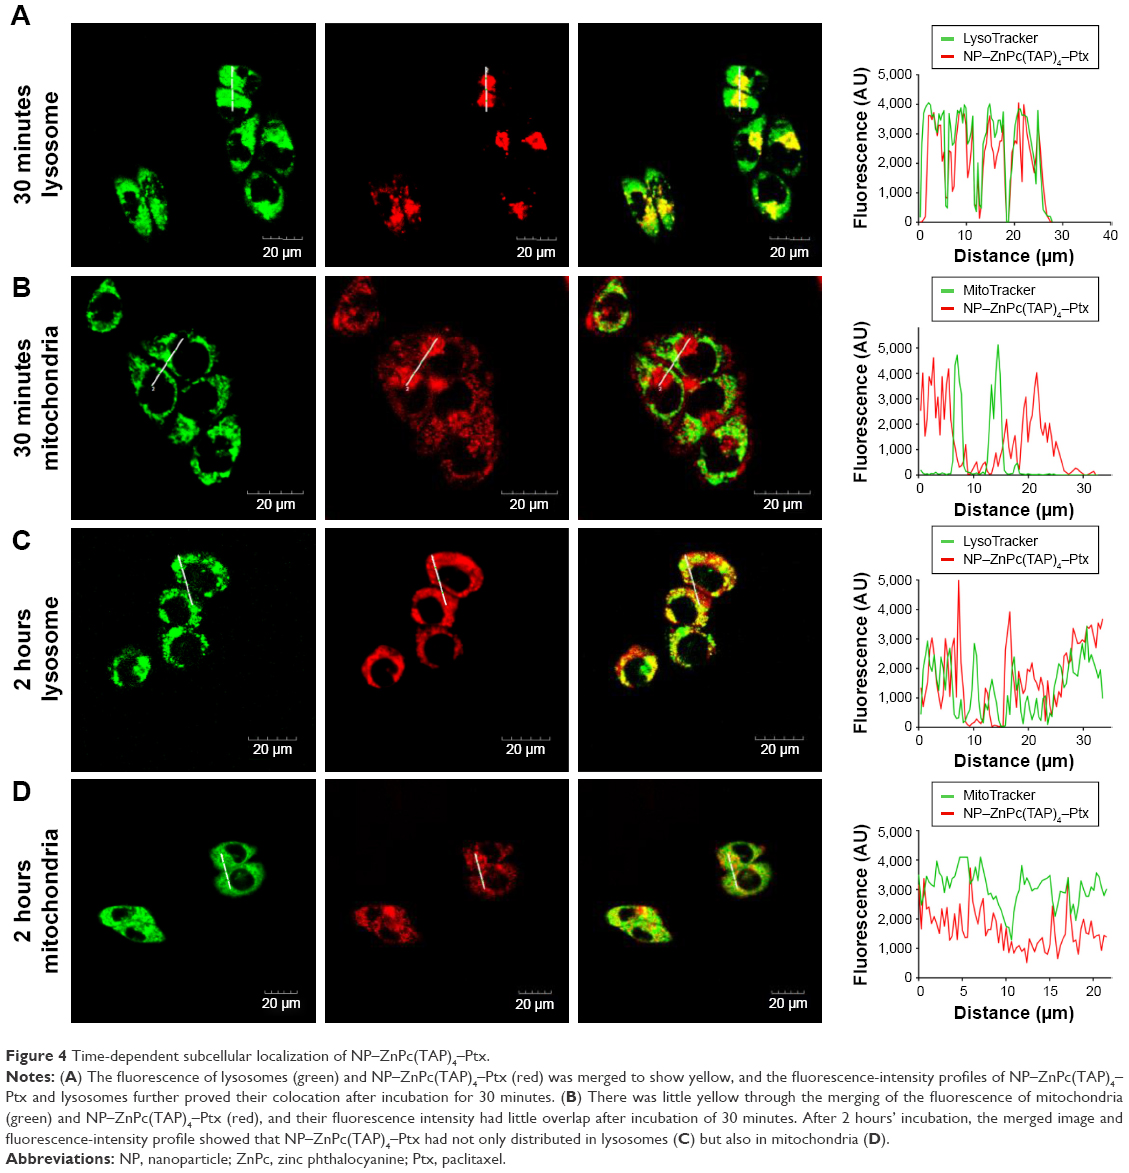 | Figure 4 Time-dependent subcellular localization of NP–ZnPc(TAP)4–Ptx. |
Enhanced tumor targeting of NP–ZnPc(TAP)4–Ptx
As drug carriers, NPs deliver drugs to target organs to improve therapeutic effect. Did NP–ZnPc(TAP)4–Ptx carry more drug to tumors in vivo? The H22 tumor-bearing mouse model was successfully built and used to evaluate the tumor targeting of NP–ZnPc(TAP)4–Ptx with ZnPc(TAP)4 as contrast. After injection of NP–ZnPc(TAP)4–Ptx and ZnPc(TAP)4, tumor-targeting capability in H22 tumor-bearing mice was monitored by FMT at 1, 2, 4, 12, 24, and 48 hours. Through 3D construction and quantitative analysis using TrueQuant (Figure 5), both NP–ZnPc(TAP)4–Ptx and ZnPc(TAP)4 had distributed rapidly to tumor sites (Figure 5A) at 1 hour. After 2 hours, the concentration of ZnPc(TAP)4 for the mice treated with NP–ZnPc(TAP)4–Ptx was about 1.6 times that of mice treated with ZnPc(TAP)4 (Figure 5C). At 4 hours, there was the highest concentration of ZnPc(TAP)4 in tumors in NP-ZnPc(TAP)4-Ptx and ZnPc(TAP)4 group, while NP–ZnPc(TAP)4–Ptx group had 1.8-fold the concentration of ZnPc(TAP)4 in tumors than the ZnPc(TAP)4 group. After 4 hours, the ZnPc(TAP)4 concentration in tumors of the ZnPc(TAP)4 group had decreased slightly and remained lower than the NP–ZnPc(TAP)4–Ptx group up to 48 hours. Though the concentration of ZnPc(TAP)4 in tumors of the NP–ZnPc(TAP)4–Ptx group had reduced at 12 hours, it had another rise at 24 hours, which generated a threefold difference between the two groups (Figure 5C). The results showed that NP–ZnPc(TAP)4–Ptx had an enhanced tumor-targeting effect. In addition, the isosurface conformation was established by FMT at a concentration of 250 nM ZnPc(TAP)4 (Figure 5B) at tumor sites at 24 hours. The isosurface of ZnPc(TAP)4 with mice treated with NP–ZnPc(TAP)4–Ptx was obviously larger than mice treated by ZnPc(TAP)4. What is more, the volume and the boundary of isosurface rendering with the mice treated by NP–ZnPc(TAP)4–Ptx were very close to that of actual tumors. The absence of tumor boundaries was a serious handicap for surgery. As a probe, NP–ZnPc(TAP)4–Ptx might provide support to determine tumor boundaries. Three orthogonal slices (X axial, Y axial, Z axial) across the tumor center showed the distribution of ZnPc(TAP)4 within tumors (Figure 5B). It was found that ZnPc(TAP)4 of both NP–ZnPc(TAP)4–Ptx and ZnPc(TAP)4 groups entered tumor centers and ZnPc(TAP)4 of the NP–ZnPc(TAP)4–Ptx group had more extensive distribution, which further proved the targeting ability of NP–ZnPc(TAP)4–Ptx.
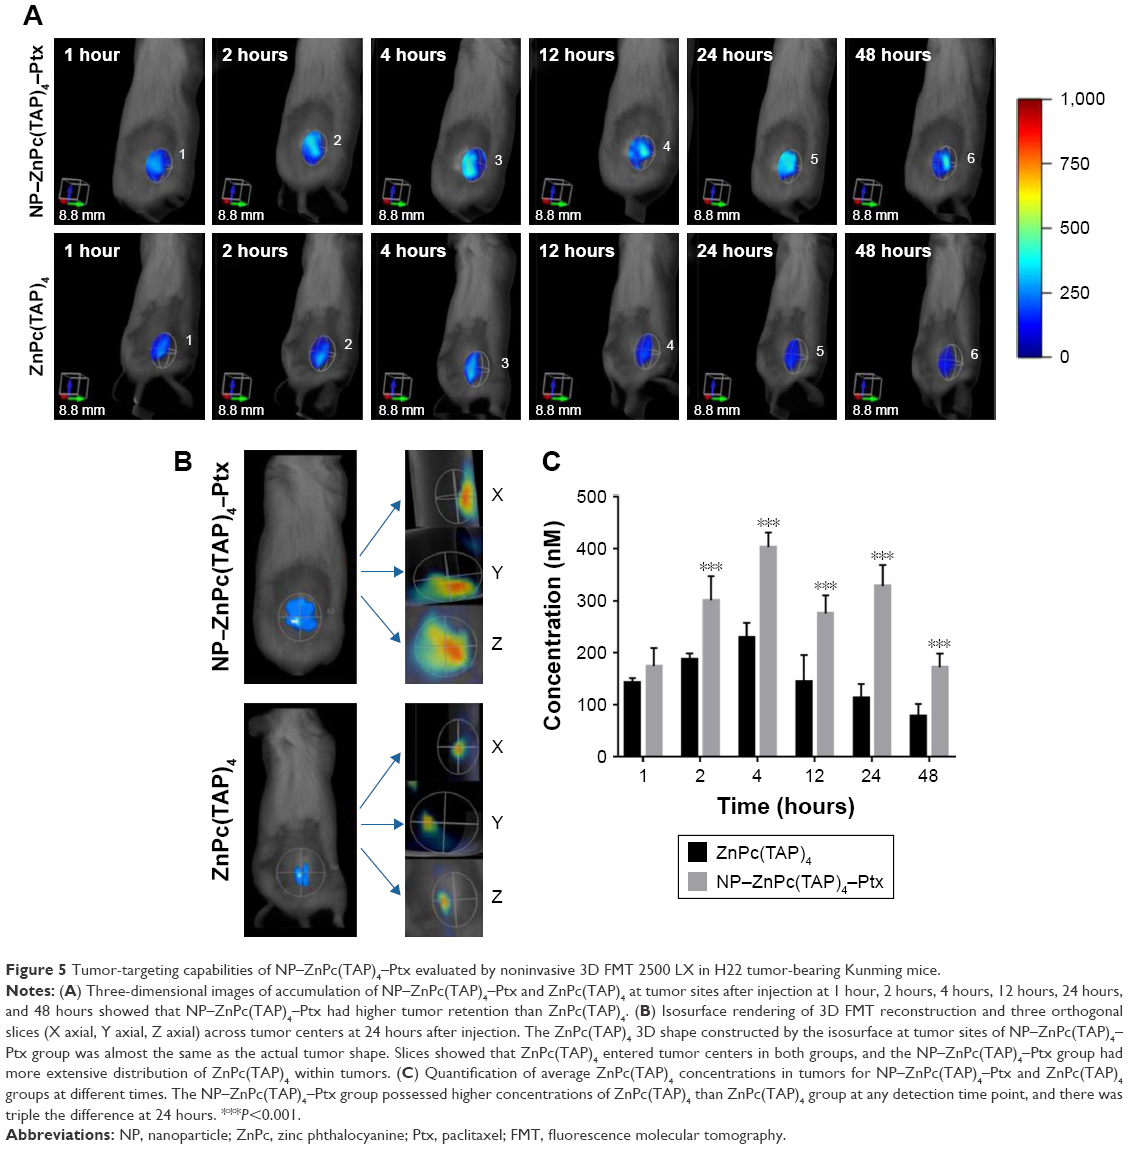 | Figure 5 Tumor-targeting capabilities of NP–ZnPc(TAP)4–Ptx evaluated by noninvasive 3D FMT 2500 LX in H22 tumor-bearing Kunming mice. |
Enhanced antitumor effect of NP–ZnPc(TAP)4–Ptx
The established H22 tumor-bearing mice were injected with NP–ZnPc(TAP)4–Ptx, NP–ZnPc(TAP)4, and ZnPc(TAP)4 using normal saline as contrast. During the daily illumination therapy for 7 days, tumor size was measured every day, and the tumor-growth curve was showed in Figure 6A. Compared with the control, NP–ZnPc(TAP)4–Ptx, NP–ZnPc(TAP)4 and ZnPc(TAP)4, all inhibited tumor growth. In particular, tumor sizes in mice treated with NP–ZnPc(TAP)4–Ptx reduced about four times those of the control. ZnPc(TAP)4 had weaker antitumor effects than NP–ZnPc(TAP)4–Ptx and NP–ZnPc(TAP)4, which may have been due to its weaker tumor-targeting effect (see experimental results in the section of “Enhanced tumor targeting of NP-ZnPc(TAP)4-Ptx”). NP–ZnPc(TAP)4–Ptx had stronger antitumor effect than NP–ZnPc(TAP)4, which illustrated the synergistic anticancer effect of PDT and chemotherapy, in accord with the results of cytotoxicity. During the whole course of treatment, no distinct difference in body weight was observed among the three groups (Figure 6B).
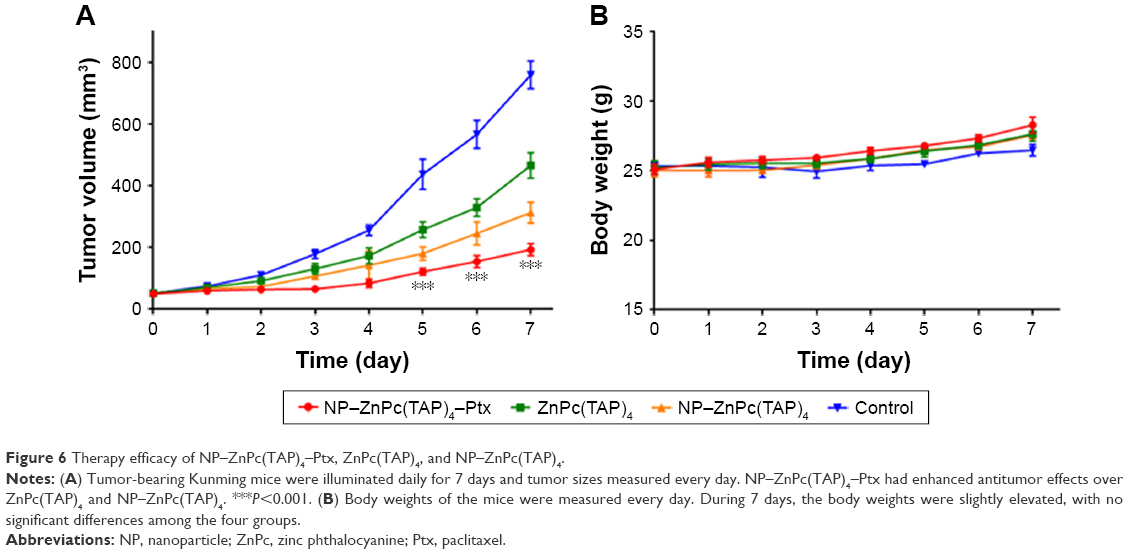 | Figure 6 Therapy efficacy of NP–ZnPc(TAP)4–Ptx, ZnPc(TAP)4, and NP–ZnPc(TAP)4. |
Discussion
Nonaggregated ZnPc(TAP)4 generated by electrostatic repulsive force
ZnPc with a 2D 18-electron system exhibited a high aggregation tendency of dimeric and oligomeric formation. The aggregation was classified as face to face (H-type aggregate), slipped cofacial (H-aggregate for 0°<θ<54.7° or J-aggregate for 54.7°<θ<90°), and pure head to tail (J-type aggregate). Some peripheral substituents containing oxygen or nitrogen atoms coordinated with Zn2+ in another adjacent molecule, which controlled intermolecular H-type aggregation.14 Some solvents, such as dimethylformamide, dimethylsulfoxide, and pyridine, have the same effect when coordinated with Zn2+. The steric-hindrance effect of peripheral substituents can also influence the aggregation behavior of ZnPc. In addition, charged substituents containing cations or anions hinder aggregation through electrostatic repulsive force. On account of the protonation effect of tertiary amine groups in substituents, peripheral substituents carry positive charges in the acidic environment. Therefore, ZnPc(TAP)4 was speculated to exist in monomer form with an absorption peak at 680 nm with pH 6.0 and 6.2. As the pH rose to 7.6, the monomer peak gradually lowered, which suggested aggregation was generated. Meanwhile, an unusual red-shifted absorption peak at 700 nm occurred, which implied J-type aggregation of ZnPc(TAP)4. The emergence of J-type aggregation may be caused by subdued protonation of ZnPc(TAP)4 and reduced electrostatic repulsion interactions among molecules as pH rises. To some extent, the incomplete protonation of ZnPc(TAP)4 and the heterogeneous electrostatic repulsion interaction could result in head-to-tail aggregation. When the pH rose to 8.0, the main absorption peak was blue-shifted to 650 nm, which may have been due to deprotonation and loss of electrostatic forces to generate most H-type aggregates in an alkaline environment.
Loading ZnPc(TAP)4 and Ptx into HSA NPs
By cleaving disulfide bonds of HSA, the structure of HSA became loose, which resulted in more hydrophobic domains of HSA being exposed. These increased hydrophobic domains were able to bind more hydrophobic drugs. ZnPc(TAP)4 (6.2 mg) was dissolved in 0.5 mL ethanol (7.6 mM), and Ptx (1.3 mg) was also dissolved in 100 μL DMSO completely (15.2 mM). After they were added to HSA solution with high concentration, ZnPc(TAP)4 and Ptx bound to HSA by hydrophobic interaction. The HSA NPs loading ZnPc(TAP)4 and Ptx, NP–ZnPc(TAP)4–Ptx were dialyzed to PBS (pH 7.4) three times to remove ethanol and DMSO that was not bound to HSA.
Many interactions may contribute to the binding of ZnPc(TAP)4 and Ptx to HSA. The tertiary amine substituents of ZnPc(TAP)4 could form hydrogen bonds with HSA, and π–π interactions may exist between ZnPc(TAP)4 and amino-acid residues. Hydrophobic interaction was supposed to be the main interaction force. Ptx is a chemotherapy drug with strong hydrophobicity, and had strong affinity with HSA by hydrophobic interaction. In alkaline solution, the hydrophobicity of ZnPc(TAP)4 was increased by deionization, leading to binding to HSA by hydrophobic force. The release of ZnPc(TAP)4 with pH decreased further illustrated the importance of hydrophobic interactions in this loading. It was most probable that not all ZnPc(TAP)4 and Ptx were loaded into HSA NPs. Free ZnPc(TAP)4 was water-soluble and was removed from NP–ZnPc(TAP)4–Ptx by centrifugation. The precipitate caused by unloaded Ptx in PBS was intercepted at the top of the DEAE column. In addition, free HSA adhered to the DEAE column, while NP–ZnPc(TAP)4–Ptx flowed through the column. By these purification methods, it was ensured that both ZnPc(TAP)4 and Ptx were loaded into NPs in the final NP–ZnPc(TAP)4–Ptx solution.
Controlled release of ZnPc(TAP)4 from HSA NPs at tumor sites
In solid-tumor tissue, high glycolytic activity was the common characteristic leading to increased production and secretion of lactate and H+ to the extracellular space. Although tumor pH may vary according to tumor area, the average extracellular tumor pH was between 6.0 and 7.0 and below the pH in normal tissue and blood (around 7.4).15 The very sensitive response to NP–ZnPc(TAP)4–Ptx pH made ZnPc(TAP)4 release at the tumor site, and released ZnPc(TAP)4 more adequately engaged in mutual contact and interaction with tumor cells or cellular substrates, which may improve the PDT effect.
Why could ZnPc(TAP)4 be released in an acidic environment? This was probably related to some properties of ZnPc(TAP)4 itself. HSA molecules have some hydrophobic domains that can bind some hydrophobic drugs. ZnPc(TAP)4 was able to be loaded into HSA NPs due also to the hydrophobic interaction between ZnPc(TAP)4 and HSA molecules. However, in an acidic environment, the hydrophilicity of ZnPc(TAP)4 was increased by the protonation effect of peripheral substituents, which was demonstrated by the ultraviolet–visible spectra at acidic pH. As such, the weakened hydrophobic interaction between ZnPc(TAP)4 and HSA molecules resulted in the separation of ZnPc(TAP)4 from HSA NPs.
Synergistic anticancer effect with PDT and chemotherapy
The therapeutic effect of PDT was seriously affected by the aggregation behavior of phthalocyanines. Especially in an aqueous solution, ZnPc had a strong aggregation trend for intermolecular interaction, leading to fluorescence quenching and lower ROS generation due to enhanced state dissipation without radiation and reduced lifetime of the excited state, while the aggregation of ZnPc(TAP)4 was limited by its tertiary amine substituents in an acidic environment at the tumor site. The higher singlet-oxygen quantum yields (ΦΔ) at lower pH (Table S1) was thought to be one of the reasons for the excellent PDT effect. Light penetration (about 1–2 mm) could also have affected the PDT effect. Compared with deep tumors in the body, subcutaneous tumors were easier to expose to light and be treated by PDT.
It is generally recognized that there are three mechanisms for killing tumor during the course of PDT. Universally, photosensitizers play an antitumor role through direct cellular damage under illumination, on account of which induced ROS can react directly with many biological molecules as an oxidizing agent. In addition, photosensitizers cause vascular leakage and microvascular collapse following PDT, leading to severe and persistent post-PDT tumor hypoxia that contributed to long-term tumor control. Finally, it is thought that PDT can induce a massive regulated invasion of inflammatory cells and generate a long-term antitumor immunoresponse.16 However, Ptx is a microtubule-stabilizer and induces cytotoxicity by cutting off the cell cycle in the G2/M phase.17 Therefore, it could be seen that ZnPc(TAP)4 and Ptx had different antitumor-action mechanisms. The independent dual role of phototherapy and chemotherapy brought out enhanced cytotoxicity.
Preferential distribution in lysosomes and then diffusion into mitochondria
Endocytosis is a mechanism common to all cells in the body for internalizing macromolecules. It has been reported that the primary cell-internalization pathway of NPs was endocytosis, with subsequent distribution to endosomes and then lysosomes.18 The result of subcellular localization showed that NP–ZnPc(TAP)4–Ptx almost completely distributed in lysosomes. Therefore, NP–ZnPc(TAP)4–Ptx were more likely to be internalized through endocytosis. Lysosomes and endosomes have an acidic environment (pH 4.5–6.5).19 On account of protonation, the low pH in lysosomes result in the release of ZnPc(TAP)4 from NP–ZnPc(TAP)4–Ptx. The dissociative molecules of ZnPc(TAP)4 escaped lysosome limits and were distributed in other organelles, including mitochondria. This perhaps was the reason for the time-dependent cellular localization of NP–ZnPc(TAP)4–Ptx.
HSA NPs as tumor-targeting drug carriers
Compared with healthy vessels in normal organs, tumors possess leaky blood vessels and impaired lymphatic drainage, which allows the selective access of NPs to tumors: the so-called enhanced permeability and retention effect.5 Therefore, the nanosize agent NP–ZnPc(TAP)4–Ptx gathered in tumor tissue more than the small-molecule drug ZnPc(TAP)4. In addition, albumin binding to Gp60 on endothelial cells stimulated the activation of caveolin 1, which promoted transport of intact NPs across the cell membrane. The importance of Gp60 in albumin–drug transcytosis has been demonstrated.20 In tumor tissue, another protein, SPARC, which modulates the interaction of cells with the extracellular matrix, can bind and carry albumin to tumor cells. SPARC is overexpressed in multiple tumor types and is associated with increased tumor invasion and metastasis and poor prognosis.21 SPARC binding to albumin may be an another important fator in the increased tumor accumulation of albumin-bound drugs. These functions of albumin also facilitated the tumor-targeting effect of NP–ZnPc(TAP)4–Ptx.
A possible effect to overcome multidrug resistance (MDR)
MDR accounts for ~90% of chemotherapeutic drug failures in cancer patients.22 MDR seriously affects the therapeutic effect of Ptx, due to low tumor specificity, inadequate drug penetration to the tumor site, and rapid clearance from circulation, which lead to more intensive treatment regimens and debilitating side effects.23 MDR is mediated by different mechanisms, in particular overexpression of the drug-efflux transporter Pgp, which can transport chemotherapeutic drugs out of tumor cells. It has been reported that Ptx was a substrate of Pgp, which actively pumped Ptx out of cells and induced drug resistance.24 To overcome Pgp-mediated MDR, various Pgp inhibitors had been developed and coadministered with anticancer agents. However, inhibitors combined with antitumor drugs often result in enhanced drug side effects, due to the aspecific inhibition of Pgp leading to alteration of drug-elimination pathways in liver or kidney.25 Encapsulated Ptx has different mechanisms of entry into cells compared with free Ptx, and nanosize drug-delivery systems can reduce the cell Pgp-pump effect on drugs delivered intracellularly.26 Therefore, NP–ZnPc(TAP)4–Ptx may be able to overcome MDR to some extent.
Conclusion
In our study, the photosensitizer ZnPc(TAP)4 was first found to have pH-sensitive properties. We prepared HSA NP–ZnPc(TAP)4–Ptx by a sulfhydryl self-assembly method loading the photosensitizer ZnPc(TAP)4 and the chemotherapy drug Ptx. NP–ZnPc(TAP)4–Ptx had good stability in physiological conditions, and ZnPc(TAP)4 was released from NP–ZnPc(TAP)4–Ptx in acidic conditions. NP–ZnPc(TAP)4–Ptx enhanced cytotoxicity more than NP–ZnPc(TAP)4 and ZnPc(TAP)4 and had time-dependent properties for cellular localization. Animal experiments showed that NP–ZnPc(TAP)4–Ptx had prominent tumor-targeting and synergistic antitumor effects. This pH-sensitive drug-delivery system loading ZnPc(TAP)4 may be applied for simultaneous delivery of other chemotherapy drugs for synergistic anticancer purposes.
Acknowledgment
This work was supported by grants from the Qingdao Applied Postdoctoral Research Project.
Author contributions
All authors contributed to data analysis, drafting and revising the article, gave final approval of the version to be published, and agree to be accountable for all aspects of the work.
Disclosure
The authors report no conflicts of interest in this work.
References
Lucky SS, Soo KC, Zhang Y. Nanoparticles in photodynamic therapy. Chem Rev. 2015;115(4):1990–2042. | ||
Lukyanets EA. Phthalocyanines as photosensitizers in the photodynamic therapy of cancer. J Porphyr Phthalocyanines. 1999;3(6):424–432. | ||
Chatterjee DK, Fong LS, Zhang Y. Nanoparticles in photodynamic therapy: an emerging paradigm. Adv Drug Deliv Rev. 2008;60(15):1627–1637. | ||
Moret F, Reddi E. Strategies for optimizing the delivery to tumors of macrocyclic photosensitizers used in photodynamic therapy (PDT). J Porphyr Phthalocyanines. 2017;21(04–06):239–256. | ||
Maeda H, Wu J, Sawa T, Matsumura Y, Hori K. Tumor vascular permeability and the EPR effect in macromolecular therapeutics: a review. J Control Release. 2000;65(1–2):271–284. | ||
Torchilin VP. Multifunctional, stimuli-sensitive nanoparticulate systems for drug delivery. Nat Rev Drug Discov. 2014;13(11):813–827. | ||
Elzoghby AO, Samy WM, Elgindy NA. Albumin-based nanoparticles as potential controlled release drug delivery systems. J Control Release. 2012;157(2):168–182. | ||
Weiszhár Z, Czúcz J, Révész C, Rosivall L, Szebeni J, Rozsnyay Z. Complement activation by polyethoxylated pharmaceutical surfactants: Cremophor-EL, Tween-80 and Tween-20. Eur J Pharm Sci. 2012;45(4):492–498. | ||
Makhseed S, Machacek M, Alfadly W, et al. Water-soluble non-aggregating zinc phthalocyanine and in vitro studies for photodynamic therapy. Chem Commun. 2013;49(95):11149–11151. | ||
Li XS, Ke MR, Zhang MF, Tang QQ, Zheng BY, Huang JD. A non-aggregated and tumour-associated macrophage-targeted photosensitiser for photodynamic therapy: a novel zinc(II) phthalocyanine containing octa-sulphonates. Chem Commun. 2015;51(22):4704–4707. | ||
Ağirtaş MS, Çelebi M, Gümüş S, Özdemir S, Okumuş V. New water soluble phenoxy phenyl diazenyl benzoic acid substituted phthalocyanine derivatives: synthesis, antioxidant activities, atypical aggregation behavior and electronic properties. Dyes Pigm. 2013;99(2):423–431. | ||
Synthesis BZ. Characterization and aggregation properties of water-soluble metal-free and metallophthalocyanines peripherally tetra-substituted with 2-[2-(dimethylamino) ethoxy] ethoxy moiety. Synth Met. 2012;162(1–2):26–34. | ||
Zhang Y, Zheng K, Chen Z, et al. Rapid killing of bacteria by a new type of photosensitizer. Appl Microbiol Biotechnol. 2017;101(11):4691–4700. | ||
Zhang X-F, Xi Q, Zhao J. Fluorescent and triplet state photoactive J-type phthalocyanine nano assemblies: controlled formation and photosensitizing properties. J Mater Chem. 2010;20(32):6726–6733. | ||
Danhier F, Feron O, Préat V. To exploit the tumor microenvironment: passive and active tumor targeting of nanocarriers for anti-cancer drug delivery. J Control Release. 2010;148(2):135–146. | ||
Castano AP, Demidova TN, Hamblin MR. Mechanisms in photodynamic therapy: part three-photosensitizer pharmacokinetics, biodistribution, tumor localization and modes of tumor destruction. Photodiagnosis Photodyn Ther. 2005;2(2):91–106. | ||
Yu Y, Gaillard S, Phillip JM, et al. Inhibition of spleen tyrosine kinase potentiates paclitaxel-induced cytotoxicity in ovarian cancer cells by stabilizing microtubules. Cancer Cell. 2015;28(1):82–96. | ||
Iversen T-G, Skotland T, Sandvig K. Endocytosis and intracellular transport of nanoparticles: present knowledge and need for future studies. Nano Today. 2011;6(2):176–185. | ||
Altintas I, Heukers R, van der Meel R, et al. Nanobody-albumin nanoparticles (NANAPs) for the delivery of a multikinase inhibitor 17864 to EGFR overexpressing tumor cells. J Control Release. 2013;165(2):110–118. | ||
Gradishar WJ. Albumin-bound paclitaxel: a next-generation taxane. Expert Opin Pharmacother. 2006;7(8):1041–1053. | ||
Kratz F. Albumin as a drug carrier: design of prodrugs, drug conjugates and nanoparticles. J Control Release. 2008;132(3):171–183. | ||
Ullah MF. Cancer multidrug resistance (MDR): a major impediment to effective chemotherapy. Asian Pac J Cancer Prev. 2008;9(1):1–6. | ||
Ma P, Mumper RJ. Paclitaxel nano-delivery systems: a comprehensive review. J Nanomed Nanotechnol. 2013;4(2):1000164. | ||
Shieh MJ, Hsu CY, Huang LY, Chen HY, Huang FH, Lai PS. Reversal of doxorubicin-resistance by multifunctional nanoparticles in MCF-7/ADR cells. J Control Release. 2011;152(3):418–425. | ||
Koziara JM, Whisman TR, Tseng MT, Mumper RJ. In-vivo efficacy of novel paclitaxel nanoparticles in paclitaxel-resistant human colorectal tumors. J Control Release. 2006;112(3):312–319. | ||
Sudha T, Bharali DJ, Yalcin M, et al. Targeted delivery of paclitaxel and doxorubicin to cancer xenografts via the nanoparticle of nano-diamino-tetrac. Int J Nanomedicine. 2017;12:1305–1315. |
Supplementary materials
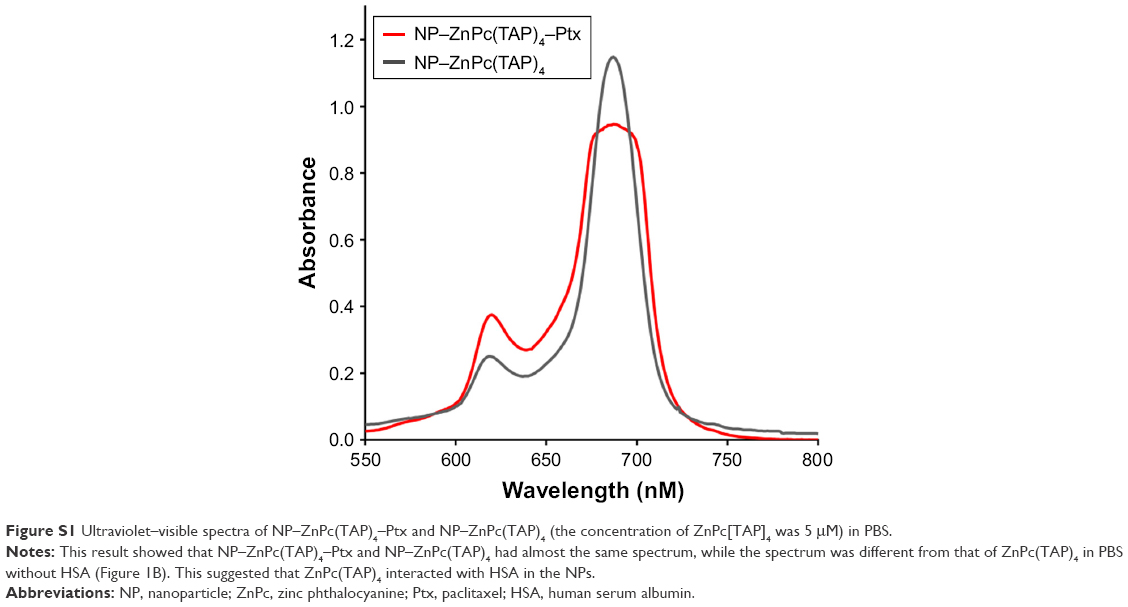 | Figure S1 Ultraviolet–visible spectra of NP–ZnPc(TAP)4–Ptx and NP–ZnPc(TAP)4 (the concentration of ZnPc[TAP]4 was 5 μM) in PBS. |
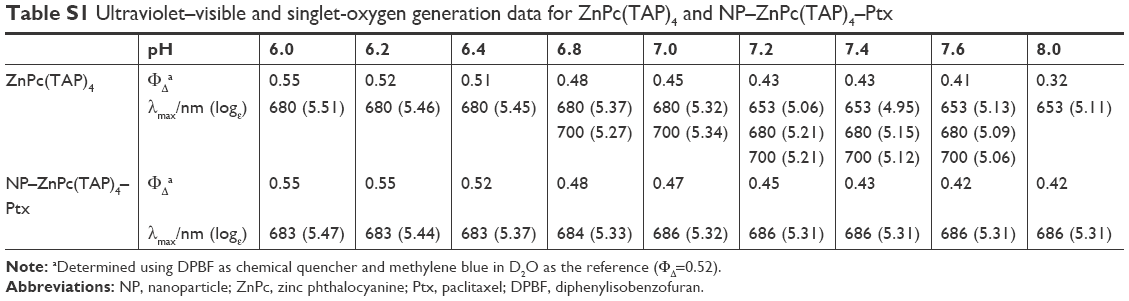 | Table S1 Ultraviolet–visible and singlet-oxygen generation data for ZnPc(TAP)4 and NP–ZnPc(TAP)4–Ptx |
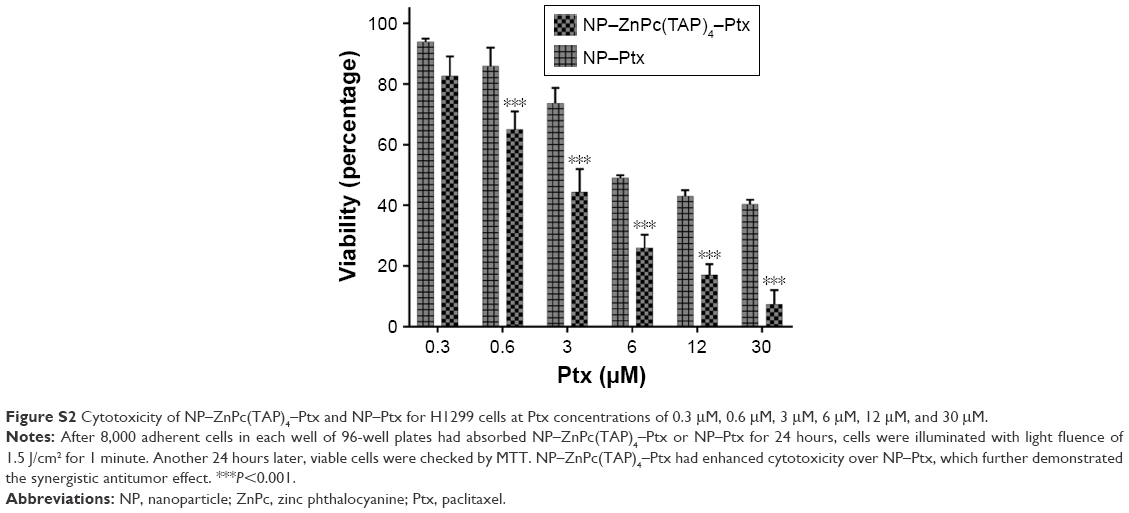 | Figure S2 Cytotoxicity of NP–ZnPc(TAP)4–Ptx and NP–Ptx for H1299 cells at Ptx concentrations of 0.3 μM, 0.6 μM, 3 μM, 6 μM, 12 μM, and 30 μM. |
 © 2018 The Author(s). This work is published and licensed by Dove Medical Press Limited. The full terms of this license are available at https://www.dovepress.com/terms.php and incorporate the Creative Commons Attribution - Non Commercial (unported, v3.0) License.
By accessing the work you hereby accept the Terms. Non-commercial uses of the work are permitted without any further permission from Dove Medical Press Limited, provided the work is properly attributed. For permission for commercial use of this work, please see paragraphs 4.2 and 5 of our Terms.
© 2018 The Author(s). This work is published and licensed by Dove Medical Press Limited. The full terms of this license are available at https://www.dovepress.com/terms.php and incorporate the Creative Commons Attribution - Non Commercial (unported, v3.0) License.
By accessing the work you hereby accept the Terms. Non-commercial uses of the work are permitted without any further permission from Dove Medical Press Limited, provided the work is properly attributed. For permission for commercial use of this work, please see paragraphs 4.2 and 5 of our Terms.