")
Back to Journals » Drug Design, Development and Therapy » Volume 14
Novel Molecular Mechanism of Aspirin and Celecoxib Targeting Mammalian Neuraminidase-1 Impedes Epidermal Growth Factor Receptor Signaling Axis and Induces Apoptosis in Pancreatic Cancer Cells
Authors Qorri B , Harless W, Szewczuk MR
Received 27 May 2020
Accepted for publication 27 August 2020
Published 8 October 2020 Volume 2020:14 Pages 4149—4167
DOI https://doi.org/10.2147/DDDT.S264122
Checked for plagiarism Yes
Review by Single anonymous peer review
Peer reviewer comments 2
Editor who approved publication: Professor Anastasios Lymperopoulos
Bessi Qorri,1 William Harless,2 Myron R Szewczuk1
1Department of Biomedical and Molecular Sciences, Queen’s University, Kingston, ON K7L 3N6, Canada; 2ENCYT Technologies Inc., Membertou, Nova Scotia, Canada
Correspondence: Myron R Szewczuk
Department of Biomedical and Molecular Sciences, Queen’s University, Kingston, ON K7L 3N6, Canada
Tel +1 613 533 2457
Fax +1 613 533 6796
; Email [email protected]
Background: Aspirin (acetylsalicylic acid) and celecoxib have been used as potential anti-cancer therapies. Aspirin exerts its therapeutic effect in both cyclooxygenase (COX)-dependent and -independent pathways to reduce tumor growth and disable tumorigenesis. Celecoxib, a selective cyclooxygenase-2 (COX-2) inhibitor, reduces factors that cause inflammation and pain. The question is whether aspirin and celecoxib have other molecular targets of equal or more therapeutic efficacy with significant anti-cancer preventive benefits.
Aim: Here, we propose that aspirin and celecoxib exert their anti-cancer effects by targeting and inhibiting mammalian neuraminidase-1 (Neu-1). Neu-1 has been reported to regulate the activation of several receptor tyrosine kinases (RTKs) and TOLL-like receptors and their downstream signaling pathways. Neu-1 in complex with matrix metalloproteinase-9 (MMP-9) and G protein-coupled receptors (GPCRs) has been reported to be tethered to RTKs at the ectodomain.
Materials and Methods: The WST-1 cell viability assay, Caspase 3/7 assay, and Annexin V assay were used to evaluate the cell viability and detect apoptotic and necrotic cells following treatment in MiaPaCa-2, PANC-1 and the gemcitabine-resistant PANC-1 variant (PANC-1 GemR) cells. Microscopic imaging, lectin cytochemistry, and flow cytometry were used to detect levels of α-2,3 sialic acid. Epidermal growth factor (EGF)-stimulated live cell sialidase assays and neuraminidase assays were used to detect Neu-1 activity. Immunocytochemistry was used to detect levels of EGFR and phosphorylated EGFR (pEGFR) following treatment.
Results: For the first time, aspirin and celecoxib were shown to significantly inhibit Neu-1 sialidase activity in a dose- and time-dependent manner following stimulation with EGF. Aspirin blocked Neu-1 desialylation of α-2,3-sialic acid expression following 30 min stimulation with EGF. Aspirin and celecoxib significantly and dose-dependently inhibited isolated neuraminidase (Clostridium perfringens) activity on fluorogenic substrate 2ʹ-(4-methylumbelliferyl)-α-D-N-acetylneuraminic acid (4-MUNANA). Aspirin inhibited phosphorylation of the EGFR in EGF-stimulated cells. Aspirin dose- and time-dependently induced CellEvent caspase-3/7+ cells as well as apoptosis and necrosis on PANC-1 cells.
Conclusion: These findings signify a novel multimodality mechanism(s) of action for aspirin and celecoxib, specifically targeting and inhibiting Neu-1 activity, regulating EGF-induced growth receptor activation and inducing apoptosis and necrosis in a dose- and time-dependent manner. Repurposing aspirin and celecoxib as anti-cancer agents may also upend other critical targets involved in multistage tumorigenesis regulated by mammalian neuraminidase-1.
Significance: These findings may be the missing link connecting the anti-cancer efficacy of NSAIDs to the role of glycosylation in inflammation and tumorigenesis.
Keywords: neuraminidase-1, inflammation, cancer, multistage tumorigenesis, tumor microenvironment
Introduction
Pancreatic cancer is a highly inflammatory, aggressive, and lethal malignancy, with incidence expected to rise.1 Cancer-associated inflammation contributes to the desmoplastic reaction that results in fibrous tissue infiltrating and enveloping pancreatic neoplasms.2 As a result, the dense stroma prevents even the smallest therapeutic molecules from reaching the tumor target site. Inflammation also contributes to the hallmarks of cancer by supplying pro-inflammatory molecules, including growth factors for proliferative receptor signaling, extracellular matrix (ECM)-modifying enzymes for angiogenesis, invasion, metastasis, and signals that lead to the induction of epithelial-to-mesenchymal transition (EMT).3 Increasing efforts have focused on inhibiting tumor-promoting inflammation using non-steroidal anti-inflammatory drugs (NSAIDs) as anti-cancer agents.
NSAIDs targeting cyclooxygenase (COX) enzymes can exert a chemotherapy-sensitizing role.4 The COX enzymes catalyze the rate-limiting step of prostaglandin (PG) synthesis, converting arachidonic acid to prostaglandin E2 (PGE2).5 Elevated PG levels have been reported in breast, colon, lung, and pancreatic cancer, involved in cell proliferation, adhesion, metastasis, apoptosis, and immune surveillance.6,7 Of the two COX enzymes, COX-1 is constitutively expressed in most tissues, while COX-2 is induced by pro-inflammatory mediators and mitogenic stimuli, increasing PG synthesis in inflamed and neoplastic tissues.8 Activation of nuclear factor kappa-light-chain-enhancer of activated B-cells (NF-κB) promotes angiogenic factors and induces COX-2 expression, thus playing a role in malignant cell proliferation, oncogenesis, and apoptotic resistance.6,9 COX-2 overexpression in malignant cells has also been linked to reduced levels of E-cadherin that is required for cellular adhesion, implicating inflammation in the process of EMT development.10
Acetylsalicylic acid (aspirin; ASA) is a traditional NSAID that inhibits both COX isoforms as well as acts through a COX-independent pathway to inhibit extracellular-signaling-regulated kinase (ERK) activity that is part of the mitogen-activated protein kinase (MAPK) subfamily implicated in cell proliferation, differentiation, and survival.4,6 Conversely, celecoxib is a COX-2 specific inhibitor that has demonstrated promising results in the prevention of cancer in addition to its anti-inflammatory effects.11 Both aspirin12,13 and celecoxib14–16 have demonstrated apoptotic effects as well as the potential to augment chemotherapy. Notwithstanding other promising results, the specific mechanism(s) of aspirin and celecoxib on receptor signaling remains unknown.
Therapeutic options for cancer are now incorporating the tumor microenvironment (TME) and its complex interactions with the tumor. The TME is highly dynamic, and it can shape a tumor’s response to therapy with subsequent development of tumor-targeted resistance.17 Although chemotherapy, targeted therapy, or irradiation are mainstays in cancer treatment, these treatment options can induce the TME to facilitate and promote the growth of residual surviving cancer cells.18–20 Chemotherapy can also induce apoptotic tumor cell-induced macrophage chemotaxis and pro-inflammatory cytokines that have been reported to promote tumorigenesis, angiogenesis, and metastasis.21,22 Also, chemotherapy can create a premetastatic environment by inducing secreted pro-tumorigenic factors, such as inflammatory cytokines, chemokines, proangiogenic growth factors, and danger signals such as alarmins. Paclitaxel, for example, can increase the recruitment of bone marrow-derived cells (BMDCs) to accelerate metastasis by inducing matrix metalloproteinase-9 (MMP-9) expression and EMT.23 Interestingly, paclitaxel can induce breast cancer metastasis by activating TME cellular pro-inflammatory cytokines in a TOLL-like receptor-4-dependent manner.24,25 These dynamic interactions between tumor cells and the TME can either dampen or enhance immunotherapy responses that rely on their complex interactions.26,27
Tumor progression and metastasis are also regulated by the aberrant glycosylation status of the tumor cells, such that under or overexpression of aberrant glycans on malignant cells can influence tumorigenic potential.28 Munkley and Elliot have reported on how aberrant glycosylation in tumor progression and metastasis is a hallmark of cancer.29 For example, glycans on tumor cells are critical regulators of inflammation and the immune response in the TME.30 The activation of NF-κB and pro-inflammatory COX-2 is influenced by the glycosylated state of cancer cells, as well as the efficacy of some COX-2 inhibitors.29 The most prevalent modification of cancer glycosylation status involves increased sialylation of the glycans, altered branched glycan structures, and altered core fucosylation. Overexpression of branched-N-glycan structures can interfere with epithelial cadherin-mediated cell-cell adhesion and subsequently facilitate migration and invasion. Altered glycosylation status of growth factor receptors also affects cancer cell signal transduction pathways in modulating cell growth and proliferation.30
Our group has previously described a novel signaling paradigm that is implicated in multistage tumorigenesis.31 We have shown that mammalian neuraminidase-1 (Neu-1) exists in a trimeric complex with MMP-9 and G protein-coupled receptors (GPCRs), playing critical roles in ligand-induced activation of several receptor tyrosine kinases (RTKs), including the epidermal growth factor receptor (EGFR),32 insulin receptor (IR),33 and the nerve growth factor (NGF) TrkA receptor,34 and TOLL-like receptors (TLRs),35,36 all of which are upregulated and implicated in cancer. Here, ligand binding to its receptor induces a conformational change of the receptor that results in MMP-9 activation via Gαi subunit signaling to remove elastin binding protein (EBP), which exists in a complex with Neu-1 and protective protein cathepsin A (PPCA) to activate Neu-1 (Figure 1). Once activated, Neu-1 hydrolyzes terminal α-2,3-sialyl residues on the receptor, removing steric hindrance and allowing for receptor dimerization and signaling.32
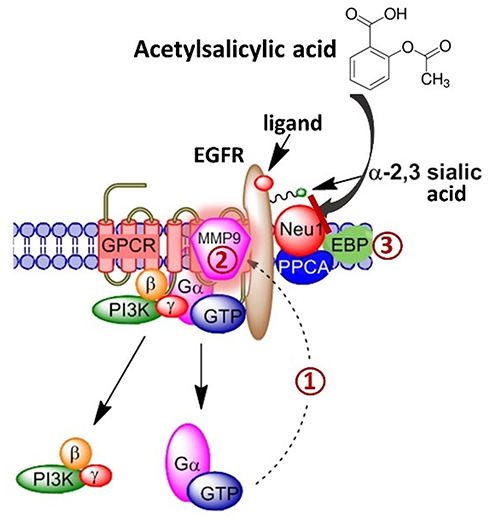 |
Figure 1 Acetylsalicylic acid targets the Neu-1-MMP-9-GPCR signaling platform-inhibiting ligand-induced receptor tyrosine kinase activation. When the ligand binds to its receptor tyrosine kinase (RTK), there is a conformational change in the associated G protein-coupled receptor (GPCR). (1) Gαi subunit signaling activates matrix metalloprotease-9 (MMP-9). (2) Via its elastin-degrading properties, MMP-9 removes elastin binding protein (EBP) from a tripartite complex consisting of neuraminidase-1 (Neu-1) and protective protein cathepsin A (PPCA) to activate Neu-1. (3) Activated Neu-1 cleaves terminal α-2,3 sialic acid residues on the ectodomain of RTKs to relieve steric hindrance, and allow for receptor dimerization, phosphorylation and downstream signal activation. Acetylsalicylic acid targets Neu-1 in complex with the MMP-9-GPCR, inhibiting ligand-induced receptor tyrosine kinase activation. |
We propose that interfering with the tripartite complex of Neu-1, MMP-9, and GPCRs that regulate RTK signaling via NSAIDs may be the missing link that connects the anti-cancer efficacy of NSAIDs to the role of glycosylation in inflammation and tumorigenesis. For the first time, this report shows the efficacy of NSAIDs aspirin and celecoxib on Neu-1 activity as it relates to cancer cell receptor signaling and survival, highlighting the importance of NSAIDs in the treatment of otherwise lethal malignancies.
Materials and Methods
Cell Lines
PANC-1 (human pancreatic carcinoma, epithelial-like, ATCC CRL-1469) and MiaPaCa-2 (human pancreatic carcinoma, epithelial-like, ATCC CRL-1420) cell lines were obtained from the American Type Culture Collection (ATCC; Manassas, VA, USA). PANC-1 cells are a human pancreatic ductal epithelial carcinoma cell line overexpressing EGFR on the cell surface. MiaPaCa-2 cells are a human pancreatic cancer cell line with attached epithelial and floating rounded cells expressing the 17 β-estradiol (E2)-binding estrogen receptor. The cells were grown in a 5% CO2 incubator at 37°C in culture media containing Dulbecco’s Modified Eagle’s Medium (DMEM) (Gibco, Rockville, MD, USA) supplemented with 10% fetal calf serum (FCS; HyClone, Logan, UT, USA) and 5 μg/mL Plasmocin (InvivoGen, San Diego, CA, USA). When the cells reached ~80% confluence, they were passaged at least five times before use in the experiments.
Established PANC-1 cell line resistant to gemcitabine was generated by exposing PANC-1 cells to increasing concentrations of the drug in 1× DMEM (10% FCS and 5 μg/mL Plasmocin) as previously reported by us.37 Dead cells were removed, and the viable cells were maintained in culture at the highest concentration of 0.01 μM gemcitabine. Once the surviving cells reached ~80% confluence, they were passaged in the same concentration of the chemotherapeutic agent for over a year. Stable PANC-1 cells resistant to 0.01 μM gemcitabine (PANC1-GemR) were used for in vitro experiments.
Reagents
Acetylsalicylic acid (>99% pure, Sigma-Aldrich, Steinheim, Germany) was dissolved in dimethyl sulfoxide (DMSO) to prepare a 5000 mM stock solution and stored in aliquots at −20°C. The highest used concentration of aspirin contains less than 0.5% v/v of DMSO in 1× PBS at a pH of 7. Celecoxib (Marcan Pharmaceuticals Inc., Ottawa, ON, Canada) was dissolved in DMSO to prepare a stock solution of 52.44 mM and stored in aliquots at −20°C.
Gemcitabine hydrochloride (Sigma-Aldrich Canada Ltd) was dissolved in PBS to create a 133.5 mM gemcitabine stock, as previously reported.37 This stock was serially diluted to produce 0.01 μM gemcitabine in 1× DMEM containing 10% fetal calf serum and 5 μg/mL Plasmocin solution that was added to tissue culture flasks upon each change of the medium.
WST-1 Cell Proliferation Assay
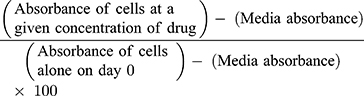
The water-soluble tetrazolium salt-1 (WST-1) assay (2-(4-Iodophenyl)-3-(4-nitrophenyl)-5-(2,4-disulfophenyl)-2H-tetrazolium) reduces tetrazolium compound to formazan (orange), where absorbance recorded at 450 nm is directly correlated to the number of metabolically active cells.38 PANC-1, PANC-1-GemR and MiaPaCa-2 cells at a density of 10,000 cells/well in 96-well plates were incubated at 37°C and allowed to adhere overnight according to previous reports.37 Adhered cells were treated with increasing concentrations of aspirin (0.1 to 12.8 mM) or celecoxib (0.1 to 0.8 mM) or left untreated as controls. After 24, 48, and 72 hours, media was removed, and 10% WST-1 reagent (Roche Diagnostics Division de Hoffman La Roche Limited, Laval-des-Rapides, QC, Canada) diluted in cell culture media was added to each well. The plate containing cells is incubated at 37°C for 2 hours before taking the absorbance reading at 450 nm using the SpectraMax250 and analyzed with SoftMax software. Cell viability is presented as a percentage of untreated control using GraphPad Prism software (GraphPad Software, La Jolla, CA, USA). The data are the mean ± standard error of the mean (SEM) from three or more separate experiments in triplicates.
Cell viability is calculated as a percentage of control for each time point and treatment, where day 0 is when the cells are plated as previously reported:37
Live Cell Sialidase Assay
PANC-1 and MiaPaCa-2 cells at a density of 100,000 cells/well on 12 mm circular glass slides in sterile 24-well plates were incubated at 37°C and allowed to adhere overnight as previously reported.34,36 Cells were starved for 2 hours in 1×DMEM to reach baseline sialidase activity. 2 µL of 0.318 mM 2ʹ-(4-methylumbelliferyl)-α-D-N-acetylneuraminic acid sodium salt hydrate (4-MUNANA; ≥95% pure, M8639, Sigma-Aldrich) substrate in Tris-buffered saline (TBS, pH 7.4) was added to a coverslip alone as a control, with 2 µL of 30 ng/mL epidermal growth factor (EGF; CL-105-04, Cedarlane), or with 2 µL of EGF and 2 µL of aspirin or celecoxib at the indicated concentrations. 4-MUNANA is hydrolyzed by sialidase activity on the cell surface, releasing 4-methylumbelliferone (4-MU), which has a fluorescence emission at 450 nm (blue color) following excitation at 365 nm. Fluorescent images were taken at 200× after 1–2 minutes of treatment using the Zeiss M2 Imager epi-fluorescent microscope. The mean fluorescence of 50 multi-point replicates surrounding the cells was quantified using the ImageJ software.
Cell Suspension Sialidase Assay Using Spectrophotometer
PANC-1 and MiaPaCa-2 cells at a density of 30,000 cells/well were suspended in sterile 1× phosphate-buffered saline (PBS) in black 96-well plates. 0.318 mM 4-MUNANA was added alone as a control, or with 30 ng/mL EGF, or with 30 ng/mL EGF and aspirin or celecoxib at the indicated concentrations. Fluorescence intensity readings were taken immediately using the Varioskan Fluorescence Spectrophotometer (Type 3001, Microplate Instrumentation, Thermo Electron Corporation, Vantaa, Finland) at an emission of 450 nm following excitation at 365 nm.36
Pure Neuraminidase Activity Assay Using Spectrophotometer
Pure neuraminidase (from Clostridium perfringens; specific activity of 1 Unit/1.0 mmol of N-acetylneuraminic acid/min; ≥95%; N2876, Sigma-Aldrich) specifically targets and hydrolyzes α-2,3-, α-2,6-, and α-2,8-sialic acids. The purified enzyme was used at an enzyme concentration of 0.05 U/mL in 1×PBS. 0.318 mM 4-MUNANA (≥95% pure, M8639, Sigma-Aldrich) substrate was added alone as a control or with aspirin or celecoxib at the indicated concentrations. Fluorescence intensity readings were taken immediately using the Varioskan Fluorescence Spectrophotometer (Type 3001, Microplate Instrumentation, Thermo Electron Corporation, Vantaa, Finland) at an emission of 450 nm following excitation at 365 nm as previously reported.36
Lectin Cytochemistry
PANC-1 cells at a density of 100,000 cells/well on 12 mm glass coverslips in 24-well plates were incubated at 37°C and allowed to adhere overnight according to previous reports.37 Adhered cells were starved in 4% FBS in 1×DMEM for 18 hours. Cells were inhibited with anti-Neu1 antibody (sc-32,936, Santa Cruz), or 3.2 mM, 4.8 mM, or 6.4 mM aspirin for 1 hour, or left not inhibited as a control. Cells were stimulated with 1µg/mL EGF (CL-105-04, Cedarlane) for 5, 10, 15, or 30 minutes, or left unstimulated as a control. At each time point, cells were washed and fixed with 4% paraformaldehyde (PFA) for 30 minutes, followed by blocking for 1 hour in 10% FBS + 1×PBS. Following blocking, cells were washed with 1× PBS 3× for 10 minutes, followed by the addition of 10 µg/mL biotinylated Maackia amurensis lectin II, (MAL II; VECTB1265, MJS BioLynx Inc., P.O. Box 1150, Brockville, ON K6V 5W1, Canada), overnight at 4°C. Cells were washed 5× for 10 minutes with 1× PBS and incubated for 1 hour with Dylight 594 Streptavidin (VECTSA5594, MJS BioLynx Inc., P.O. Box 1150, 300 Laurier Blvd., Brockville, ON K6V 5W1, Canada). Cells were then washed 5× for 10 minutes, followed by one wash with 0.1% Triton X-100 to permeabilize cells for 4′,6-diamidino-2-phenylindole (DAPI) staining to visualize the nuclei. Coverslips with attached cells were inverted on a droplet of mounting media containing DAPI (VECTH1200, MJS BioLynx Inc., P.O. Box 1150, 300 Laurier Blvd., Brockville, ON K6V 5W1, Canada) and sealed. The stained cells were visualized by epifluorescence microscopy at 200×.
Flow Cytometry
PANC-1 cells at a density of 1.0×10⁶ cells/mL in 6-well plates were incubated at 37°C overnight, as previously reported by us.39 Adhered cells were starved in 1% FBS in 1×DMEM for 18 hours, according to our previous report.37 Cells were inhibited with anti-Neu1 antibody (sc-32,936, Santa Cruz), or 3.2 mM, 4.8 mM, or 6.4 mM aspirin for 1 hour, or left not inhibited as a control. Cells were stimulated with 1µg/mL EGF (CL-105-04, Cedarlane) for 30 minutes, or left unstimulated as a control. Cells were lifted, and all subsequent steps were done on ice. Cells were washed 2× in 2% FBS + 1× PBS. The cells were treated with 100μL of biotinylated MAL II (VECTB1265, MJS BioLynx Inc., P.O. Box 1150, Brockville, ON K6V 5W1, Canada) at a final concentration of 5 µg/mL and incubated for 60 minutes. The cells were then washed 2× with 2% FBS + 1× PBS followed by incubation for 60 minutes with 100μL of Dylight 488 Streptavidin (VECTSA5488, MJS BioLynx Inc., P.O. Box 1150, Brockville, ON K6V 5W1, Canada) at a final concentration of 5 µg/mL. The cells were then washed 2× with 2% FBS + 1× PBS and fixed in 1 mL of 4% PFA before flow cytometry analysis.
Immunocytochemistry
PANC-1 and MiaPaCa-2 cells at a density of 200,000 cells/well on 12 mm glass coverslips in 24-well plates were incubated at 37°C and allowed to adhere overnight according to previous reports.37 Adhered cells were starved in 1% FBS in 1×DMEM for 18 hours. Cells were inhibited with 3.2 mM, 4.8 mM, or 6.4 mM aspirin for 1 hour, or left not inhibited as a control. Cells were stimulated with 100 ng/mL EGF (CL-100-26, Cedarlane) for 30 minutes, or left unstimulated as a control. Cells were washed and fixed with 4% paraformaldehyde (PFA) for 30 minutes, followed by permeabilization with 0.1% TritonX in PBS (PBST) for 10 minutes. Cells were blocked with 4% BSA in PBST for 1 hour at room temperature. Following blocking, cells were washed with 1× PBS 3× for 10 minutes, followed by the addition of mouse monoclonal anti-EGFR (A-10) (sc-373,746) and rabbit polyclonal anti-pEGFR (Tyr 1173) (sc-12,351-R) diluted in 4% BSA in PBST in a 1:100 ratio overnight at 4°C. Mouse serum and rabbit serum were used and diluted in the same ratio as primary antibodies for isotype controls. Cells were washed 3× for 5 minutes with 1× PBS and incubated for 1 hour with Goat anti-rabbit AlexaFluor Plus 594 (A32740, Invitrogen) and Goat anti-mouse AlexaFluor 488 (A10667, Life Technologies). Cells were then washed 3× for 10 minutes. Coverslips with attached cells were inverted on a droplet of mounting media containing 4′,6-diamidino-2-phenylindole (DAPI; VECTH1200, MJS BioLynx Inc., P.O. Box 1150, 300 Laurier Blvd., Brockville, ON K6V 5W1, Canada) to visualize the nuclei and sealed. The stained cells were visualized by epifluorescence microscopy at 200×.
Apoptosis Using the CellEvent Caspase 3/7 Green Detection Reagent Assay
PANC-1 cells at a density of 10,000 cells/well were allowed to adhere to 96-well plates. Caspase 3/7 enzyme analysis was done using the CellEvent Caspase 3/7 Green Detection Reagent ThermoFisher Scientific, according to our previous report.39 The reagent was diluted to the manufacturer-recommended concentration of 5 μM in cell culture media from the stock solution of 2 mM. Phase contrast and green fluorescent images were acquired using the Incucyte Zoom Imager every 2 hours at 100× for 72 hours. Images were analyzed using Incucyte analysis software to count the number of cells expressing green, representing Caspase 3/7 expression.
Annexin V-FITC Apoptosis and Propidium Iodide Assay Using Flow Cytometry
PANC-1 cells at a density of 100,000 cells/mL in 6-well plates were allowed to adhere overnight. Cells were treated with 3.2 mM, 4.8 mM, or 6.4 mM aspirin or left untreated for 24 hours. The cells were then trypsinized with TrypLE express solution and analyzed for apoptotic, necrotic, and viable cell populations using the Annexin V-FITC Apoptosis Kit (BioVision K101-25) according to our previous report.39 Cells were resuspended in 500 μL of 1× Annexin-binding buffer (50 mM HEPES, 700 mM NaCl, 12.5 mM CaCl2, pH 7.4) (Catalog no. V13246, Thermo Fisher Scientific, Mississauga, ON L5N 5V4, Canada) for flow cytometry followed by 5 μL of each of Annexin V-FITC and propidium iodide. The cells were kept at room temperature for 5 minutes in the dark before being quantified by flow cytometry analysis.
Statistical Analysis
Data are presented as the mean ± the standard error of the mean (SEM) from at least three repeats of each experiment performed in triplicate as previously reported by us.39 Comparisons between two groups from three independent experiments were made by one-way analysis of variance (ANOVA) at 95% confidence using the uncorrected Fisher’s LSD multiple comparisons test with 95% confidence with asterisks denoting statistical significance.
Results
Aspirin and Celecoxib Inhibit Cell Viability of Pancreatic Cancer MiaPaCa-2, PANC-1 Cells and Its Gemcitabine-Resistant PANC-1-GemR Variant
The WST-1 proliferation assay was used to test the in vitro effects of aspirin and celecoxib on PANC-1 and MiaPaCa-2 pancreatic cancer cell viability. PANC-1 and MiaPaCa-2 cells treated with increasing concentrations of aspirin (0.1 mM to 12.8 mM) demonstrated a concentration- and time-dependent decrease in cell viability (Figure 2A and E). Aspirin treatment was most effective between 3.2 mM and 12.8 mM (p ≤ 0.0001), consistent with previous studies.40 Importantly, these concentrations of aspirin have been shown not to have a significant effect on the viability of non-malignant human primary mesenchymal stem cells, or immortalized human pancreatic ductal CRL-4023 cells.40 Aspirin’s therapeutic effect depends on cyclooxygenase (COX)-dependent and -independent pathways to reduce tumor growth and disable tumor development. Since many pancreatic cancer cells lack COX-1 expression,41 the data depicted in Figure 2A and E suggest that aspirin’s therapeutic effects are independent of COX-1 pathways.
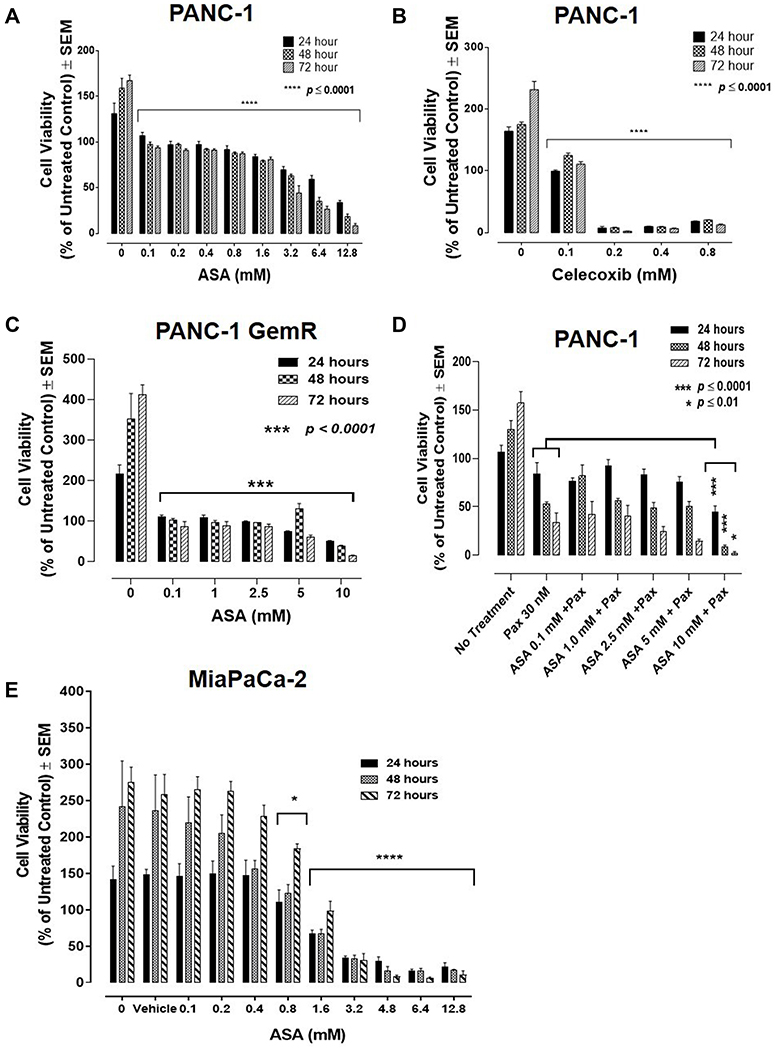 |
Figure 2 Cell viability of (A) PANC-1 cells and acetylsalicylic acid (ASA), (B) PANC-1 cells and celecoxib, (C) gemcitabine-resistant variant PANC-1-GemR and ASA, (D) PANC-1 and ASA in combination with paclitaxel (Pax), and (E) MiaPaca-2 and ASA following treatments dose-dependently using the WST-1 cell proliferation assay. Cells were plated at a density of 10,000 cells/mL per well in triplicates. The indicated drug concentrations were diluted in 1× DMEM supplemented with 10% FBS, and the cells were exposed to the respective treatments for 24, 48, and 72 hours, respectively. At the end of each timepoint, the WST-1 reagent was added to each well, and the cells were incubated for 2 hours, after which the plates were read on a colorimetric plate reader. The data presented are cell viability as a percent of the untreated control ± SEM of three or more independent experiments performed in triplicates. Cell viability is compared to the untreated control at day 0 to account for cell proliferation. Significance is reported for each concentration in comparison to the untreated control at the respective timepoint by one-way ANOVA using the uncorrected Fisher’s LSD multiple comparisons test with 95% confidence with indicated asterisks for statistical significance, *p ≤ 0.01, ***p ≤ 0.0001, ****p ≤ 0.0001, n = 3. |
Conversely, celecoxib pretreatment did not follow a concentration-dependent pattern (Figure 2B). PANC-1 cells pretreatment with 0.2 to 0.8 mM celecoxib at the three timepoints demonstrated an almost complete loss of cell viability (p ≤ 0.0001). However, increasing concentrations of celecoxib in the media greater than 0.8 mM revealed it to precipitate out of solution as depicted in the phase-contrast images (Supplementary Figure S1)). In contrast, aspirin did not have a similar effect at a high dose of 12.8 mM (Supplementary Figure S2).
It is noteworthy that resistance to gemcitabine can involve multiple mechanisms, such as altered apoptotic regulating genes and altered expressions or sensitivities of enzyme targets. COX-2 may be necessary for pancreatic carcinogenesis, where 47–66% of human pancreatic tumors overexpress COX-2 relative to normal pancreatic tissue.42,43 Many pancreatic cancer cells have no COX-1 expression with some also lacking COX-2.41 Rathos et al reported that COX-2 levels in cancer cells are elevated after treatment with 70 nM gemcitabine for 24 hours using RT-PCR and Western blot analyses.44 Importantly, aspirin was reported to sensitize cancer cells resistant to gemcitabine, thereby enhancing the therapeutic drug efficacy.40 Here, we questioned whether gemcitabine-resistant PANC-1 (PANC-1-GemR) cells would be susceptible to aspirin treatment. The data in Figure 2C demonstrate that PANC-1-GemR cells treated with increasing concentrations of aspirin (0.1 to 10 mM) revealed a significant concentration- and time-dependent decrease in cell viability.
Selective COX inhibitors such as NS-398 (a selective COX-2 inhibitor) and SC-560 (a selective COX-1 inhibitor) were shown to significantly enhance the cytotoxic effects of paclitaxel in taxane-resistant ovarian cancer cells via a prostaglandin-independent mechanism.45 Other reports have demonstrated that paclitaxel can reduce the ability of aspirin to inhibit platelet aggregation.46 To this end, we investigated if aspirin dose-dependently in combination with 30 nM paclitaxel affected the cell viability of PANC-1 cells. The data depicted in Figure 2D demonstrate that paclitaxel in combination with a high dose of aspirin (10 mM) significantly reduced the cell viability compared with the paclitaxel treated group.
It is noteworthy that the lowest dose of ASA for a significant inhibitory effect on cell viability is 0.1 mM ASA for PANC-1 and PANC-1-GemR cells compared to 0.8 mM ASA for MiaPaCa-2 cells.
Aspirin and Celecoxib Inhibit Epidermal Growth Factor (EGF)-Induced Sialidase Activity in Live PANC-1 and MiaPaCa-2 Cells
Epidermal growth factor (EGF)-induced EGFR tyrosine kinase receptor activation in cancer cell survival responses has become a strategic molecular-targeting with clinical therapeutic intent, but the failures of these targeted approaches in the clinical setting demand alternate strategies. We have reported a novel neuraminidase-1 (Neu-1) and matrix metalloproteinase-9 (MMP-9) cross-talk in alliance with GPCR neuromedin B, which is essential for EGF-induced receptor activation and cellular signaling.32 Neu-1 and MMP-9 form a complex with EGFR on the cell surface of NIH3T3–hEGFR cell line, which is a mouse fibroblast cell line that overly expresses human EGFRs.
To evaluate the effects of aspirin and celecoxib on mammalian Neu-1 activity, sialidase assays were performed on EGF-stimulated live PANC-1 and MiaPaCa-2 cells, as previously reported by us.32 These assays rely on the fluorogenic neuraminidase substrate 2ʹ-(4-methylumbelliferyl)-α-D-N-acetylneuraminic acid (4-MUNANA), which is cleaved by activated Neu-1 to release 4-methylumbelliferyl (4-MU) surrounding the live cells, which has a fluorescence at 450 nm (blue color) following excitation at 365 nm.47 PANC-1 and MiaPaCa-2 cells were pre-treated with aspirin or celecoxib and then stimulated with EGF in the presence of 4-MUNANA substrate to induce Neu-1 activity. Fluorescent images taken with an epi-fluorescent microscope demonstrate a significant reduction of sialidase activity (blue fluorescence) following pretreatment with aspirin (Figure 3A, B and D), and celecoxib (Figure 4A) dose-dependently. Densitometry analysis was used to quantify the mean fluorescence of over 50 points surrounding the cells from each image using ImageJ (Figure 3B and Figure 4B).
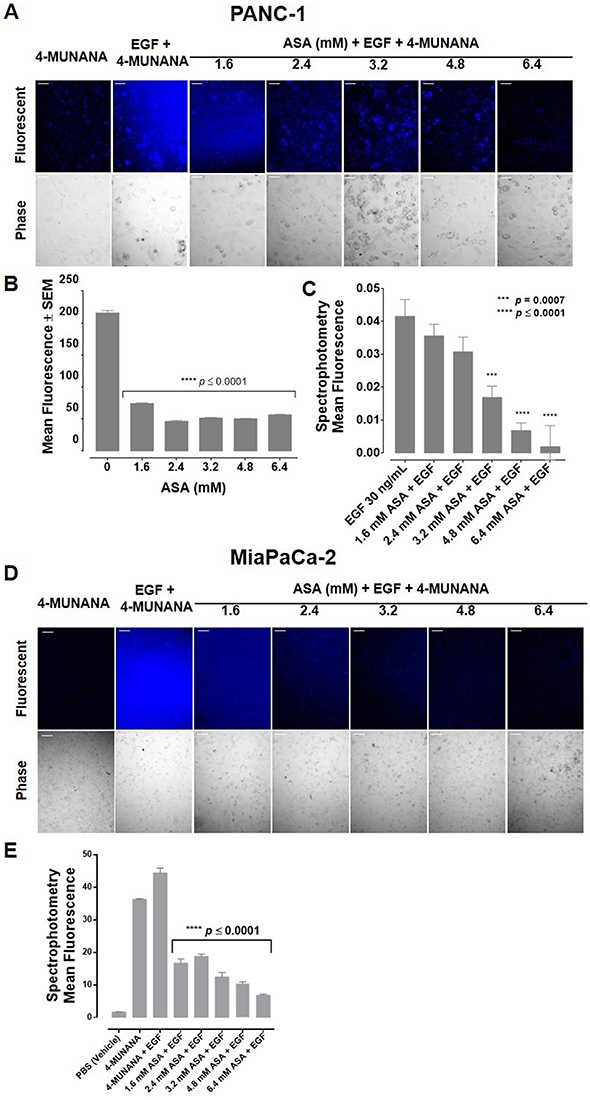 |
Figure 3 Acetylsalicylic acid (ASA) inhibits sialidase activity in live epidermal growth factor (EGF)-stimulated pancreatic cancer PANC-1 and MiaPaCa-2 cells using fluorescent microscopy and quantitative spectrophotometry analyses. Live cell sialidase assays were performed to detect the effect of aspirin pre-treatment on sialidase activity. Live cells were pre-treated with increasing concentrations of ASA (1.6 mM– 6.4 mM), followed with 30 ng/mL of EGF to initiate sialidase activity. 0.318 mM of 2ʹ-(4-methylumbbelliferyl) α-d-N-acetylneuraminic acid (4-MUNANA) substrate was added to quantify neuraminidase-1 activity. (A) PANC-1 live cell sialidase activity. Blue fluorescence is a direct measure of Neu-1 activity. (B) Densitometry analysis of fluorescent images in A using ImageJ software and presented as a bar graph. 50 points were taken surrounding cells for each image. Graphs represent 50-point analysis of two or more images. (C) Quantitative spectrophotometry analysis of the effect of ASA pre-treatment on sialidase activity in EGF-stimulated live PANC-1 pancreatic cancer cells. (D) MiaPaCa-2 fluorescent and phase images were taken within 2 minutes using an epi-fluorescent microscope (200×). Scale bar represents 50 μm. (E) Quantitative spectrophotometry analysis of the effect of aspirin pre-treatment on sialidase activity in EGF-stimulated live MiaPaCa-2 pancreatic cancer cells. Significance is represented in comparison to the EGF-stimulated cells as a control. Error bars represent ± SEM from three separate experiments performed in triplicates (n=3). Significance is represented in comparison to the EGF-stimulated cells as a control by one-way ANOVA using the uncorrected Fisher’s LSD multiple comparisons test with 95% confidence with indicated asterisks for statistical significance, ***p = 0.0007, ****p ≤ 0.0001, n = 3. |
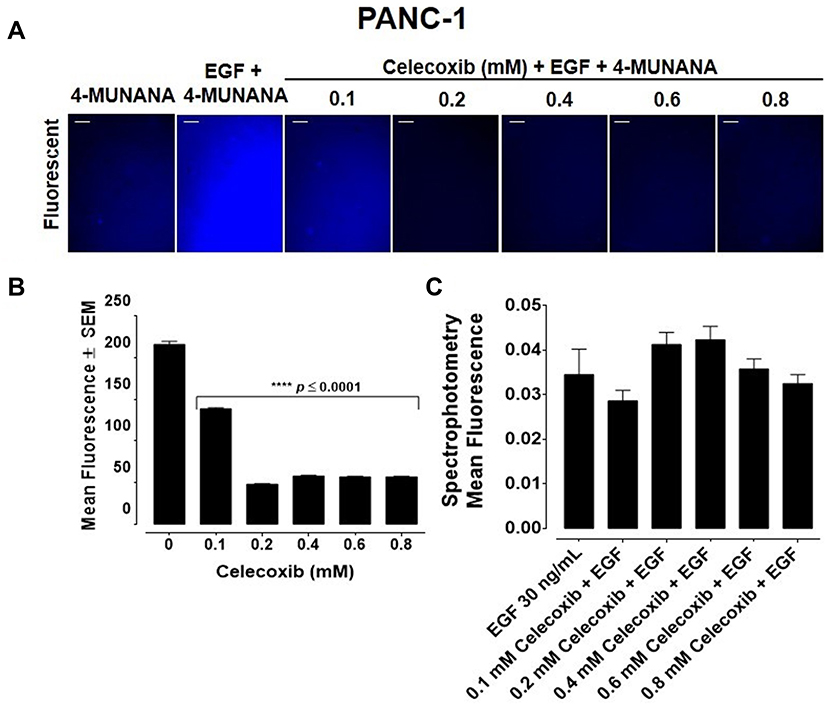 |
Figure 4 Celecoxib inhibits sialidase activity in live epidermal growth factor (EGF)-stimulated pancreatic PANC-1 cancer cells using fluorescent microscopy but not with quantitative spectrophotometry analyses. Live cell sialidase assays were performed to detect the effect of celecoxib pre-treatment on sialidase activity. Live PANC-1 cells were pre-treated with increasing concentrations of celecoxib (0.1–0.8 mM) followed by stimulation with 30 ng/mL of EGF to initiate sialidase activity. 0.318 mM of 2ʹ-(4-methylumbbelliferyl) α-d-N-acetylneuraminic acid (4-MUNANA) substrate was added to quantify Neu-1 activity. (A) Fluorescent and phase images were taken within 2 minutes of celecoxib exposure using an epi-fluorescent microscope (200×). Scale bar represents 50 μm. Blue fluorescence is a direct measure of Neu-1 activity. (B) Densitometry analysis of fluorescent images using ImageJ software and presented as a bar graph. 50 points were taken surrounding cells for each image. Graphs represent a 50-point analysis of two or more images. Significance is represented in comparison to the EGF-stimulated cells as a control (C) Quantitative spectrophotometry analysis of the effect of celecoxib pre-treatment on sialidase activity in EGF-stimulated live PANC-1 pancreatic cancer cells. Error bars represent ± SEM from three separate experiments performed in triplicates (n=3). Significance is represented in comparison to the EGF-stimulated cells as a control by one-way ANOVA using the uncorrected Fisher’s LSD multiple comparisons test with 95% confidence with indicated asterisks for statistical significance, ****p ≤ 0.0001, n = 3. |
To confirm the results from the epi-fluorescent microscopy, we used a quantitative spectrophotometry analysis of the effects of aspirin and celecoxib pretreatment on sialidase activity in EGF stimulated live PANC-1 and MiaPaCa-2 cells. The data revealed a concentration-dependent reduction of Neu-1 cleavage of its substrate following aspirin pretreatment (p < 0.0001) for PANC-1 (Figure 3C) and MiaPaCa-2 (Figure 3E). In contrast, spectrophotometry analysis surprisingly revealed no significant differences in sialidase activity following celecoxib pretreatment at the indicated dosages (Figure 4C); it is perhaps due to the chemical structure of celecoxib interfering with absorbance readings or is ineffective with live cells in solution.
To test the specificity of aspirin and celecoxib targeting the sialidase activity, we investigated their inhibitory effects using pure neuraminidase from Clostridium perfringens with a specific activity of 1 unit per 1.0 mmole of N-acetylneuraminic acid per minute. Neuraminidase pretreatment with aspirin or celecoxib at the indicated concentrations was followed by the addition of the 4-MUNANA substrate and immediately analyzed for fluorescence intensity. Consistent with the live cell sialidase assays, aspirin (Figure 5A) pretreatment resulted in a significant concentration-dependent reduction of neuraminidase activity. It is noteworthy that celecoxib pretreatment of neuraminidase significantly reduced the neuraminidase activity but did not demonstrate a concentration-dependency (Figure 5B).
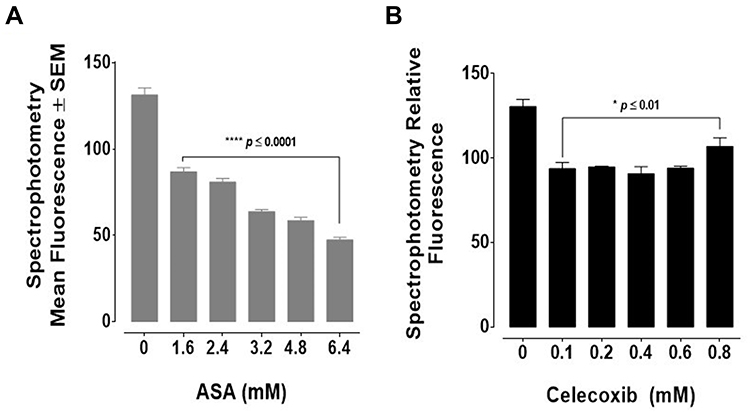 |
Figure 5 Acetylsalicylic acid (ASA) and celecoxib inhibit Clostridium perfringens neuraminidase activity. Sialidase assays were performed using isolated neuraminidase (Clostridium perfringens; with a specific activity of 1 unit (U) per 1.0 mmole of N-acetylneuraminic acid per minute). Reconstituted neuraminidase in reaction buffer was exposed to 0.318 mM of its fluorogenic substrate 2ʹ-(4-Methylumbelliferyl)-α-D-N-acetylneuraminic acid (4-MUNANA) alone or in combination with increasing concentrations of (A) ASA or (B) celecoxib. Enzyme activity was analyzed with a spectrophotometer to quantify relative fluorescence at 450 nm. Relative fluorescence is presented as a bar graph. Error bars represent ± SEM from three separate experiments performed in triplicates (n=3). Significance is represented in comparison to the EGF-stimulated cells as a control by one-way ANOVA using the uncorrected Fisher’s LSD multiple comparisons test with 95% confidence with indicated asterisks for statistical significance, *p ≤ 0.01, ****p ≤ 0.0001, n = 3. |
Aspirin Inhibits Neu-1 Cleavage of α-2,3 Sialic Acid in PANC-1 Cells
We have previously reported that Neu-1 hydrolyzes terminal α-2,3 sialic acid residues.32,48 To confirm if aspirin specifically targets Neu-1 activity, we investigated if aspirin pretreatment of PANC-1 cells dose-dependently blocks Neu-1 cleavage of the terminal α-2,3 sialic acid residues expressed on the EGFR following EGF stimulation.
PANC-1 cells pretreated with aspirin followed by EGF stimulation after 5, 10, 15, and 30 minutes were evaluated for α-2,3 sialic acid expression levels using lectin cytochemistry analysis (Figure 6A). Maackia amurensis lectin II, biotinylated (MAL II) is specific for α-2,3 sialic acid, whereas Sambucus nigra lectin (SNA) preferentially binds α-2,6 sialic acid. As expected, unstimulated PANC-1 cells displayed high levels of α-2,3 sialic acid expression. 30 minutes of EGF stimulation resulted in a significant reduction of α-2,3 sialic acid expression in untreated cells (Figure 6B). Pretreatment of the cells with anti-Neu-1 specific antibody as a positive control blocked Neu-1 desialylation of α-2,3 sialic acid expression. Aspirin pretreatment of PANC-1 cells at concentrations of 3.2, 4.8, and 6.4 mM blocked Neu-1 desialylation of α-2,3 sialic acid expression similar to those findings with the anti-Neu-1 specific antibody.
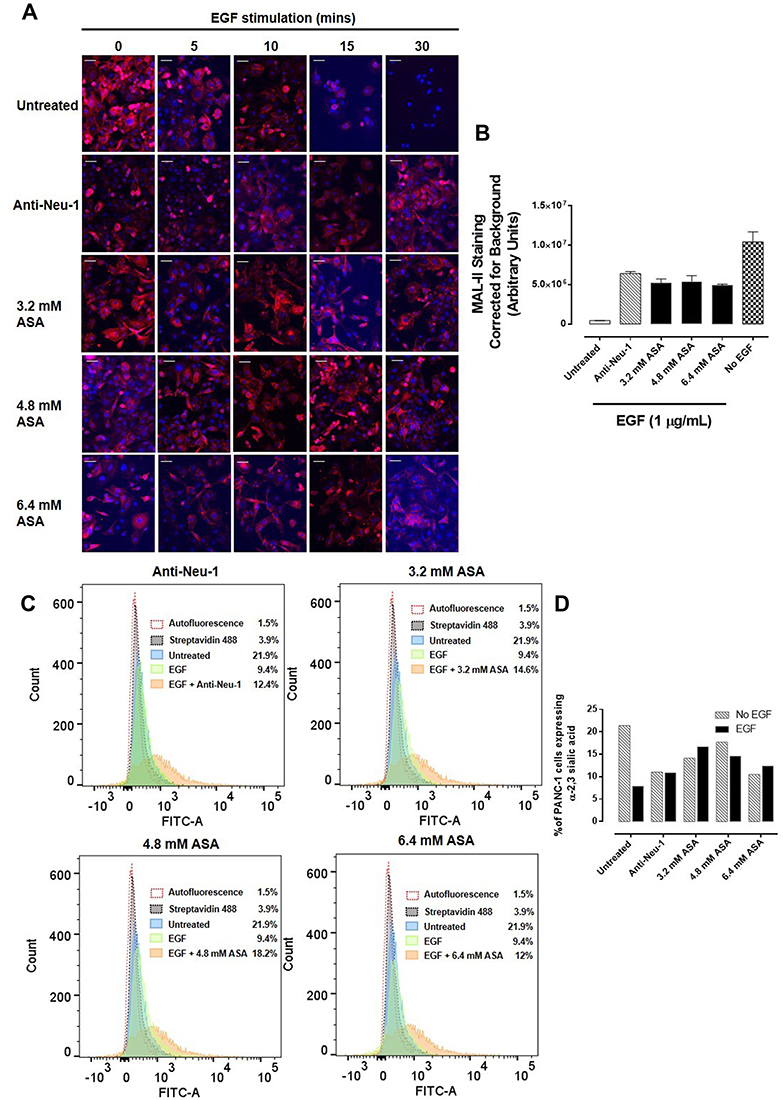 |
Figure 6 Acetylsalicylic acid (ASA) inhibits Neu-1 cleavage of α-2,3 sialic acid in PANC-1 cells. PANC-1 cells were pre-treated with anti-Neu-1 antibody, 3.2 mM, 4.8 mM, or 6.4 mM of ASA for 1 hour, or left untreated as a control. Cells were then stimulated with 1 ug/mL EGF for 5, 10, 15, or 30 minutes, or left untreated as a control. Cells were fixed, permeabilized and immunostained for α-2,3 sialic acid using biotinylated MAL II. Cells were stained with DAPI-containing mounting media to visualize the nuclei. (A) Stained cells were visualized by epi-fluorescent microscopy using a 200x objective. Scale bar represents 50 μm. (B) Quantitative analysis of MAL II expression levels by relative density corrected for average background staining of the Streptavidin 594 secondary antibody. Data shown for conditions stimulated with EGF for 30 minutes. Each bar in the figure represents the mean corrected for density staining ± SEM due to multiple images being quantified (3–4). The data are a combination of two independent experiments with similar results. (C) Flow cytometry was used to confirm the expression levels of α-2,3 sialic acid. Graphs represent an overlay of treated cells, untreated cells, stimulated cells, secondary control, and autofluorescence control. (D) Graph comparing expression levels of α-2,3 sialic acid under indicated conditions from flow cytometry analysis. |
These data support the hypothesis that aspirin pretreatment of PANC-1 cells blocks EGF activation of Neu-1 cleavage of α-2,3 sialic acid expression on the EGFR. Using Sambucus nigra lectin SNA specific for α-2,6 sialic acid, there were no expression levels of this sialic acid in any of the experimental conditions (data not shown). The data from the lectin cytochemistry staining of α-2,3 sialic acid following aspirin pretreatment and 30 minutes of EGF activation of EGF receptors were also confirmed by flow cytometry (Figure 6C). The percentage of gated cells expressing α-2,3 sialic acid expression following different treatments of aspirin or anti-Neu-1 compared to the untreated control are depicted in Figure 6D. The flow cytometry analyses confirm the results from the lectin cytochemistry analyses.
Aspirin Inhibits Phosphorylation of the Epidermal Growth Factor Receptor in PANC-1 and MiaPaCa-2 Cancer Cells
To determine the effect of aspirin pretreatment on the expression and phosphorylation of EGFR, we performed immunocytochemistry analysis on PANC-1 (Figure 7A) and MiaPaCa-2 (Figure 7D) cells pretreated with aspirin and stimulated with EGF.
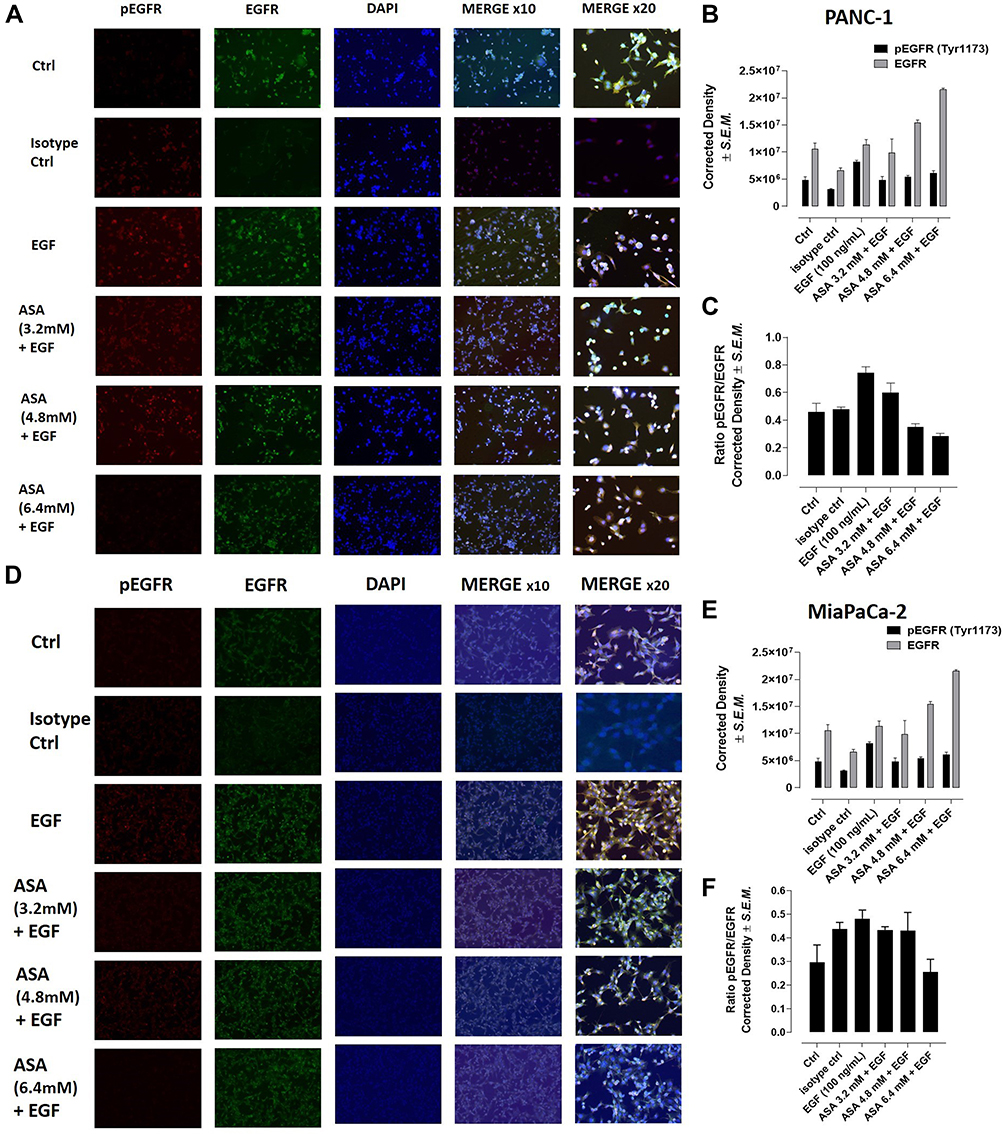 |
Figure 7 Acetylsalicylic acid (ASA) inhibits phosphorylation of the EGFR in PANC-1 and MiaPaCa-2 cells. PANC-1 and MiaPaCa-2 cells were pretreated with 3.2 mM, 4.8 mM, or 6.4 mM of aspirin for 1 hour, or left untreated as a control. Cells were then stimulated with 100 ng/mL EGF for 30 minutes or left untreated as a control. Cells were fixed, permeabilized, and immunostained for EGFR and phosphorylated EGFR (pEGFR). DAPI-containing mounting media was used to visualize the nuclei. (A) Stained PANC-1 cells, (B) quantitative analysis of pEGFR (Tyr1173) and EGFR expression in PANC1 cells by relative density corrected for average background staining antibody and (C) the ratio of pEGFR to EGFR expression for PANC-1. (D) Stained MiaPaCa-2 cells were visualized by epi-fluorescent microscopy using a 100x objective or 200x objective. (E) Quantitative analysis of pEGFR (Tyr1173) and EGFR by relative density corrected for average background staining antibody in MiaPaCa-2 cells. (F) The ratio of pEGFR to EGFR expression for MiaPaCa-2 cells is shown. Each bar in the figure represents the mean corrected for density staining ± SEM due to multiple images being quantified (3–4). |
In the presence of 100 ng/mL EGF for 30 minutes, there was an increase in EGFR phosphorylation (pEGFR) expression across both cell lines. This increased pEGFR level was lost with increasing aspirin concentration (Figure 7B and Figure 7E). To determine the relative pEGFR expression, we determined the ratio of pEGFR/EGFR in both cell lines. Across both PANC-1 and MiaPaCa-2 cells, EGF-stimulated cells represented the highest pEGFR/EGFR ratio, with cells pretreated with 6.4 mM aspirin showing the lowest pEGFR/EGFR ratio (Figure 7C and Figure 7F). These data confirm previous results suggesting that aspirin treatment results in shutting down EGFR signaling following EGF stimulation.
Aspirin Induces Early Apoptosis and Necrosis of PANC-1 Cancer Cells
Neu-1 activity has been reported to be associated with cell survival and proliferation.49 We have reported on the role of mammalian Neu-1 in complex with MMP-9 and GPCRs tethered to RTKs and TLRs as a major target in multistage tumorigenesis.31 Furthermore, we have reported on the efficacy of the combination of aspirin, metformin, and oseltamivir phosphate in sensitizing triple-negative breast cancer (TNBC) and its tamoxifen-resistant variant to tamoxifen in an additive therapeutic effect, reducing cell viability and cell proliferation and inducing early apoptosis and necrosis.50
We questioned whether aspirin also induces early apoptosis and necrosis of PANC-1 cancer cells in a dose-dependent manner. Here, we used the CellEvent Caspase-3/7 Green reagent, which is a four amino acid peptide (DEVD) conjugated to a nucleic acid-binding dye. DEVD is not fluorescent when not bound to DNA and the CellEvent Caspase-3/7 Green reagent is also not fluorescent. DEVD inhibits the binding of the dye reagent to the DNA. When caspase-3/7 is activated in apoptotic cells, DEVD is cleaved, and the free dye binds DNA, resulting in green fluorescence. The fluorescence emission of the dye is 530 nm when bound to DNA and can be analyzed with fluorescent microscopy. The data depicted in Figure 8A show the results of CellEvent Caspase-3/7 Green reagent added to PANC-1 cells following treatment with different concentrations of aspirin for 72 hours. The Incucyte Zoom Imager software analyzer performed the analyses of the number of apoptotic cells expressing the CellEvent Caspase-3/7 Green reagent over 72 hours of treatment. Aspirin treatment resulted in a higher number of early apoptotic cells compared to the untreated control cells (Figure 8B).
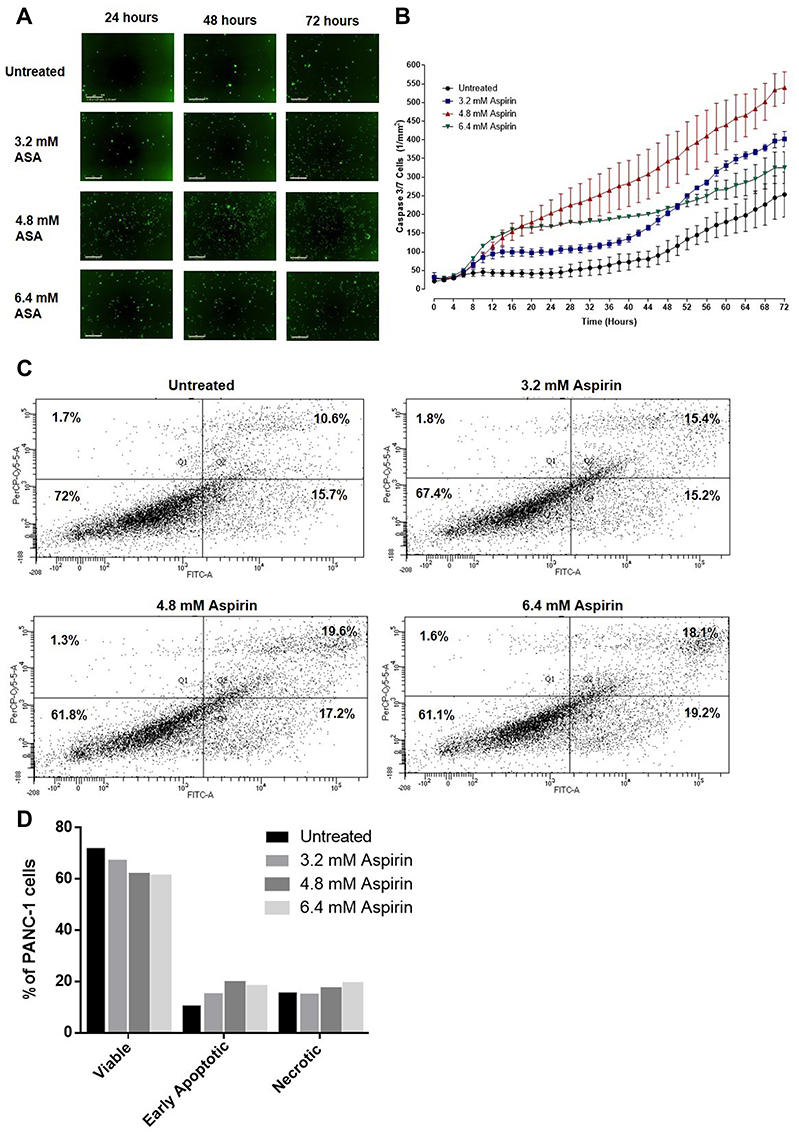 |
Figure 8 Viability, early apoptosis, and necrosis of PANC-1 cells after treatment with aspirin using the CellEvent Caspase 3/7 Green Detection Reagent and propidium iodide Annexin assay. (A) PANC-1 cells were plated at a density of 10,000 cells/well and allowed to adhere. Cells were treated with 3.2 mM, 4.8 mM, or 6.4 mM acetylsalicylic acid (ASA) or remained untreated as a control. CellEvent Caspase 3/7 Green Detection Reagent was added at a concentration of 5 μM in cell culture media from the stock solution of 2 mM. Green fluorescent images were acquired by the Incucyte Zoom Imager every 2 hours at 100x. Scale bar represents 300 μm. The images are representative of 12 images per condition. (B) Graph of the number of green cells (those expressing Caspase 3/7) analyzed by the Incucyte Zoom Imager Software Analyzer. The graph represents the number of green cells ± SEM of 4 images per well performed in triplicates (n=4). (C) Annexin-V-FITC/Propidium Iodide assay of PANC-1 cells following 24 hours of treatment with 3.2 mM, 4.8 mM, or 6.4 mM aspirin or untreated. 100,000 PANC-1 cells were collected and analyzed to assess viability, early apoptosis, and necrosis. (D) Comparisons were made between untreated cohorts and treatment groups for percent viable, early apoptotic, and necrotic cells. |
Consistent with the results from the CellEvent Caspase-3/7 and Incucyte Zoom Imager Software Analyzer, PANC-1 cells treated with 4.8 mM aspirin resulted in the highest percentage of necrotic cells (19.6%) following 24 hours of treatment using the Annexin V-FITC/Propidium Iodide staining and flow cytometry (Figure 8C). When the population of viable, necrotic, and early apoptotic cells was compared across the different treatment groups, results depicted in Figure 8D are consistent with the caspase 3/7 assay.
Discussion
For the first time, the findings in the present study signify a novel mechanism of action for aspirin and celecoxib in cancer treatment. The drugs specifically target and inhibit Neu-1 sialidase activity regulating EGF-induced receptor activation in live PANC-1 pancreatic cancer cells and its gemcitabine-resistant variant, PANC-1-GemR cells, and MiaPaCa-2 pancreatic cancer cells. Using pure neuraminidase (Clostridium perfringens) and assessing its activity using fluorogenic substrate 2ʹ-(4-methylumbelliferyl)-α-D-N-acetylneuraminic acid (4-MUNANA) and a spectrophotometer, aspirin and celecoxib significantly inhibited neuraminidase activity. Aspirin, in comparison with specific anti-Neu1 antibody, blocked Neu-1 desialylation of α-2,3-sialic acid expression on the EGFR following 30 min stimulation with EGF. Aspirin also inhibited phosphorylation of the EGFR in EGF-stimulated PANC-1 and MiaPaCa-2 cells. Aspirin also induced apoptosis in a dose- and time-dependent manner using CellEvent caspase-3/7 detection reagent and Incucyte Zoom Imager analysis as well as early apoptotic and necrotic cells using Annexin V-FITC/propidium iodide and flow cytometry on PANC-1 cells.
At the genetic level, we have previously reported that the sialidase activity associated with EGF stimulation of human 1140F01 and WG0544 type 1 sialidosis fibroblast cell lines was completely abrogated compared to the wildtype fibroblast cell line.32 These sialidosis fibroblast cells were obtained from patients with type 1 sialidosis or mucolipidosis-1 who have a true Neu-1 deficiency.51 In addition, we reported on the proof of concept of Neu-1 sialidase activity regulating TLR activation and inflammation.48 Here, primary bone marrow (BM) macrophages derived from the hypomorphic cathepsin A mice with the secondary ~90% reduction of the Neu-1 activity (Neu1-CathA KD) after 7 days in culture with conditioned medium containing monocyte colony-stimulating factor (M-CSF) were investigated. The primary macrophage cells were stimulated with TLR ligands to induce sialidase activity. The reported findings indicated that all TLR ligands except TLR3 ligand polyI:C induce sialidase activity within 1 min in wildtype (WT), CathA KI (normal Neu-1 sialidase bound to inactive cathepsin A Ser-190-Ala mutant) and Neu-4 knockout in primary BM macrophage cells derived from these mice. Furthermore, the primary BM macrophage cells derived from Neu-1-deficient mice (Neu1-CathA KD) exhibited no TLR ligand-induced sialidase activity. These latter data provided strong evidence that Neu-1 is involved in TLR ligand-induced sialidase activity. Also, TLR4 ligand lipopolysaccharide (LPS) and TLR2 ligand zymosan A induced NFκB activation localized to the nucleus in primary macrophage cells from WT and CathA KI mice, but not from the Neu1-deficient mice (Neu1-CathA KD).
Given that glycosylation is interrelated with the hallmarks of cancer such as invasion and metastasis, proliferation, angiogenesis, evasion of growth suppressors, and apoptosis and replicative immortality, glycosylation is now considered a hallmark of cancer.52 Due to the crucial role of neuraminidases in hydrolyzing glycosylated links on growth factor receptors, we reported on oseltamivir phosphate (OP) targeting Neu-1.37 Neu-1 has been shown to desialylate other crucial membrane growth receptors, including the insulin receptor,33 TrkA receptor,34 and EGFR,32,37,53 as well as TOLL-like receptors35,54,55 making Neu-1 a vital regulator of the signaling platforms of these glycosylated receptors.49
Considering that altered glycosylation of growth factor receptors affects cancer cell signal transduction pathways, including modulation of tumor cell growth and proliferation, investigating and targeting the glycosylation status of these receptors may resolve the challenges faced by current-targeted therapy options, particularly for the EGFR.30 The EGFR and other growth-promoting receptors have been shown to exhibit a higher number of N-linked glycosylated chains compared to inhibitor receptors, which determine the interactions and structural arrangement of the ligand-binding ectodomain.56 Sialylation of N-linked chains on the EGFR reduces its ligand-induced dimerization and intracellular signaling, resulting in a decreased invasion of lung cancer cells.57 It is well accepted that sialylation suppresses ligand-induced EGFR dimerization and downstream signaling,58 consistent with our proposed signaling pathway, as depicted in Figure 1.
The results of this report suggest a novel mechanism of action for aspirin preventing EGF-induced receptor activation, comparable to those previously reported with OP.37 Recently, we have reported that aspirin in combination with metformin and OP work synergistically to sensitize MDA-MB-231 tamoxifen resistant variant cells and spheroids to tamoxifen treatment.50 In preliminary studies (unpublished data, manuscript in preparation), aspirin in combination with 500 µg/mL OP dose-dependently, and synergistically inhibited cell viability of PANC-1 cells. When considering the previously reported therapeutic effects of aspirin, including modulating inflammation and critical signaling pathways and proteins such as Wnt/β‐catenin signaling, AMP-activated protein kinase (AMPK), mammalian target of rapamycin (mTOR), p53, NF-kB signaling, and Bcl-2,59,60 together with our newly identified effect on Neu-1 activity, aspirin presents as a promising anti-cancer drug. The data of this report suggest further investigation into the efficacy of aspirin as a regulator of Neu-1 mediated receptor activation. The biochemical binding properties of how aspirin interacts with Neu-1 remains to be determined and warrants additional analysis.
With respect to celecoxib, there have been conflicting results in the clinic, despite promising pre-clinical studies.61,62 Sacchetti has previously reported on the toxicity associated with celecoxib treatment, specifically discussing whether celecoxib kills cancer cells or is an in vitro precipitation-related artifact.63 It has been previously reported that celecoxib-induced cell death occurs only at insoluble concentrations of the drug. This is consistent with our findings in celecoxib-treated conditions in the WST-1 and sialidase assays (Figures 2B and 4, respectively), as is supported by the precipitation of celecoxib out of solution in these experiments (Supplementary Figure 2). Our findings in line with the report by Sacchetti highlight the importance of discerning drug efficacy from precipitate-dependent efficacy, and warrants further investigation, mainly due to the prevalent use of celecoxib in the clinic. Considering these results, we chose to eliminate celecoxib from the remainder of the experiments, and continued our investigations with aspirin, and there was no notable precipitation observed (Supplementary Figure 1).
Overall, the proof-of-concept and mechanism of aspirin and celecoxib role as anti-cancer drugs are that they are an inhibitor of Neu-1 sialidase activity. They target and inhibit ligand-induced activation of Neu-1 in modulating a number of glycosylated receptors such as the EGFR in this report, and others, all of which play important roles in tumorigenesis.
Conclusion
This report presents a novel effect of aspirin as an anti-cancer agent. The data suggest that aspirin treatment impedes neuraminidase-1 activity following EGF stimulation. Given the characteristic overexpression of EGFR on the surface of cancer cells, regulating its downstream signaling is crucial for modulating cancer cell growth and invasion. Results show that aspirin specifically targets neuraminidase-1 to prevent cleavage of α-2,3 sialic acid. The data shown underscore the need for additional investigation in the mechanism of aspirin-targeting of Neu-1. These promising results can translate to clinical settings to enhance patient care for otherwise lethal diseases.
Highlights
- Aspirin and celecoxib inhibit epidermal growth factor (EGF)-induced sialidase activity in pancreatic cancer cells.
- Aspirin inhibits Neu-1 cleavage of α-2,3 sialic acid of EGFR in PANC-1 cells.
- Aspirin induces early apoptosis and necrosis of PANC-1 cancer cells.
Abbreviations
4-MU, 4-methylumbelliferyl; 4-MUNANA, 2ʹ-(4-methylumbelliferyl)-α-D-N-acetylneuraminic acid sodium salt hydrate; AMPK, AMP-activated protein kinase; ANOVA, analysis of variance; COX, cyclooxygenase; EBP, elastin binding protein; ECM, extracellular matrix; EGFR, epidermal growth factor receptor; EMT, epithelial-to-mesenchymal transition; ERK, extracellular-signaling-regulated kinase; GPCR, G-protein coupled receptor; IR, insulin receptor; MAL II, Maackia amurensis lectin II; MAPK, mitogen-activated protein kinase; MMP-9, matrix metalloproteinase-9; mTOR, mammalian target of rapamycin; Neu-1, neuraminidase-1; NF-kB, nuclear factor kappa-light-chain-enhancer of activated B-cells; NGF, nerve growth factor; NSAID, non-steroidal anti-inflammatory drug; pEGFR, phosphorylated epidermal growth factor receptor; PG, prostaglandin; PGE2, prostaglandin E2; PPCA, protective protein cathepsin A; RTK, receptor tyrosine kinase; SEM, standard error of the mean; SNA, Sambucus nigra lectin; TLR, TOLL-like receptor; TME, tumor microenvironment; WST-1, water-soluble tetrazolium salt-1.
Author Contributions
All authors made a significant contribution to the work reported, whether that is in the conception, study design, execution, acquisition of data, analysis and interpretation, or in all these areas; took part in drafting, revising or critically reviewing the article; gave final approval of the version to be published; have agreed on the journal to which the article has been submitted; and agree to be accountable for all aspects of the work.
Funding
This study was supported by grants to MRS from the Natural Sciences and Engineering Research Council of Canada (NSERC), private-sector cancer funding from the Josefowitz Family to MRS, and Encyt Technologies Inc. BQ is the recipient of 2017, 2018, and 2019 Queen’s Graduate Award (QGA), Terry Fox Research Institute Transdisciplinary Training Program in Cancer Research (2017), the 2018 and 2019 Dean’s Doctoral Award, the 2019 Franklin Bracken Fellowship, and the 2020 Queen Elizabeth II Graduate Scholarship in Science and Technology.
Disclosure
The authors report no conflicts of interest in this work.
References
1. Siegel RL, Miller KD, Jemal A. Cancer statistics, 2016. CA Cancer J Clin. 2016;66(1):7–30. doi:10.3322/caac.21332
2. Kleeff J, Beckhove P, Esposito I, et al. Pancreatic cancer microenvironment. Int J Cancer. 2007;121(4):699–705. doi:10.1002/ijc.22871
3. Hanahan D, Weinberg Robert A. Hallmarks of cancer: the next generation. Cell. 2011;144(5):646–674. doi:10.1016/j.cell.2011.02.013
4. Alfonso L, Ai G, Spitale RC, Bhat GJ. Molecular targets of aspirin and cancer prevention. Br J Cancer. 2014;111(1):61–67. doi:10.1038/bjc.2014.271
5. Menter DG, DuBois RN. Prostaglandins in cancer cell adhesion, migration, and invasion. Int J Cell Biol. 2012;2012:723419. doi:10.1155/2012/723419
6. Surh Y-J, Chun K-S, Cha H-H, et al. Molecular mechanisms underlying chemopreventive activities of anti-inflammatory phytochemicals: down-regulation of COX-2 and iNOS through suppression of NF-κB activation. Mutat Res. 2001;480–481:243–268. doi:10.1016/S0027-5107(01)00183-X
7. Rolland PH, Martin PM, Jacquemier J, Rolland AM, Toga M. Prostaglandin in human breast cancer: evidence suggesting that an elevated prostaglandin production is a marker of high metastatic potential for neoplastic cells. J Natl Cancer Inst. 1980;64(5):1061–1070.
8. Dannenberg AJ, Altorki NK, Boyle JO, et al. Cyclo-oxygenase 2: a pharmacological target for the prevention of cancer. Lancet Oncol. 2001;2(9):544–551. doi:10.1016/S1470-2045(01)00488-0
9. Dolcet X, Llobet D, Pallares J, Matias-Guiu X. NF-kB in development and progression of human cancer. Virchows Arch. 2005;446(5):475–482. doi:10.1007/s00428-005-1264-9
10. Perl A-K, Wilgenbus P, Dahl U, Semb H, Christofori G. A causal role for E-cadherin in the transition from adenoma to carcinoma. Nature. 1998;392(6672):190–193. doi:10.1038/32433
11. Gong L, Thorn CF, Bertagnolli MM, Grosser T, Altman RB, Klein TE. Celecoxib pathways: pharmacokinetics and pharmacodynamics. Pharmacogenet Genomics. 2012;22(4):310–318. doi:10.1097/FPC.0b013e32834f94cb
12. Gu Q, Wang JD, Xia HH, et al. Activation of the caspase-8/Bid and Bax pathways in aspirin-induced apoptosis in gastric cancer. Carcinogenesis. 2005;26(3):541–546. doi:10.1093/carcin/bgh345
13. Dikshit P, Chatterjee M, Goswami A, Mishra A, Jana NR. Aspirin induces apoptosis through the inhibition of proteasome function. J Biol Chem. 2006;281(39):29228–29235. doi:10.1074/jbc.M602629200
14. van Wijngaarden J, van Beek E, van Rossum G, et al. Celecoxib enhances doxorubicin-induced cytotoxicity in MDA-MB231 cells by NF-kappaB-mediated increase of intracellular doxorubicin accumulation. Eur J Cancer. 2007;43(2):433–442. doi:10.1016/j.ejca.2006.09.010
15. Dandekar DS, Lopez M, Carey RI, Lokeshwar BL. Cyclooxygenase-2 inhibitor celecoxib augments chemotherapeutic drug-induced apoptosis by enhancing activation of caspase-3 and −9 in prostate cancer cells. Int J Cancer. 2005;115(3):484–492. doi:10.1002/ijc.20878
16. Dittmann KH, Mayer C, Ohneseit PA, et al. Celecoxib induced tumor cell radiosensitization by inhibiting radiation induced nuclear EGFR transport and DNA-repair: a COX-2 independent mechanism. Int J Radiat Oncol Biol Phys. 2008;70(1):203–212. doi:10.1016/j.ijrobp.2007.08.065
17. Qorri B, Szewczuk MR. Targeting the tumor microenvironment to overcome resistance to therapy. In: Szewczuk MR, Manpreet Sambi BQ, editors. Current Applications for Overcoming Resistance to Targeted Therapies. Vol. 20. Switzerland AG: Springer Nature; 2019:35–62.
18. Chang J, Bhasin SS, Bielenberg DR, et al. Chemotherapy-generated cell debris stimulates colon carcinoma tumor growth via osteopontin. FASEB J. 2019;33(1):114–125. doi:10.1096/fj.201800019RR
19. Gunjal PM, Schneider G, Ismail AA, Kakar SS, Kucia M, Ratajczak MZ. Evidence for induction of a tumor metastasis-receptive microenvironment for ovarian cancer cells in bone marrow and other organs as an unwanted and underestimated side effect of chemotherapy/radiotherapy. J Ovarian Res. 2015;8:20. doi:10.1186/s13048-015-0141-7
20. Kerbel RS, Ebos JM. Peering into the aftermath: the inhospitable host? Nat Med. 2010;16(10):1084–1085. doi:10.1038/nm1010-1084
21. Quail DF, Joyce JA. Microenvironmental regulation of tumor progression and metastasis. Nat Med. 2013;19(11):1423–1437.
22. Daenen LG, Roodhart JM, van Amersfoort M, et al. Chemotherapy enhances metastasis formation via VEGFR-1-expressing endothelial cells. Cancer Res. 2011;71(22):6976–6985. doi:10.1158/0008-5472.CAN-11-0627
23. Gingis-Velitski S, Loven D, Benayoun L, et al. Host response to short-term, single-agent chemotherapy induces matrix metalloproteinase-9 expression and accelerates metastasis in mice. Cancer Res. 2011;71(22):6986–6996. doi:10.1158/0008-5472.CAN-11-0629
24. Volk-Draper L, Hall K, Griggs C, et al. Paclitaxel therapy promotes breast cancer metastasis in a TLR4-dependent manner. Cancer Res. 2014;74(19):5421–5434. doi:10.1158/0008-5472.CAN-14-0067
25. Rajput S, Volk-Draper LD, Ran S. TLR4 is a novel determinant of the response to paclitaxel in breast cancer. Mol Cancer Ther. 2013;12(8):1676–1687. doi:10.1158/1535-7163.MCT-12-1019
26. Tang H, Qiao J, Fu YX. Immunotherapy and tumor microenvironment. Cancer Lett. 2016;370(1):85–90. doi:10.1016/j.canlet.2015.10.009
27. Lei X, Lei Y, Li JK, et al. Immune cells within the tumor microenvironment: biological functions and roles in cancer immunotherapy. Cancer Lett. 2019;470:126–133.
28. Dube DH, Bertozzi CR. Glycans in cancer and inflammation—potential for therapeutics and diagnostics. Nat Rev Drug Discov. 2005;4(6):477. doi:10.1038/nrd1751
29. Munkley J, Elliott DJ. Hallmarks of glycosylation in cancer. Oncotarget. 2016;7(23):35478. doi:10.18632/oncotarget.8155
30. Pinho SS, Reis CA. Glycosylation in cancer: mechanisms and clinical implications. Nat Rev Cancer. 2015;15(9):540.
31. Haxho F, Neufeld RJ, Szewczuk MR. Neuraminidase-1: a novel therapeutic target in multistage tumorigenesis. Oncotarget. 2016;7(26):40860–40881. doi:10.18632/oncotarget.8396
32. Gilmour AM, Abdulkhalek S, Cheng TSW, et al. A novel epidermal growth factor receptor-signaling platform and its targeted translation in pancreatic cancer. Cell Signal. 2013;25(12):2587–2603. doi:10.1016/j.cellsig.2013.08.008
33. Alghamdi F, Guo M, Abdulkhalek S, Crawford N, Amith SR, Szewczuk MR. A novel insulin receptor-signaling platform and its link to insulin resistance and type 2 diabetes. Cell Signal. 2014;26(6):1355–1368. doi:10.1016/j.cellsig.2014.02.015
34. Jayanth P, Amith SR, Gee K, Szewczuk MR. Neu1 sialidase and matrix metalloproteinase-9 cross-talk is essential for neurotrophin activation of Trk receptors and cellular signaling. Cell Signal. 2010;22(8):1193–1205. doi:10.1016/j.cellsig.2010.03.011
35. Abdulkhalek S, Szewczuk MR. Neu1 sialidase and matrix metalloproteinase-9 cross-talk regulates nucleic acid-induced endosomal TOLL-like receptor-7 and −9 activation, cellular signaling and pro-inflammatory responses. Cell Signal. 2013;25(11):2093–2105. doi:10.1016/j.cellsig.2013.06.010
36. Amith SR, Jayanth P, Finlay T, et al. Detection of neu1 sialidase activity in regulating TOLL-like receptor activation. J Vis Exp. 2010;(43):2142.
37. O’Shea LK, Abdulkhalek S, Allison S, Neufeld RJ, Szewczuk MR. Therapeutic targeting of Neu1 sialidase with oseltamivir phosphate (Tamiflu®) disables cancer cell survival in human pancreatic cancer with acquired chemoresistance. Onco Targets Ther. 2014;7:117–134. doi:10.2147/OTT.S55344
38. Riss T, Moravec R, Niles A, et al. Cell viability assays assay guidance manual. Assay Guidance Manual. 2004:1–23.
39. Sambi M, DeCarlo A, Malardier-Jugroot C, Szewczuk MR. Next-generation multimodality of nanomedicine therapy: size and structure dependence of folic acid conjugated copolymers actively target cancer cells in disabling cell division and inducing apoptosis. Cancers (Basel). 2019;11(11):1698. doi:10.3390/cancers11111698
40. Zhang Y, Liu L, Fan P. Aspirin counteracts cancer stem cell features, desmoplasia and gemcitabine resistance in pancreatic cancer. Oncotarget. 2015;6(12):9999–10015. doi:10.18632/oncotarget.3171
41. Omura N, Griffith M, Vincent A, et al. Cyclooxygenase-deficient pancreatic cancer cells use exogenous sources of prostaglandins. Mol Cancer Res. 2010;8(6):821–832. doi:10.1158/1541-7786.MCR-09-0336
42. Yip-Schneider MT, Barnard DS, Billings SD, et al. Cyclooxygenase-2 expression in human pancreatic adenocarcinomas. Carcinogenesis. 2000;21(2):139–146. doi:10.1093/carcin/21.2.139
43. Kokawa A, Kondo H, Gotoda T, et al. Increased expression of cyclooxygenase-2 in human pancreatic neoplasms and potential for chemoprevention by cyclooxygenase inhibitors. Cancer. 2001;91(2):333–338. doi:10.1002/1097-0142(20010115)91:2<333::AID-CNCR1006>3.0.CO;2-N
44. Rathos MJ, Joshi K, Khanwalkar H, Manohar SM, Joshi KS. Molecular evidence for increased antitumor activity of gemcitabine in combination with a cyclin-dependent kinase inhibitor, P276-00 in pancreatic cancers. J Transl Med. 2012;10(1):161. doi:10.1186/1479-5876-10-161
45. Lee J-P, Hahn H-S, Hwang S-J, et al. Selective cyclooxygenase inhibitors increase paclitaxel sensitivity in taxane-resistant ovarian cancer by suppressing P-glycoprotein expression. J Gynecol Oncol. 2013;24:273–279. doi:10.3802/jgo.2013.24.3.273
46. Zhang S, Sun C, Hu H, et al. Effects of paclitaxel on the ability of aspirin and clopidogrel to inhibit platelet aggregation. Clin Appl Thromb Hemost. 2016;22(7):673–678. doi:10.1177/1076029615576740
47. Leang S-K, Hurt AC. Fluorescence-based neuraminidase inhibition assay to assess the susceptibility of influenza viruses to the neuraminidase inhibitor class of antivirals. J Vis Exp. 2017;(122). doi:10.3791/55570.
48. Amith SR, Jayanth P, Franchuk S, et al. Dependence of pathogen molecule-induced toll-like receptor activation and cell function on Neu1 sialidase. Glycoconj J. 2009;26(9):1197–1212. doi:10.1007/s10719-009-9239-8
49. Scandolera A, Odoul L, Salesse S, et al. The elastin receptor complex: a unique matricellular receptor with high anti-tumoral potential. Front Pharmacol. 2016;7:32. doi:10.3389/fphar.2016.00032
50. Sambi M, Samuel V, Qorri B, et al. A triple combination of metformin, acetylsalicylic acid, and oseltamivir phosphate impacts tumour spheroid viability and upends chemoresistance in triple-negative breast cancer. Drug Des Devel Ther. 2020;14(in press):1–25. doi:10.2147/DDDT.S242514
51. Bifsha P, Landry K, Ashmarina L, et al. Altered gene expression in cells from patients with lysosomal storage disorders suggests impairment of the ubiquitin pathway. Cell Death Differ. 2007;14(3):511–523. doi:10.1038/sj.cdd.4402013
52. Vajaria BN, Patel PS. Glycosylation: a hallmark of cancer? Glycoconj J. 2017;34(2):147–156. doi:10.1007/s10719-016-9755-2
53. Abdulkhalek S, Geen OD, Brodhagen L, et al. Transcriptional factor snail controls tumor neovascularization, growth and metastasis in mouse model of human ovarian carcinoma. Clin Transl Med. 2014;3:28. doi:10.1186/s40169-014-0028-z
54. Abdulkhalek S, Amith SR, Franchuk SL, et al. Neu1 sialidase and matrix metalloproteinase-9 cross-talk is essential for Toll-like receptor activation and cellular signaling. J Biol Chem. 2011;286(42):36532–36549. doi:10.1074/jbc.M111.237578
55. Abdulkhalek S, Guo M, Amith SR, Jayanth P, Szewczuk MR. G-protein coupled receptor agonists mediate Neu1 sialidase and matrix metalloproteinase-9 cross-talk to induce transactivation of TOLL-like receptors and cellular signaling. Cell Signal. 2012;24(11):2035–2042. doi:10.1016/j.cellsig.2012.06.016
56. Kaszuba K, Grzybek M, Orłowski A, et al. N-Glycosylation as determinant of epidermal growth factor receptor conformation in membranes. Proc Natl Acad Sci. 2015;112(14):4334–4339. doi:10.1073/pnas.1503262112
57. Gomes Ferreira I, Pucci M, Venturi G, Malagolini N, Chiricolo M, Dall’Olio F. Glycosylation as a main regulator of growth and death factor receptors signaling. Int J Mol Sci. 2018;19(2):580.
58. Liu Y-C, Yen H-Y, Chen C-Y, et al. Sialylation and fucosylation of epidermal growth factor receptor suppress its dimerization and activation in lung cancer cells. Proc Natl Acad Sci. 2011;108(28):11332–11337. doi:10.1073/pnas.1107385108
59. Hua H, Zhang H, Kong Q, Wang J, Jiang Y. Complex roles of the old drug aspirin in cancer chemoprevention and therapy. Med Res Rev. 2019;39(1):114–145.
60. Zhang Z, Chen F, Shang L. Advances in antitumor effects of NSAIDs. Cancer Manag Res. 2018;10:4631. doi:10.2147/CMAR.S175212
61. Tołoczko-Iwaniuk N, Dziemiańczyk-Pakieła D, Nowaszewska BK, Celińska-Janowicz K, Miltyk W. Celecoxib in cancer therapy and prevention–review. Curr Drug Targets. 2019;20(3):302–315.
62. Dragovich T, Burris III H, Loehrer P, et al. Gemcitabine plus celecoxib in patients with advanced or metastatic pancreatic adenocarcinoma: results of a Phase II trial. Am J Clin Oncol. 2008;31(2):157–162. doi:10.1097/COC.0b013e31815878c9
63. Sacchetti A. Cancer cell killing by Celecoxib: reality or just in vitro precipitation‐related artifact? J Cell Biochem. 2013;114(6):1434–1444. doi:10.1002/jcb.24485
 © 2020 The Author(s). This work is published and licensed by Dove Medical Press Limited. The full terms of this license are available at https://www.dovepress.com/terms.php and incorporate the Creative Commons Attribution - Non Commercial (unported, v3.0) License.
By accessing the work you hereby accept the Terms. Non-commercial uses of the work are permitted without any further permission from Dove Medical Press Limited, provided the work is properly attributed. For permission for commercial use of this work, please see paragraphs 4.2 and 5 of our Terms.
© 2020 The Author(s). This work is published and licensed by Dove Medical Press Limited. The full terms of this license are available at https://www.dovepress.com/terms.php and incorporate the Creative Commons Attribution - Non Commercial (unported, v3.0) License.
By accessing the work you hereby accept the Terms. Non-commercial uses of the work are permitted without any further permission from Dove Medical Press Limited, provided the work is properly attributed. For permission for commercial use of this work, please see paragraphs 4.2 and 5 of our Terms.