")
Back to Journals » International Journal of Nanomedicine » Volume 14
Novel chitosan oligosaccharide-based nanoparticles for gastric mucosal administration of the phytochemical “apocynin”
Authors Anter HM , Abu Hashim II, Awadin W, Meshali MM
Received 25 March 2019
Accepted for publication 14 May 2019
Published 5 July 2019 Volume 2019:14 Pages 4911—4929
DOI https://doi.org/10.2147/IJN.S209987
Checked for plagiarism Yes
Review by Single anonymous peer review
Peer reviewer comments 2
Editor who approved publication: Dr Thomas Webster
Hend Mohamed Anter,1 Irhan Ibrahim Abu Hashim,1 Walaa Awadin,2 Mahasen Mohamed Meshali1
1Department of Pharmaceutics, Faculty of Pharmacy, Mansoura University, Mansoura, Dakahlia 35516, Egypt; 2Department of Pathology, Faculty of Veterinary Medicine, Mansoura University, Mansoura, Dakahlia 35516, Egypt
Background: Apocynin (APO) is a bioactive phytochemical with prominent anti-inflammatory and anti-oxidant activities. Designing a nano-delivery system targeted to potentiate the gastric antiulcerogenic activity of APO has not been investigated yet. Chitosan oligosaccharide (COS) is a low molecular weight chitosan and its oral nanoparticulate system for potentiating the antiulcerogenic activity of the loaded APO has been described here.
Methods: COS-nanoparticles (NPs) loaded with APO (using tripolyphosphate [TPP] as a cross-linker) were prepared by ionic gelation method and fully characterized. The chosen formula was extensively evaluated regarding in vitro release profile, kinetic analysis, and stability at refrigerated and room temperatures. Ultimately, the in vivo antiulcerogenic activity against ketoprofen (KP)-induced gastric ulceration in rats was assessed by macroscopic parameters including Paul’s index and antiulcerogenic activity, histopathological examination, immunohistochemical (IHC) evaluation of cyclooxygenase-2 (COX-2) expression level in ulcerated gastric tissue, and biochemical measurement of oxidative stress markers and nitric oxide (NO) levels.
Results: The selected NPs formula with COS (0.5 % w/v) and TPP (0.1% w/v) was the most appropriate one with drug entrapment efficiency percentage of 35.06%, particle size of 436.20 nm, zeta potential of +38.20 mV, and mucoadhesive strength of 51.22%. It exhibited a biphasic in vitro release pattern as well as high stability at refrigerated temperature for a 6-month storage period. APO-loaded COS-NPs provoked marvelous antiulcerogenic activity against KP-induced gastric ulceration in rats compared with free APO treated group, which was emphasized by histopathological, IHC, and biochemical studies.
Conclusion: In conclusion, APO-loaded COS-NPs could be considered as a promising oral phytopharmaceutical nanoparticulate system for management of gastric ulceration.
Keywords: apocynin, chitosan oligosaccharide, tripolyphosphate, nanoparticles, antiulcerogenic activity
Introduction
Advances in nanotechnology involving bioactive phytochemicals have provided numerous innovative delivery systems; including polymeric nanoparticles (PNPs). Oral PNPs have gained much attention as drug carriers because of their nanoscopic size, bioadhesion, targetability, and controlled release of drugs in the GIT, hence conferring enhanced bioavailability.1 Their ability to cross directly and/or adhere to the mucosa represents a prerequisite step prior to the translocation process of particles.2 From this perspective, bioadhesion plays a substantial role in delivering the drugs across the epithelia and subsequently averting hepatic first pass metabolism and enzymatic degradation in the GIT.1
Among natural mucoadhesive polymers, chitosan (CS) is the most extensively studied cationic polysaccharide for construction of PNPs owing to its characteristic features.3 Ionic gelation technique, a physical cross-linking process, is an efficient method adopted to prepare CS-NPs based on ionic interaction between positively charged primary amino groups of CS and negatively charged groups of polyanion like tripolyphosphate (TPP) (the most preferable cross-linker with safety and multivalent properties).4 Such positively charged CS-NPs possess mucoadhesive and permeation enhancing properties.5
Despite the aforementioned advantages of CS, its poor aqueous solubility in physiological pH is considered the major limitation (readily soluble in acidic medium only). Besides, the degree of deacetylation, molecular weight (MW), and type of CS can influence its solubility.6,7 Therefore, CS derivatives have emerged in recent years to circumvent such limitation. Among them; CS oligosaccharide (COS), an oligomer of β-(1–4)-linked D-glucosamine, is a low MW CS, typically below 10 kDa (Figure 1A). Its superior merits such as high water solubility, low viscosity, biocompatibility, biodegradability, mucoadhesiveness, and permeation enhancing capability boost its potential application in pharmaceutical and biomedical fields.6,7 COS has been reported as a biopolymer possessing versatile biological activities.8 The anti-inflammatory activity of COS was verified both in vitro and in vivo.9–11
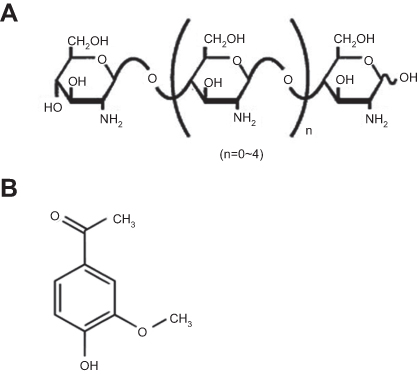 |
Figure 1 Chemical structures of the polymer and the drug. Note: (A) COS and (B) APO. Abbreviations: APO, apocynin; COS, chitosan oligosaccharide. |
Gastric ulcer has long been rated as one of the most prevalent gastrointestinal inflammatory disorders affecting approximately 10% of the world’s population. The pathogenesis of gastric ulcer is related to the disruption of the homeostasis between offensive factors and defensive factors.12 Despite the availability of different drug categories for treatment of gastric ulcer such as proton pump inhibitors and H2 receptor antagonists, their clinical evaluation has demonstrated numerous side effects and high incidence of relapse.13 Apocynin (APO) (Figure 1B) (4-hydroxy-3-methoxyacetophenone) is a bioactive phytochemical extracted from the roots of Apocynum cannabinum (Canadian hemp) or Picrorhiza kurroa native to the Himalayas. It possesses eminent anti-inflammatory and anti-oxidant activities that have been substantiated on a diversity of cell lines and animal models.14–16 APO’s mechanism is renowned through specific inhibition of nicotinamide adenine dinucleotide phosphate (NADPH) oxidase as well as suppression of a series of inflammatory mediators.17,18 However, for successful prospective administration, the literatures recently published APO as nanoparticulate systems to overcome its poor oral bioavailability as a prime challenge.19–22
COS has been proven a promising candidate for preparation of several nano-delivery systems targeted to potentiate the therapeutic efficacy of the loaded drugs.23–26 However, to the best of our knowledge, only one article was published by Ye et al which stated the preparation of COS-NPs using TPP as a cross-linker and evaluated the efficiency of such COS-TPP NPs as a non-viral vector for DNA delivery.7 Likewise, a sole pharmacological study manifested the gastroprotective activity of APO, as a free drug, against ethanol-induced gastric ulcer in rats.27 Nevertheless, designing a nano-delivery system targeted to potentiate the gastric antiulcerogenic activity (AA) of APO has not been investigated yet.
This context paves the way to devote the current study to fabricate and extensively evaluate a novel oral phytopharmaceutical nanoparticulate system composed of COS-NPs loaded with APO (using TPP as a cross-linker) in order to reconnoiter its potential for effective gastric AA.
Materials and methods
Materials
APO, TPP, mucin from porcine stomach, ketoprofen (KP), and bovine serum albumin (BSA) were purchased from Sigma-Aldrich Co. (St Louis, MO, USA). COS (2~6 glucosamine units, deacetylation degree ˃98%) was kindly supplied by Yaizu Suisankagaku Industry Co., Ltd. (Shizuoka, Japan). Sodium carboxymethylcellulose (sodium CMC) was obtained from EL-Nasr Pharmaceutical Chemicals Co., Cairo, Egypt. Oxidative stress markers and nitric oxide (NO) assay kits were procured from Biodiagnostic, Egypt. All other solvents were of analytical reagent grades.
Preparation of APO-loaded COS-NPs
COS-NPs were prepared according to the ionic gelation method which is based on an ionic interaction between the positively charged amino group of COS solution and the negatively charged phosphate group of TPP solution (Table 1).7 In brief, COS was dissolved in deionized water (DW) at various concentrations (0.3, 0.4 or 0.5% w/v). Next, 4 mL aqueous solution of APO (0.2% w/v) containing different concentrations of TPP (0.1, 0.15 or 0.2% w/v) was slowly dropped into 10 mL COS solution through a disposable insulin syringe with a dropping rate of 0.2 mL/min under magnetic stirring (1,000 rpm) at room temperature. The stirring was continued for 30 minutes to allow further cross-linking reaction. Finally, COS-NPs were collected by centrifugation at 10,000 rpm for 20 minutes (Benchtop Centrifuge, Sigma Laborzentrifugen GmbH, Germany), washed with DW, and then freeze-dried (Freeze dryer, SIM FD8-8T, SIM international, USA) for further characterization study. The same procedure was adopted for preparation of plain COS-NPs.
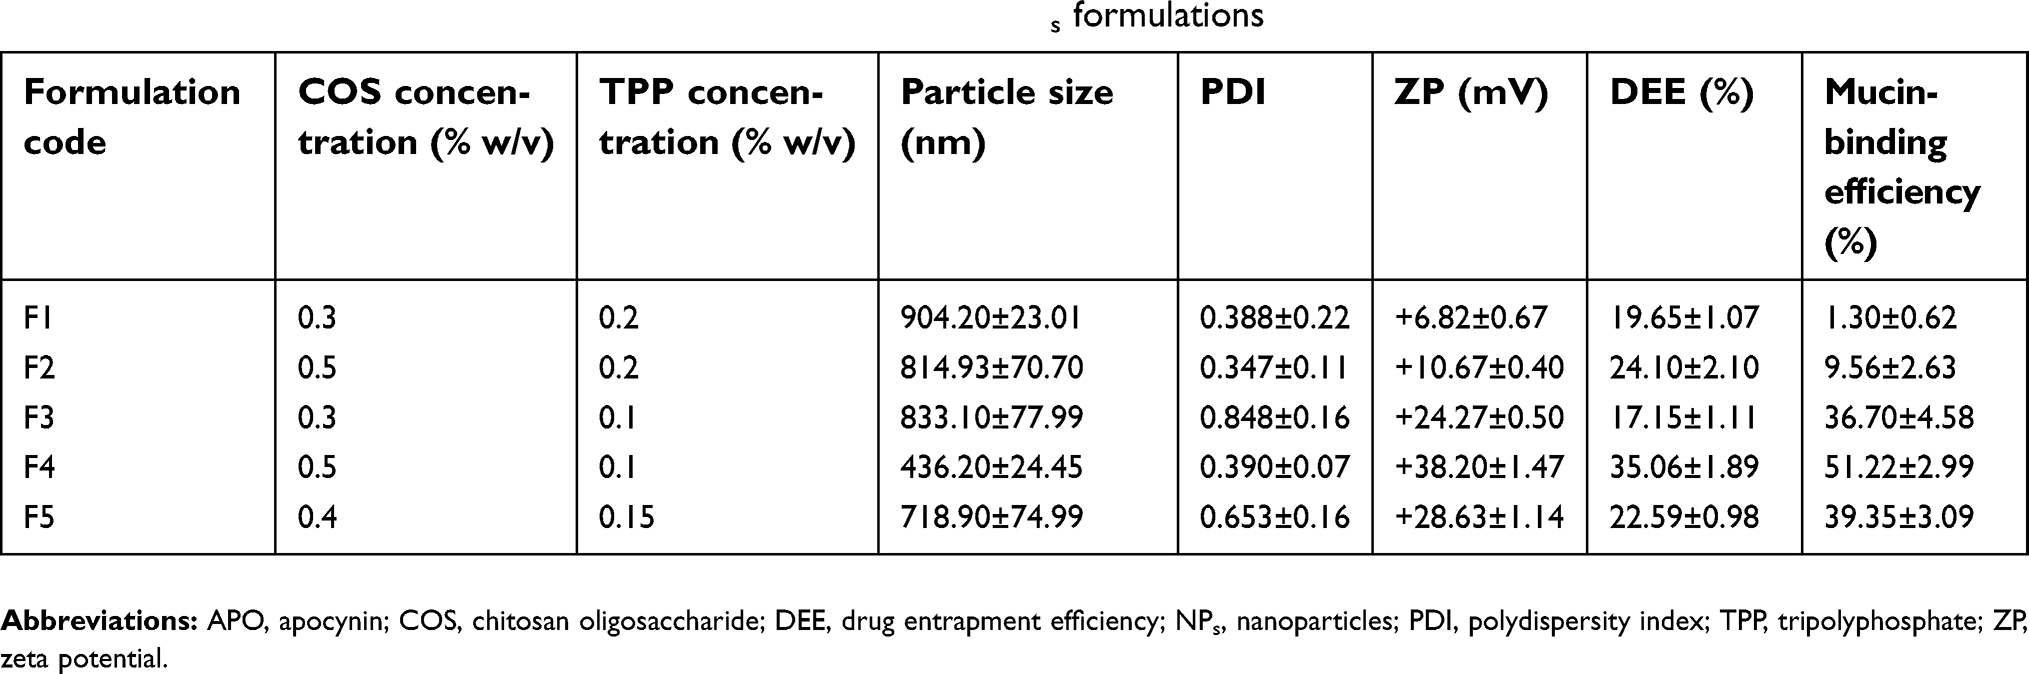 |
Table 1 Composition and characterization of APO-loaded COS-NPs formulations |
Characterization of APO-loaded COS-NPs
Drug entrapment efficiency
The drug entrapment efficiency percentage (DEE %) was estimated indirectly by measuring the amount of free APO (unentrapped drug) in the supernatant of the medicated COS-NPs dispersion after centrifugation at 10,000 rpm for 20 minutes. Unentrapped APO amount was quantified spectrophotometrically at 272 nm (Spectro UV-VIS double beam, Labomed Inc., USA) against the corresponding plain COS-NPs supernatant as a blank. The DEE (%) was calculated according to the following Equation (1):28
(1)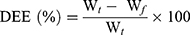
where  is the total amount of APO and
  is the amount of free APO in the supernatant.
Particle size, polydispersity index (PDI), and zeta potential (ZP) measurements
Measurement of particle size, PDI, and ZP of the freshly prepared APO-loaded COS-NPs was carried out using Malvern Zetasizer Nano ZS (Malvern Instruments, Malvern, UK) after appropriate dilution with DW. Dynamic light scattering (DLS) and laser Doppler micro-electrophoresis techniques were applied to particle size and ZP measurements, respectively.
Mucoadhesive strength
All APO-loaded COS-NPs formulations were evaluated regarding their mucoadhesive strength based on the interaction between the negatively charged mucin and the positively charged COS-NPs.24 In brief, equal volumes of mucin (0.5 mg/mL in phosphate buffer saline [PBS] pH 7.4) and NPs dispersion (5 mL each) were vortexed, shaken for 1 hour at 37°C, and then centrifuged at 10,000 rpm for 1 hour. UV-VIS spectrophotometer was utilized to quantify the amount of free mucin in the supernatant at 251 nm. The mucin-binding efficiency (%), expressing the mucoadhesive strength of the NPs, was calculated according to Equation (2):
(2)
Fourier transform-infrared (FT-IR) spectroscopy
The FT-IR spectra of APO, COS, TPP, and their physical mixture with the same ratio used during the preparation of the chosen formula as well as freeze dried samples of plain and medicated COS-NPs, were run using FT-IR Spectrophotometer (Madison Instruments, Middleton, WI, USA). Discs containing 2 mg of each sample with 200 mg potassium bromide were scanned individually over a wave number range of 4,000–500 cm−1.
Differential scanning calorimetry (DSC)
Thermograms of APO, COS, TPP, and their physical mixture (keeping the same ratio as present in the chosen NPs formula) as well as freeze dried plain and medicated COS-NPs, were recorded utilizing DSC (DSC 6000; PerkinElmer Inc., Waltham, MA, USA). Samples (4 mg per each) were heated in hermetically sealed aluminum pans covering a temperature range of 30–400°C at a heating rate of 10°C/min under constant dry nitrogen purging at 20 mL/min. DSC runs were implemented using indium as a reference standard for temperature calibration.
X-ray diffractometry (XRD)
X-ray diffraction patterns of APO, COS, TPP, and their physical mixture (keeping the same ratio as present in the chosen NPs formula) as well as freeze dried plain and medicated COS-NPs, were determined employing a Diano X-ray diffractometer (Diano Corp., USA) equipped with Cu Kα. The analysis proceeded at a voltage of 45 kV and a current of 9 mA with scanning range from 3° to 50° at 2θ angle.
Transmission electron microscopy (TEM)
The morphological characteristics of the chosen COS-NPs formula were examined by TEM (JEOL 2100;JEOL, Tokyo, Japan). For sample preparation, one drop of freshly prepared NPs dispersion was cast onto carbon coated copper grid and excess dispersion was wiped off with filter paper. After complete drying of the sample at room temperature, it was inspected directly with TEM without staining. Digital Micrograph and Soft Imaging Viewer software were employed for image capture and analysis process, respectively.
In vitro drug release
The in vitro release profile of APO from COS-NPs, compared with its diffusion from aqueous solution, as a control, was examined using vertical Franz diffusion cells with diffusional surface area of 7.07 cm2. The donor and receptor compartments of the diffusion cells were separated by Spectrapor® membrane (MW cutoff: 12,000–14,000 Da, Spectrum Medical Industries Inc., LA, USA) that was equilibrated overnight with 0.1 M HCl (pH 1.2) simulating gastric pH before conducting the experiment. Briefly, 2 mL medicated COS-NPs dispersion in DW or aqueous drug solution with an equivalent amount of 4 mg APO each was introduced into the donor compartment, whereas 50 mL 0.1 M HCl (pH 1.2) was placed in the receptor one. The whole assembly of the diffusion cells was shaken by thermostatically controlled shaking incubator (GFL Gesellschaft für Labortechnik, Burgwedel, Germany) at 100 rpm/min and maintained at 37±0.5°C throughout the experiment. At an appointed time interval, samples (3 mL) were withdrawn from the receptor compartment and replenished with an equivalent volume of fresh release medium equilibrated at 37±0.5°C. The collected samples were filtered through 0.45 µm membrane filter (EMD Millipore, Billerica, MA, USA) and the released drug was analyzed spectrophotometrically at 275 nm. Finally, the cumulative APO released (%) was calculated at each time interval and plotted against time.
Kinetic analysis of the drug release data
To gain a profound insight into the drug release mechanism from the NPs, the in vitro release data of the chosen APO-loaded COS-NPs formulation were fitted to different kinetic models, namely; zero order, first order, Higuchi,29 and Korsmeyer-Peppas (Equation (3)):30
(3)
where, mt/m∞ is the fraction of drug released after time t, k is the kinetic constant, and n is the diffusional exponent for drug release that equals the slope of log mt/m∞ vs log time curve. The proper kinetic model expressing the predicted drug release mechanism was chosen based on the highest coefficient of determination (R2) value.
Stability study
The stability studies of the chosen COS-NPs loaded with APO were carried out at refrigerated (4±1°C) and room (25±2°C/60±5% relative humidity; RH) temperatures for 6 months. The freshly prepared COS-NPs dispersions in DW were filled into screw capped glass bottles and then stored at the previously mentioned temperatures.1 The NPs were assessed monthly for particle size, PDI, and ZP as well as drug retention (%) using Equation (4).
(4)
Evaluation of AA against KP-induced gastric ulcer in rats
Animals
Male Wistar albino rats, 200–220 g body weight, were caged and acclimated for 1 week before carrying out the experiments in a standard controlled room (temperature of 25±1°C, RH of 55±5%, and photoperiod regimen of 12 hour light/12 hour dark cycles) with free access to food and water. All animal experiments followed a protocol approved by the Ethical Committee of the Faculty of Pharmacy, Mansoura University, Egypt, in accordance with “principles of laboratory animal care NIH publication revised 1985”.
Induction of ulcer and treatment regimen design
The rats were fasted overnight with free access to water prior to starting the experimental protocol. Intragastric gavage was utilized to facilitate the oral administration of KP, free APO, or medicated COS-NPs (chosen formula, F4) to rats (each one was prepared as suspension in sodium CMC [1% w/v]). In this study, two treatment regimens were evaluated against KP-induced gastric ulcer in rats; 1) concurrent induction and treatment regimen, where APO or APO-loaded COS-NPs and KP were administered simultaneously, 2) post-treatment regimen, where KP was administered first and after 8 hours APO or APO-loaded COS-NPs was administered.
Concurrent induction and treatment regimen
Twenty-four animals were divided into four groups (six rats per group) and treated as follows: Group I: normal control (no KP nor APO). Group II: positive control which received two consecutive doses of 50 mg/kg KP only within 8-hour interval.31,32 Group III: received concurrent oral administration of both KP and free APO suspensions (50 and 14 mg/kg, respectively).31,33 After 8 hours, the rats received a dose of KP only. Group IV: similarly treated as group III but with APO-loaded COS-NPs (F4) containing an equivalent dose of APO (14 mg/kg) instead of free APO.
Post-treatment regimen
KP was administered first and after 8 hours, APO was taken. Twenty-four animals were divided into four groups (six rats per group) and each treated as follows: Group I: normal control (no KP nor APO). Group II: positive control which received oral KP suspension (50 mg/kg) to induce gastric ulcer in rats within 8 hours. Group III: received oral KP suspension (50 mg/kg) and after 8 hours received free APO suspension (14 mg/kg) and then once daily for 4 consecutive days. Group IV: similarly treated as group III but with APO-loaded COS-NPs (F4) containing an equivalent dose of APO (14 mg/kg) instead of free APO.
At the end of both treatment regimens, rats were sacrificed (8 hours after the last treatment in case of concurrent induction and treatment regimen and 24 hours after the last treatment in case of post-treatment regimen). Their stomachs were rapidly removed, opened along the greater curvature, gently rinsed out with normal saline, and processed for the forthcoming evaluations.
Macroscopic examination of gastric ulceration
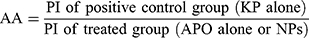
The mucosal surfaces of the stomachs were photographed and macroscopically examined for ulcerogenic lesions (black spots).34 The mean number of ulcers and percentage incidence of rats with ulcers (percentage of rats with ulcers) were estimated. Moreover, Paul’s index (PI; an integral indicator of the number of lesions induced per experimental group) and AA (the activity was recognized when AA value was at least two units) were evaluated according to Equations (5 and 6), respectively:35,36
(5) (6)
After completion of macroscopic examination, each stomach was divided into two portions. The first portion was processed for pathological studies and the second one was subjected to biochemical evaluations.
Preparation of gastric tissue samples for pathological studies
Autopsy samples were taken from freshly excised clean stomachs and fixed in a 10% buffered formalin solution for 24 hours. Formalin-fixed stomachs were washed, dehydrated by ascending grades of ethyl alcohol, cleared in xylene, embedded in paraffin wax, and serially sectioned (5 μm) for the following examinations.
Histopathological examination
One set of gastric tissue sections was picked up on slides, deparaffinized, and stained with hematoxylin and eosin (H&E), as previously reported.37 The second and third sets of sections were stained with alcian blue and toluidine blue for detection of mucus glycoproteins and mast cells, respectively.27,38
Immunohistochemical (IHC) detection of cyclooxygenase-2 (COX-2) expression
Another set of sections was immunostained to evaluate COX-2 expression level in gastric tissue by EnVision method, following the manufacturer’s instructions (Thermo Fisher Scientific, Waltham, MA, USA). Briefly, sections were deparaffinized in xylene, then rehydrated in gradual descending concentrations of ethyl alcohol followed by PBS (pH 7.4). For antigen retrieval, glass jars containing tissue section slides in 0.01 M sodium citrate buffer (pH 6.0) were placed in a microwave oven for 8 minutes at 600 W to enhance immunoreactivity. The endogenous peroxidase activity was blocked with 3% hydrogen peroxide (H2O2) for 5 minutes at room temperature. After rinsing with PBS (pH 7.4), tissue sections were incubated with primary antibody (anti-COX-2 [1:50] in PBS containing 1% BSA) overnight at 4°C. After triple washing with PBS, the sections were incubated with secondary antibody (biotinylated anti-immunoglobulin) for 1 hour at room temperature, followed by washing and development of antigen–antibody visualization with 0.04% 3, 3ʹ-diaminobenzidine tetrahydrochloride, as a chromogen, for 1 minute. Finally, the sections were washed and then counter-stained with Mayer’s hematoxylin. All pathological changes were examined blindly using a light microscope (Olympus Corporation, Tokyo, Japan). The sections treated for immunostaning were scored from 0 to 3 as follows: absent staining =0, weak staining =1, moderate staining =2, and strong staining =3.39 Such scoring clearly reflected the capability to realize the positive reactions under high, medium, and low power microscopic magnifications.
Preparation of gastric tissue homogenate for biochemical studies
Gastric mucosal tissue was weighed, homogenized in 10 volumes of ice-cold phosphate buffer (100 mM, pH 7.4) using a homogenizer (Benchmark D1000, USA), and then centrifuged (10,000 g for 10 minutes at 4°C).36 Aliquots of the homogenate were stored at −80°C for the subsequent measurements.
Measurement of oxidative stress markers
Levels of malondialdehyde (MDA), superoxide dismutase (SOD), and reduced glutathione (GSH) were measured in gastric mucosal homogenates of the different experimental groups using their respective assay kits according to the manufacturer’s instructions (Biodiagnostic).
Measurement of NO
The level of NO in gastric mucosal homogenate was measured based on Griess method using a specified kit as indicated by the manufacturer’s instructions (Biodiagnostic).32
Statistical analysis
Data were expressed as mean ± SD of three experiments. In vivo data were presented as mean ± standard error of the mean (SEM) of six experiments. Statistical analysis was accomplished by one-way ANOVA followed by Tukey-Kramer multiple comparisons test using Graphpad prism software version 5.00 (GraphPad Software, Inc., La Jolla, CA, USA). The p-values at level p<0.05 were considered statistically significant.
Results and discussion
Preparation and characterization of APO-loaded COS-NPs formulations
In the present study, APO-loaded COS-NPs were successfully prepared by ionic gelation method. As shown in Table 1, different concentrations of COS and TPP were used to determine the most appropriate nanoparticulate system with respect to particle size, PDI, ZP, DEE (%), and mucoadhesive strength. APO concentration was maintained constant at 2 mg/mL in all formulations, which is the maximum value recorded according to the solubility data.40 The following parameters were evaluated to clarify the effect of interaction between COS and TPP on NPs properties.
DEE
Table 1, interestingly, reveals that the concentration of both COS and TPP dictate (in antagonist mode) the outcome values of DEE (%), particle size, as well as mucin-binding efficiency of the NPs (F1 and F4). It might be speculated that high concentration of COS in the presence of low concentration of TPP indorsed the interaction between COS and APO slowly, resulting in high DEE (%) and binding efficiency of the small particle size (F4). However, with F1, the lower concentration of COS was captured rapidly by the high one of TPP, therefore, the chance for APO to be encapsulated was reduced. As a result, particle size increased, while mucin-binding efficiency decreased.
Particle size, PDI, and ZP measurements
Particle size is one of the main important determinants in mucosal and epithelial tissue uptake of NPs, as well as their intracellular trafficking, thereby influencing the therapeutic performance.41 The data elucidated that an increment in the concentration of the polymer and reduction of that of TPP resulted in a dramatic drop in the particle size of the medicated COS-NPs from 904.20±23.01 to 436.20±24.45 nm in case of F1 and F4, respectively (Table 1). Such decrease in particle size might be assigned to a higher degree of cross-linking reactions and production of compact NP structure.28,42
The index of particle size distribution is expressed as PDI. It has an impact on the pharmacokinetic parameters and the therapeutic efficacy of the medicated NPs formulations based on its value, ranging from 0 to 1. PDI values lower than 0.5 indicate homogenous nature of the dispersion and those greater than 0.5 indicate a heterogeneous one. Unequal particle size (PDI ˃0.5) can influence the surface area of NPs available for absorption and hence can cause irregularity of the pharmacokinetic parameters with subsequent effect on the therapeutic efficacy of the formulation.43 In our study, most of the NPs formulations had PDI values lower than 0.5, pointing to their homogenous (narrow-size) distribution.
ZP is a prime parameter representing the surface charge density of NPs, which strongly influences their stability, mucoadhesive property, and cellular uptake ability.1,7 As summarized in Table 1, the ZP values of all the prepared formulae were positively charged with the maximum one obtained in case of F4 (+38.20±1.47 mV). Such a trend could be correlated to the existence of free protonated amino groups (-NH3+) of COS polymer which are specifically more available in case of F4 with higher polymer concentration, hence leading to much stronger electrostatic repulsion between NPs. These data are in concordance with other investigations.24,43 In general, ZP values higher than +30 mV or lower than – 30 mV elicit good stability of the NPs owing to the electrostatic repulsion between each other.44,45
Mucoadhesive strength
Possession of mucoadhesive properties has a great influence on broadening the scope of application of PNPs. In the present work, APO-loaded COS-NPs formulations exhibited marked increase in the mucin-binding efficiency (%) concomitant with the increment in the ZP values as presented in Table 1. F4 with ZP of +38.20±1.47 mV, possessed the maximum mucin-binding efficiency (%) (51.22±2.99%). The mucoadhesive characteristics of COS are correlated with the electrostatic interaction between the positively charged amino groups of COS and negatively charged sialic acid groups of mucin.24 Such interaction promotes the gastric residence time and cellular uptake of NPs, which is essential for effective mucosal delivery of therapeutics.1 Compared with the mucoadhesive strength of the medicated formula (F4), the corresponding plain COS-NPs showed higher value (62.70±3.07%) because of the presence of more COS available for interaction with mucin.43 There is ample evidence attesting to the effect of CS type, MW, and degree of deacetylation as well as PNPs components on the mucoadhesive characteristics of CS NPs.24,46
The aforementioned data, with all appreciated values of the properties required in NPs, substantiated that F4 was the chosen formula with respect to maximum DEE (%) of 35.06±1.89%, low particle size of 436.20±24.45 nm, low PDI of 0.390±0.07, high ZP of +38.20±1.47 mV, and high mucoadhesive strength of 51.22±2.99% (Table 1), therefore, it was subjected to the forthcoming evaluations.
FT-IR spectroscopy
The FT-IR spectra of COS-NPs (F4) and their ingredients are presented in Figure 2A. The spectrum of APO displayed all the characteristic bands of the functional groups of the drug: 3384 (phenyl-OH), 3007 (aromatic –H), 2937 (alkane C-H), 2843 (alkane C-H), and 1,660 cm−1 (ketone C=O).40 COS spectrum elicited a strong and broad overlapped peak at 3,449 cm−1 assigned to –NH2 and –OH stretching vibrations. A weak band at 2,885 cm−1 originated from –CH stretching. The absorption bands at 1,629 cm−1 and 1,518 cm−1 were characteristic for the amide I (C=O vibration mode) and amide II (N–H bending vibration mode) of COS, respectively.47 The peak at 1,155 cm−1 pointed to asymmetric stretch of C–O–C. Furthermore, the peak at 1,320 cm−1 for C-N stretching vibration of type I amine was observed.44 TPP spectrum showed a peak at 1,214 that referred to P=O and anther peak at 1,095 cm−1, which could be attributed to P–O–R vibration of the phosphate group.48 The spectrum of the physical mixture of NPs components was similar to that of COS, which might be attributed to dilution of the drug and TPP by the polymer. Plain and medicated NPs spectra were synchronized with each other, where amide I and amide II peaks of COS were shifted, verifying the cross-linking between amino groups of COS and phosphate groups of TPP through ionic interaction.28 Additionally, the characteristic peaks of APO disappeared in medicated NPs spectrum, indicating the drug entrapment in the NPs matrix and the possibility of interaction between APO, specifically, its phenyl –OH group with COS of the NPs. These results correlate with an earlier report.1
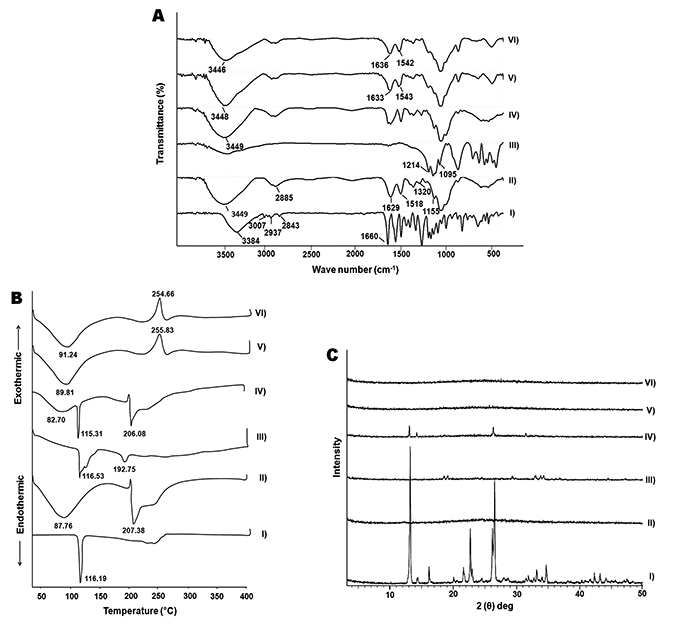 |
Figure 2 FT-IR spectra (A), DSC thermograms (B), and XRD patterns (C). Notes: (I) APO, (II) COS, (III) TPP, (IV) physical mixture, (V) plain COS-NPs, and (VI) APO-loaded COS-NPs (F4). Abbreviations: APO, apocynin; COS, chitosan oligosaccharide; DSC, differential scanning calorimetry; FT-IR, Fourier-transform infrared; NPs, nanoparticles; TPP, tripolyphosphate; XRD, X-ray diffractometry. |
DSC
Figure 2B depicts the DSC thermograms of APO, COS, TPP, and their physical mixture as well as plain and medicated COS-NPs (F4). A characteristic sharp endothermic peak of APO was detected at 116.19°C corresponding to its melting point. COS thermogram disclosed a broad endothermic peak at 87.76°C and another endothermic peak at 207.38°C which might be ascribed to the water evaporation and polymer decomposition, respectively.47 TPP showed two endothermic peaks at 116.53°C and 192.75°C. Regarding the physical mixture, the distinguished endothermic peaks of the components were noticed at their respective positions with marked absence of those of TPP, owing to the dilution factor. Interestingly, both plain and medicated COS-NPs thermograms matched each other, along with vanishing of the decomposition peak of COS. Besides, the disappearance of APO peak was evident in the medicated NPs thermogram suggesting the drug entrapment in the matrix of the polymeric nanoparticulate system.49 Moreover, the noticeable exothermic peaks at 255.83°C and 254.66°C in plain and medicated NPs thermograms, respectively, might be attributed to the cross-linking reactions and formation of new structural entity with specific thermal characteristics. These findings are in line with a previous report.50
XRD
As shown in Figure 2C, APO diffractogram manifested intense diffraction peaks at 2θ of 13.12, 14.32, 21.67, 22.70, 26.22, and 26.56°, thereby indicating the crystalline nature of the drug.40 On the other hand, the amorphous pattern of COS was observed.51 The crystallinity of TPP was revealed by prominent diffraction peaks at 2θ of 18.65, 19.19, 24.62, 29.45, 33.09, 33.94, and 34.39°. In case of the physical mixture, the diffractogram was a combination of those of COS and APO with clear absence of the peaks of TPP due to dilution factor. The diffractogram of the medicated COS-NPs (F4) coincided with that of the plain one, along with disappearance of the characteristic peaks of APO. Hence, the encapsulation of the drug within the COS matrix of the NPs in amorphous or molecular dispersed state exists. Earlier, similar manner was authenticated for other drugs loaded in CS NPs.28,49
TEM
Morphological analysis revealed that APO-loaded COS-NPs (F4) were spherical in shape with smooth surfaces, as observed by TEM (Figure 3). Noteworthy, the particle size of the NPs measured by DLS (436.20 nm) (Table 1) was larger than that estimated by TEM (˂200 nm) because of the presence of NPs as aqueous dispersion in the hydrated state (hydrodynamic diameter), that might lead to swelling of COS matrix of the individual NPs, and/or aggregation of single particles. In case of TEM, these factors are diminished owing to the existence of the NPs in the dried state (actual diameter). Analogous findings and explanations have been documented for other CS-TPP NPs.1,28,52
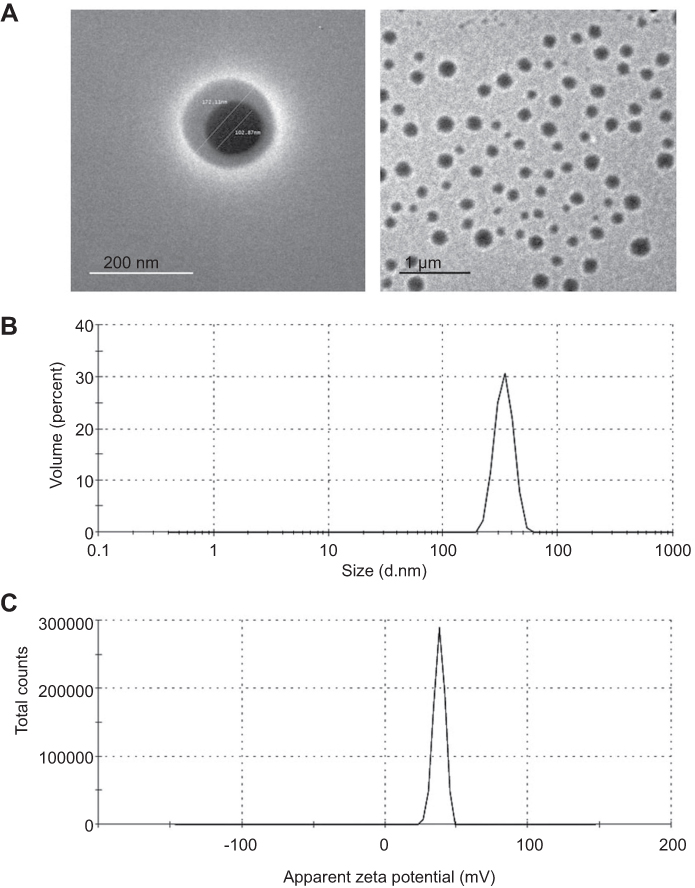 |
Figure 3 TEM images, size and ZP distribution curves of APO-loaded COS-NPs (F4). Notes: (A) TEM images with different magnifications, (B) size distribution curve, and (C) ZP distribution curve.Abbreviations: APO, apocynin; COS, chitosan oligosaccharide; NPs, nanoparticles; TEM, transmission electron microscopy; ZP, zeta potential. |
In vitro drug release
The in vitro release pattern of APO from COS-NPs (F4) in comparison with its diffusion from aqueous solution is depicted in Figure 4 using 0.1 M HCl (pH 1.2) as a release medium to mimic the gastric environment. It was evident that the drug was completely diffused (100%) from its aqueous solution into the release medium within 1 hour. Such pattern could be related to the amphoteric nature of free APO that permits its solubility in both acidic and basic media. Therefore, in acidic pH, formation of hydrogen bond between phenolic OH group of APO and water (H2O) molecules of the medium may boost the complete diffusion of the free drug.19 On the other hand, APO loaded in COS-NPs exhibited biphasic release pattern characterized by initial burst phase (33.69±0.525%) in the first 3 hours followed by sustained phase (43.89±0.115%) up to 24 hours. Free drug adsorbed onto the NPs surface and drug entrapped near the surface may account for the initial burst release.44,45 The sustained release pattern is presumably due to swelling of the polymer matrix based on the weak basic nature of COS that facilitates the protonation of its amino groups in the acidic environment leading to repulsion of polymer chains, with subsequent entry of water into the particles and slow diffusion of APO from the polymeric nanoparticulate matrix.6 Owing to the preparation of NPs by ionic gelation method and swelling characteristics of the polymer, NPs could be considered as nanogel or nanoscaffold delivery systems. Collectively, these results imply that orally administered APO-loaded COS-NPs can quickly confer therapeutic concentration of the drug through initial burst release. This is further maintained at the therapeutic level by the sustained release phase. Such suggestion resembles an earlier study.45
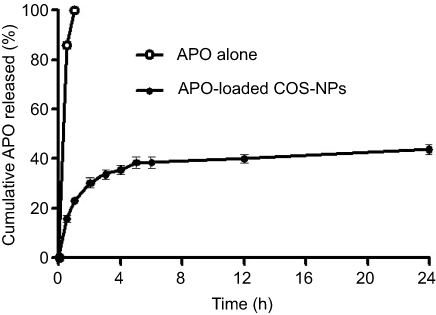 |
Figure 4 The in vitro release pattern of APO from COS-NPs (F4) in comparison with its diffusion from aqueous solution. Note: Each point represents the mean ± SD (n=3). Abbreviations: APO, apocynin; COS, chitosan oligosaccharide; NPs, nanoparticles. |
Kinetic analysis of the drug release data
The kinetic release data of APO from the chosen COS-NPs implied that Higuchi model was the best fitted one (diffusion of the drug through the PNPs matrix represents the rate limiting step). Further analysis by Korsmeyer-Peppas empirical equation established a Fickian mechanism (n<0.5), indicating that the drug release from NPs was mainly governed by diffusion (Table 2). Likewise, other drugs loaded in CS-NPs followed the same kinetic behavior.2,52
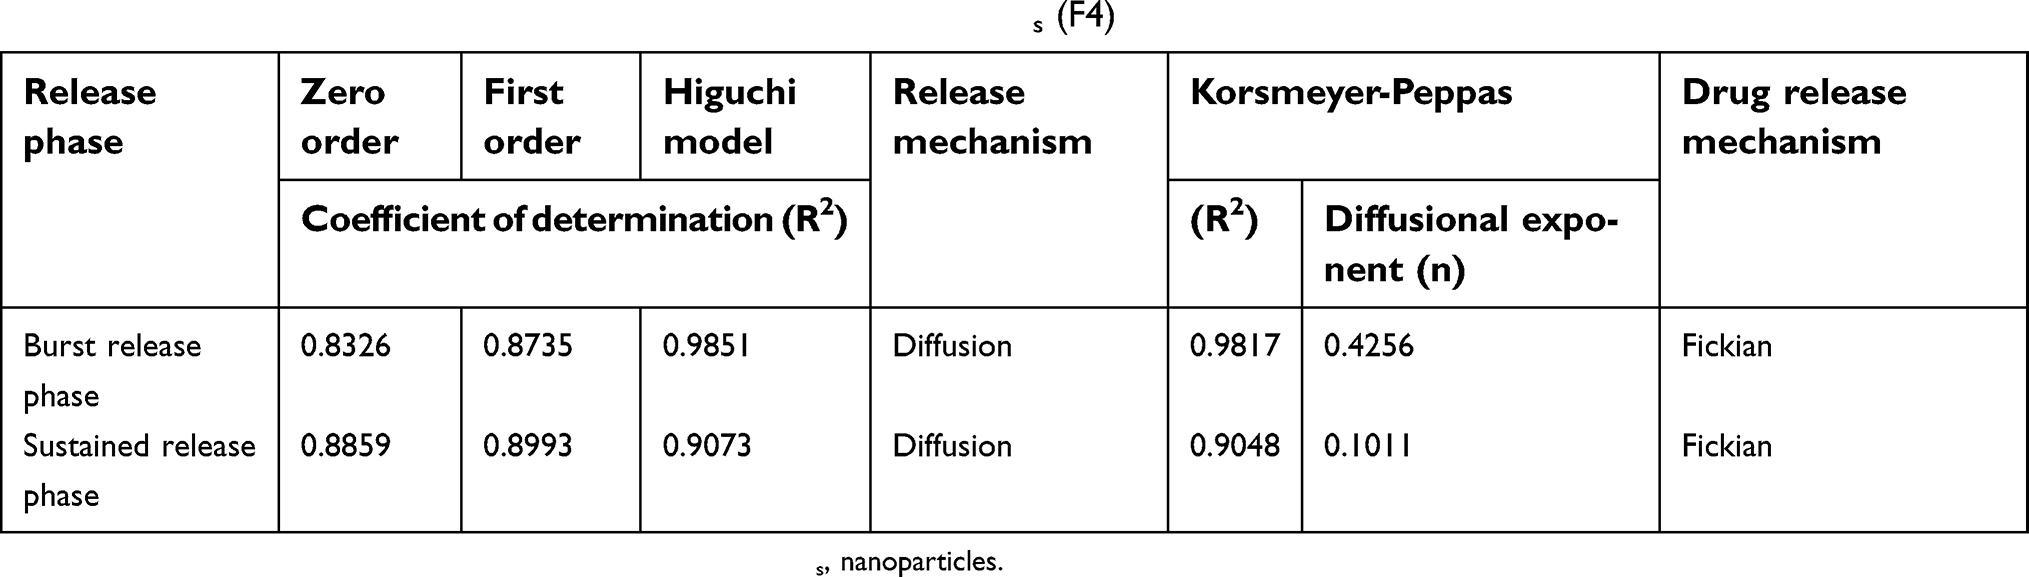 |
Table 2 Kinetic analysis of the release data of APO from COS-NPs (F4) |
Stability study
As summarized in Table 3, the stability of the chosen formula (F4) after storage at both refrigerated and room temperatures was estimated with respect to particle size, PDI, ZP, and drug retention (%) for 6 consecutive months. Compared with the freshly prepared APO-loaded COS-NPs samples, insignificant difference was detected regarding the evaluation parameters after storage at refrigerated temperature throughout the designated periods. On the other hand, at room temperature storage, significant (p˂0.05) increment in particle size and decrease in ZP were recorded, while other parameters were in the acceptable range. These data highlighted the superlative stability of the chosen formula at 4°C, hence maintaining its efficacy for a long-term storage period. Fan et al declared similar findings with respect to the storage stability study of CS/TPP NPs at the same designated temperatures.53
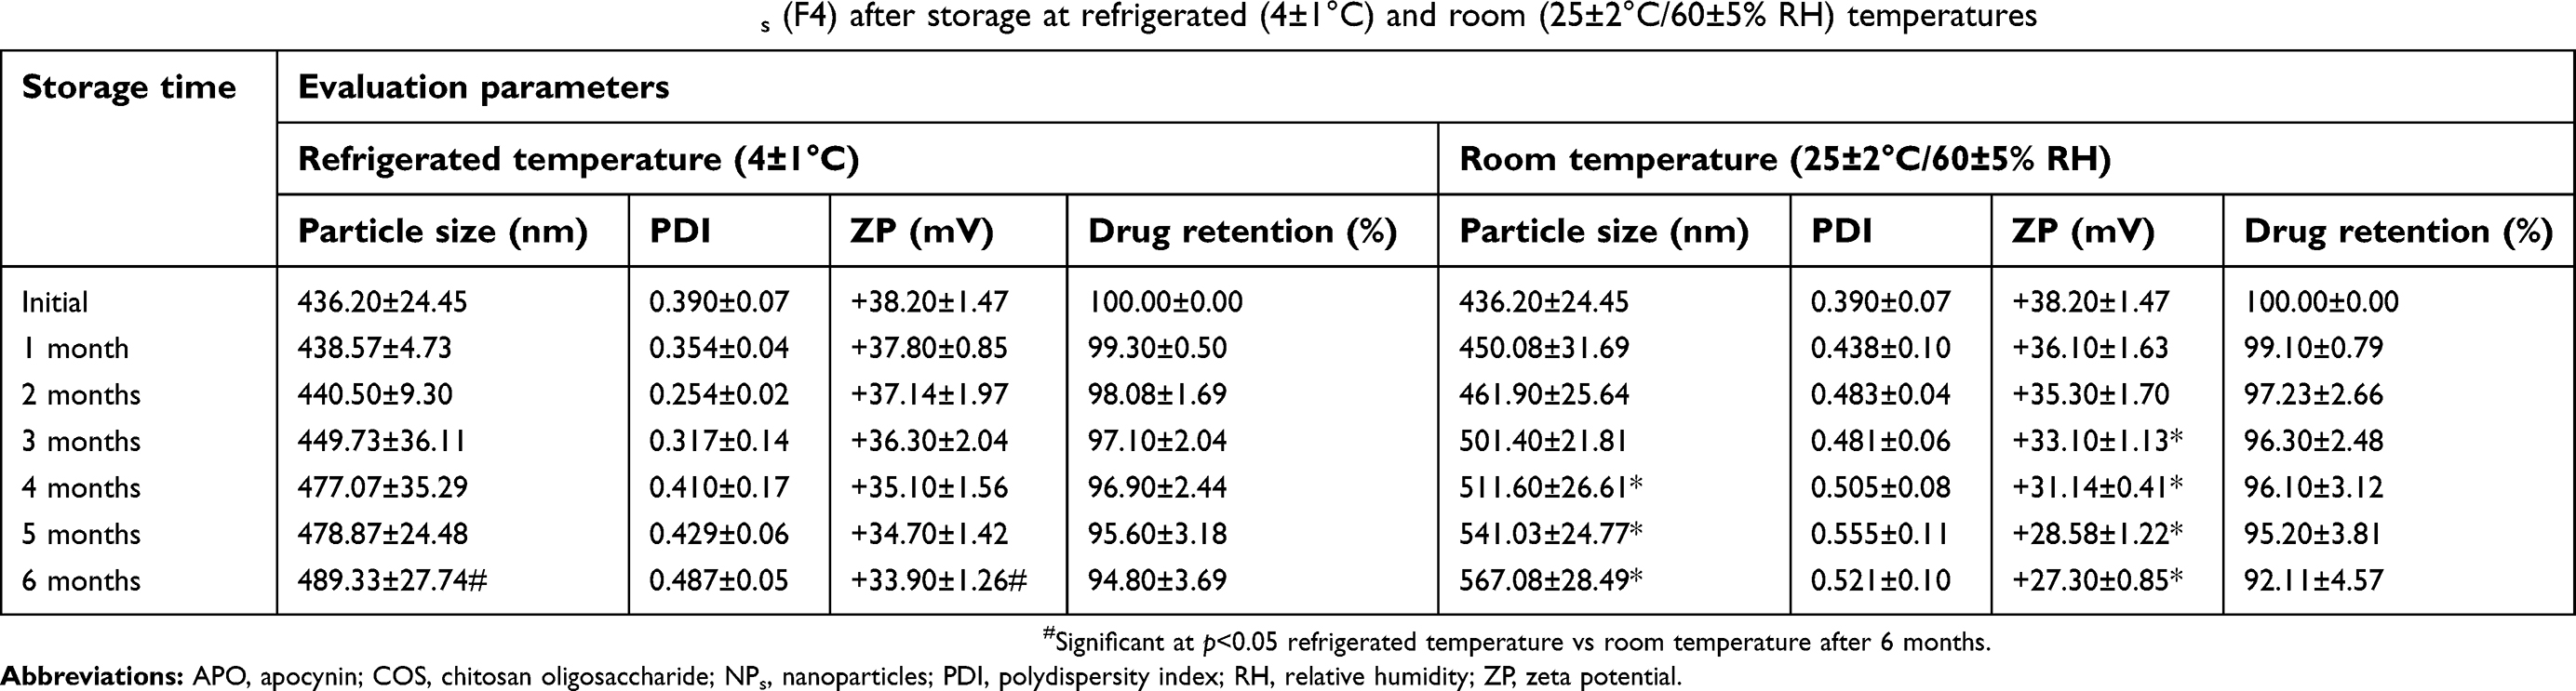 |
Table 3 Stability study data of APO-loaded COS-NPs (F4) after storage at refrigerated (4±1°C) and room (25±2°C/60±5% RH) temperatures |
Evaluation of AA against KP-induced gastric ulcer in rats
Macroscopic examination of gastric ulceration
KP-induced gastric ulcer in rats is considered an established model for screening the AA of the investigated drugs either free or loaded in pharmaceutical delivery systems. As documented, KP causes gastric ulceration via numerous mechanisms encompassing, suppressed prostaglandins' (PGs) production, decreased gastric mucous secretion, altered mucosal oxidative stresses, and NO levels as well as stimulated COX-2 and other inflammatory mediators' expression levels.31,32
Figure 5 illustrates macroscopic gross appearance of gastric mucosal tissues obtained from different rat groups following concurrent induction and treatment regimen as well as post-treatment regimen. Besides, macroscopic evaluation parameters of ulceration were summarized in Table 4 for both treatment regimens.
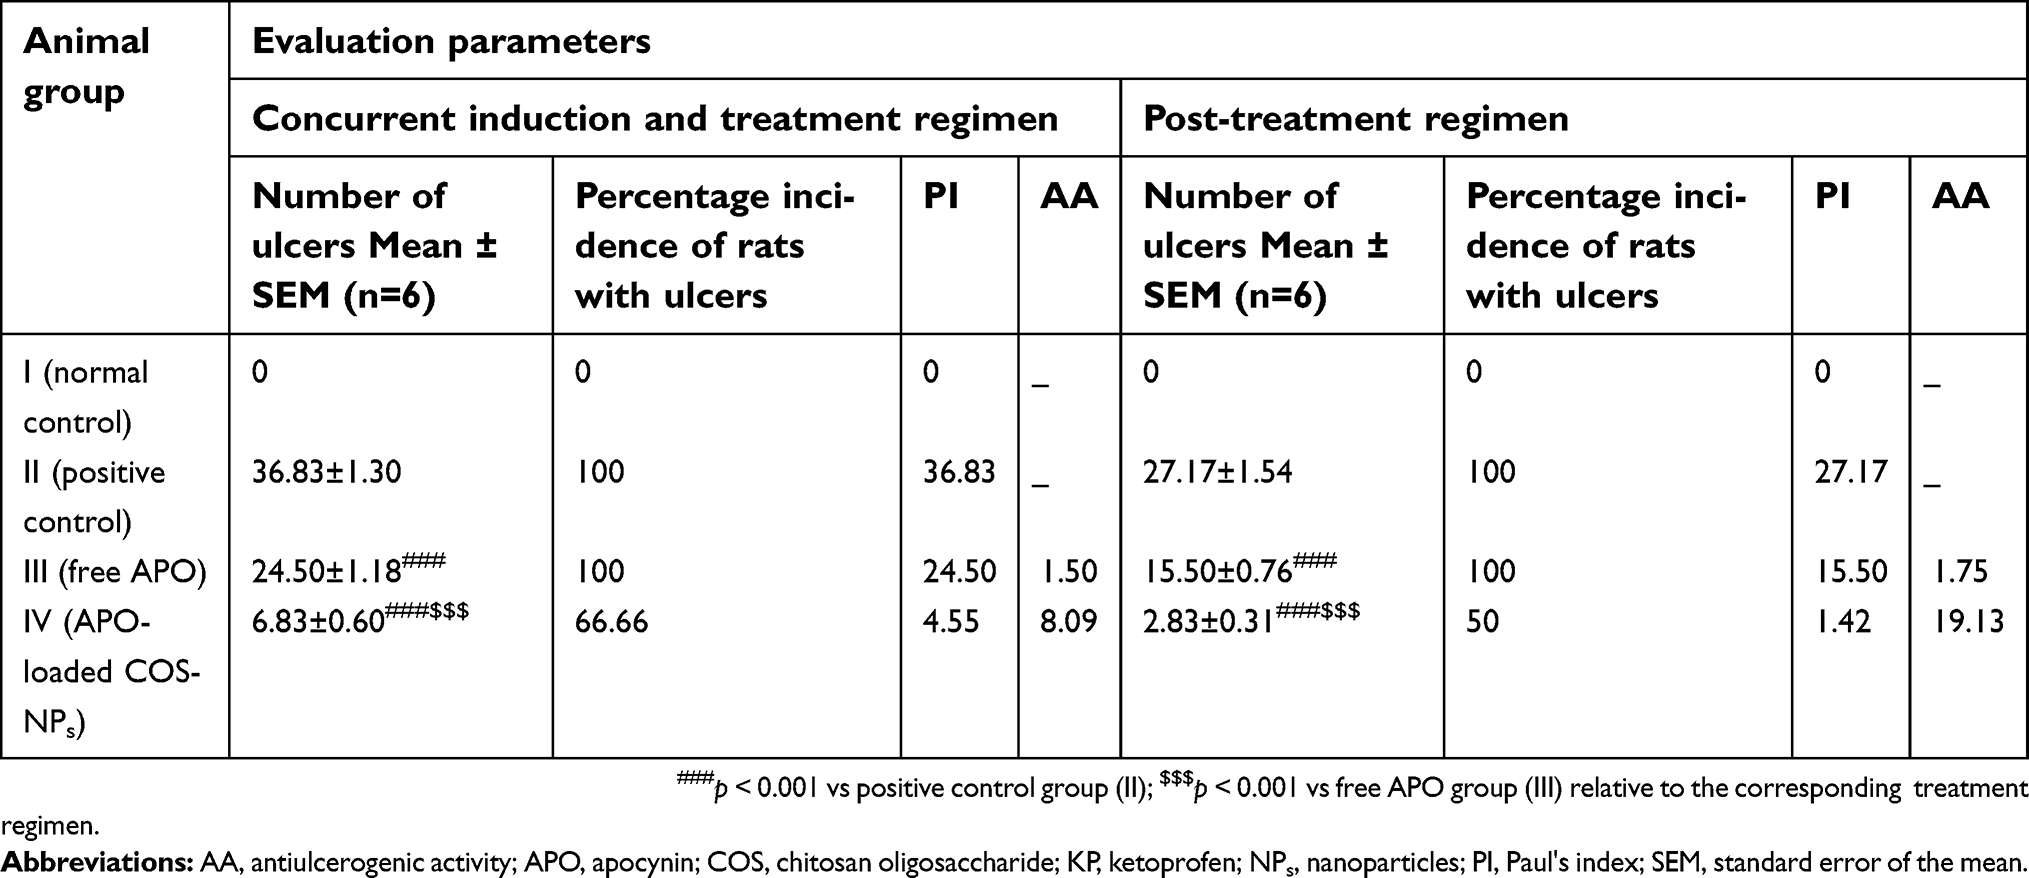 |
Table 4 Macroscopic evaluation parameters of concurrent induction and treatment regimen and post-treatment regimen aganist KP-induced gastric ulcer in rats |
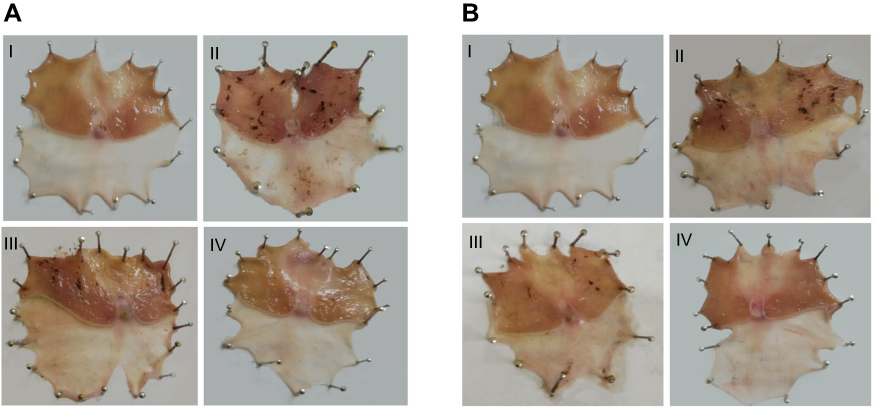 |
Figure 5 Macroscopic gross appearance of gastric mucosal tissues following (A) concurrent induction and treatment regimen and (B) post-treatment regimen. Notes: (I) Normal control group, (II) positive control group, (III) free APO treated group, and (IV) APO-loaded COS-NPs (F4) treated group. Oral dose of free or loaded APO was 14 mg/kg. Abbreviations: APO, apocynin; COS, chitosan oligosaccharide; NPs, nanoparticles. |
In case of concurrent induction and treatment regimen (Figure 5A), normal control group (I) elicited normal gastric mucosa. On the other hand, oral KP administration of two successive doses 8 hours apart (positive control; group II) provoked exacerbated gastric ulcerogenic lesions in the form of multiple black spots. Therefore, such group experienced a high percentage incidence of ulcers (100%) and the highest PI value (36.83) (Table 4). Compared with positive control group, ulcerogenic lesions were relatively reduced in rats that received concurrent administration of KP and APO (group III), but the percentage incidence of ulcers (100%) and PI (24.50) were still high. Interestingly, much less ulceration was observed in APO-loaded COS-NPs concurrently treated rats (group IV), expressed by marked reduction of percentage incidence of ulcers (66.66%) and lowest PI (4.55) compared with both positive control group (II) and free APO concurrently treated group (III). It might be inferred from Table 4 that the NPs (group IV) taken once acted as a depot in the stomach mucosa for APO sustained release, ameliorating the AA even when KP was administered to the rats in two consecutive doses 8 hours apart. These aforementioned results could be considered a therapeutic “cherish” for those patients on KP treatment for long periods as analgesic or anti-inflammatory. One might look to the prepared NPs as a “scaffold” for APO sustained release in the gastric mucosa?
Similar macroscopic findings were manifested in post-treatment regimen of rat groups (Figure 5B). Table 4 depicts that consecutive administration of APO-loaded COS-NPs (group IV) once daily for 4 days after once dosing with KP (post-treatment regimen) resulted in a significant decrease in the average number of ulcers and the percentage incidence of rats with ulcers. This means that progress in recovery from an already existing gastric ulcer can take place by repeated administration of once daily NPs. Compared with free APO, NPs had the highest efficacy and strength. As reported, the AA is acceptable if its value is (at least) two units.35,36 Thence, APO-loaded COS-NPs treated group in both treatment regimens showed potentiated AA expressed by higher AA values (AA =8.09, 19.13) relative to those of free APO treated groups (AA =1.50, 1.75) in case of concurrent and post-treatment regimens, respectively (Table 4). These findings conferred preliminary screening for the gastric AA of medicated COS-NPs which would be further emphasized by histopathological, IHC, and biochemical studies.
Histopathological examination
H&E stain
Regarding concurrent induction and treatment regimen (Figure 6A), normal glandular mucosa and submucosa were observed in gastric tissue of normal control group (I). In contrast, positive control rats exhibited extensive areas of erosions, ulcerations, degeneration, and necrosis of the mucosal epithelial cells as well as thickened submucosa with severe congestion, marked leukocytic cells infiltration, and edema (II). Reduced thickness of mucosa due to loss of superficial epithelial layers, congested blood vessels, edema, and mild leukocytic cells' infiltration in submucosa were observed in rats that received free APO (III). Meanwhile, mucosa and submucosa retained their normal structures in APO-loaded COS-NPs treated group (IV).
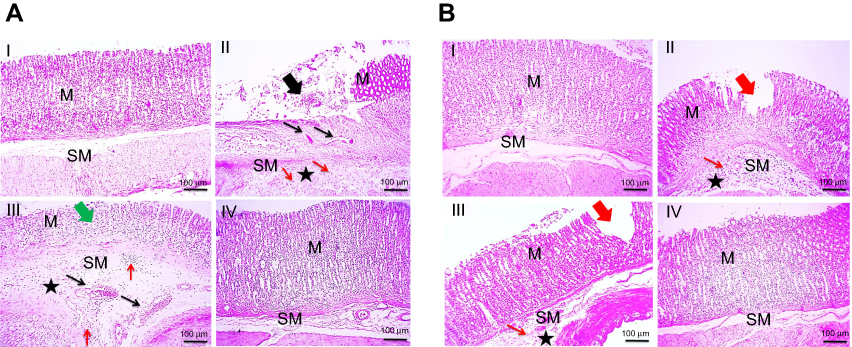 |
Figure 6 Histopathological examination of glandular stomach of rats following (A) concurrent induction and treatment regimen and (B) post-treatment regimen. Notes: (I) Normal control group, (II) positive control group, (III) free APO treated group, and (IV) APO-loaded COS-NPs (F4) treated group. Oral dose of free or loaded APO was 14 mg/kg. Thick black arrow points to extensive areas of ulceration. Thick green arrow points to decreased thickness of mucosa due to loss of superficial epithelial layers. Thick red arrows point to focal erosion. Thin black arrows point to congested blood vessels. Thin red arrows point to leukocytic cells' infiltration. Asterisk points to edema. H&E, 100×.Abbreviations: APO, apocynin; COS, chitosan oligosaccharide; M, mucosa; H & E, hematoxylin and eosin; NPs, nanoparticles; SM, submucosa. |
In case of post-treatment regimen (Figure 6B), no histopathological alterations were noticed in stomach tissue of normal control rats (I). On the contrary, the stomach of positive control group showed multifocal areas of erosions, ulcerations, degeneration, and necrosis of the mucosal epithelial cells along with moderate submucosal congestion, marked leukocytic cells' infiltration, and edema (II). Focal areas of small erosions were observed in mucosa with mild leukocytic cells' infiltration and edema in submucosa of APO post-treated rats (III). Obviously, the gastric tissue retained its normal histopathological integrity in APO-loaded COS-NPs post-treated rats (IV). Noteworthy, the histopathological examination was consistent with PI of different rat groups supporting the potentiated AA of the medicated COS-NPs.
Alcian blue stain
Histochemical staining of stomach tissues using alcian blue stain for detection of mucus glycoproteins is presented in Figure 7. Rat groups that followed the concurrent treatment regimens (Figure 7A) revealed that normal surface and mucosal glycoproteins' deposition was observed in normal control group (I). Loss of glycoproteins' secretion was detected nearby ulcer and erosion in both positive control and free APO concurrent treated rats (II and III, respectively). Surprisingly, medicated COS-NPs group preserved normal gastric mucosal glycoproteins' deposition (IV). Similar histochemical staining data were noticed in animals that received the post-treatment regimen (Figure 7B).
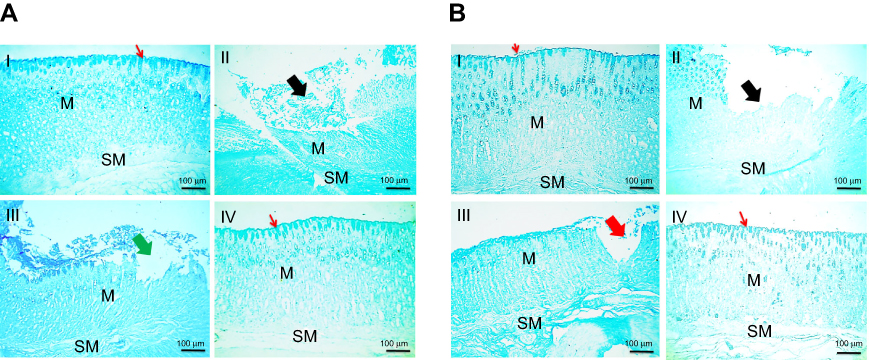 |
Figure 7 Histochemical staining of glandular stomach of rats with alcian blue stain following (A) concurrent induction and treatment regimen and (B) post-treatment regimen. Notes: (I) Normal control group, (II) positive control group, (III) free APO treated group, and (IV) APO-loaded COS-NPs (F4) treated group. Oral dose of free or loaded APO was 14 mg/kg. Thick black arrows point to loss of glycoproteins' secretion in mucosa near ulcer. Thick green arrow points to loss of glycoproteins' secretion in mucosa near erosion. Thick red arrow points to decreased glycoproteins' deposition in mucosa near erosion. Thin red arrows point to continued surface glycoproteins. Alcian blue stain, 100×.Abbreviations: APO, apocynin; COS, chitosan oligosaccharide; M, mucosa; NPs, nanoparticles; SM, submucosa. |
Indeed, mucus glycoproteins have a pivotal defense mechanism in protection against gastric ulceration through formation of a viscoelastic mucus gel layer which protects and lubricates the underlying epithelium of gastric tissue.54 The pronounced effect of the medicated NPs to restore and retain the mucus glycoproteins could be relevant to the benefits of both APO and COS,firstly, the ability of orally administered APO to increase the gastric mucin content in case of ulceration,27 and in addition, the mucoadhesive property of COS.24 In our study, such mucoadhesiveness was greatly supported by in vitro-in vivo correlation results (in vitro mucin-binding efficiency [%] as summarized in Table 1 and in vivo histochemical staining of mucus glycoproteins).
Toluidine blue staining
For detection of mast cells, gastric tissues of rats were stained with toluidine blue as illustrated in Figure 8. In case of concurrent induction and treatment regimen (Figure 8A), the number of mast cells markedly increased in the submucosa of both positive control and free APO treated groups, particularly in underlining area of mucosal damage (II and III, respectively) in comparison with those of normal and medicated NPs treated animals (I and IV, respectively). On the other hand, in post-treatment regimen (Figure 8B), positive control rats manifested mild increase in the number of mast cells (II), whereas few numbers of mast cells were observed in the other investigated groups (I, III, and IV). The fluctuation in the degree of increment of mast cells in the positive control groups in both treatment regimens could be linked with the induction dose of KP (two successive doses vs one dose in concurrent and post-treatment regimens, respectively). Mast cells are the key inflammatory cells which, upon activation by various stimuli, release a variety of mediators such as leukotrienes, histamine, and platelet activating factor, contributing to gastric mucosal injury and ulceration.38 The concomitant increment in mast cells upon induction with KP could be explained on the basis that nonsteroidal anti-inflammatory drugs decrease PGs which are extremely potent inhibitors of mast cell degranulation.55 The anti-inflammatory effect of APO15–17 that seems to be further potentiated upon loading in COS-NPs might account for the reduction in mast cell numbers and degranulation.
 |
Figure 8 Histochemical staining of glandular stomach of rats with toluidine blue stain following (A) concurrent induction and treatment regimen and (B) post-treatment regimen. Notes: (I) Normal control group, (II) positive control group, (III) free APO treated group, and (IV) APO-loaded COS-NPs (F4) treated group. Oral dose of free or loaded APO was 14 mg/kg. Thick black arrows point to mucosal damage. Thin black arrows in insert point to mast cells. Thin red arrows point to leukocytic cells' infiltration. Toluidine blue stain, 100× and insert 200×. Abbreviations: APO, apocynin; COS, chitosan oligosaccharide; M, mucosa; NPs, nanoparticles; SM, submucosa. |
IHC detection of COX-2 expression
The IHC evaluation of gastric COX-2 expression is shown in Figure 9. Regarding concurrent induction and treatment regimen (Figure 9A), positive control group exhibited strong COX-2 expression in area of mucosal damage as well as epithelial cells near area of mucosal damage and underlining submucosa (II). Gastric tissue sections from APO concurrent treated rats showed focal positive signal of COX-2 expression in area of mucosal damage staining epithelial cells and infiltrated leukocytes (III). Like normal control group (I), weak positive signal of COX-2 expression appeared in few epithelial cells of rats that received APO-loaded COS-NPs (IV). Similar findings were noticed for post-treatment regimen (Figure 9B).
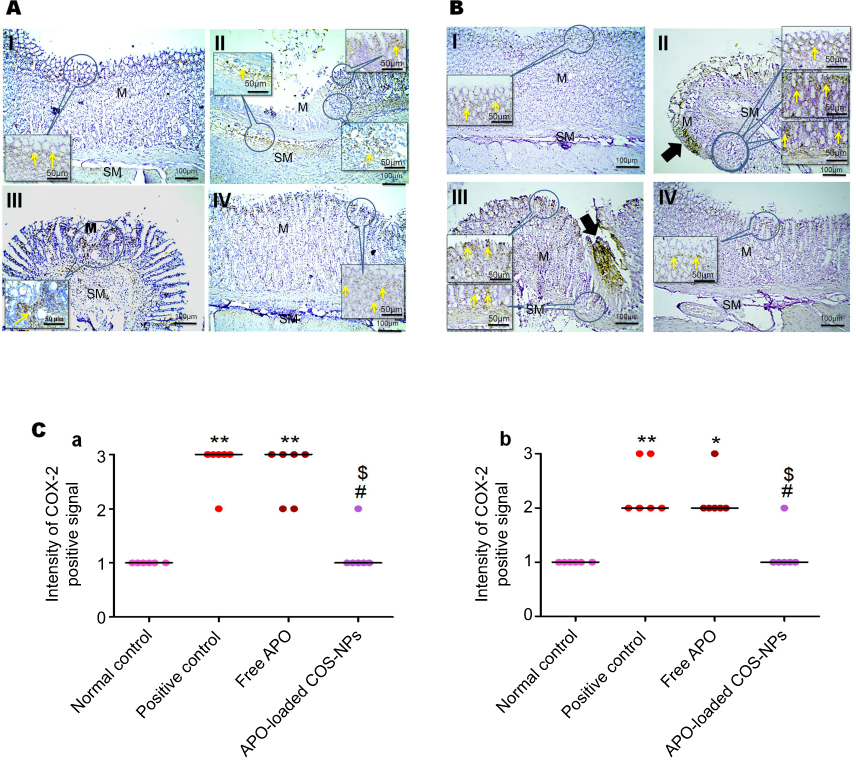 |
Figure 9 Positive signal for IHC staining of COX-2 in rats’ gastric tissues following (A) concurrent induction and treatment regimen and (B) post-treatment regimen. Statistical analysis of intensity of COX-2 positive signal in rats’ gastric tissues (C) following (a) concurrent induction and treatment regimen and (b) post-treatment regimen. Notes: (I) Normal control group, (II) positive control group, (III) free APO treated group, and (IV) APO-loaded COS-NPs (F4) treated group. Oral dose of free or loaded APO was 14 mg/kg. Thick black arrows point to strong COX-2 expression in areas of mucosal necrosis. Yellow arrows in insert point to positive signal. IHC counterstained with Mayer’s hematoxylin, 100× and insert 200×. Kruskal–Wallis test (non-parametric test) was applied followed by Dunn's multiple comparison test. *p<0.05 and **p<0.01 vs normal control group. #p<0.05 vs positive control group. $p<0.05 APO-loaded COS-NPs (F4) treated group vs free APO treated group.Abbreviations: APO, apocynin; COS, chitosan oligosaccharide; COX-2, cyclooxygenase-2; IHC, immunohistochemical; M, mucosa; NPs, nanoparticles; SM, submucosa. |
Statistical analysis of positive signal expression of COX-2 in both treatment regimens elucidated its significant decrement in rats that received medicated COS-NPs when compared with positive control or free APO treated groups (Figure 9C a and b).
According to reported investigations, the integrated capability of both APO and COS combination to downregulate the COX-2 expression evoked by several stimuli, could explain the pronounced effect of medicated COS-NPs.10,56,57
Biochemical studies
Measurement of oxidative stress markers
Oxidative stresses are critically implicated in the pathogenesis of gastric ulceration.58 The gastric tissue levels of oxidative stresses (MDA, SOD, and GSH) in both treatment regimens are shown in Figure 10. The data demonstrated that orally administered KP (positive control groups) induced highly significant elevated MDA levels (p˂0.001) along with depleted SOD and GSH levels (p˂0.001) in comparison with normal control animals. Moreover, the free APO treated groups did not elicit any significant change relative to positive control groups. Noteworthy, the APO-loaded COS-NPs treated groups had greatly normalized oxidative stress levels (p˂0.001) as compared with positive control groups. Besides, their superlative significant effect over that of free APO treated ones was prominently evident. Such effect might be mediated via the anti-oxidant activity of APO (a specific NADPH oxidase inhibitor)18 which seems to be augmented upon formulation as a nanoparticulate delivery system. Also, the anti-oxidant property of COS cannot be ignored.9
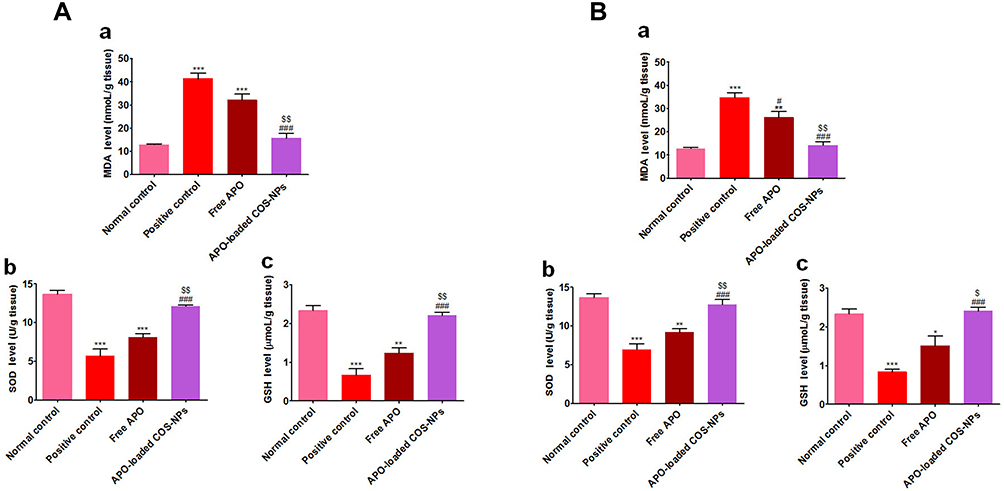 |
Figure 10 Levels of oxidative stress markers in rats’ gastric tissues following (A) concurrent induction and treatment regimen and (B) post-treatment regimen. Notes: (a) MDA, (b) SOD, and (c) GSH. Data are mean ± SEM (n=6). * p<0.05, **p<0.01 and ***p<0.001 vs normal control group. #p<0.05 and ###p<0.001 vs positive control group. $p<0.05 and $$p<0.01 APO-loaded COS-NPs (F4) treated group vs free APO treated group.Abbreviations: APO, apocynin; COS, chitosan oligosaccharide; GSH, reduced glutathione; MDA, malondialdehyde; NPs, nanoparticles; SEM, standard error of the mean; SOD, superoxide dismutase. |
Measurement of NO
The data of both treatment regimens (Figure 11) revealed that rats subjected to KP administration (positive control groups) had a highly significant increment of gastric mucosal NO levels (p˂0.001) as compared with normal rats. Such increment was significantly (p˂0.001) abrogated in rats treated with APO-loaded COS-NPs.
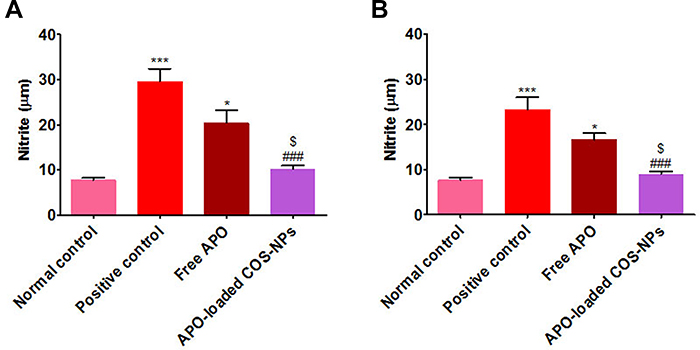 |
Figure 11 Levels of NO in rats’ gastric tissues following (A) concurrent induction and treatment regimen and (B) post-treatment regimen. Notes: Data are mean ± SEM (n=6). *p<0.05 and ***p<0.001 vs normal control group. ###p<0.001 vs positive control group. $p<0.05 APO-loaded COS-NPs (F4) treated group vs free APO treated group.Abbreviations: APO, apocynin; COS, chitosan oligosaccharide; NO, nitric oxide; NPs, nanoparticles; SEM, standard error of the mean. |
Several lines of evidence have demonstrated the defensive role of NO as a gastroprotective mediator against gastric ulceration through enhancement of mucosal blood flow, stimulation of gastric mucus secretion, and reduction of leukocytic cells' infiltration.59–61 Notwithstanding, upregulation or downregulation of NO can cause deleterious gastric mucosal damage.62,63 The marked effectiveness of the medicated COS-NPs could be assigned to the activity of the drug and the polymer in normalizing the upregulated NO content in ulcerated gastric tissue.10,17
Collectively, the previously mentioned in vivo data were in harmony with each other, supporting the potentiated AA of orally administered APO-loaded COS-NPs against KP-induced gastric ulceration in both regimens. Such marvelous AA could be strongly related to several combined factors enumerated as follows: 1) the mucoadhesive property of COS can prolong the gastric residence time of the NPs and subsequently sustain the release of APO and decrease the frequency of dosing;23,24 2) the permeation enhancing characteristic of COS could augment the paracellular uptake of NPs via reversible opening of the tight junctions between epithelial cells as well as the transcellular uptake of NPs across the epithelial cells;7 3) unlike microparticles, the cellular uptake of NPs is much easier for immune cells, like macrophages, in the inflamed area, leading to their selective accumulation in the ulcerative tissues;64,65 4) both APO and COS possess anti-inflammatory and anti-oxidant activities that reflect their pharmacological effect on gastric ulcers.8,9,15–18
Conclusion
In summary, APO-loaded COS-NPs were successfully prepared by ionic gelation method. Maximum DEE % was achieved owing to the electrostatic interaction between the polymer and the drug. The results of FT-IR, DSC, and XRD of the chosen formula confirmed the drug entrapment in the matrix of the polymeric nanoparticulate system. Furthermore, the TEM displayed its nanosized and spherical shape. The in vitro release pattern of APO from COS-NPs exhibited a biphasic pattern (initial burst phase and sustained release phase) that can quickly confer therapeutic concentration of the drug which will be sustained over a long period of time. The prominent in vivo AA of APO-loaded COS-NPs was proven by histopathological, IHC, and biochemical studies. One might look to the prepared NPs as a “scaffold” for APO sustained release in the gastric mucosa. Actually, APO-loaded COS-NPs deserve profound attention for their prospective application as a promising phytopharmaceutical nanoparticulate system for potentiated gastric AA.
Disclosure
The authors report no conflicts of interest in this work.
References
1. Dudhani AR, Kosaraju SL. Bioadhesive chitosan nanoparticles: preparation and characterization. Carbohydr Polym. 2010;81(2):243–251. doi:10.1016/j.carbpol.2010.02.026
2. Patel BK, Parikh RH, Aboti PS. Development of oral sustained release rifampicin loaded chitosan nanoparticles by design of experiment. J Drug Deliv. 2013;2013. doi:10.1155/2013/370938
3. Divya K, Jisha MS. Chitosan nanoparticles preparation and applications. Environ Chem Lett. 2018;16(1):101–112. doi:10.1007/s10311-017-0670-y
4. Grenha A. Chitosan nanoparticles: a survey of preparation methods. J Drug Target. 2012;20(4):291–300. doi:10.3109/1061186X.2011.654121
5. Smith J, Wood E, Dornish M. Effect of chitosan on epithelial cell tight junctions. Pharm Res. 2004;21(1):43–49. doi:10.1023/B:PHAM.0000012150.60180.e3
6. Čalija B, Milić J, Cekić N, Krajišnik D, Daniels R, Savić S. Chitosan oligosaccharide as prospective cross-linking agent for naproxen-loaded Ca-alginate microparticles with improved pH sensitivity. Drug Dev Ind Pharm. 2013;39(1):77–88. doi:10.3109/03639045.2012.658813
7. Ye Y, Xu Y, Liang W, et al. DNA-loaded chitosan oligosaccharide nanoparticles with enhanced permeability across Calu-3 cells. J Drug Target. 2013;21(5):474–486. doi:10.3109/1061186X.2013.766885
8. Muanprasat C, Chatsudthipong V. Chitosan oligosaccharide: biological activities and potential therapeutic applications. Pharmacol Ther. 2017;170:80–97. doi:10.1016/j.pharmthera.2016.10.013
9. Qiao Y, Bai XF, Du YG. Chitosan oligosaccharides protect mice from LPS challenge by attenuation of inflammation and oxidative stress. Int Immunopharmacol. 2011;11(1):121–127. doi:10.1016/j.intimp.2010.10.016
10. Yang EJ, Kim JG, Kim JY, Kim SC, Lee NH, Hyun CG. Anti-inflammatory effect of chitosan oligosaccharides in RAW 264.7 cells. Cent Eur J Biol. 2010;5(1):95–102. doi:10.2478/s11535-009-0066-5
11. Yousef M, Pichyangkura R, Soodvilai S, Chatsudthipong V, Muanprasat C. Chitosan oligosaccharide as potential therapy of inflammatory bowel disease: therapeutic efficacy and possible mechanisms of action. Pharmacol Res. 2012;66(1):66–79. doi:10.1016/j.phrs.2012.03.013
12. Prabhu V, Shivani A. An overview of history, pathogenesis and treatment of perforated peptic ulcer disease with evaluation of prognostic scoring in adults. Ann Med Health Sci Res. 2014;4(1):22–29. doi:10.4103/2141-9248.126604
13. Liu YH, Zhang ZB, Zheng YF, et al. Gastroprotective effect of andrographolide sodium bisulfite against indomethacin-induced gastric ulceration in rats. Int Immunopharmacol. 2015;26(2):384–391. doi:10.1016/j.intimp.2015.04.009
14. Fan R, Shan X, Qian H, et al. Protective effect of apocynin in an established alcoholic steatohepatitis rat model. Immunopharmacol Immunotoxicol. 2012a;34(4):633–638. doi:10.3109/08923973.2011.648266
15. Kinoshita H, Matsumura T, Ishii N, et al. Apocynin suppresses the progression of atherosclerosis in apoE-deficient mice by inactivation of macrophages. Biochem Biophys Res Commun. 2013;431(2):124–130. doi:10.1016/j.bbrc.2012.12.075
16. Marín M, Giner RM, Ríos JL, Recio Mdel C. Protective effect of apocynin in a mouse model of chemically-induced colitis. Planta Med. 2013;79(15):1392–1400. doi:10.1055/s-0033-1350710
17. Hwang YJ, Lee SJ, Park JY, et al. Apocynin suppresses lipopolysaccharide-induced inflammatory responses through the inhibition of MAP kinase signaling pathway in RAW264.7 cells. Drug Dev Res. 2016;77(6):271–277. doi:10.1002/ddr.21321
18. Ximenes VF, Kanegae MP, Rissato SR, Galhiane MS. The oxidation of apocynin catalyzed by myeloperoxidase: proposal for NADPH oxidase inhibition. Arch Biochem Biophys. 2007;457(2):134–141. doi:10.1016/j.abb.2006.11.006
19. Aman RM, Abu Hashim II, Meshali MM. Novel chitosan-based solid-lipid nanoparticles to enhance the bio-residence of the miraculous phytochemical “apocynin”. Eur J Pharm Sci. 2018;124:304–318. doi:10.1016/j.ejps.2018.09.001
20. Brenza TM, Ghaisas S, Ramirez JEV, et al. Neuronal protection against oxidative insult by polyanhydride nanoparticle-based mitochondria-targeted antioxidant therapy. Nanomedicine. 2017;13(3):809–820. doi:10.1016/j.nano.2016.10.004
21. de Oliveira JK, Ronik DF, Ascari J, Mainardes RM, Khalil NM. Nanoencapsulation of apocynin in bovine serum albumin nanoparticles: physicochemical characterization. J Nanosci Nanotechnol Asia. 2018;8(1):90–99. doi:10.2174/2210681206666160822112408
22. Sharma S, Parmar A, Bhardwaj R, Kaur T. Design and characterization of apocynin loaded PLGA nanoparticles and their in vivo efficacy in hyperoxaluric rats. Curr Drug Deliv. 2018;15(7):1020–1027. doi:10.2174/1567201815666180228163519
23. Du YZ, Ying XY, Wang L, et al. Sustained release of ATP encapsulated in chitosan oligosaccharide nanoparticles. Int J Pharm. 2010;392(1–2):164–169. doi:10.1016/j.ijpharm.2010.03.050
24. Dyawanapelly S, Koli U, Dharamdasani V, Jain R, Dandekar P. Improved mucoadhesion and cell uptake of chitosan and chitosan oligosaccharide surface-modified polymer nanoparticles for mucosal delivery of proteins. Drug Deliv Transl Res. 2016;6(4):365–379. doi:10.1007/s13346-016-0295-x
25. Luo Q, Zhao J, Zhang X, Pan W. Nanostructured lipid carrier (NLC) coated with chitosan oligosaccharides and its potential use in ocular drug delivery system. Int J Pharm. 2011;403(1–2):185–191. doi:10.1016/j.ijpharm.2010.10.013
26. Murata M, Nakano K, Tahara K, Tozuka Y, Takeuchi H. Pulmonary delivery of elcatonin using surface-modified liposomes to improve systemic absorption: polyvinyl alcohol with a hydrophobic anchor and chitosan oligosaccharide as effective surface modifiers. Eur J Pharm Biopharm. 2012;80(2):340–346. doi:10.1016/j.ejpb.2011.10.011
27. El-Naga RN. Apocynin protects against ethanol-induced gastric ulcer in rats by attenuating the upregulation of NADPH oxidases 1 and 4. Chem Biol Interact. 2015;242:317–326. doi:10.1016/j.cbi.2015.10.018
28. Papadimitriou S, Bikiaris D, Avgoustakis K, Karavas E, Georgarakis M. Chitosan nanoparticles loaded with dorzolamide and pramipexole. Carbohydr Polym. 2008;73(1):44–54. doi:10.1016/j.carbpol.2007.11.007
29. Higuchi T. Mechanism of sustained‐action medication. Theoretical analysis of rate of release of solid drugs dispersed in solid matrices. J Pharm Sci. 1963;52(12):1145–1149. doi:10.1002/jps.2600521210
30. Korsmeyer RW, Gurny R, Doelker E, Buri P, Peppas NA. Mechanisms of solute release from porous hydrophilic polymers. Int J Pharm. 1983;15(1):25–35. doi:10.1016/0378-5173(83)90064-9
31. Alarcón de la Lastra C, Nieto A, Martin MJ, Cabre F, Herrerias JM, Motilva V. Gastric toxicity of racemic ketoprofen and its enantiomers in rat: oxygen radical generation and COX-expression. Inflamm Res. 2002;51(2):51–57. doi:10.1007/BF02683999
32. Cheng YT, Wu SL, Ho CY, Huang SM, Cheng CL, Yen GC. Beneficial effects of camellia oil (Camellia oleifera Abel.) on ketoprofen-induced gastrointestinal mucosal damage through upregulation of HO-1 and VEGF. J Agric Food Chem. 2014;62(3):642–650. doi:10.1021/jf404614k
33. Hougee S, Hartog A, Sanders A, et al. Oral administration of the NADPH-oxidase inhibitor apocynin partially restores diminished cartilage proteoglycan synthesis and reduces inflammation in mice. Eur J Pharmacol. 2006;531(1–3):264–269. doi:10.1016/j.ejphar.2005.11.061
34. El-Kamel AH, Sokar MS, Al Gamal SS, Naggar VF. Evaluation of stomach protective activity of ketoprofen floating microparticles. Indian J Pharm Sci. 2003;65(4):399–401.
35. Elmowafy EM, Awad GAS, Mansour S, El-Shamy AA. Ionotropically emulsion gelled polysaccharides beads: preparation. in vitro and in vivo evaluation. Carbohydr Polym. 2009;75(1):135–142. doi:10.1016/j.carbpol.2008.07.019
36. Mohamed EA, Abu Hashim II, Yusif RM, et al. Polymeric micelles for potentiated antiulcer and anticancer activities of naringin. Int J Nanomedicine. 2018;13:1009–1027. doi:10.2147/IJN.S177627
37. Bancroft JD, Gamble M. Theory and Practice of Histological Techniques.
38. Al Asmari A, Al Shahrani H, Al Masri N, Al Faraidi A, Elfaki I, Arshaduddin M. Vanillin abrogates ethanol induced gastric injury in rats via modulation of gastric secretion, oxidative stress and inflammation. Toxicol Rep. 2016;3:105–113. doi:10.1016/j.toxrep.2015.11.001
39. Fisher ER, Anderson S, Dean S, et al. Solving the dilemma of the immunohistochemical and other methods used for scoring estrogen receptor and progesterone receptor in patients with invasive breast carcinoma. Cancer. 2005;103(1):164–173. doi:10.1002/cncr.21069
40. Anter HM, Abu Hashim II, Awadin W, Meshali MM. Novel anti-inflammatory film as a dosage form for the external medication with bioactive phytochemical “apocynin”. Drug Des Devel Ther. 2018;12:2981–3001. doi:10.2147/DDDT.S176850
41. Panyam J, Labhasetwar V. Biodegradable nanoparticles for drug and gene delivery to cells and tissue. Adv Drug Deliv Rev. 2003;55(3):329–347. doi:10.1016/S0169-409X(02)00228-4
42. Zhang H, Oh M, Allen C, Kumacheva E. Monodisperse chitosan nanoparticles for mucosal drug delivery. Biomacromolecules. 2004;5(6):2461–2468. doi:10.1021/bm0496211
43. Md S, Khan RA, Mustafa G, et al. Bromocriptine loaded chitosan nanoparticles intended for direct nose to brain delivery: pharmacodynamic, pharmacokinetic and scintigraphy study in mice model. Eur J Pharm Sci. 2013;48(3):393–405. doi:10.1016/j.ejps.2012.12.007
44. Nallamuthu I, Devi A, Khanum F. Chlorogenic acid loaded chitosan nanoparticles with sustained release property, retained antioxidant activity and enhanced bioavailability. Asian J Pharm Sci. 2015;10(3):203–211. doi:10.1016/j.ajps.2014.09.005
45. Sun L, Chen Y, Zhou Y, et al. Preparation of 5-fluorouracil-loaded chitosan nanoparticles and study of the sustained release in vitro and in vivo. Asian J Pharm Sci. 2017;12(5):418–423. doi:10.1016/j.ajps.2017.04.002
46. Honary S, Maleki M, Karami M. The effect of chitosan molecular weight on the properties of alginate/chitosan microparticles containing prednisolone. Trop J Pharm Res. 2009;8(1):53–61. doi:10.4314/tjpr.v8i1.14712
47. Li F, Li S, Jiang T, Sun Y. Syntheses and characterization of chitosan oligosaccharide-graft-polycaprolactone copolymer I thermal and spherulite morphology studies. Adv Mat Res. 2011;183–185:155–160. doi:10.4028/www.scientific.net/AMR.183-185.155
48. Gurses MS, Erkey C, Kizilel S, Uzun A. Characterization of sodium tripolyphosphate and sodium citrate dehydrate residues on surfaces. Talanta. 2018;176:8–16. doi:10.1016/j.talanta.2017.07.092
49. Harisa GI, Badran MM, Attia SM, Alanazi FK, Shazly GA. Influence of pravastatin chitosan nanoparticles on erythrocytes cholesterol and redox homeostasis: an in vitro study. Arab J Chem. 2018;11(8):1236–1246. doi:10.1016/j.arabjc.2015.10.016
50. Shaji J, Shaikh M. Formulation, optimization, and characterization of biocompatible inhalable d-cycloserine-loaded alginate-chitosan nanoparticles for pulmonary drug delivery. Asian J Pharm Clin Res. 2016;9(2):82–95. doi:10.22159/ajpcr.2016.v9s2.11814
51. Mourya V, Inamdar N, Choudhari YM. Chitooligosaccharides: synthesis, characterization and applications. Polym Sci A. 2011;53(7):583–612. doi:10.1134/S0965545X11070066
52. Keawchaoon L, Yoksan R. Preparation, characterization and in vitro release study of carvacrol-loaded chitosan nanoparticles. Colloids Surf B Biointerfaces. 2011;84(1):163–171. doi:10.1016/j.colsurfb.2010.12.031
53. Fan W, Yan W, Xu Z, Ni H. Formation mechanism of monodisperse, low molecular weight chitosan nanoparticles by ionic gelation technique. Colloids Surf B Biointerfaces. 2012b;90(1):21–27. doi:10.1016/j.colsurfb.2011.09.042
54. Prathima S, Harendra Kumar ML. Mucin profile of upper gastrointestinal tract lesions. J Clin Biomed Sci. 2012;2(4):185–191.
55. Zaghlool SS, Shehata BA, Abo-Seif AA, AbdEl-Latif HA. Protective effects of ginger and marshmallow extracts on indomethacin-induced peptic ulcer in rats. J Nat Sci Biol Med. 2015;6(2):421–428. doi:10.4103/0976-9668.160026
56. Barbieri SS, Cavalca V, Eligini S, et al. Apocynin prevents cyclooxygenase 2 expression in human monocytes through NADPH oxidase and glutathione redox-dependent mechanisms. Free Radic Biol Med. 2004;37(2):156–165. doi:10.1016/j.freeradbiomed.2004.04.020
57. Stefanska J, Pawliczak R. Apocynin: molecular aptitudes. Mediators Inflamm. 2008;2008:1–10. ID 106507. doi:10.1155/2008/106507
58. Sidahmed HM, Hashim NM, Amir J, et al. Pyranocycloartobiloxanthone A, a novel gastroprotective compound from Artocarpus obtusus Jarret, against ethanol-induced acute gastric ulcer in vivo. Phytomedicine. 2013;20(10):834–843. doi:10.1016/j.phymed.2012.12.007
59. Bandarage UK, Janero DR. Nitric oxide-releasing nonsteroidal anti-inflammatory drugs novel gastrointestinal-sparing drugs. Mini Rev Med Chem. 2001;1(1):57–70. doi:10.2174/1389557013407160
60. McCarty MF. Dietary nitrate and reductive polyphenols may potentiate the vascular benefit and alleviate the ulcerative risk of low-dose aspirin. Med Hypotheses. 2013;80(2):186–190. doi:10.1016/j.mehy.2012.11.025
61. Ohta Y, Nishida K. Protective effect of L-arginine against stress-induced gastric mucosal lesions in rats and its relation to nitric oxide-mediated inhibition of neutrophil infiltration. Pharmacol Res. 2001;43(6):535–541. doi:10.1006/phrs.2001.0812
62. Katary MA, Salahuddin A. Gastroprotective effect of vanillin on indomethacin-induced gastric ulcer in rats: protective pathways and anti-Secretory mechanism. Clin Exp Pharmacol. 2017;7(2). doi:10.4172/2161-1459.1000232
63. Roveda JAC, Franco DW. Nitric oxide releasing-dendrimers: an overview. Braz J Pharm Sci. 2013;49:1–14. doi:10.1590/S1984-82502013000700002
64. Cortivo R, Vindigni V, Iacobellis L, Abatangelo G, Pinton P, Zavan B. Nanoscale particle therapies for wounds and ulcers. Nanomedicine. 2010;5(4):641–656. doi:10.2217/nnm.10.2
65. Lamprecht A, Ubrich N, Yamamoto H, et al. Design of rolipram-loaded nanoparticles: comparison of two preparation methods. J Control Release. 2001;71(3):297–306. doi:10.1016/S0168-3659(01)00230-9
 © 2019 The Author(s). This work is published and licensed by Dove Medical Press Limited. The full terms of this license are available at https://www.dovepress.com/terms.php and incorporate the Creative Commons Attribution - Non Commercial (unported, v3.0) License.
By accessing the work you hereby accept the Terms. Non-commercial uses of the work are permitted without any further permission from Dove Medical Press Limited, provided the work is properly attributed. For permission for commercial use of this work, please see paragraphs 4.2 and 5 of our Terms.
© 2019 The Author(s). This work is published and licensed by Dove Medical Press Limited. The full terms of this license are available at https://www.dovepress.com/terms.php and incorporate the Creative Commons Attribution - Non Commercial (unported, v3.0) License.
By accessing the work you hereby accept the Terms. Non-commercial uses of the work are permitted without any further permission from Dove Medical Press Limited, provided the work is properly attributed. For permission for commercial use of this work, please see paragraphs 4.2 and 5 of our Terms.