")
Back to Journals » Drug Design, Development and Therapy » Volume 11
New tablet formulation of tacrolimus with smaller interindividual variability may become a better treatment option than the conventional capsule formulation in organ transplant patients
Authors Kim YK , Kim A, Park SJ, Lee H
Received 19 May 2017
Accepted for publication 29 August 2017
Published 28 September 2017 Volume 2017:11 Pages 2861—2869
DOI https://doi.org/10.2147/DDDT.S142201
Checked for plagiarism Yes
Review by Single anonymous peer review
Peer reviewer comments 2
Editor who approved publication: Dr Qiongyu Guo
Yu Kyong Kim,1 Anhye Kim,1,2 Shin Jung Park,3 Howard Lee1,4
1Department of Clinical Pharmacology and Therapeutics, Seoul National University College of Medicine and Hospital, Seoul, 2Clinical Trial Center, Ajou University Medical Center, Suwon, 3Research Institute, Chong Kun Dang Pharmaceutical Corp, Yongin, 4Department of Transdisciplinary Studies, Graduate School of Convergence Science and Technology, Seoul National University, Suwon, Republic of Korea
Abstract: To evaluate the pharmacokinetic (PK) and tolerability profiles of a new tablet formulation of tacrolimus and its interindividual variability (IIV) in the systemic exposure, and to compare them with those of the conventional capsule formulation, a randomized, open-label, two-treatment, two-period, two-sequence, crossover study was performed in 47 healthy males. The capsule or tablet formulation of tacrolimus was orally administered, and serial blood samples were collected up to 96 hours after dosing. Whole-blood tacrolimus concentration was determined using liquid chromatography–tandem mass spectrometry. The maximum whole-blood tacrolimus concentration (Cmax) and the area under the whole-blood tacrolimus concentration–time curve from 0 hour to the last quantifiable concentration (AUClast) were compared between the two formulations. The similarity factor (f2) of the in vitro dissolution profiles was calculated. The geometric mean ratio (90% confidence interval) of tablet to capsule was 0.9680 (0.8873–1.0560) and 1.0322 (0.9359–1.1385) for Cmax and AUClast, respectively. The IIV of Cmax and AUClast of the tablet was smaller than the capsule. The f2 values were >50 in all media. Both formulations were well tolerated. Thus, the tablet formulation of tacrolimus has smaller IIV in the systemic exposure than capsule, while having comparable PK and tolerability profiles, which may render it as a better treatment option for organ transplant patients.
Keywords: new formulation, incrementally modified drug, comparative pharmacokinetics, healthy volunteers, immunosuppressant
Introduction
Tacrolimus, a macrolide antibiotic, has been used as an effective immunosuppressive agent for the prevention of graft rejection after organ or bone marrow transplantations.1 Similar to cyclosporine, tacrolimus is one of the NTI drugs, which have a restricted range of effective dose window that does not produce adverse toxic effects.2 NTI drugs require close monitoring of the patients, particularly when the IIV in their systemic exposure is large, of which tacrolimus is an example3 partly due to its pharmacogenetic polymorphism.4
Developing a new formulation can be a viable strategy to reduce large IIV, particularly for orally administered drugs, such that more consistent dissolution from the dosage form and thereby absorption is ensured.5 For example, poorly water-soluble drugs such as proquazone get dissolved faster in the gastrointestinal tract when administered as granulate or tablet than as capsule.6 In addition, patients may have more hard time swallowing a capsule than a tablet because the floating property of the capsule makes it lighter than water, causing the uneasy globus sensation. In contrast, tablets are typically heavier than water, which could minimize the uneasy feeling in the oral cavity when swallowing.7 Thus, the tablet formulation may help alleviate patient discomfort, leading to increased compliance, better quality of life, and possibly better efficacy.
The currently available oral formulation of tacrolimus is capsule (Advagraf®, Astellas Pharma International B.V., Meppel, the Netherlands; Prograf®, Astellas Pharma Europe, Chertsey, UK) and extended-release tablet (Envarsus® XR, Veloxis Pharmaceuticals, Inc., Edison, NJ, USA). Other formulations such as sublingual tablet are under development to be best suited for various clinical settings.8–10 Chong Kun Dang Pharmaceutical Corp., Seoul, Republic of Korea, developed a novel immediate-release tablet formulation of tacrolimus, whose PK and tolerability profiles had to be comparable to those of the conventional capsule formulation for regulatory approval. Furthermore, it was interesting to know if new tablet formulation could reduce the IIV in the systemic exposure to tacrolimus compared with the conventional capsule formulation. This property, once confirmed, can contribute to more consistent and predictable clinical performance in patients with transplantation.
Based on this understanding, the objectives of the present study were 1) to evaluate the PK and tolerability profiles of tacrolimus for the new tablet formulation and its IIV in the systemic exposure and 2) to compare them with those of the conventional capsule formulation. To this end, we performed a randomized crossover study in healthy male subjects after a single oral administration of tacrolimus as tablet and capsule in two periods after a wash-out.
Materials and methods
Subjects and study design
A randomized, open-label, single-dose, two-treatment, two-period, two-sequence crossover study was conducted in healthy male subjects 19 and 45 (both inclusive) years of age, who were healthy, supported by normal clinical laboratory test results and physical examinations performed at the time of screening within 21 days of the study drug administration. Subjects who had previously participated in another clinical study within 3 months at the time of screening or had a history of allergic reactions to tacrolimus in the past were excluded.
A total of 50 eligible subjects were randomly assigned to receive one tablet of 2 mg Tacrobell® (Chong Kun Dang Pharmaceutical Corp.) or two capsules of 1 mg Prograf in period 1 and vice versa in period 2 after 21 days of wash-out. All subjects were hospitalized on the day before study drug administration, and they were fasted for at least 10 hours prior to dosing. During the entire study period, all subjects were restricted from taking any concomitant medication or beverage containing xanthine or alcohol. For the determination of whole-blood tacrolimus concentrations, 5 mL of blood samples was serially collected at 0 (ie, pre-dose), 0.25, 0.5, 0.75, 1, 1.25, 1.5, 1.75, 2, 3, 4, 6, 8, 12, 24, 48, 72, and 96 hours after dosing. Tolerability was assessed based on vital signs, physical examinations, and AEs throughout the entire study.
The study protocol (protocol no: 111HPS14027) was reviewed and approved by the IRB of Seoul National University Hospital (IRB no: 1412-016-631, ClinicalTrials.gov registry no: NCT02336854). All study procedures were performed after subjects gave written informed consent, and the study was conducted in full accordance with the principles stipulated in the Declaration of Helsinki as amended in 2013 (Fortaleza, Brazil)11 and the International Conference on Harmonisation Good Clinical Practice Guideline.12
Determination of tacrolimus concentrations in whole blood
Whole-blood tacrolimus concentrations were determined using a validated method as previously published.4 Briefly, the LC-20AD series of HPLC system from Shimadzu (Kyoto, Japan) was equipped with an YMC C18 (RS) column (5 μm, 2.0×150 mm; YMC America, Inc., Allentown, PA, USA). This HPLC system was coupled with an Applied Biosystems API 5000 triple quadrupole tandem mass spectrometer (Applied Biosystems, Foster City, CA, USA). Quantification was conducted in the positive ion MRM mode. Tacrolimus was monitored with an MRM transition of m/z =821.6 → 768.7, and ascomycin (IS) was monitored with an MRM transition of m/z =809.6 → 756.7. Tacrolimus 5.1 mg and ascomycin 2.11 mg were dissolved in 10 mL of methanol for preparation of standard stock solution and IS solution, respectively. An aliquot of 100 μL human whole blood was added with 20 μL of IS solution (ascomycin, 100 ng/mL) followed by addition of 750 μL of methyl-tert-butyl ether. The mixture was mixed for 10 minutes in a shaker at 130 rpm and centrifuged at 11,400 g for 5 minutes and was kept in the freezer for 20 minutes prior to evaporation of the organic solvent supernatant at 40°C in the pressured gas blowing concentrator. The remnant was then dissolved in 300 μL of 50% acetonitrile (v/v, with 0.1% formic acid) and vortex-mixed for 20 seconds. The mixture was centrifuged at 11,400 g for 5 minutes. Then, 3 μL aliquot of the supernatant was introduced into the HPLC–tandem mass spectrometry system. The mobile phase was a mixture of 10 mM ammonium acetate and methanol (5:95, v/v, with 0.1% formic acid) at a flow rate of 0.35 mL/min.
The calibration curve for tacrolimus was linear over the concentration of 0.1–100.0 ng/mL. The intra- and inter-day accuracy was 94.2%–97.8% and 91.5%–96.2% of nominal value, respectively. Additionally, the intra- and inter-day assay precision was 2.5%–6.8% and 1.6%–5.7%, respectively.
Sample size estimation, PK and statistical analyses
A previous bioequivalence study performed in Korean healthy subjects with tacrolimus showed that the intraindividual CV for the major PK parameters such as the AUC and Cmax of tacrolimus was 35% (data on file). Assuming for the same intraindividual CV% as stated above, 44 subjects were considered sufficient to rule out a two one-sided 90% CI of the GMR for AUC and Cmax between the test (ie, tablet) and reference (ie, capsule) formulations being outside the range of 0.80–1.25 with a ≥80% power at a significance level of 0.05. Given a drop-out rate of 10%, the present study planned to enroll a total of 50 subjects.
The following PK parameters were derived and compared between the test and reference formulations: Cmax, Tmax, AUClast, and t1/2. The observed concentrations and times were used to decide the Cmax and Tmax of tacrolimus. AUClast was calculated using the linear trapezoidal method. The t1/2 was calculated as the natural logarithm of 2 divided by the elimination rate constant, which was calculated as the slope of the terminal data from the semilogarithmic plot by linear regression. All the PK parameters were estimated using the Phoenix® WinNonlin® (version 6.3; Certara USA Inc., Princeton, NJ, USA). Furthermore, SAS software (version 9.4; SAS Institute Inc., Cary, NC, USA) was used for statistical analysis. The PK parameters of log-transformed Cmax and AUClast were compared using a mixed-effect model for a crossover design, where sequence, treatment, and period were fixed effects and subjects nested within sequence were random effect. The 90% CIs of the GMRs for Cmax and AUClast between the tablet and capsule formulations were estimated for statistical comparison between the two formulations.
In vitro dissolution characteristics of tablet and capsule formulations
The dissolution profile of a tablet containing 2 mg tacrolimus was compared with that of two capsules each containing 1 mg tacrolimus using an automated flow-through Dissolution Test Station incorporated with the United States Pharmacopoeia Dissolution Apparatus 2 (SR8PLUS; Hanson Research Corporation, Chatsworth, CA, USA) with a paddle operating at 50 rpm and 37.0°C±0.5°C. A sample of 10 mL was collected through a 0.45 μm filter, which was replaced with a fresh dissolution medium, at 5, 10, 15, 30, 45, 60, 90, and 120 minutes after the formulation was put into the medium. The samples were then analyzed using a HPLC system (Waters, Milford, MA, USA) equipped with a Supelcosil™ LC18 column (5 μm, 3.0×150 mm; Sigma-Aldrich Co. LLC., St Louis, MO, USA). Separate readings for the tablet and capsule were taken from 12 dissolution vessels.8
f2, as defined in the following equation,13 was derived to compare the dissolution profiles of the tablet and capsule formulations of tacrolimus:
|
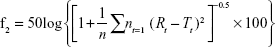
where n was the number of the dissolution sampling times, Rt and Tt were the percentage dissolved at each time point for the reference (capsule) and test (tablet) formulations, respectively. An f2 value >50 indicated similar dissolution profiles.
Results
Demographic characteristics and subject disposition
A total of 50 subjects 19–41 years of age were enrolled, and the mean ± standard deviation of body weight and BMI were 69.7±6.74 kg and 23.0±2.17 kg/m2, respectively. All 50 subjects were included in the safety analysis dataset. Three subjects dropped out from the study because they withdrew consent after the study drug was administered in period 1. Therefore, the remaining 47 subjects completed the study as planned and were included in the final PK analysis dataset, who were 19–30 years of age, and their body weight and BMI (mean ± standard deviation) were 70.0±6.77 kg and 23.1±2.22 kg/m2, respectively.
PK characteristics
Tacrolimus was rapidly absorbed after a single oral administration of tablet and capsule (Tmax: 1.50–1.75 hours, Table 1), and the mean whole-blood tacrolimus concentration-time profiles of the two formulations almost overlapped (Figure 1). As a result, the GMR for Cmax and AUClast between the tablet and capsule formulations was close to unity with their 90% CIs falling entirely within the conventional bioequivalence range of 0.80–1.25 (Table 1).
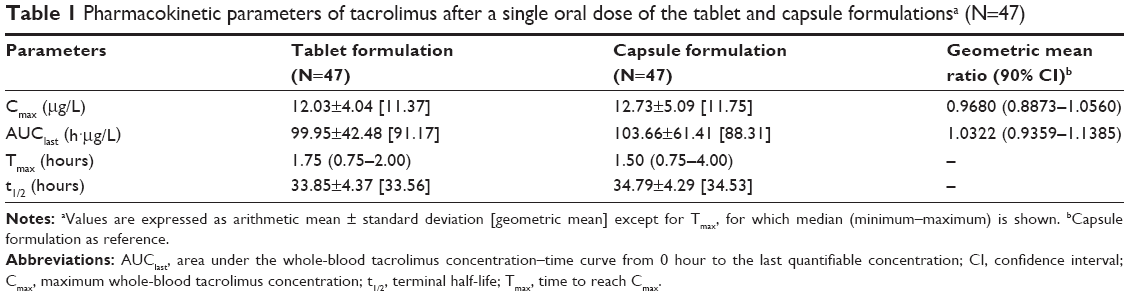 | Table 1 Pharmacokinetic parameters of tacrolimus after a single oral dose of the tablet and capsule formulationsa (N=47) |
 | Figure 1 Mean whole-blood concentration–time profiles of the tablet and capsule formulations of tacrolimus: (A) linear scale and (B) semi-log scale. The inset shows the profiles up to 12 hours post-dose. The error bars denote the standard deviations. |
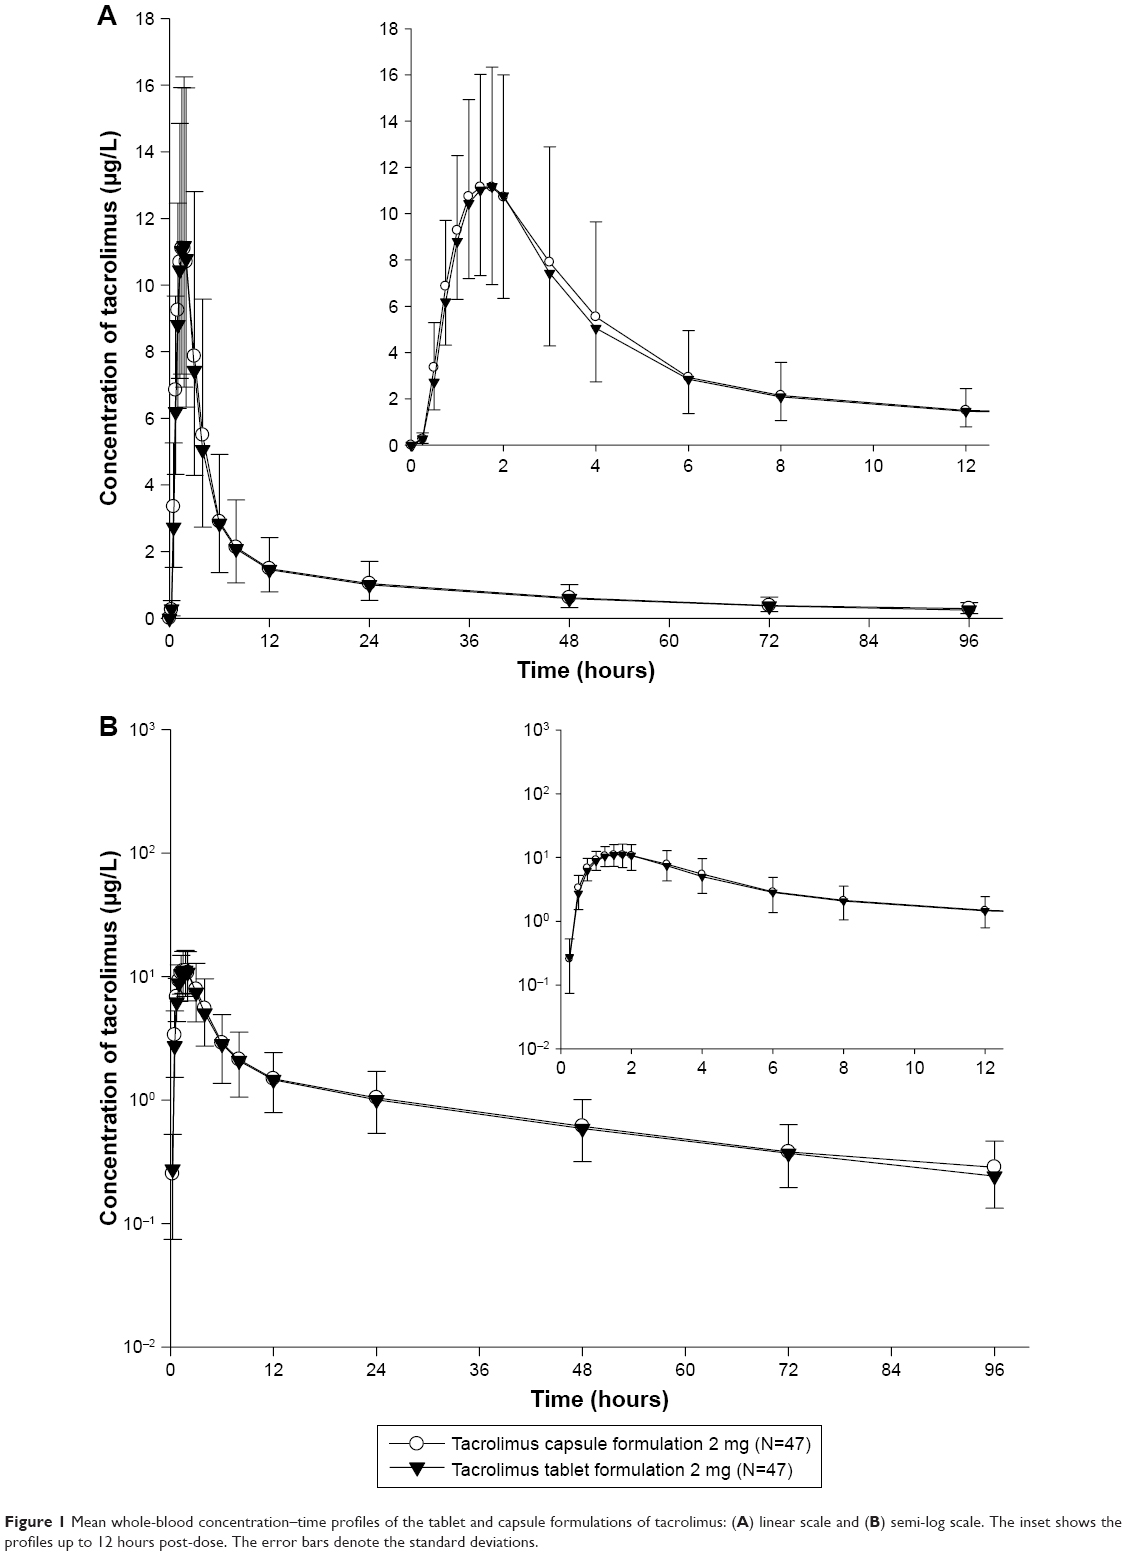
Cmax and AUClast of tacrolimus, particularly AUClast, distributed much more narrowly among study subjects when they took tablet than capsule (Figure 2). Thus, the variabilities shown as %CV in the Cmax and AUClast of tacrolimus was 15.8% and 28.2% smaller, respectively, for tablet compared to capsule formulation, which was marginally or statistically significant (P-values: 0.0548 and 0.0009, respectively, Pitman–Morgan test for variance; Table 2).
 | Figure 2 Box-and-whisker plots of (A) Cmax and (B) AUClast after a single oral administration of tacrolimus as tablet and capsule formulations among subjects. The line across each box, the top edge, and the bottom edge represent the median, the first quartile, and the third quartile, respectively. The horizontal lines connected with the whiskers extending from the box denote the minimum and the maximum values. Solid circles indicate an outlier, defined as a value less than the first quartile minus 1.5 times interquartile range or a value greater than the third quartile plus 1.5 times interquartile range. |
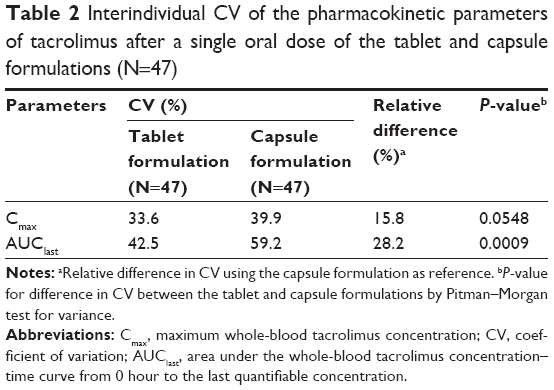 | Table 2 Interindividual CV of the pharmacokinetic parameters of tacrolimus after a single oral dose of the tablet and capsule formulations (N=47) |
In vitro dissolution profiles
The dissolution profile of the tablet formulation was similar to that of the capsule formulation in water and the dissolution medium at pHs of 1.2, 4.0, and 6.8, resulting in an f2 value of >50 in all media (Figure 3).
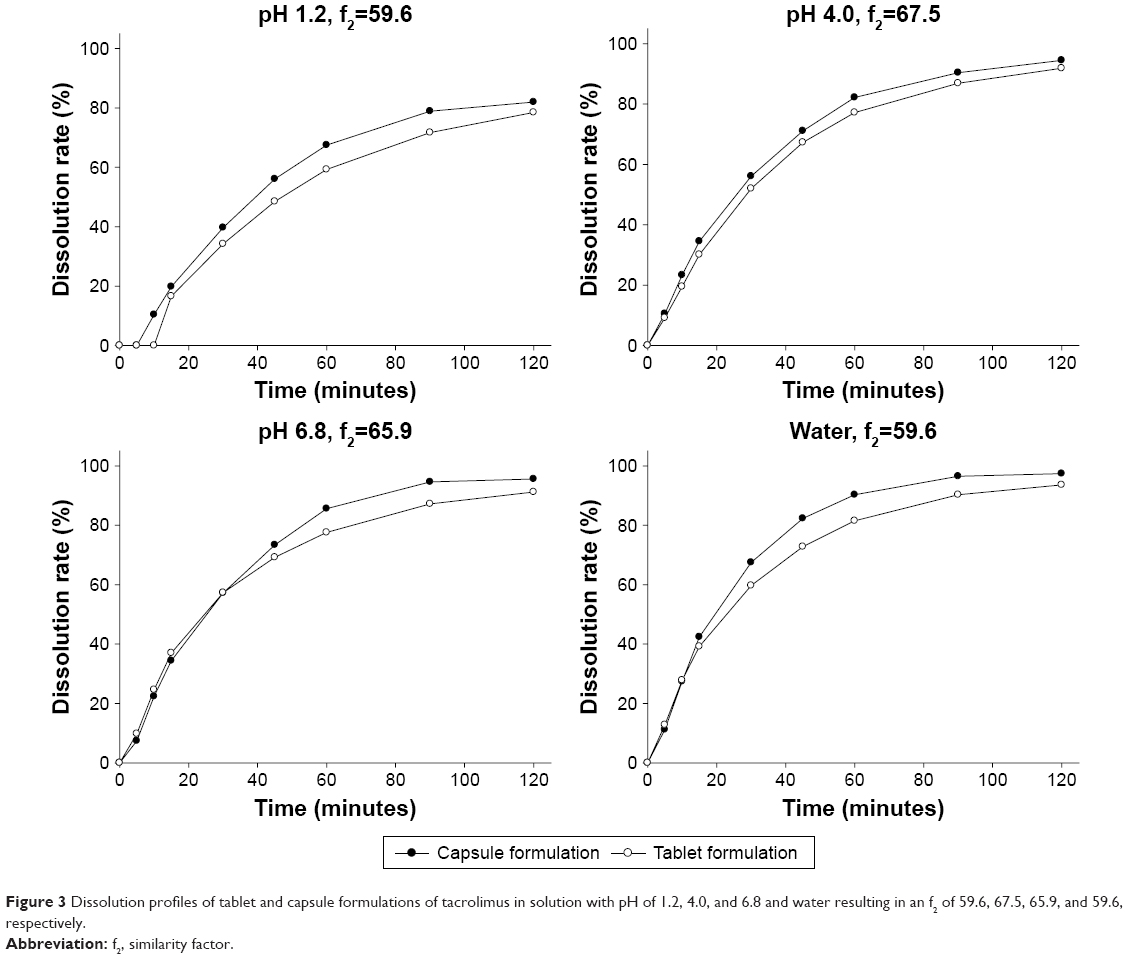 | Figure 3 Dissolution profiles of tablet and capsule formulations of tacrolimus in solution with pH of 1.2, 4.0, and 6.8 and water resulting in an f2 of 59.6, 67.5, 65.9, and 59.6, respectively. |
Tolerability
Throughout the entire study period, both the tablet and capsule formulations of tacrolimus were well tolerated, and no serious AE was reported. Furthermore, the number of subjects experiencing any AE was not statistically significantly different between the two formulations (Table 3).
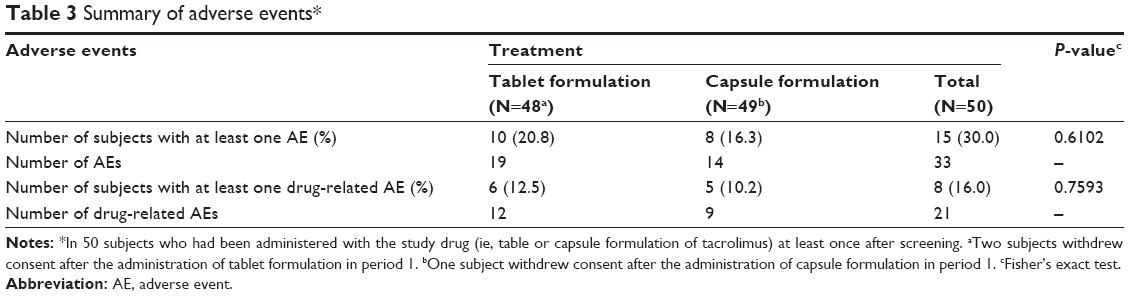 | Table 3 Summary of adverse events* |
Discussion
In this study, we found that systemic exposure to orally administered tablet formulation of tacrolimus is less variable compared to capsule formulation among human subjects while both formulations showed similar PK and tolerability profiles. The evidence is that the interindividual CV in the Cmax and AUClast of tacrolimus tablet was 15.8% and 28.2% smaller, respectively, than that of capsule used as reference, which was marginally and statistically significant, respectively (Figure 2 and Table 2). It is well known that the interindividual PK variability of tacrolimus is huge. For example, the absolute bioavailability of tacrolimus ranged from 5% to 93% due to its extensive first-pass effect caused by CYP3A enzyme-dependent metabolism, and the IIV of the apparent clearance and volume of distribution was 39.7%–124% in adult organ transplant patients.14 Because patients receiving tacrolimus after transplantation require meticulous therapeutic drug concentration monitoring due to its inherently large IIV, the tablet formulation can be useful by ensuring more consistent exposure as seen in the present study.
Interestingly, a similar finding was previously reported in a study with lopinavir.15 Namely, the IIV in the trough concentrations of lopinavir in HIV-infected pregnant women in the third trimester was 18.8% lower with tablet than with capsule (34.6% and 42.6% CV for tablet and capsule, respectively). Based on this finding along with our observation, a couple of hypotheses can be suggested to explain the lower IIV of tablet than capsule. First, faster dissolution of tablet may contribute to its smaller IIV, particularly for drugs with poor water solubility such as tacrolimus.5 For example, the tablet formulations of proquazone showed a significantly faster dissolution of the drug substance than the capsule formulations, which became more apparent with high doses.6 To test this hypothesis, we compared the in vitro dissolution profiles of the tablet and capsule formulations in several pH conditions and water. However, this experiment resulted in an f2 value of >50 in all media with different pH values, indicating no difference in the dissolution profile between tablet and capsule (Figure 3). Therefore, the smaller IIV of tacrolimus observed with tablet in this study could not be attributed to the faster dissolution profile of tablet compared with capsule. Second, the differences in the excipient contents between a single tablet and two capsules administered were suspected as a causal factor responsible for the different IIV shown in the present study. For example, one of the most widely used excipients for hard capsules is glycerin, a form of lipid used as a plasticizer during the manufacturing process.16 Upon intake of the lipid, such as glycerin-containing substances, the pancreatic juice and bile should be excreted into the gastrointestinal tract to initiate fat digestion17 and the IIV in the amount of bile secretion may have indirectly affected the IIV in drug absorption.18 However, the differences in the excipient contents, including forms of lipid, between the two formulations were minimal (data on file). Therefore, the possibility that differences in the excipients caused differences in the IIV in tacrolimus exposure can be ruled out.
No matter which mechanisms gave rise to the smaller IIV in the systemic exposure to tacrolimus when administered with tablet, it showed comparable PK and tolerability profiles to those of the conventional capsule formulation (Figure 1; Table 1). The PK parameters were also comparable to those previously reported, particularly the IIV in tacrolimus exposure with capsule in healthy subjects ranging from 38.4% to 53.1% for Cmax and AUCs.19 The comparability in the PK parameters between tablet and capsule, along with the smaller IIV for tablet, suggests that the new tablet formulation can be a useful treatment option to maintain a consistent systemic exposure level of tacrolimus, which may help reduce graft failure in organ transplant patients.
It is noteworthy that the magnitude of IIV for Cmax and AUClast of tacrolimus capsule in the present study (39.9% and 59.2%, respectively, CV%; Table 2) was larger, particularly for AUClast, than those reported previously in Europeans, which ranged 20.2%–28.7% and 15.2%–30.6%, respectively, for Cmax and AUC.20 We hypothesize that this difference was mainly caused by the fact that the loss-of-function allele for CYP3A5, that is, *3, is much less frequent in Europeans than in Asians.21 No matter how large or small the IIV is, it should be compared within the same ethnic group, not across other ethnic populations, if the magnitude of IIV is evaluated between different formulations as in the present study.
The present study had several limitations. First, the smaller interindividual PK variability of tacrolimus with tablet may not be reproduced in organ transplant patients because the study was performed in healthy volunteers. However, given that patients tend to have larger IIV than healthy subjects,22 the difference in the IIV between tablet and capsule is very likely to be enlarged further in patients as shown in the comparison of oral tacrolimus in healthy and patients with kidney, liver, and heart transplantation.22 Therefore, the smaller IIV in the systemic exposure to tacrolimus taken as tablet in healthy subjects can be still beneficial in patients who underwent organ transplantation. Second, although the present study showed a similar PK profile between the capsule and tablet formulations of tacrolimus, it did not meet the more stringent 90%–111% criteria for the bioequivalence of NTI drugs such as tacrolimus.23–25 However, the objective of the present study was not to show that the tablet formulation of tacrolimus was bioequivalent to the capsule formulation; rather, it was to assess the PK characteristics of the tablet formulation and to compare its bioavailability with that of capsule using the conventional bioequivalence criteria of 80%–125% criteria. Because the mean concentration–time profiles of the two formulations almost overlapped (Figure 1A and B), it is likely that the 90% CIs of GMR for Cmax and AUClast could fall within the narrower 90%–110% range if a larger number of subjects are enrolled, for which future studies are warranted. Lastly, intraindividual, rather than interindividual, variability is important in maintaining a consistent systemic exposure to tacrolimus in an individual, which our study was not able to compare between the tablet and capsule formulations due to the lack of repeated design.20 However, smaller IIV still has a role to play in patients with organ transplantation, particularly for ensuring that the systemic exposure to tacrolimus does not fall below (ie, subtherapeutic) or above (ie, supratherapeutic or toxic) the recommended therapeutic range.
In summary, a new tablet formulation of tacrolimus showed smaller IIV in PK parameters than the conventional capsule formulation, while both formulations had comparable PK and tolerability profiles. These beneficial characteristics of the tablet formulation of tacrolimus can make it a useful alternative to the conventional capsule formulation in patients after organ transplantation, who are likely to have much larger IIV than healthy subjects.
Conclusion
The tablet formulation of tacrolimus has similar PK and tolerability profiles as capsule formulation. Tacrolimus tablet can be a useful alternative to capsule for organ transplant patients.
Abbreviations
AE, adverse event; AUC, area under the whole-blood tacrolimus concentration–time curve; AUClast, area under the whole-blood tacrolimus concentration–time curve from 0 hour to the last quantifiable concentration; BMI, body mass index; CI, confidence interval; Cmax, maximum whole-blood tacrolimus concentration; CV, coefficient of variation; CYP3A, cytochrome P450, family 3, subfamily A; f2, similarity factor; GMR, geometric mean ratio; HPLC, high-performance liquid chromatography; IIV, interindividual variability; IRB, institutional review board; IS, internal standard; MRM, multiple reaction monitoring; NTI, narrow therapeutic index; PK, pharmacokinetic(s); t1/2, terminal half-life; Tmax, time to reach maximum whole-blood tacrolimus concentration.
Acknowledgments
The first author (Yu Kyong Kim) received a scholarship from the BK21-plus education program provided by the National Research Foundation of Korea. This work was partly sponsored by a grant from Chong Kun Dang Pharmaceutical Corp., Republic of Korea.
Disclosure
Ms Park is an employee of Chong Kun Dang Pharmaceutical Corp. None of the authors of this study are involved in financial or personal relationships with agencies, institutions, or organizations that inappropriately influenced the statistical analysis plan or interpretation of this work.
References
Schreiber SL. Chemistry and biology of the immunophilins and their immunosuppressive ligands. Science. 1991;251(4991):283–287. | ||
Endrenyi L, Tothfalusi L. Determination of bioequivalence for drugs with narrow therapeutic index: reduction of the regulatory burden. J Pharm Pharm Sci. 2013;16(5):676–682. | ||
Johnston A. Equivalence and interchangeability of narrow therapeutic index drugs in organ transplantation. Eur J Hosp Pharm Sci Pract. 2013;20(5):302–307. | ||
Choi Y, Jiang F, An H, Park HJ, Choi JH, Lee H. A pharmacogenomic study on the pharmacokinetics of tacrolimus in healthy subjects using the DMETTM Plus platform. Pharmacogenomics J. 2017;17(2):174–179. | ||
Horter D, Dressman JB. Influence of physicochemical properties on dissolution of drugs in the gastrointestinal tract. Adv Drug Deliv Rev. 2001;46(1–3):75–87. | ||
von Orelli J, Leuenberger H. Search for technological reasons to develop a capsule or a tablet formulation with respect to wettability and dissolution. Int J Pharm. 2004;287(1–2):135–145. | ||
MacLeod AD, Vella-Brincat J, Frampton C. Swallowing capsules. Palliat Med. 2003;17(6):559. | ||
Srinarong P, Pham BT, Holen M, et al. Preparation and physicochemical evaluation of a new tacrolimus tablet formulation for sublingual administration. Drug Dev Ind Pharm. 2012;38(4):490–500. | ||
Tsapepas D, Saal S, Benkert S, et al. Sublingual tacrolimus: a pharmacokinetic evaluation pilot study. Pharmacotherapy. 2013;33(1):31–37. | ||
Thomson AW. FK-506 – how much potential? Immunol Today. 1989;10(1):6–9. | ||
World Medical Association. World Medical Association Declaration of Helsinki: ethical principles for medical research involving human subjects. JAMA. 2013;310(20):2191–2194. | ||
International Conference on Harmonisation. E6 guideline for good clinical practice. 1997. Available from: https://ec.europa.eu/health/sites/health/files/files/eudralex/vol-10/3cc1aen_en.pdf. Accessed September 19, 2017 | ||
Shah VP, Tsong Y, Sathe P, Liu JP. In vitro dissolution profile comparison – statistics and analysis of the similarity factor, f2. Pharm Res. 1998;15(6):889–896. | ||
Staatz CE, Tett SE. Clinical pharmacokinetics and pharmacodynamics of tacrolimus in solid organ transplantation. Clin Pharmacokinet. 2004;43(10):623–653. | ||
Khuong-Josses MA, Azerad D, Boussairi A, Ekoukou D. Comparison of lopinavir level between the two formulations (soft-gel capsule and tablet) in HIV-infected pregnant women. HIV Clin Trials. 2007;8(4):254–255. | ||
Yamamoto T, Kobayashi M, Matsuura S, inventors; Japan Elanco Company, Limited, assignee. Gelatin coating composition and hard gelatin capsule. United States patent US 5419916. 1995 May 30. | ||
Carey MC, Small DM, Bliss CM. Lipid digestion and absorption. Annu Rev Physiol. 1983;45:651–677. | ||
Pang KS, Rodrigues AD, Peter RM. Enzyme- and Transporter-Based Drug-Drug Interactions. Springer-Verlag, NY; 2014. | ||
Bekersky I, Dressler D, Colburn W, Mekki Q. Bioequivalence of 1 and 5 mg tacrolimus capsules using a replicate study design. J Clin Pharmacol. 1999;39(10):1032–1037. | ||
Herranz M, Morales-Alcelay S, Corredera-Hernandez MT, et al. Bioequivalence between generic tacrolimus products marketed in Spain by adjusted indirect comparison. Eur J Clin Pharmacol. 2013;69(5):1157–1162. | ||
Valente C, Alvarez L, Marks SJ, et al. Exploring the relationship between lifestyles, diets and genetic adaptations in humans. BMC Genet. 2015;16:55. | ||
Prograf. Drug label (NDA) 050708. Silver Spring, MD: US Food and Drug Administration; 2006. | ||
EMA: questions and answers: positions on specific questions addressed to the Pharmacokinetics Working Party (PKWP). London: CHMP; 2015. Available from: http://www.ema.europa.eu/docs/en_GB/document_library/Scientific_guideline/2009/09/WC500002963.pdf. Accessed September 19, 2017. | ||
Health Canada. Guidance document: comparative bioavailability standards: formulations used for systemic effects. Ottawa, ON: Health Products and Food Branch; 2012. Available from: https://www.canada.ca/content/dam/hc-sc/migration/hc-sc/dhp-mps/alt_formats/pdf/prodpharma/applic-demande/guide-ld/bio/gd_standards_ld_normes-eng.pdf. Accessed September 19,2017. | ||
US Food and Drug Safety. Bioequivalence recommendation on tacrolimus capsules. Washington, DC: Department of Health and Human Services; 2012. Available from: https://www.fda.gov/downloads/Drugs/GuidanceComplianceRegulatoryInformation/Guidances/UCM406344.pdf. Accessed September 19, 2017. |
 © 2017 The Author(s). This work is published and licensed by Dove Medical Press Limited. The full terms of this license are available at https://www.dovepress.com/terms.php and incorporate the Creative Commons Attribution - Non Commercial (unported, v3.0) License.
By accessing the work you hereby accept the Terms. Non-commercial uses of the work are permitted without any further permission from Dove Medical Press Limited, provided the work is properly attributed. For permission for commercial use of this work, please see paragraphs 4.2 and 5 of our Terms.
© 2017 The Author(s). This work is published and licensed by Dove Medical Press Limited. The full terms of this license are available at https://www.dovepress.com/terms.php and incorporate the Creative Commons Attribution - Non Commercial (unported, v3.0) License.
By accessing the work you hereby accept the Terms. Non-commercial uses of the work are permitted without any further permission from Dove Medical Press Limited, provided the work is properly attributed. For permission for commercial use of this work, please see paragraphs 4.2 and 5 of our Terms.