")
Back to Journals » Drug Design, Development and Therapy » Volume 9
Navigating the chemical space of dipeptidyl peptidase-4 inhibitors
Authors Shoombuatong W, Prachayasittikul V, Anuwongcharoen N, Songtawee N, Monnor T, Prachayasittikul S, Prachayasittikul V, Nantasenamat C
Received 13 April 2015
Accepted for publication 3 June 2015
Published 10 August 2015 Volume 2015:9 Pages 4515—4549
DOI https://doi.org/10.2147/DDDT.S86529
Checked for plagiarism Yes
Review by Single anonymous peer review
Peer reviewer comments 3
Editor who approved publication: Prof. Dr. Wei Duan
Watshara Shoombuatong,1 Veda Prachayasittikul,1,2 Nuttapat Anuwongcharoen,1 Napat Songtawee,1 Teerawat Monnor,1 Supaluk Prachayasittikul,1 Virapong Prachayasittikul,2 Chanin Nantasenamat1,2
1Center of Data Mining and Biomedical Informatics, 2Department of Clinical Microbiology and Applied Technology, Faculty of Medical Technology, Mahidol University, Bangkok, Thailand
Abstract: This study represents the first large-scale study on the chemical space of inhibitors of dipeptidyl peptidase-4 (DPP4), which is a potential therapeutic protein target for the treatment of diabetes mellitus. Herein, a large set of 2,937 compounds evaluated for their ability to inhibit DPP4 was compiled from the literature. Molecular descriptors were generated from the geometrically optimized low-energy conformers of these compounds at the semiempirical AM1 level. The origins of DPP4 inhibitory activity were elucidated from computed molecular descriptors that accounted for the unique physicochemical properties inherently present in the active and inactive sets of compounds as defined by their respective half maximal inhibitory concentration values of less than 1 µM and greater than 10 µM, respectively. Decision tree analysis revealed the importance of molecular weight, total energy of a molecule, topological polar surface area, lowest unoccupied molecular orbital, and number of hydrogen-bond donors, which correspond to molecular size, energy, surface polarity, electron acceptors, and hydrogen bond donors, respectively. The prediction model was subjected to rigorous independent testing via three external sets. Scaffold and chemical fragment analysis was also performed on these active and inactive sets of compounds to shed light on the distinguishing features of the functional moieties. Docking of representative active DPP4 inhibitors was also performed to unravel key interacting residues. The results of this study are anticipated to be useful in guiding the rational design of novel and robust DPP4 inhibitors for the treatment of diabetes.
Keywords: QSAR, decision tree, scaffold analysis, fragment analysis, antidiabetic, molecular docking, rational drug design
Introduction
Diabetes is a chronic disease and a major public health concern with an estimated global prevalence of 285 million.1 In the United States, 29.1 million (or approximately 9.3% of the population) have diabetes, in which 21 million and 8.1 million are diagnosed and undiagnosed, respectively.2 In fact, the estimated economic costs of diagnosed diabetes in the United States for 2012 was $245 billion, which increased from $174 billion in 2007.3
Given the multifaceted nature of diabetes, the search for robust drugs has been reported to entail a multitude of molecular targets.4,5 Dipeptidyl peptidase-4 (DPP4) has emerged as a promising therapeutic route for the treatment of type 2 diabetes (T2D) because it regulates glucose homeostasis.6 DPP4 is a serine protease that mediates the cleavage of two endogenous incretin hormones consisting of glucagon-like peptide and glucose-dependent insulinotropic polypeptide. Upon food ingestion, intestinal cells secrete these incretin hormones targeting pancreatic β-cells to stimulate insulin release. Generally, these two hormones exert a great effect on reducing blood glucose concentration; however, the rapid degradation of these hormones by DPP4 in T2D results in persistent high glucose level.7 Therefore, the inhibition of DPP4 reduces blood glucose by preventing the degradation of these incretin hormones. Several DPP4 inhibitors have been released on the market, beginning with sitagliptin in 2006, vildagliptin in 2007, saxagliptin in 2009, alogliptin in 2010, linagliptin in 2011, and, finally, teneligliptin in 2012.8 Generally, DPP4 inhibitors are considered to afford a favorable safety profile,9,10 although rare side effects (ie, angioedema, hemolysis, leucopenia, rheumatoid arthritis, and drug-induced acute hepatic injury) have been documented but with low incidence.11 Thus, there is ample room for additional improvement of the inhibitory and pharmacokinetic properties of DPP4 inhibitors. Medicinal chemistry approaches have been instrumental in the development of DPP4 inhibitors by facilitating the investigation of substituent effects in the quest for improved potency.8,12 Complementing the effort of medicinal chemistry is computer-aided drug design, of which chemical space exploration and quantitative structure–activity relationship (QSAR) methods are employed in this study. The former entails exploration of the chemical space to gain insights on the molecular complexity of investigated compounds. The latter enables the correlation of molecular structure with its respective biological activity via multivariate learning methods.13,14
The availability of public databases of bioactivity significantly lowers the barriers for large-scale investigation of the structure–activity relationship for compounds of interest15,16 and leads to accelerated drug discovery efforts. This study takes advantage of bioactivity data compilation of DPP4 inhibitors available from the BindingDB.17 To the best of our knowledge, this study represents the first large-scale chemical space exploration and QSAR investigation of DPP4 inhibitory activity. Chemical space exploration was achieved by exploratory data analysis, cluster analysis, and chemical substructure analysis, whereas QSAR analysis was performed using decision tree (DT) analysis. A schematic representation of the computational workflow is summarized in Figure 1.
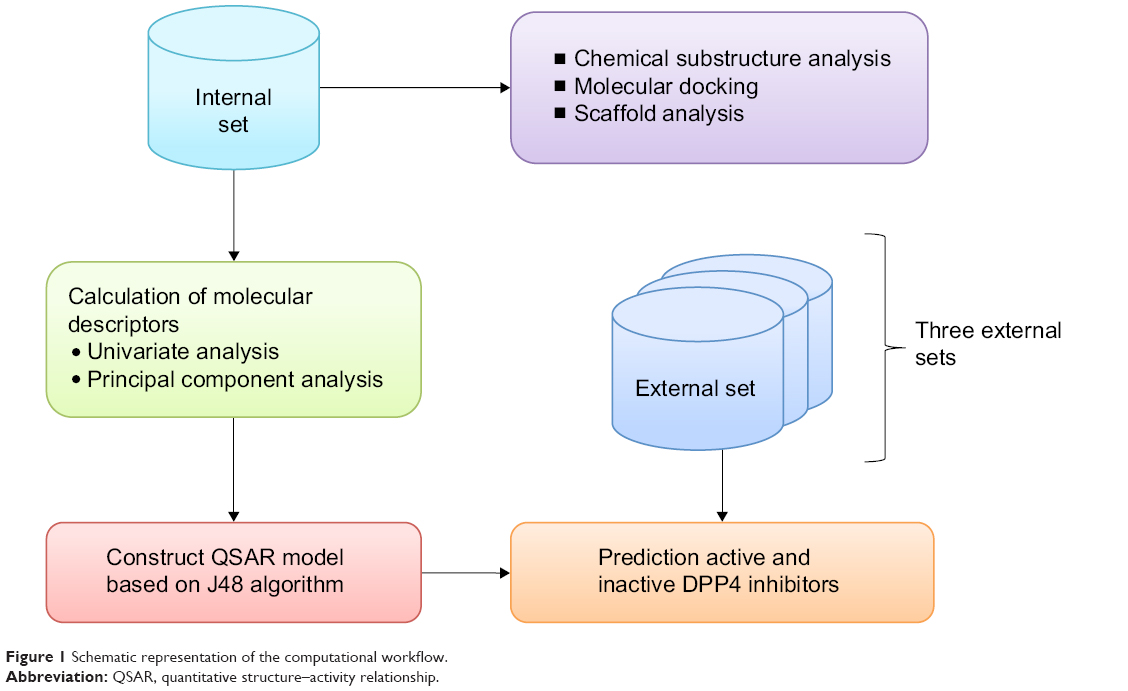 | Figure 1 Schematic representation of the computational workflow. |
Material and methods
Compilation of the dataset
A large compilation of known compounds with inhibitory activity against DPP4 was extracted from the BindingDB,17 which constituted 138 original articles. This nonredundant dataset comprises 2,937 compounds with the associated bioactivity reported as half maximal inhibitory concentration (IC50) values. An IC50 cutoff value of ≤1 μM was employed to categorize compounds as “actives”, whereas a cutoff value of ≥10 μM was utilized to categorize compounds as “inactives”, which resulted in subsets of 2,075 and 534, respectively. The remaining 328 compounds exhibiting intermediate bioactivity were not considered in this study due to their dubious nature while the subset of 2,609 was subjected to further investigations. Data imbalance observed for the active and inactive classes was addressed by subjecting the 2,075 actives to fuzzy C-means clustering,18 which produced a final dataset consisting of 588 actives and 534 inactives (DPP4-TRN).
The constructed predictive model was rigorously validated against three external validation sets. To show the ability of predictive models for filtering inactives, in the present study, three external validation sets were employed as negative control and were compiled from the BindingDB as follows: 1) random selection of active and inactive inhibitors against a wide range of human target proteins (DPP4-TEST1); 2) random selection of active and inactive inhibitors against other human proteases (DPP4-TEST2); and 3) random selection of active and inactive inhibitors against other human DPP types such as DPP1, DPP2, and DPP7 (DPP4-TEST3).
According to the applicability domain, the robustness of a QSAR model applies well for predicting the activity of compounds belonging to similar chemotypes as those used as the training data for constructing the predictive model.19 Thus, applicability domain was applied by selecting compounds to include in the external validation sets. Tanimoto coefficient is a commonly used metric for measuring the similarity between compounds of the internal and external sets, which varies between 0 (total lack of similarity) and 1 (compound from the internal set is identical to a compound in the external set). Herein, the average Tanimoto coefficient value was used as the cutoff for selection of compounds to include in the external validation sets.20–22 Finally, the remaining DPP4-TEST1, DPP4-TEST2, and DPP4-TEST3 consisted of 149, 160, and 167 compounds, respectively.
Calculation of molecular descriptors
The molecular structures of the investigated compounds were converted to three-dimensional structures from their simplified molecular-input line-entry system notation using MarvinSketch, version 6.2.1, from ChemAxon (ChemAxon Ltd., Budapest, Hungary).23 The file format of these structures was then converted to the appropriate file format using Babel, version 3.3,24 for subsequent geometry optimization at the B3LYP/6-31G(d) level in Gaussian 09.25 Our previous chemical space exploration of aromatase inhibitors was performed using a set of 13 descriptors selected to represent the general properties of a molecule.26 Given the readily interpretative nature, this set of descriptors was also employed for this investigation. This set of descriptors included the following: 1) mean absolute charge (Qm); 2) energy; 3) dipole moment; 4) highest occupied molecular orbital (HOMO); 5) lowest unoccupied molecular orbital (LUMO); 6) energy gap between the HOMO and LUMO states (HOMO–LUMO); 7) molecular weight (MW); 8) rotatable bond number (RBN); 9) number of rings (nCIC); 10) number of hydrogen bond donors (nHDon); 11) number of hydrogen bond acceptors (nHAcc); 12) Ghose–Crippen octanol–water partition coefficient (ALogP); and 13) topological polar surface area (TPSA).
Univariate analysis
Univariate statistical approaches were employed to perform exploratory data analysis. Specifically, six descriptive statistical parameters were used to summarize the aforementioned set of 13 descriptors. These parameters consisted of the minimum (Min), first quartile (Q1), median, mean, third quartile (Q3), and maximum (Max) of the dataset. Box plots were applied to visualize the relative distribution of the values for each investigated variable; this involved the analysis of a set of 13 descriptors to identify the descriptors that exert great influence on the active and inactive classes of DPP4 inhibitors. Histograms were used to visualize and estimate the distribution of active and inactive classes of DPP4 inhibitors. Furthermore, the P-value was used to assess whether active and inactive classes of DPP4 inhibitors were significantly different using Student’s t-test.27
Principal component analysis
Principal component analysis (PCA) is an unsupervised learning approach that groups data into related clusters in an a priori fashion. Practically, the PCA approach reduces the dimensionality of the dataset, while most of the information of the original dataset is preserved.28 This approach is performed by identifying directions, so-called principal components (PCs), along which variation in the data is maximal. In practice, PCs are obtained by calculating eigenvectors and eigenvalues of a data covariance (or correlation) matrix. The eigenvector associated with the largest eigenvalue has a direction that is identical to the first PC (PC1), whereas the eigenvector associated with the second largest eigenvalue determines the direction of the second PC (PC2) and so forth. In performing PCA analysis, a dataset is represented by a small number of PCs, in contrast to the initially large number of variables present in the original dataset.29 In this study, PCA was performed on a set of 13 molecular descriptors, as described in the previous section. Prior to PCA analysis, all data were standardized to a comparable scale by transforming variables to zero mean and unit variance. Active and inactive classes of DPP4 inhibitors were individually calculated using the FactoMineR30 package of the R statistical language.
DT analysis
A DT is composed of a hierarchical arrangement of nodes and branches in which the nodes represent the molecular descriptors, whereas the branches refer to decision rules to categorize compounds as actives and inactives. DT has been successfully applied in the analysis of various types of compounds, such as aromatase inhibitors,26 volatile organic compounds,31 and cytochrome P450-interacting compounds.32 A DT was constructed with WEKA, version 3.6,33 using the J48 algorithm (a Java implementation of the C4.5 algorithm). C4.5 establishes a DT by iteratively appending features having high information gains.34 Finally, C4.5 automatically calculates the feature usage obtained from the full DT or collection of rules. Molecular descriptors having the highest feature usage are considered to be the most important features.
Chemical substructure analysis
In preparation for substructure analysis, the chemical structures of all DPP4 inhibitors were generated in structure-data file (SDF) format using MarvinSketch, followed by appending the bioactivity label to the SDF files using an in-house text processing tool coded in C++. Substructure analysis was performed using the Fragmenter and FragmentStatistics components of JChem version 14.8.18.0.35 Fragmenter processed the activity-tagged SDF file by generating molecular fragments according to the FragmenterAll protocol. Produced fragments were analyzed using the FragmentStatistics toolkit, whereby fragments were categorized as actives and inactives using pIC50 cutoff values of 6 and 5, respectively. Subsequently, fragments were assigned molecular scores according to the following equation:
Molecular score = Natom × (Nactive − Ninactive) | (1) |
where Natom denotes the atom count of a given fragment of interest, whereas Nactive and Ninactive represent the number of occurrences of the fragment in the active and inactive classes, respectively.
Molecular docking and binding mode analysis
Molecular docking was performed to gain insights on how the inhibitors bind DPP4. Geometrically optimized structures of each compound were docked with the crystal structure of DPP4 catalytic domain (PDB code 3C45, resolution of 2.05 Å) using AutoDock version 4.2.6,36 in which the rotational bonds of compounds were treated as flexible whereas those of DPP4 were rigid. United atom model was applied to both protein and ligand structures. Grid boxes were created to cover the inhibitor-binding site of the protein with the grid spacing of 0.375 Å while the co-crystalized ligand site was set as the center of the box. The Lamarckian genetic algorithm with 50 runs was used as the search parameter in which the population size was set at 150 and the Max number of energy evaluations was set to the high level. The anchor-binding mode of ligand docking poses with the lowest binding energy to the DPP4 active site was subsequently analyzed by the SiMMap server.37 Three-dimensional models of the binding mode were visualized with PyMOL version 1.3.38
Results and discussion
Univariate analysis of active and inactive DPP4 inhibitors
The number of active and inactive DPP4 inhibitors compiled in this study was 2,075 and 534, respectively. Table 1 displays the six descriptive statistical parameters that offer the following advantages for summarizing the data: 1) the median and mean provide a measure of the centrality of the data; 2) the Min and Max indicate the data range; and 3) Q1 and Q3 provide the lower and upper boundaries, respectively, of the data. Furthermore, histograms shown in Figure 2 afford a graphical display of the data as tabulated frequencies of bars derived by binning continuous values into several data ranges. Figure 2A shows the distribution of active and inactive DPP4 inhibitors as red and blue bars, respectively, whereas the overlapping region is shown in purple. Figure 2B, which will be discussed in further details in the “Analysis of active DPP4 inhibitors” section, displays the distribution of two subsets of active DPP4 inhibitors that will be referred to as active I and active II.
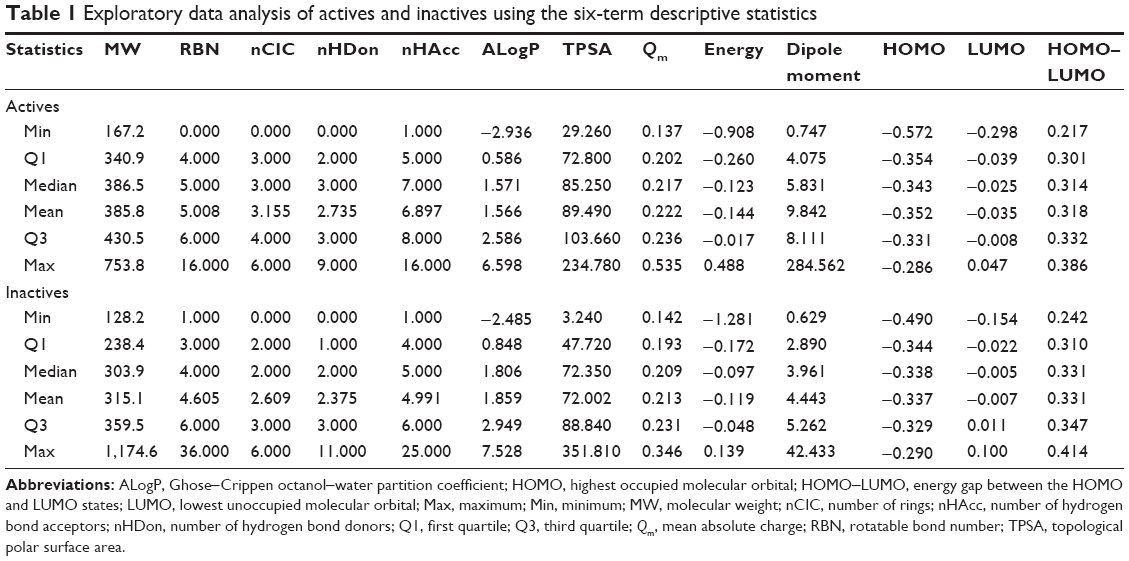 | Table 1 Exploratory data analysis of actives and inactives using the six-term descriptive statistics |
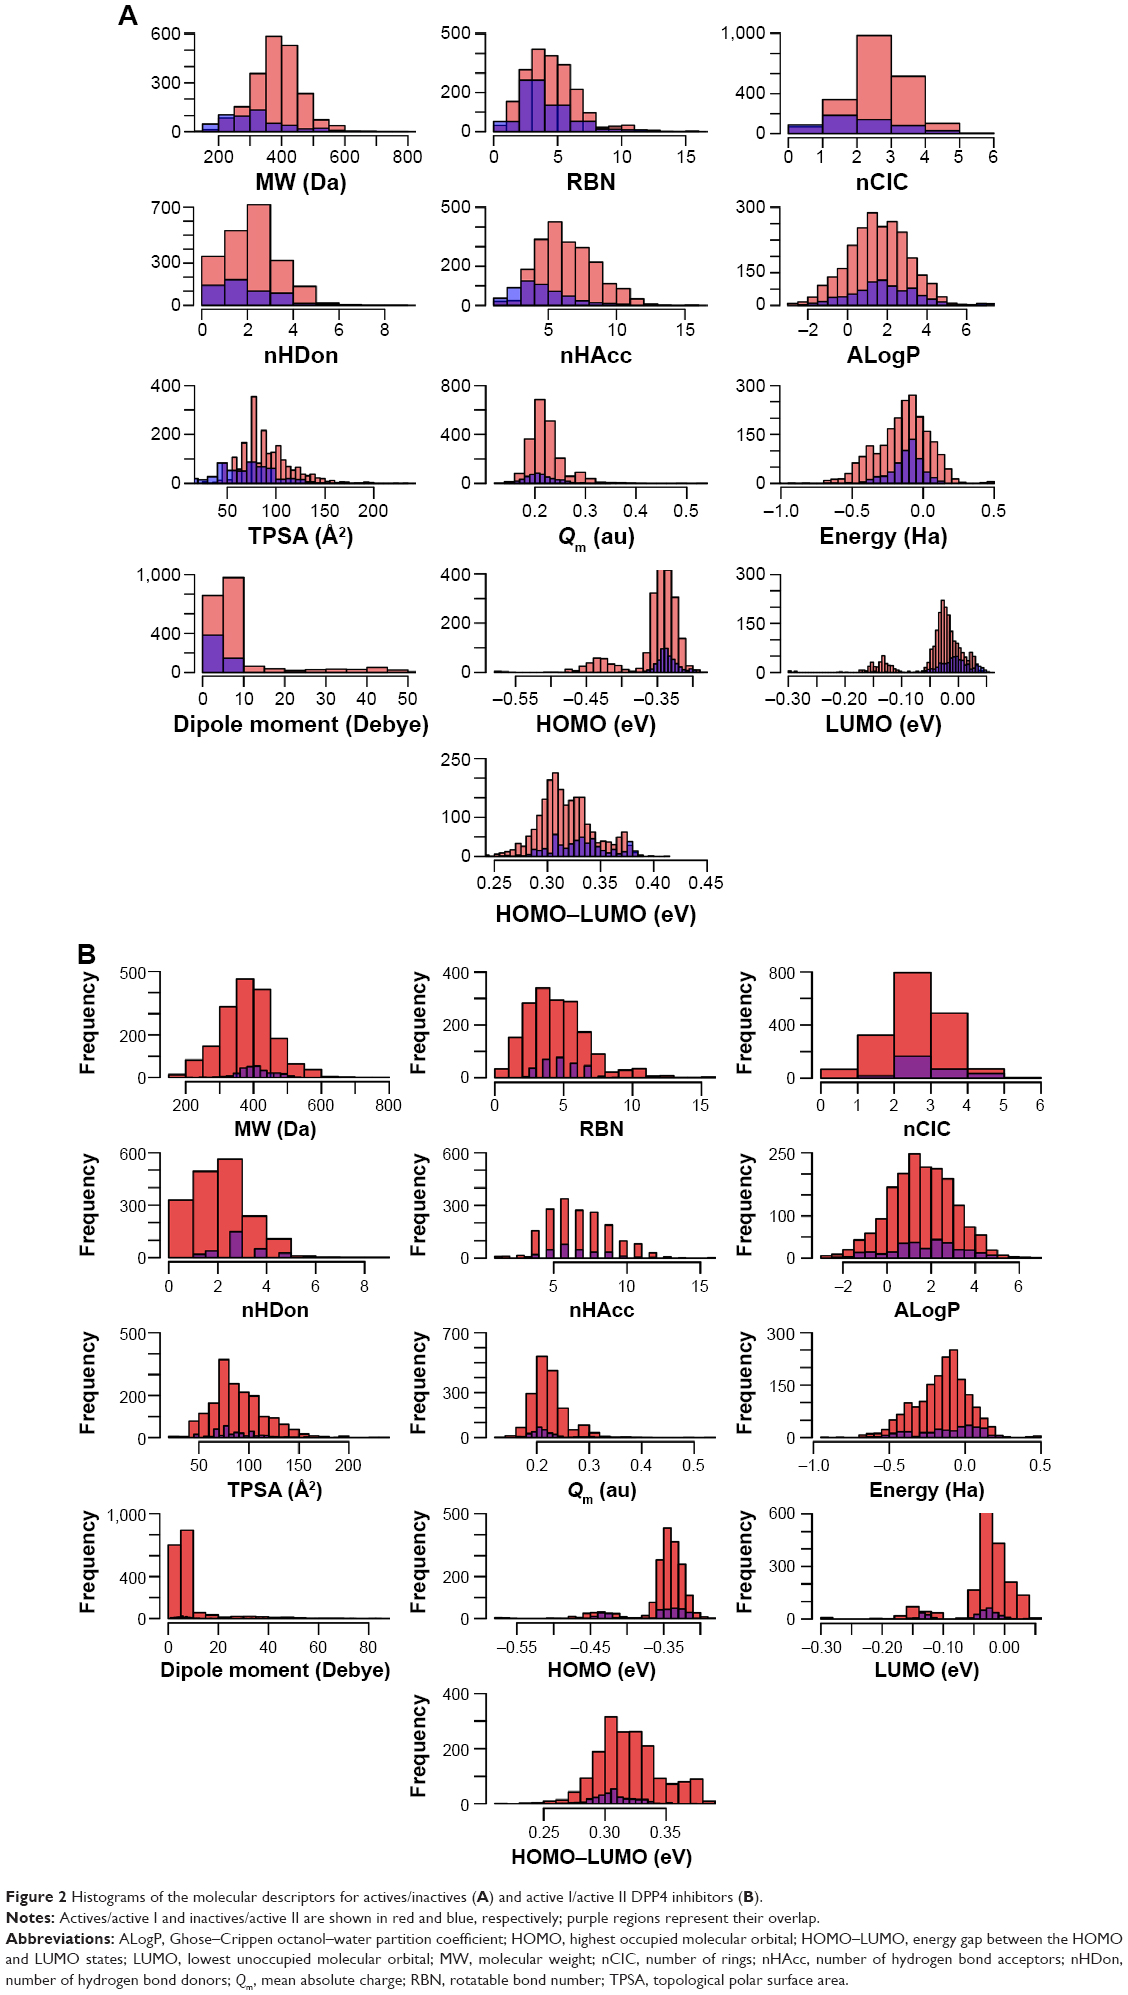 | Figure 2 Histograms of the molecular descriptors for actives/inactives (A) and active I/active II DPP4 inhibitors (B). |
MW is a general measure of the molecular size, and actives were found to be larger than inactives, with P<0.001, Q1 =340.9, median =386.5, mean =385.8, and Q3 =430.5 for actives, and Q1 =238.4, median =303.9, mean =315.1, and Q3 =359.5 for inactives (Table 1). As shown in Figure 2A, the distributions of actives and inactives were normal and positively skewed, respectively.
RBN is the number of rotatable bonds in a molecule and provides a relative measure of molecular flexibility. RBN is defined as any single bond, not in a ring, bound to a nonterminal heavy atom. Amide C–N bonds are excluded from the count because of their high rotational energy barrier. Actives were found to have higher RBN values than their inactive counterparts, thereby implying the importance of molecular flexibility for DPP4 inhibitory activity. Corresponding values of Q1 =4.0, median =5.0, mean =5.0, and Q3 =6.0 were obtained for actives, whereas values of Q1 =3.0, median =4.0, mean =4.6, and Q3 =6.0 were obtained for inactives. Although the distribution of actives and inactives are both positively skewed, the RBN values for actives are greater than those for inactives. Remarkably, all of these results indicated that the number of rotatable bonds in a molecule between active and inactive DPP4 inhibitors was slightly different, with P=0.001.
The nCIC is calculated as the cardinality of the set of independent rings known as the smallest set of smallest rings. The nCIC from actives was higher than that from inactives (P<0.001), affording values of Q1 =3.000, median =3.000, mean =3.155, and Q3 =4.000 for actives, and Q1 =2.000, median =2.000, mean =2.609, and Q3 =3.000 for inactives.
nHDon is the number of hydrogen bond donors present in a molecule. The mean of nHDon in actives (2.735±1.202) was higher than that in inactives (2.375±1.355). A six-number statistical descriptive confirmed that active and inactive DPP4 inhibitors differed from each other, with values in the range of [0.000, 9.000] and [0.000, 11.000], respectively; for active DPP4 inhibitors, median =3.000, mean =2.735, and Q3 =3.000, and for inactive DPP4 inhibitors, median =2.000, mean =2.373, and Q3 =3.000. Furthermore, the histogram for active DPP4 inhibitors does not differ from that of inactive DPP4 inhibitors. Notably, all of these results indicated that the nHDon between active and inactive DPP4 inhibitors was significantly different, with P<0.001.
nHAcc represents the number of hydrogen bond acceptors present in a molecule. The mean values of rotatable bonds of DPP4 inhibitors are in the range of 6.897±2.122 (active) and 4.991±2.217 (inactive), whereas the values of descriptive statistics are Min =1.000, Q1 =5.000, median =7.000, mean =6.897, Q3 =8.000, and Max =16.000 for active DPP4 inhibitors, and Min =1.000, Q1 =4.000, median =5.000, mean =4.991, Q3 =6.000, and Max =25.000 for inactive DPP4 inhibitors. The histograms of these two inhibitor classes were found to differ from each other. These results indicated that the nHAcc for active and inactive DPP4 inhibitors was significantly different, with P<0.001.
ALogP is a computational estimation of the logarithm of the 1-octanol/water partition coefficient, and it is a well-known measure of molecular hydrophobicity. The mean values of ALogP are 1.556±1.488 and 1.859±1.691 for active and inactive DPP4 inhibitors, respectively, which are different, and the values of descriptive statistics confirm this finding, with values of Min =−2.936, Q1 =0.586, median =1.571, mean =1.566, Q3 =2.586, and Max =6.598 for active DPP4 inhibitors, and Min =−2.485, Q1 =0.848, median =1.806, mean =1.859, Q3 =2.949, and Max =7.528 for inactive DPP4 inhibitors. Additionally, the histograms of active and inactive DPP4 inhibitors were significantly different, with P<0.001.
TPSA is an empirical measure of the polar surface area of a molecule, and it describes the contribution of polar atoms to the molecular charge. TPSA is frequently used in the study of drug transport properties such as intestinal absorption10 and blood–brain barrier permeability.11 High TPSA, in addition to indicating that the molecule possesses a complex surface charge environment, also indicates that the molecule inherently possesses poor membrane permeability and would need to rely on active transport, such as membrane-bound receptors. The mean value of active DPP4 inhibitors (89.490±26.130) is greater than that of inactive DPP4 inhibitors (72.002±32.154); moreover, a six-number statistical descriptive confirms that the characteristics of active and inactive DPP4 inhibitors differ, with Min =29.260, Q1 =72.800, median =85.250, mean =89.490, Q3 =103.660, and Max =234.780 for active DPP4 inhibitors, and Min =3.240, Q1 =47.720, median =72.350, mean =72.002, Q3 =88.840, and Max =351.810 for inactive DPP4 inhibitors. These results indicated that the overall pattern of active and inactive DPP4 inhibitors, including the histogram shape in Figure 2A, were significantly different, with P<0.001.
Qm is a global measure of the molecular charge. The mean values of active and inactive DPP4 inhibitors are 0.222±0.034 and 0.213±0.030, respectively. Histograms of these two inhibitor classes were significantly different, with P<0.001. A six-number statistical descriptive confirms this finding, with range values of [0.137, 0.535] for active DPP4 inhibitors and [0.142, 0.346] for inactive DPP4 inhibitors, whereas the top quartiles are [0.202, 0.236] for active DPP4 inhibitors and [0.193, 0.231] for inactive DPP4 inhibitors.
Energy is the sum of the atomic energy. The mean values of active and inactive DPP4 inhibitors are −0.144±0.183 and −0.119±0.129, respectively. Notably, the distributions of these two inhibitor classes are significantly different, with P<0.001. Furthermore, the six-number statistical descriptive indicates that active DPP4 inhibitors differ from inactive DPP4 inhibitors, ie, Min =−0.908, Q1 =−0.260, median =−0.123, mean =−0.144, Q3 =−0.017, and Max =0.488 for active DPP4 inhibitors, whereas Min =−1.281, Q1 =−0.172, median =−0.097, mean =−0.119, Q3 =−0.048, and Max =0.139 for inactive DPP4 inhibitors.
The dipole moment is a measure of the asymmetric distribution of charge in a molecule, where a low value suggests minimal charge distribution and vice versa. Table 1 indicates that the average value of active DPP4 inhibitors (9.842±15.038) is greater than that of inactive DPP4 inhibitors (4.443±3.303). The different patterns of these two DPP4 inhibitor classes are also indicated by a six-number statistical descriptive. The 6-number statistical descriptive of active DPP4 inhibitors consisted of Min =0.747, Q1 =4.075, median =5.831, mean =9.842, Q3 =8.111, and Max =284.562, whereas that of inactive DPP4 inhibitors consisted of Min =0.629, Q1 =2.890, median =3.961, mean =4.443, Q3 =5.262, and Max =42.433. The ranges of active and inactive DPP4 inhibitors were dramatically different, with values of [0.747, 284.562] and [0.629, 42.433], respectively, as shown in the corresponding histograms. Notably, these results indicated that the characteristics of active and inactive DPP4 inhibitors were significantly different, with P<0.001.
The HOMO and LUMO are the highest- and lowest-energy molecular orbitals that are occupied by electrons. The mean values of HOMO and LUMO in active and inactive DPP4 inhibitors are −0.352±0.038/−0.337±0.019 and −0.035±0.049/−0.007±0.031, respectively. The values of HOMO range from [−0.572, −0.286] for active DPP4 inhibitors and [−0.490, −0.290] for inactive DPP4 inhibitors, whereas the values of LUMO range from [−0.289, 0.047] for active DPP4 inhibitors and [−0.154, 0.100] for inactive DPP4 inhibitors. The top quartiles for HOMO are [−0.354, −0.331] for active DPP4 inhibitors and [−0.344, −0.329] for inactive DPP4 inhibitors, whereas the top quartiles for LUMO are [−0.039, −0.008] for active DPP4 inhibitors and [−0.022, 0.011] for inactive DPP4 inhibitors. Remarkably, the histograms of HOMO and LUMO indicate that the distributions of active and inactive DPP4 inhibitors are significantly different, with P<0.001.
HOMO–LUMO is the energetic difference between the HOMO and LUMO states. HOMO–LUMO is a measure of kinetic stability and chemical reactivity, as HOMO and LUMO descriptors play fundamental roles in electron donation and acceptance. A large gap suggests high kinetic stability and low chemical reactivity because it is energetically unfavorable to add electrons to a high-lying LUMO or to extract electrons from a low-lying HOMO to form the activated complex of a potential reaction. Conversely, a molecule with a small or no HOMO–LUMO is chemically reactive. The mean values of HOMO–LUMO are 0.318±0.026 and 0.331±0.029 for active and inactive DPP4 inhibitors, respectively. The distributions of active and inactive DPP4 inhibitors are quite different. Additionally, the six-number statistical descriptive confirms this finding, with range values of [0.217, 0.386] for active DPP4 inhibitors and [0.242, 0.414] for inactive DPP4 inhibitors, whereas the lower and upper boundaries are [0.301, 0.332] for active DPP4 inhibitors and [0.310, 0.347] for inactive DPP4 inhibitors. These results indicate that the characteristics of active and inactive DP4 inhibitors were significantly different, with P<0.001.
All of these results indicated that nearly all of the 13 descriptors were significantly different between the two inhibitor classes at the level of P<0.001 except for RBN (P=0.001). With the exception of RBN descriptors, the remaining descriptors are significantly different for active and inactive DPP4 inhibitors and are efficient for discrimination.
PCA analysis of active and inactive DPP4 inhibitors
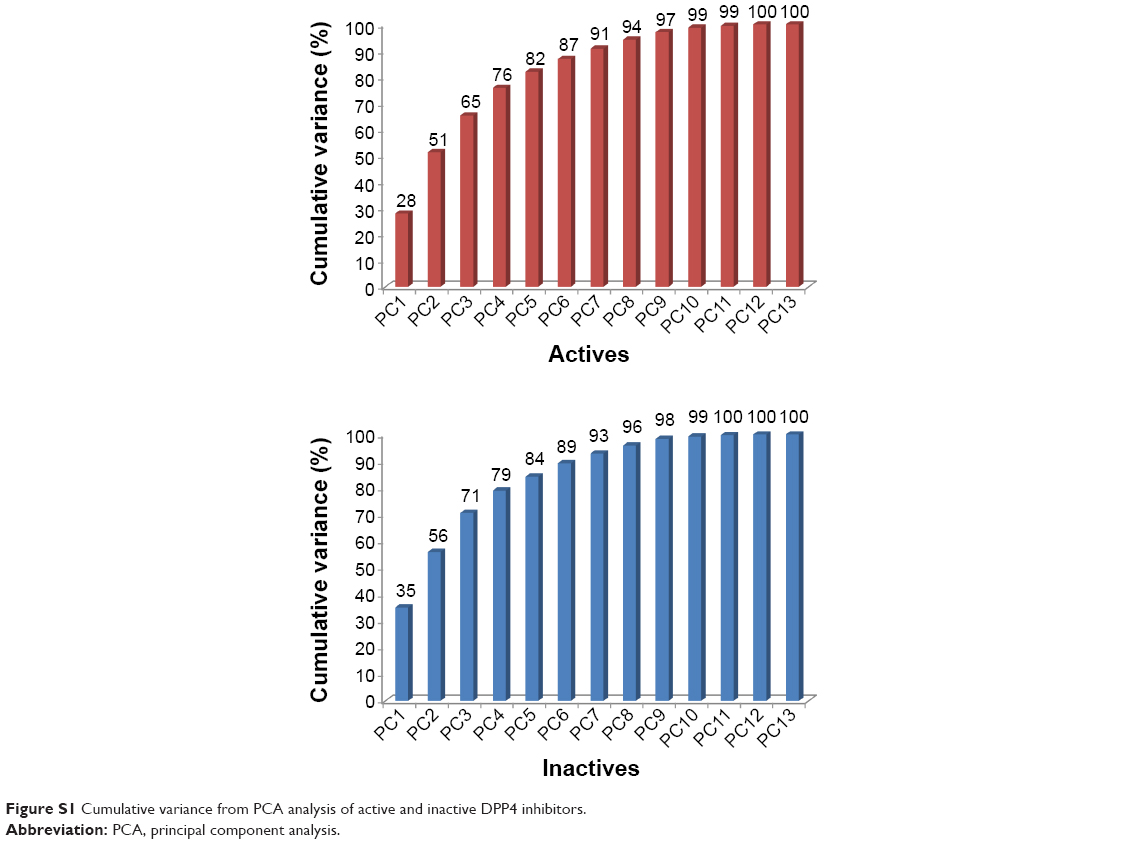
In this study, the 13 descriptors were analyzed by utilizing the first three PCs because the amount of cumulative variation of these PCs is as high as 70% of the original variance, as shown in Figure S1. Scores and loadings plots are presented in Figure 3A for actives (top row) and inactives (bottom row, bottom-left). Tables S1 and S2 show the loadings and contribution values, respectively, of each descriptor to the component. The contribution value of each descriptor can be obtained by the ratio of the squared factor score of this observation by the eigenvalue associated with that component.12
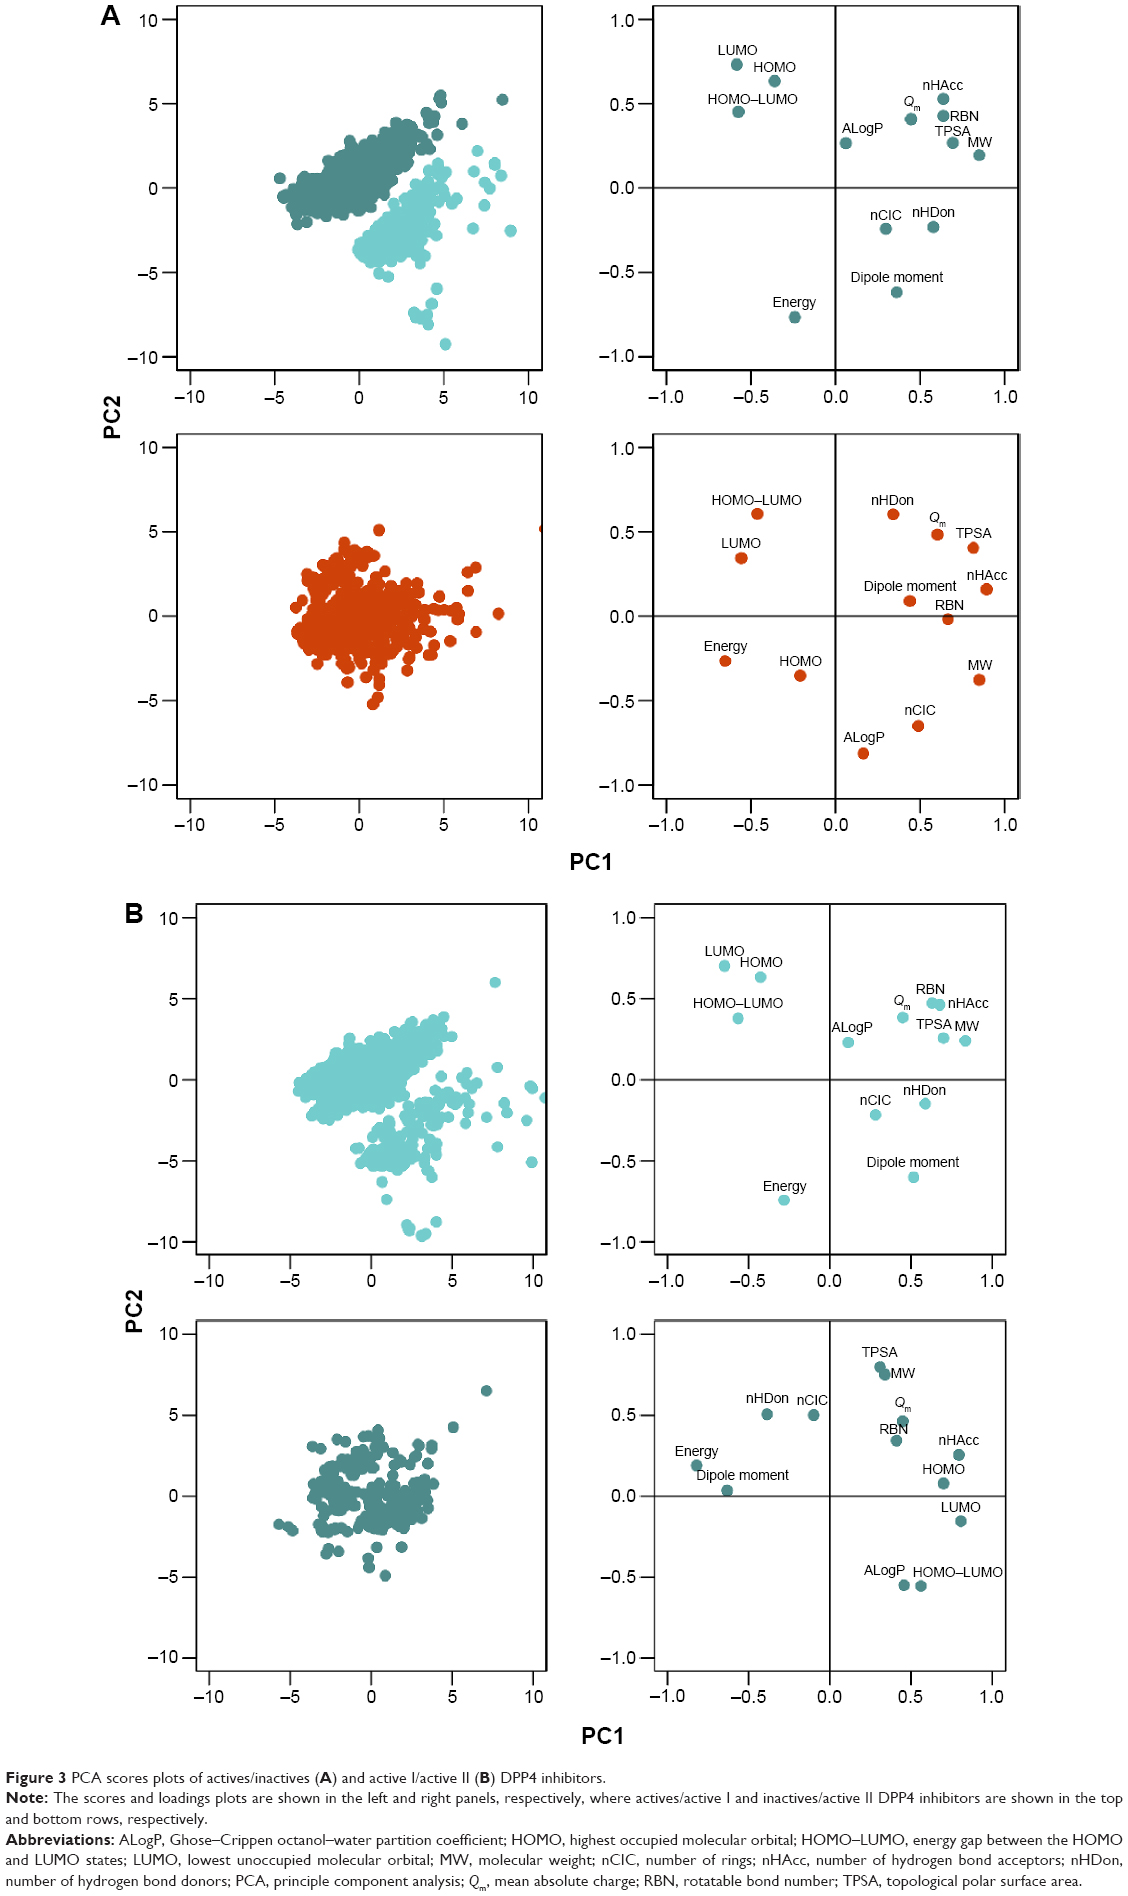 | Figure 3 PCA scores plots of actives/inactives (A) and active I/active II (B) DPP4 inhibitors. |
PC1 retained 27.93% and 35.06% of the original variance for active and inactive DPP4 inhibitors, respectively. Figure S1 indicates that the percentage of variance of inactive DPP4 inhibitors was higher than that of active DPP4 inhibitors. In Table S1 and Figure 3A (top-right), PC1 separates HOMO–LUMO from MW, RBN, nHDon, nHAcc, and TPSA for active DPP4 inhibitors, whereas in Figure 3A (bottom-right), PC1 separates energy from MW, RBN, nHAcc, TPSA, and Qm for inactive DPP4 inhibitors. For loadings score analysis, PC1 highly correlated with MW (0.849), RBN (0.638), nHDon (0.578), nHAcc (0.637), TPSA (0.693), and HOMO–LUMO (−0.575) for active DPP4 inhibitors, whereas in inactive DPP4 inhibitors, PC1 highly correlated with MW (0.849), RBN (0.664), nHAcc (0.893), TPSA (0.815), Qm (0.601), and energy (−0.654). These results indicated that PC1 correlated most strongly with MW and nHAcc for active and inactive DPP4 inhibitors, respectively. Furthermore, Table S2 also indicates that the MW descriptor highly contributes to PC1 for active DPP4 inhibitors, whereas the nHAcc descriptor highly contributes to PC1 for inactive DPP4 inhibitors. Descriptors consisting of nHDon, Qm, energy, and HOMO–LUMO influenced PC1 for either active or inactive DPP4 inhibitors. Interestingly, the four differential descriptors are reported with P<0.001 and are significantly different between active and inactive inhibitor classes. It may be assumed that these four differential descriptors represent the informative features that discriminate between active and inactive DPP4 inhibitors.
PC2, which is the direction uncorrelated with PC1, retained 20.82% and 20.82% of the original variance for active and inactive DPP4 inhibitors, respectively. Figure S1 indicates that the first two components can preserve 51.29% and 55.88% of the original variance of active and inactive DPP4 inhibitors, respectively. The results indicated that the percentage and cumulative percentage of variance for inactive DPP4 inhibitors were greater than those for active DPP4 inhibitors. In Table S1 and Figure 3A (top-right), PC2 separates dipole moment and energy from HOMO and LUMO for active DPP4 inhibitors, whereas in Figure 3A (bottom-right), PC2 of inactive DPP4 inhibitors separates ALogP and nCIC from nHDon and HOMO–LUMO. The PCA loadings scores indicate that PC2 highly correlated with energy (−0.765), dipole moment (−0.617), HOMO (0.637), and LUMO (0.732) for active DPP4 inhibitors, whereas for inactive DPP4 inhibitors, PC2 highly correlated with nCIC (−0.651), nHDon (0.605), ALogP (−0.813), and HOMO–LUMO (0.608). Furthermore, Table S2 indicates that the LUMO (17.664) and ALogP (24.441) descriptors highly contribute to PC1 for active and inactive DPP4 inhibitors, respectively. Table S1 indicates that descriptors consisting of nCIC, nHDon, ALogP, energy, dipole moment, HOMO, LUMO, and HOMO–LUMO influence PC2 in either active or inactive DPP4 inhibitors. Remarkably, the eight different descriptors are reported with P<0.001 and are significantly different between active and inactive DPP4 inhibitors. These eight different descriptors may represent the informative features that discriminate between active and inactive DPP4 inhibitors.
PC3, which is the direction that is orthogonal to both PC1 and PC2, accounted for 13.97% and 14.70% of the total variance for actives and inactives, respectively. Figure S1 indicates that the first three components can preserve 65.26% (active) and 70.58% (inactive) of the original variance. The results indicated that the percentage and cumulative percentage of variance of inactive DPP4 inhibitors remained larger than those of active DPP4 inhibitors. This result is consistent with the observation that the distribution of active DPP4 inhibitors can be further divided into two groups represented by the score plots in Figure 3A. In Table S1 and Figure 3A (top-right), it can be seen that PC3 separates Qm from nCIC and ALogP for active DPP4 inhibitors, whereas in Figure 3A (bottom-right), PC3 separates dipole moment from HOMO and LUMO for inactive DPP4 inhibitors. Table S1 indicates that PC3 highly correlated with nCIC (0.739), ALogP (0.564), and Qm (−0.542) for active DPP4 inhibitors, whereas PC3 highly correlated with dipole moment (−0.634), HOMO (0.698), and LUMO (0.671) for inactive DPP4 inhibitors. nCIC and HOMO were the descriptors with the highest correlation with PC1 for active and inactive DPP4 inhibitors, respectively. Furthermore, Table S2 indicates that the nCIC (30.046) and HOMO (25.521) descriptors highly contribute to PC3 for active and inactive DPP4 inhibitors, respectively. Table S1 indicates that descriptors consisting of Qm, nCIC, ALogP, dipole moment, HOMO, and LUMO influenced PC1 in either active or inactive DPP4 inhibitors. Interestingly, the six differential descriptors are reported with P<0.001 and are significantly different between active and inactive DPP4 inhibitors. These six different descriptors may represent the informative features that discriminate between active and inactive DPP4 inhibitors.
Analysis of active DPP4 inhibitors
Figure 3B indicates that the data points of the scores plots (top-left) of active DPP4 inhibitors can be well discriminated into two subclasses (called active I and active II DPP4 inhibitors). We assumed that the inhibitors in this class may be further separated into subclasses. Thus, in this section, the active DPP4 inhibitors were analyzed according to subclasses. Table 2 indicates that nine descriptors exhibit different patterns between active I and active II DPP4 inhibitors at the level of P<0.001 except for the five descriptors RBN (P=0.593), nCIC (P=0.001), ALogP (P=0.208), TPSA (P=0.026), and Qm (P=0.001). These five descriptors have average values of 5.000±2.240 (RBN), 3.103±0.895 (nCIC), 1.585±1.461 (ALogP), 89.981±26.752 (TPSA), and 0.223±0.034 (Qm) for active I DPP4 inhibitors, whereas active II DPP4 inhibitors have average values of 5.052±1.468 (RBN), 3.263±0.784 (nCIC), 1.463±1.628 (ALogP), 86.867±22.370 (TPSA), and 0.217±0.032 (Qm). In Figure 2B, the histograms of active I and active II DPP4 inhibitors indicated that these five descriptors were not different between the two subclasses. Therefore, except for these five descriptors, the remaining descriptors are significantly different for active I and active II DPP4 inhibitors and are efficient for discrimination.
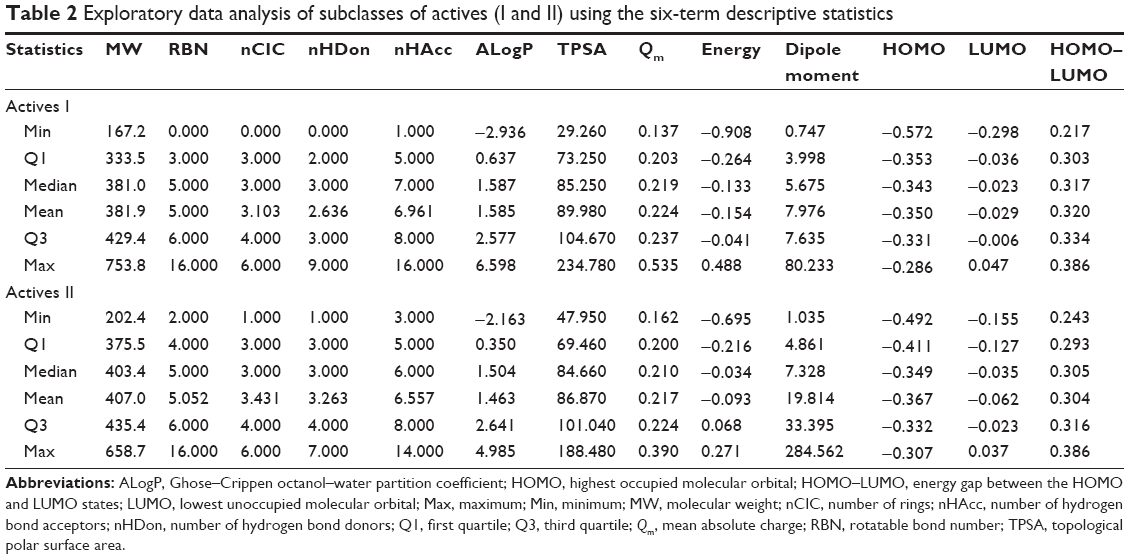 | Table 2 Exploratory data analysis of subclasses of actives (I and II) using the six-term descriptive statistics |
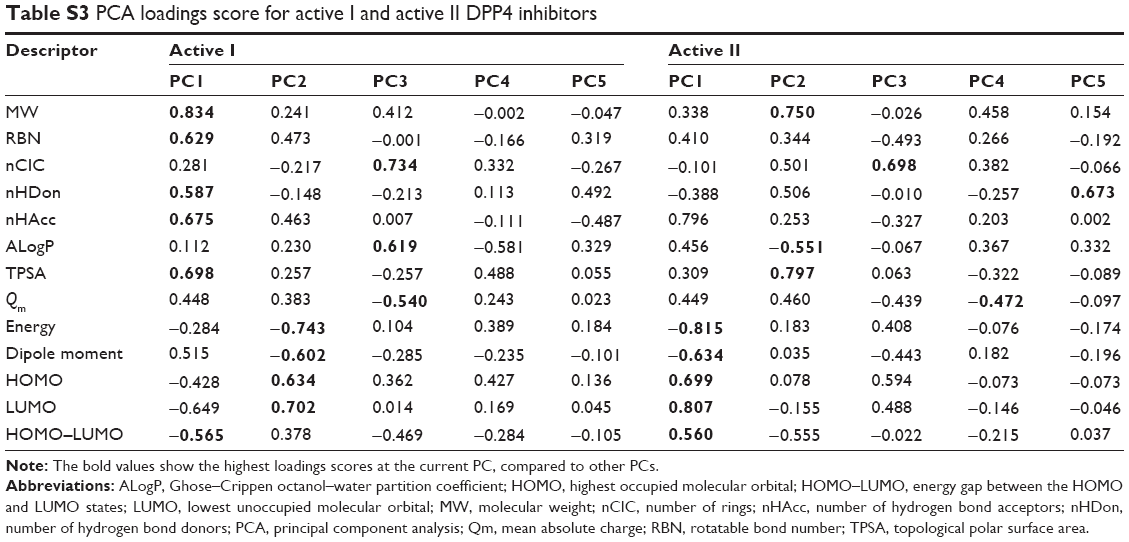
Figure 3B shows the scores and loadings plots for active I (top-left) and active II (bottom-left) DPP4 inhibitors. It is observed that the distribution of active I and active II DPP4 inhibitors cannot be further divided. The cumulative variances of the first three PCs of active I and active II DPP4 inhibitors were 66.63% and 68.21%, respectively, of the original variation and obtain 80.0% of the original variation performed on the first five PCs. To analyze the highest influence of each descriptor on PC, the loadings and contribution values are used, as shown in Tables S3 and S4, respectively. PC1 highly correlated with MW (0.834), RBN (0.629), nHDon (0.587), nHAcc (0.675), TPSA (0.698), and HOMO–LUMO (−0.565) for active I DPP4 inhibitors, whereas PC1 highly correlated with energy (−0.815), dipole moment (−0.634), HOMO (0.699), LUMO (0.807), and HOMO–LUMO (0.560) for active II DPP4 inhibitors. For PC2, the descriptors energy (−0.743), dipole moment (−0.602), HOMO (0.634), and LUMO (0.702) highly correlated with this component for active I DPP4 inhibitors, whereas MW (0.750), ALogP (−0.551), and TPSA (0.797) highly correlated with this component for active II DPP4 inhibitors. The third PC highly correlated with nCIC (0.734), ALogP (0.619), and Qm (−0.540) for active I DPP4 inhibitors, whereas PC3 highly correlated with nCIC (0.698) for active II DPP4 inhibitors. The descriptors of MW, energy, nCIC, and TPSA provide the absolute highest loadings score values on PC1, PC2, and PC3, respectively, for active I DPP4 inhibitors, whereas the descriptors energy, TPSA, and nCIC provide the absolute highest loadings score values on PC1, PC2, and PC3, respectively, for active II DPP4 inhibitors. These result are consistent with the contribution score of MW (17.639), energy (19.829), and nCIC (27.810), providing the highest values on PC1, PC2, and PC3, respectively, for active I DPP4 inhibitors, whereas the descriptors energy (16.193), TPSA (22.921), and nCIC (24.428) provide the highest PCA loadings score values on PC1, PC2, and PC3, respectively, for active II DPP4 inhibitors, as shown in Table S3.
Prediction and identification of informative molecular descriptors for DPP4 inhibitors
In this study, a QSAR model based on the J48 algorithm is presented for discriminating DPP4 inhibitors as either actives or inactives. Each compound was calculated as an M-dimensional vector where M =13. The encoded compounds from the DPP4-TRN set were then used to construct a QSAR model, which was represented by a DT. To evaluate the internal prediction capacity of our proposed QSAR model on the DPP4-TRN set, two different experiments were performed: one experiment was performed on the full training data and one experiment was evaluated using a tenfold cross validation (CV) procedure as shown in Table 3. The CV procedure was performed by firstly partitioning the data into ten equally-sized segments or folds; then, nine folds were used as the training data while the remaining fold was used for validation. Finally, the results were then averaged across the ten experiments. Four measurements were used to assess the performance of the QSAR models, namely accuracy (Acc), sensitivity (Sen), specificity (Spec), and the Matthews correlation coefficient (MCC). Our proposed QSAR model yielded 96.43% Acc, 98.30% Sen, 94.38% Spec, and 0.929 MCC as performed on the full training data. The prediction results from the tenfold CV procedure were 82.26% Acc, 84.69% Sen, 79.59% Spec, and 0.644 MCC. This result indicated the superiority of the 13 molecular descriptors in predicting DPP4 inhibitors to provide Acc higher than 80.0% and a MCC as high as 0.644.
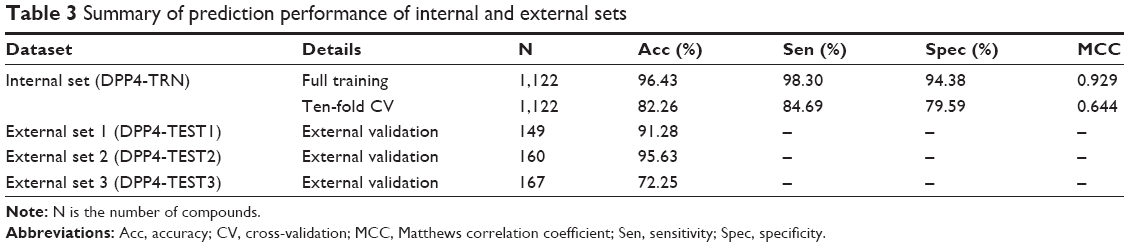 | Table 3 Summary of prediction performance of internal and external sets |
Identification of informative molecular descriptors provided a better understanding of the different characteristics between active and inactive DPP4 inhibitors. After construction of the DT, the informative molecular descriptor could be identified using the feature usage score. A molecular descriptor having the highest feature usage is the most important feature because it contributes the most to prediction performances. Figure 4 shows the feature usage of each descriptor or descriptor usage by using the J48 algorithm on DPP4-TRN.34 The top five informative molecular descriptors having a descriptor usage score larger than 30 were MW, LUMO, nHDon, nHAcc, and ALogP. Interestingly, for the five top-ranked and informative molecular descriptors, the distributions of active and inactive DPP4 inhibitors were significantly different, with P<0.001, as shown in Table 1. Furthermore, the three external validation sets were used for evaluating the robustness and generalization ability of the proposed QSAR model established from the DPP4-TRN. Figure S2 shows the overview of Tanimoto coefficient for the four dataset as a heatmap. For example, the top-right panel shows the heatmap of DPP4-TRN versus DPP4-TEST2. Prediction results for QSAR model of DPP4-TEST1, DPP4-TEST2, and DPP4-TEST3 achieved test accuracies of 91.28%, 95.63%, and 72.25%, respectively. Based on our results, it could be concluded that our proposed QSAR model was efficient in prediction of DPP4 inhibitors into either actives or inactives and filtration of inactive DPP4 inhibitors from active DPP4 inhibitors.
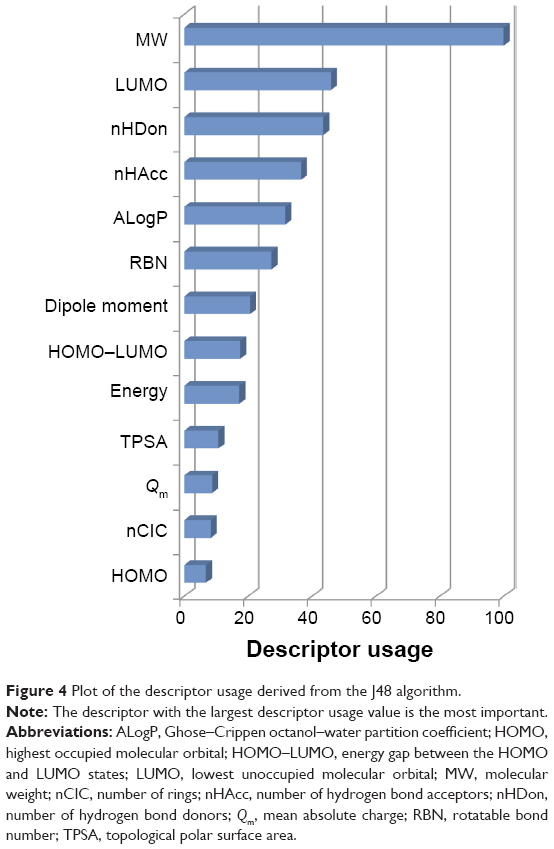 | Figure 4 Plot of the descriptor usage derived from the J48 algorithm. |
Chemical substructure analysis
Chemical substructure analysis of active and inactive DPP4 inhibitors is an effective approach to identify important chemical fragments that may govern the biological activity toward the DPP4 enzyme. Tables 4 and 5 summarize the top ten fragments of the active and inactive inhibitor classes, respectively. The top ten fragments of active inhibitors indicated that pyrrolidine-based, thiazolidine-based, amino amide-based, pyridine-based, piperazine-based, and aromatic-based fragments are essential for DPP4 inhibition. The fragment 1-ethyl-2-fluorobenzene ranked first (617 counts), followed by 2-amino-1-(pyrrolidin-1-yl)ethan-1-one (597 counts). The occurrence of these top two fragments is clearly greater than that of the remaining fragments, as indicated by the fragment counts (Table 4), which indicate their important roles in DPP4 inhibition.
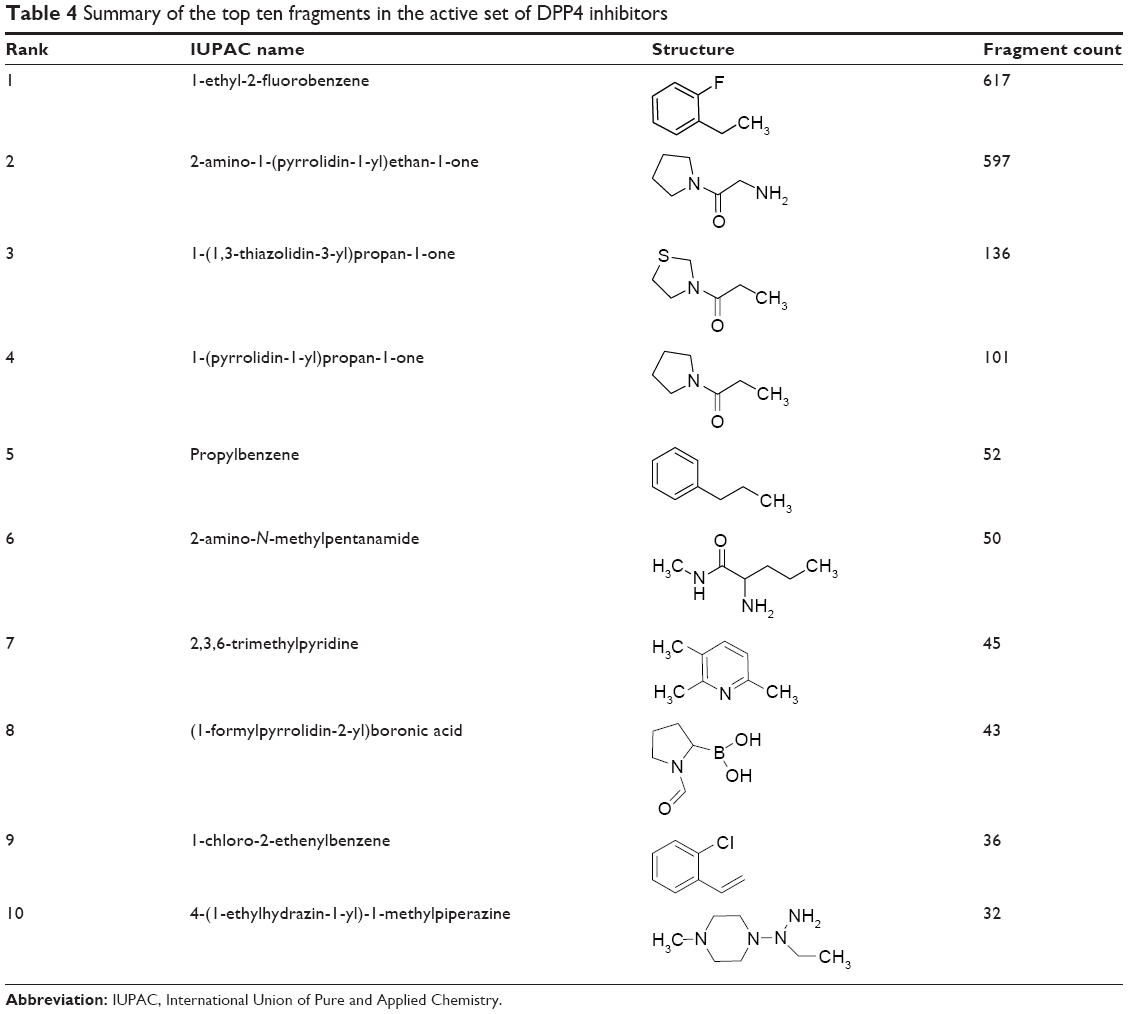 | Table 4 Summary of the top ten fragments in the active set of DPP4 inhibitors |
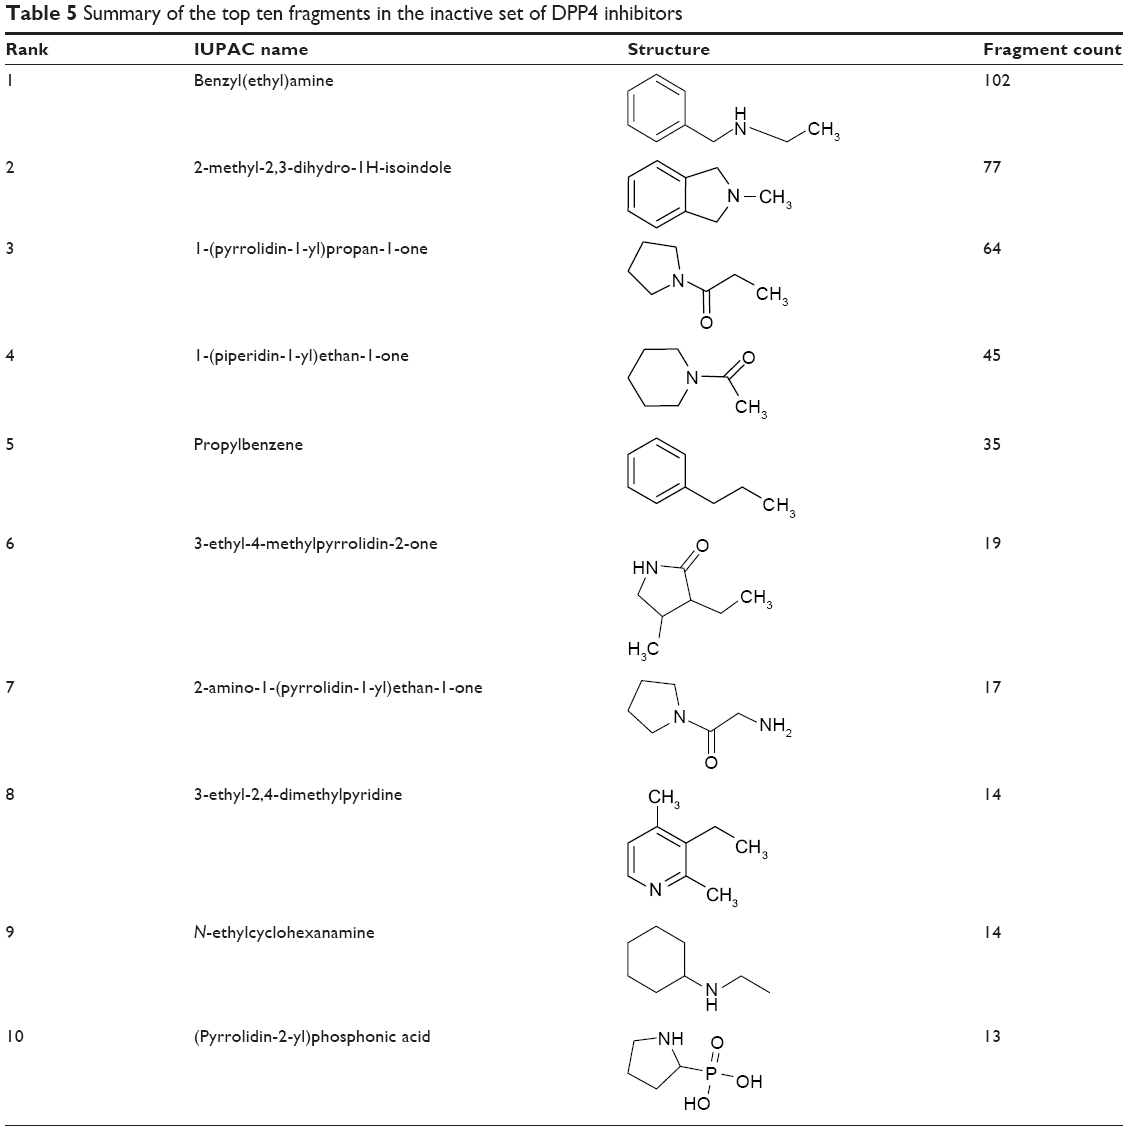 | Table 5 Summary of the top ten fragments in the inactive set of DPP4 inhibitors |
Because DPP4 prefers substrates containing proline or alanine at position 2 of the N-terminus, many inhibitors have been designed based on the peptidomimetic concept.12 These peptidomimetic inhibitors are categorized as glycine-based and β-alanine-based types.12 Pyrrolidine has been used as a core structure in the design of both inhibitor types with respect to its functional groups that play crucial roles for interaction at the active site of the enzyme. The DPP4 inhibitory activities of these inhibitors are similarly accomplished by hydrophobic and van der Waals interactions,39 as well as hydrogen-bond and salt-bridge formation.12 The active site of DPP4 consists of a catalytic triad (Ser630, H740, and D708), oxyanion hole, and specific residues, ie, S1 and S2 pockets.12,39 All known DPP4 inhibitors have been reported to occupy these pockets for inhibition.39
The most frequently found fragment is 1-ethyl-2-fluorobenzene, which is a highly lipophilic aromatic-based fragment. The aryl substitution on the C-4 position of the pyrrolidine ring has been noted to improve the stability and duration of DPP4 inhibitors.40 In addition, the fluorine substituent on the C-4 position of the pyrrolidine ring has been reported to provide good inhibitory properties, selectivity, and pharmacokinetic profiles.41 The preferable pharmacokinetic profile may result from a lipophilic property governed by a planar aromatic ring and halogen atoms, which facilitates cell entry to the target site of action. In this study, a similar aromatic-based fragment containing a halogen atom, ie, 1-chloro-2-ethenylbenzene, was found as the ninth-ranked fragment. Additional aromatic-based fragments were also ranked as top ten fragments, such as propylbenzene and 2,3,6-trimethylpyridine. It could be hypothesized that the flexibility of the rotatable alkyl chain in the propylbenzene fragment may facilitate cell penetration and hydrophobic interactions at the active site, and the nitrogen atom in the pyridine ring of 2,3,6-trimethylpyridine may play a role in H-bond formation in the DPP4 active site.
The pyrrolidine amide is considered a key moiety in the design of DPP4 inhibitors.12 Most of the potent inhibitors have been developed by substitution of the amide moiety of this core structure with an electrophile42–44 that forms a covalent adduct with Ser630 of the DPP4 active site.12 Therefore, it is not surprising that among the top ten fragments, the pyrrolidine-based fragments, ie, 2-amino-1-(pyrrolidin-1-yl)ethan-1-one, 1-(pyrrolidin-1-yl)propan-1-one, and (1-formylpyrrolidin-2-yl)boronic acid, appear to be the most frequently occurring fragments. Notably, the 2-amino-1-(pyrrolidin-1-yl)ethan-1-one fragment, which is presented in many compounds, has been used as a prototype for structural modification.12 All of these fragments are amide derivatives of pyrrolidine. It is possible that the oxygen atom of the amide functional group may be essential for H-bond formation with the DPP4 active site.12 In addition, the amine group has been noted for its role in forming a salt-bridge with Glu205 and/or Glu206 of DPP4.12 Moreover, the boronic acid derivative of pyrrolidine amide, (1-formylpyrrolidin-2-yl)boronic acid, ranked eighth. This finding supported the fact that substitution of boronic acid at the 2-position of the pyrrolidine ring is effective for DPP4 inhibition, as observed from the progress of talabostat into Phase III clinical trials.12,44
The thiazolidine derivative fragment, 1-(1,3-thiazolidin-3-yl)propan-1-one, ranked third. Clearly, the shape of this fragment is similar to that of pyrrolidine amide derivatives (ie, 2-amino-1-(pyrrolidin-1-yl)ethan-1-one and 1-(pyrrolidin-1-yl)propan-1-one) except for the presence of a sulfur atom in the five-membered ring. The thiazolidine analog of pyrrolidine-based compounds has been noted for its stability, potency, selectivity, and oral bioavailability.45–47
The amide-based fragment, ie, 2-amino-N-methylpentanamide, was found to be the sixth-ranked fragment. The X-ray crystal structure indicated that the amide moiety is essential for a key interaction in DPP4 inhibition.12 The amino group (-NH2) forms a salt-bridge with Glu205, and the O atom of the carbonyl group (-C=O) forms an H-bond with Arg125 in the DPP4 active site.12 In addition, the piperazine-based fragment, ie, 4-(1-ethylhydrazin-1-yl)-1-methylpiperazine, was found as the tenth-ranked fragment. DPP4 inhibitors containing a piperazine substituent have been reported to exhibit high potency.48
Notably, some fragments of active inhibitors, ie, 2-amino-1-(pyrrolidin-1-yl)ethan-1-one, 1-(pyrrolidin-1-yl)propan-1-one, and propylbenzene, were also found in the top ten fragments of the inactive inhibitor class. This finding may indicate that the inhibitory activities of DPP4 inhibitors are influenced by additional factors. The results of the inactive inhibitors (Table 5) indicated that the type and position of the substituents, type of functional groups, appropriate size, and arrangement of substructures may be crucial for DPP4 inhibition. For example, the effect of the position of substituents and the length of the alkyl chain were found when comparing 2,3,6-trimethylpyridine (active) and 3-ethyl-2,4-dimethylpyridine (inactive).
Scaffold analysis
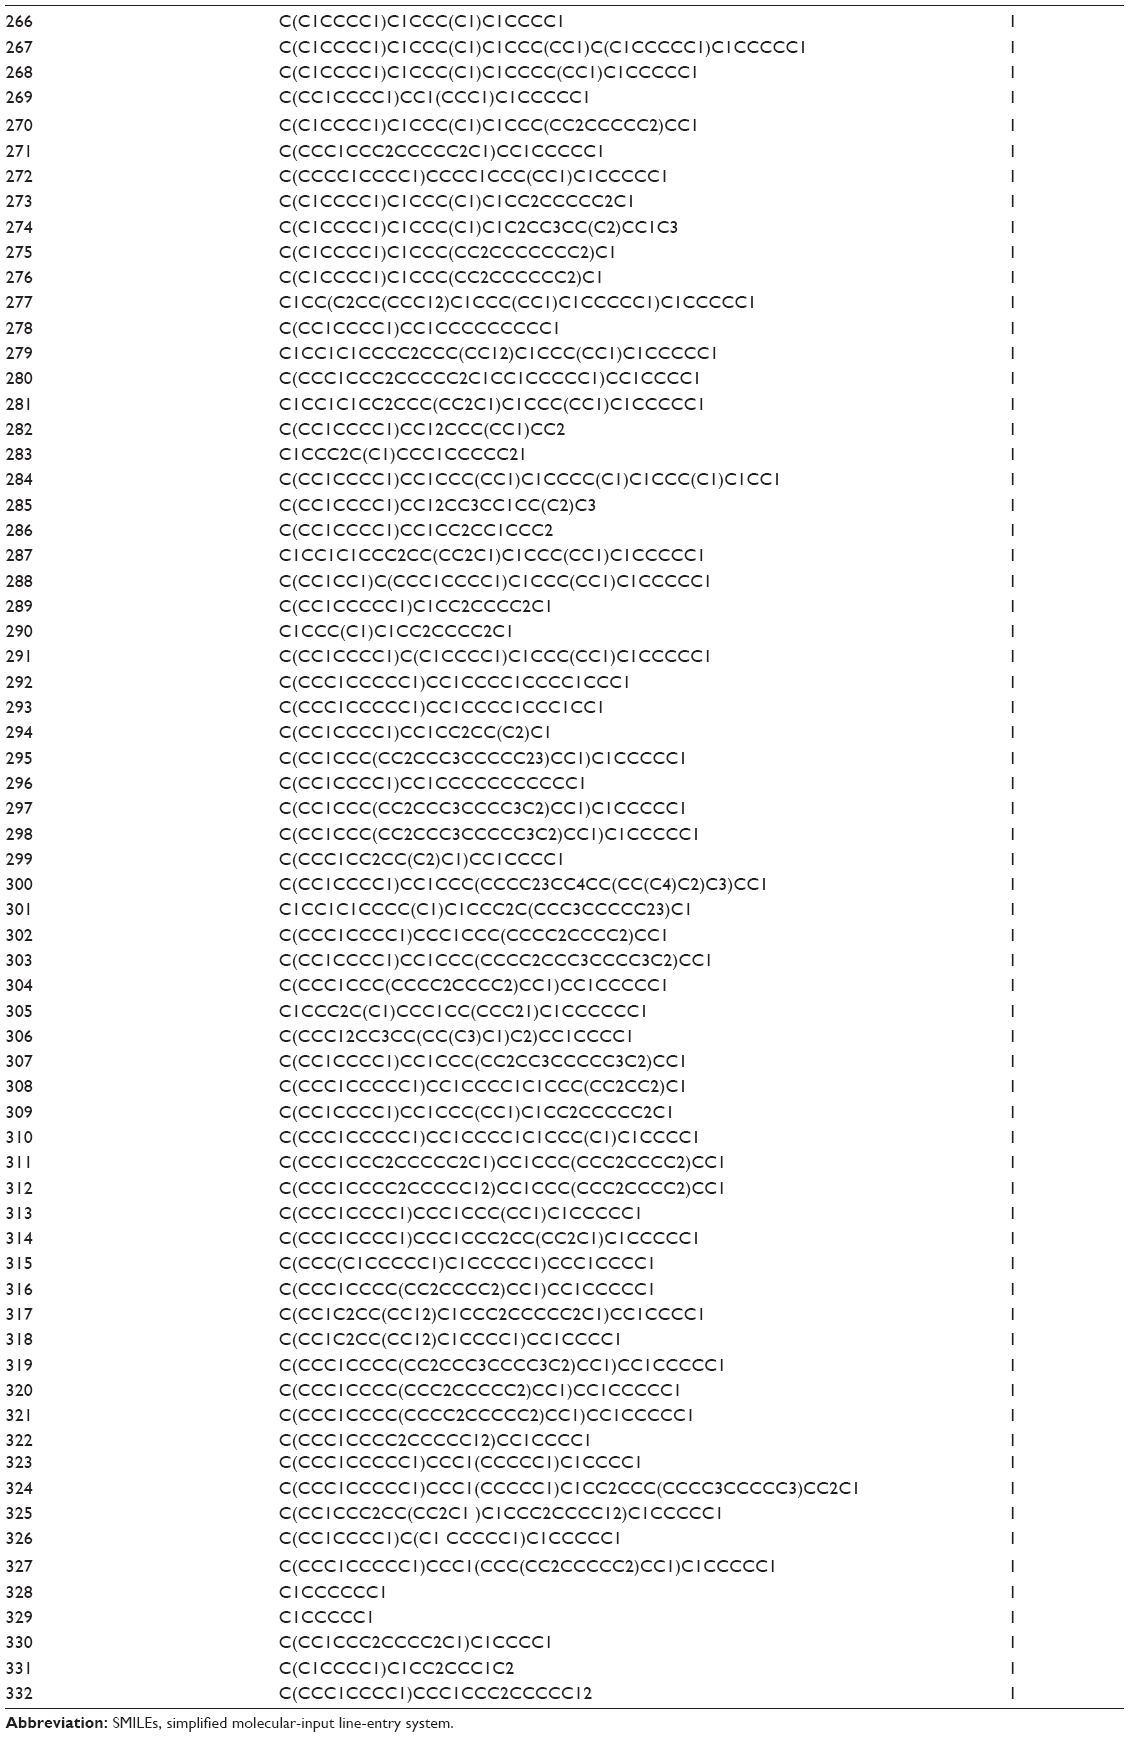
Analysis of the molecular scaffold of DPP4 inhibitor was performed in order to discern important core structures giving rise to their bioactivity. Datasets of both active and inactive DPP4 inhibitors were subjected to molecular scaffold analysis using the Bemis–Murcko framework clustering method as implemented by JKlustor version 0.07.49 In brief, this clustering method initially generates molecular frameworks representing molecular scaffolds as derived from compounds in datasets by removing side chain atoms from the main structures and finally presenting them in the form of a molecular graph, which is subsequently clustered based on the Bemis–Murcko framework algorithm.50 A total of 332 and 152 scaffolds were obtained for actives and inactives, respectively. The large number of molecular scaffolds that were obtained is indicative of the higher diversity of molecular patterns presented in the dataset. Herein, this result suggests that molecular patterns in active DPP4 inhibitors are more diverse than their inactive counterpart. Further in-depth analysis of scaffolds from both active and inactive classes was performed by comparing members of each molecular scaffold from both classes. It was found that there were no significant differences in the molecular frameworks for both classes as can be seen in Tables S5 and S6 and Figure 5. This suggested that the important structures responsible for the bioactivity were functional groups as well as substructures of molecules.
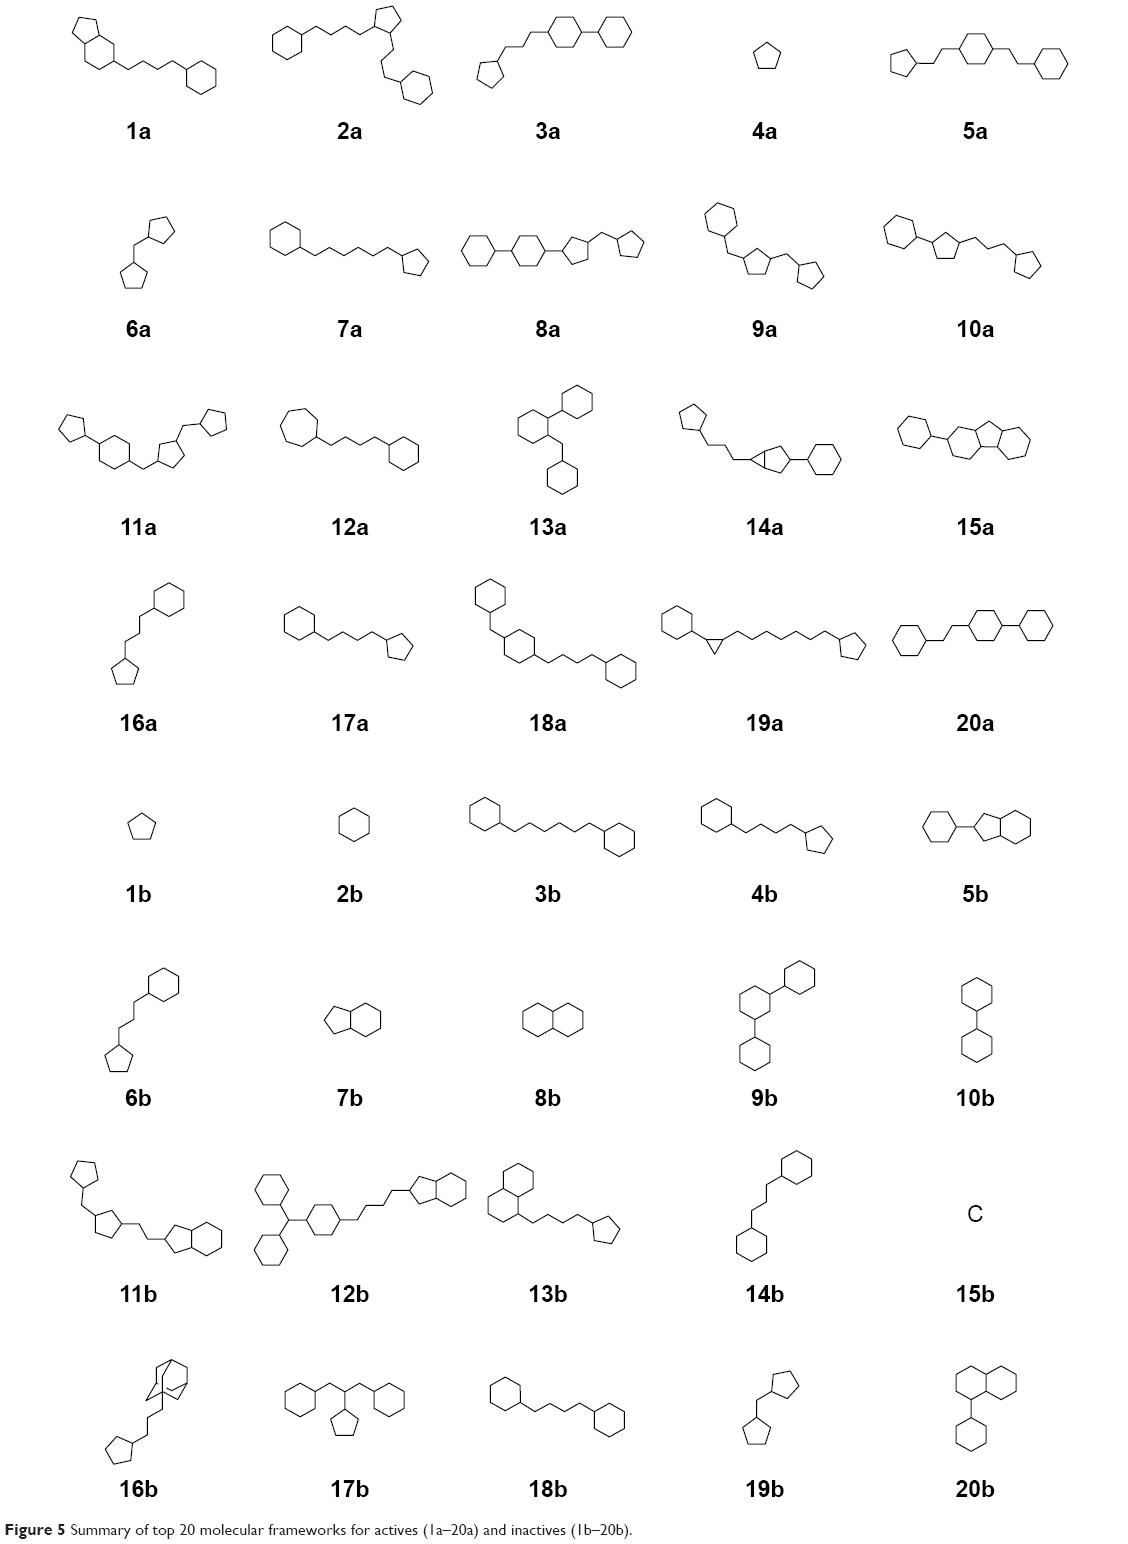 | Figure 5 Summary of top 20 molecular frameworks for actives (1a–20a) and inactives (1b–20b). |
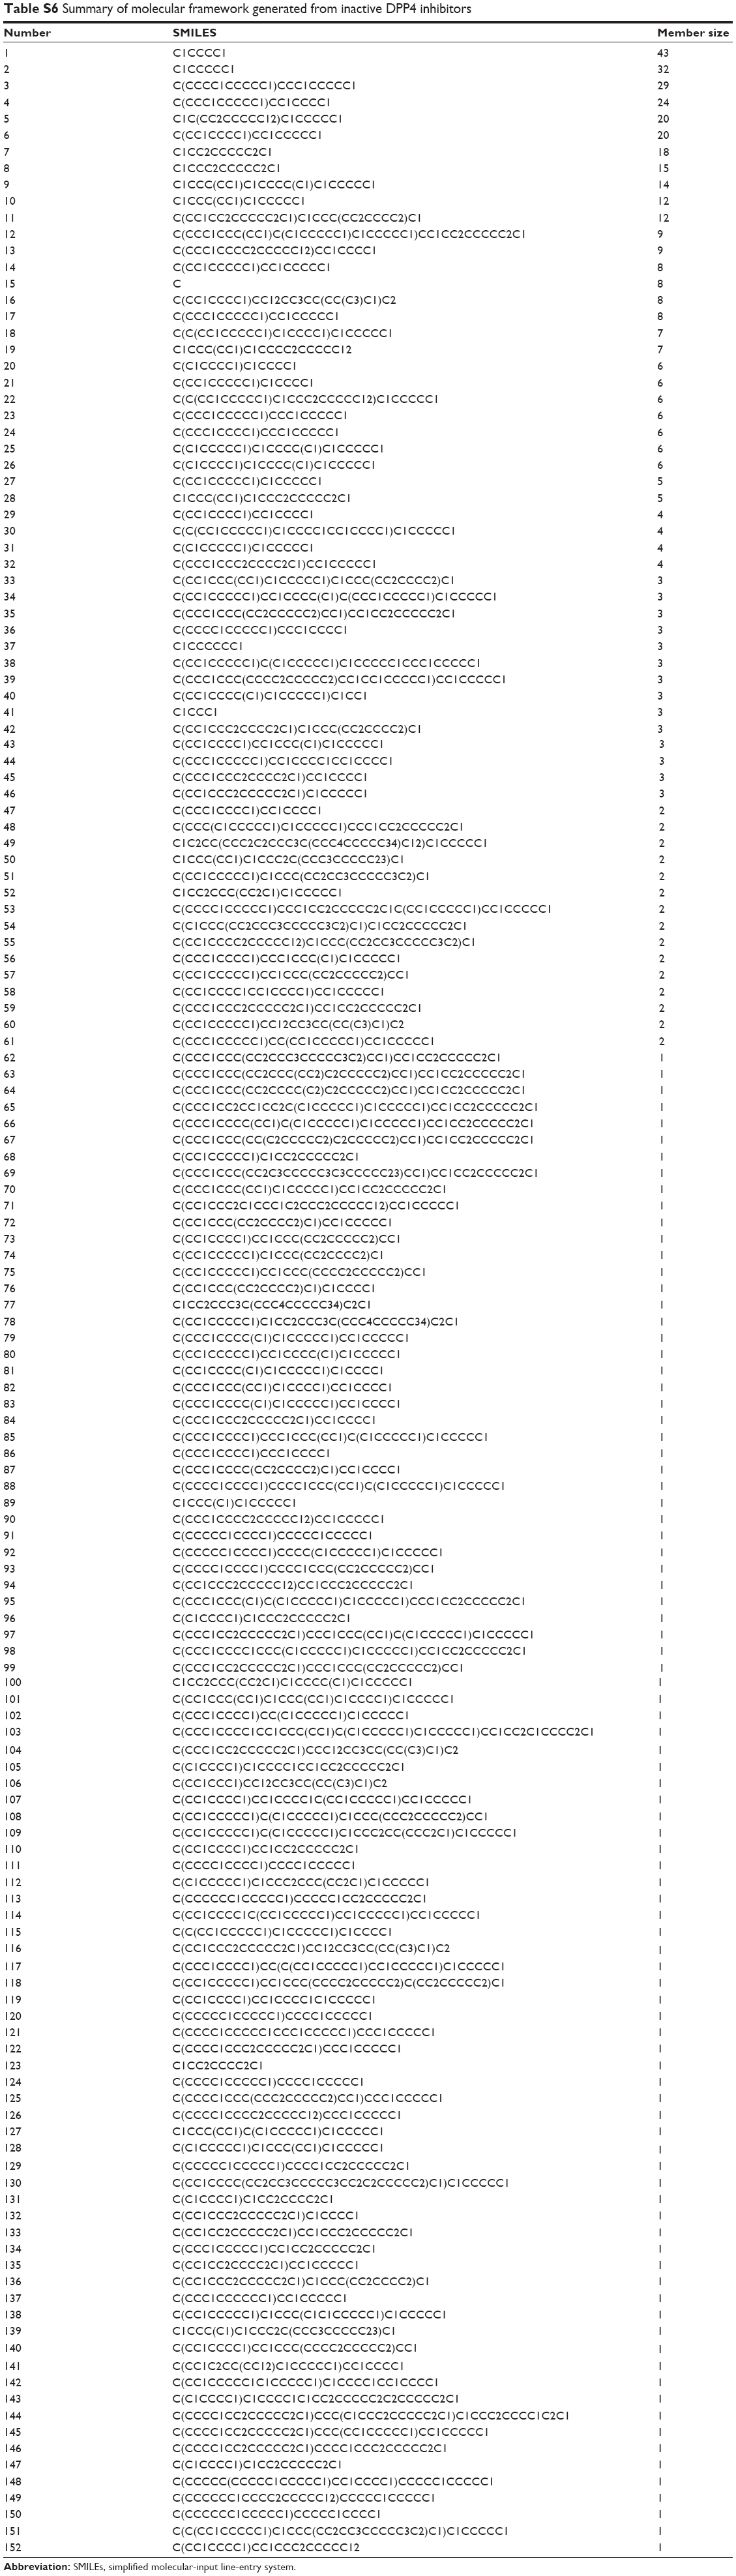
In order to elucidate such important substructures, Klekota–Roth fingerprints consisting of 4,860 descriptors were generated by the PaDEL-Descriptor software on DPP4-TRN.51,52 Consequently, a mean decrease of the Gini index (MDGI) as derived from random forest53,54 was used as the basis for selecting the most important feature from the initial set of 4,860 descriptors. The descriptor having the highest MDGI value was deemed to be the most important feature because it affords the most influence to the prediction performance. The set of 30 top-ranked fingerprints having the largest MDGI values are summarized in Figure S3 and Table S7. It can be seen that the most important structural fingerprint is piperazine-1-carbaldehyde (KRFP4541) with a MDGI value as high as 9.197. Meanwhile, the second most important structural fingerprint with a MDGI value of 3.610 is the piperazine ring (KRFP2428). Interestingly, the significance of piperazine is supported by the fact that it is an important structural part of oral antihyperglycemic agents called gliptins, which target DPP4 receptors and have been approved by the US Food and Drug Administration (FDA) for use in T2D treatment. Particularly, sitagliptin and teneligliptin, which are piperazine containing gliptins, have shown an additional mode of binding with the DPP4 receptor. In brief, the DPP4 inhibitors can be categorized into three classes according to their binding subsites.55 Class I DPP4 inhibitors (ie, vildagliptin and saxagliptin) employed cyanopyrrolidine and hydroxyl adamantyl moieties to bind to S1 and S2 subsites of the DPP4 active site, respectively. In addition to the binding mode of class I, class II DPP4 inhibitors (ie, two recently released DPP4 inhibitors alogliptin and linagliptin) can further engage in π–π interaction with S’1 and S’2 subsites. As for class III DPP4 inhibitors (ie, sitagliptin and teneligliptin), the presence of the piperazine ring at the P2 position engages in interaction with the S2 extensive subsite and introduces the “anchor lock domain” resulting in an increase of the binding activity owing to the stronger hydrophobic interactions mediated by this domain.56–59 In addition, results of contact area calculation of this domain also revealed correlation between the binding surface and the inhibitory activity against DPP4 receptor, further emphasizing the importance of this domain.55 Nevertheless, the role of piperazine derivatives in DPP4 inhibitory activity is not only found in these two drugs but is also reported in various DPP4 inhibitors that are under active development.60–62
Binding mode of DPP4 inhibitors
Molecular docking and subsequent post-docking analyses using the SiMMap server identified the common binding mode of DPP4 inhibitors as well as key interactions with the enzyme. The SiMMap server provided a site-moiety map of the binding pocket along with details on conserved interacting residues, moiety preferences, and interaction types.37 Analyses based on 100 active DPP4 inhibitors revealed three different binding anchors (HB1, HB2, and vdW) and their moiety preferences (Figure 6). The anchor HB1 comprised side chains of Arg125, Glu205, Glu206, and Tyr662 while anchor HB2 contained only the hydroxyl side chain of Tyr547. Both anchors were found to make hydrogen bonds with several nitrogen functional groups (ie, amine-, amide-, imine-, and nitrile-based) as well as ketone-based moieties of the inhibitors. In contrast, the anchor vdW consisted primarily of hydrophobic side chains of Tyr547, Tyr631, Trp659, Tyr662, and Tyr666 as well as the hydroxyl group of the catalytic residue Ser630. This pocket formed van der Waals contacts with aromatic, heterocyclic, and aliphatic moieties of DPP4 inhibitors. It should be noted that from our SiMMap analyses, the anchor HB1 has been known as the S2 pocket, which is involved in key salt bridge interactions of either the free amino terminus of a peptide substrate or the cationic groups of an inhibitor with the carboxylate side chains of Glu205 (and/or Glu206) as well as the guanidinium side chain of Arg125, which also helps stabilize either the amide carbonyl group of a substrate or the ketone moiety of an inhibitor.7,12 The anchor vdW corresponds to the S1 selectivity pocket of the enzyme that has been shown to be occupied with specific benzene- and pyrrolidine-based moieties of the DPP4 inhibitors.7,12
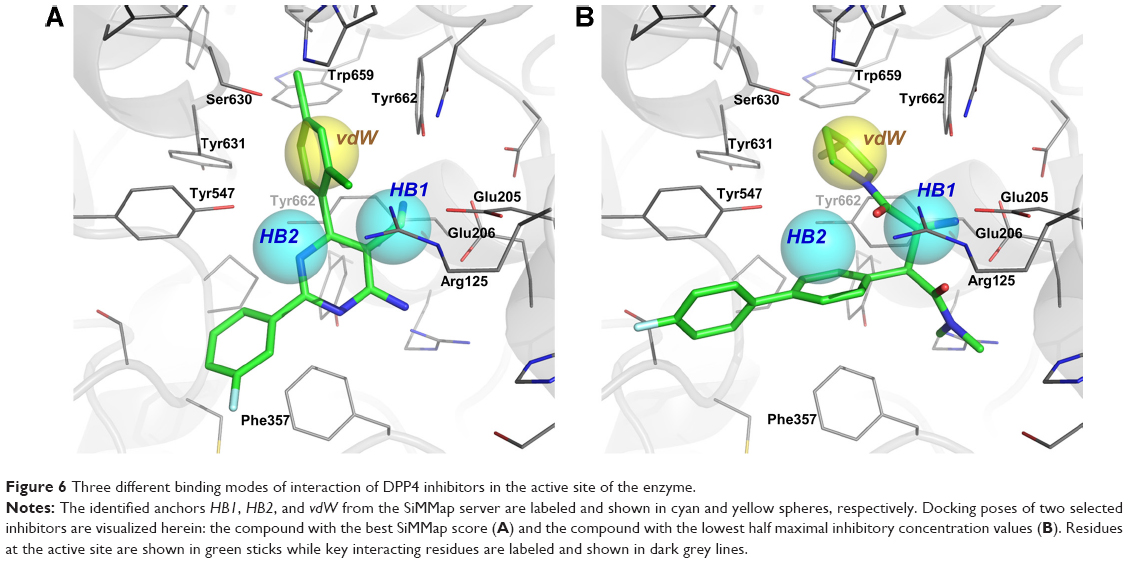 | Figure 6 Three different binding modes of interaction of DPP4 inhibitors in the active site of the enzyme. |
It should be noted that at least the first five DPP4 inhibitors with the best SiMMap score contained the amine-, amide-, and aromatic moieties for making interactions with all three different binding anchors (HB1, HB2, and vdW) of the enzyme. These findings suggested the significance of moiety preferences of inhibitors for binding and inhibiting DPP4 as well as serve as a general guideline for the design of novel inhibitors towards DPP4.
Comparison with FDA-approved drugs
In order to investigate the similarity between compounds investigated herein with those of FDA-approved DPP4 inhibitors, Tanimoto coefficient was computed for each compound in the dataset as well as six FDA-approved DPP4 inhibitors (ie, sitagliptin, vildagliptin, saxagliptin, alogliptin, linagliptin, and teneligliptin). The Tanimoto coefficient is a well-known metric for assessing the pairwise similarity between two molecules in which higher score represents high similarity. Results revealed that four of six DPP4 inhibitors (ie, sitagliptin, vildagliptin, saxagliptin, and linagliptin) were included in our curated dataset as observed from a Tanimoto coefficient of 1.000. The closest analog in our dataset to alogliptin and teneligliptin had Tanimoto coefficients of 0.819 and 0.602, respectively. Manual inspection of the pairwise Tanimoto coefficients between each compound of the dataset and the six FDA-approved drugs revealed that there were indeed several analogs of FDA-approved drugs present in the dataset. Such presence of analogs of FDA-approved drugs may densely populate the dataset and possibly mask the effect of less densely populated compounds. Concomitant with this issue is the observed imbalance in size of actives and inactives. Particularly, the rather small size of inactives may arise from the possibility that poor results for DPP4 inhibitory assays may not be published as often and therefore may contribute to the lower number of inactives. As fuzzy C-means clustering was applied in sampling the dataset for QSAR modeling, such aforementioned chemical space bias would not exert its influence on the constructed QSAR models.
A further look at the bioactivity of compounds exhibiting Tanimoto coefficient ≥0.5 to FDA-approved DPP4 inhibitors was performed. It was observed that the number of highly similar compounds with sitagliptin, vildagliptin, saxagliptin, alogliptin, linagliptin, and teneligliptin were 131, 273, 266, 87, 76, and 60 compounds, respectively. Of these compounds, a total of 130, 214, 192, 86, 76, and 60 compounds were classified as actives (IC50 less than 1 μM) for sitagliptin, vildagliptin, saxagliptin, alogliptin, linagliptin, and teneligliptin, respectively. Interestingly, a total of 59 and 74 compounds exhibiting high similarity with vildagliptin and saxagliptin, respectively, were classified as inactive. The R-group analysis of pyrrolidine as privileged structure of these molecules revealed pertinent insight of important substituent at positions 1, 2, and/or 5 on this ring. Alkyl group connected with nitrogen atom at position 1 seemed to be an important position since many structural modifications were observed at this position, which is followed by positions 2 and/or 5 where active moiety is usually nitrile. Herein, functional group and molecular fragment modifications based on commercially available DPP4 inhibitors could be a potent initial structure for further improving its bioactivity. Nevertheless, the agreement of binding mode to DPP4 receptor of any modified structures should be considered at the same time in order to abstain from steric effects that could lead to lowered bioactivity.
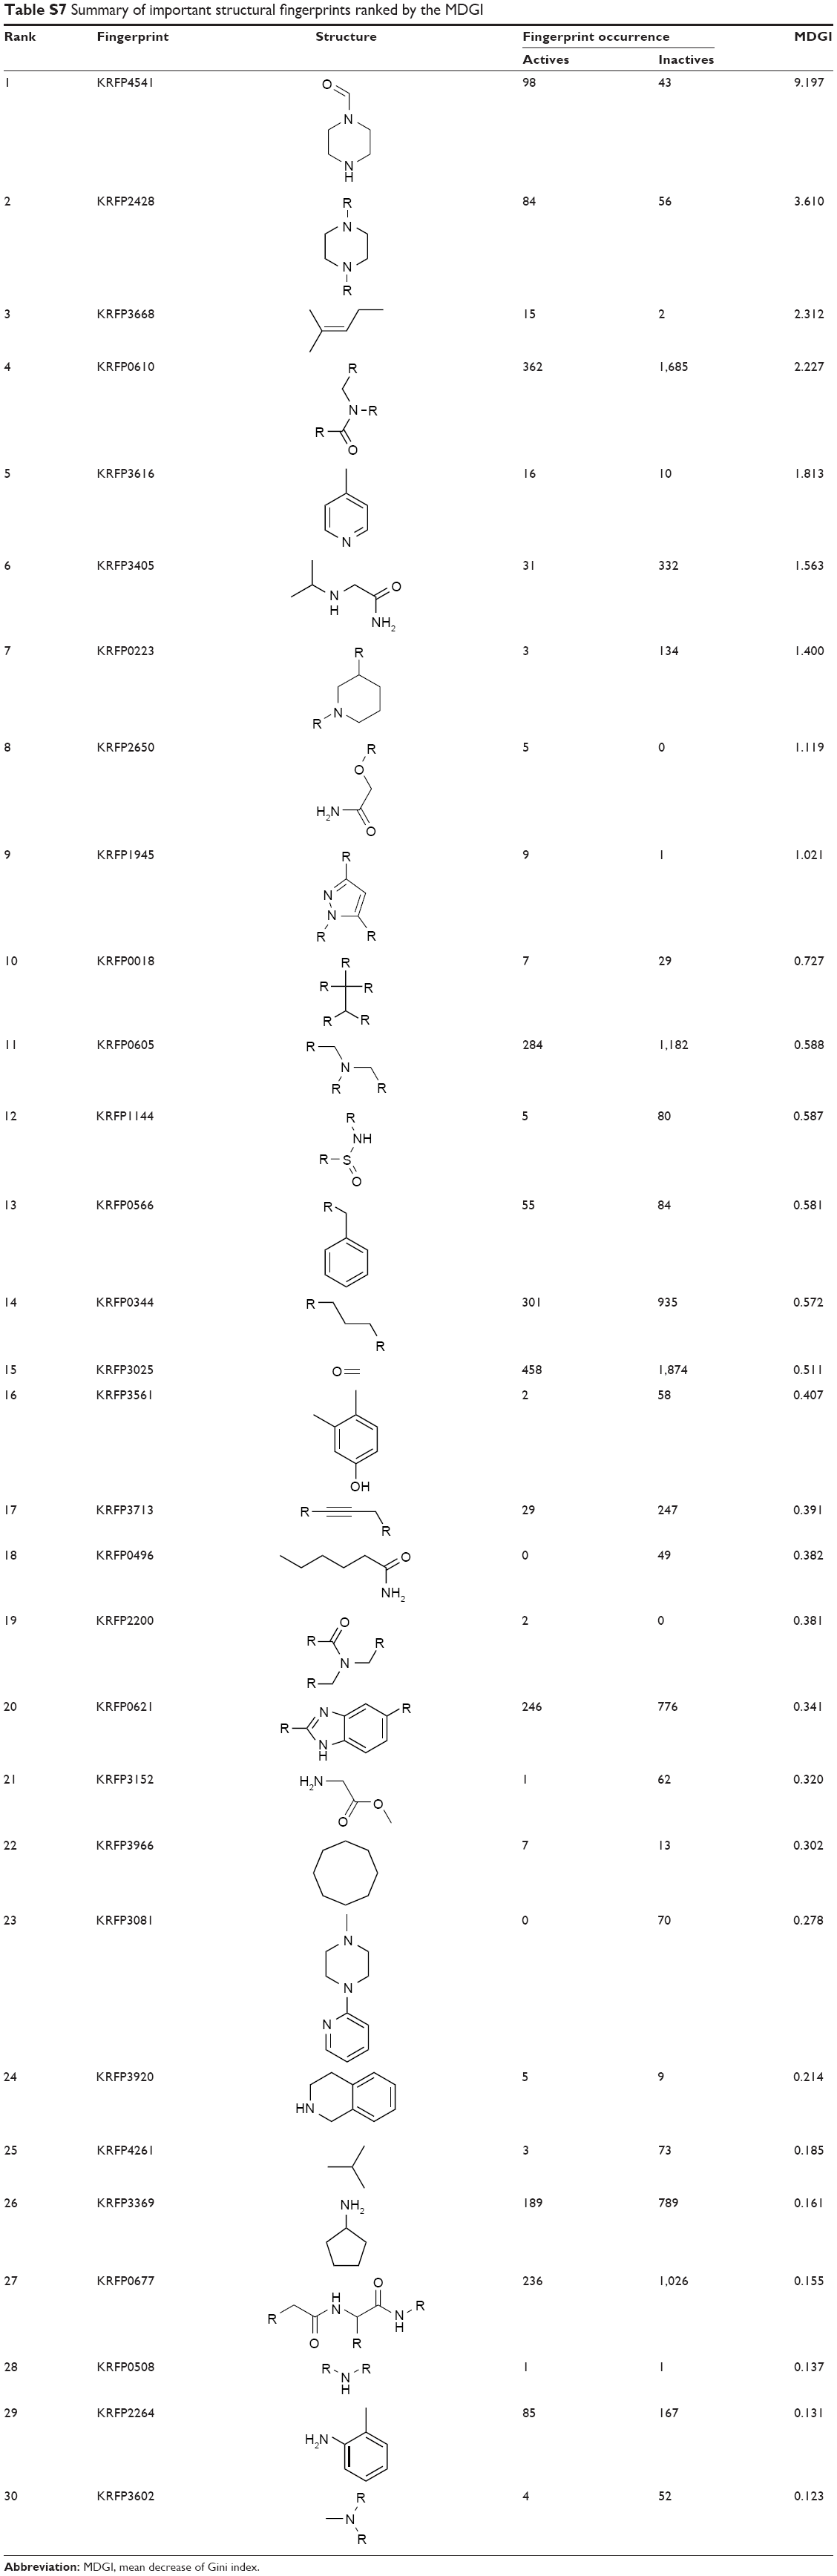
Furthermore, the Lipinski’s rule of five was applied to the compiled compounds from all datasets and results are summarized in Table S8. Interestingly, it can be seen that compounds belonging to the internal set (DPP4-TRN) along with the external set (DPP4-TEST3) afforded roughly similar percentages of compounds passing the rule of five at approximately 90%, while DPP4-TEST1 and DPP4-TEST2 afforded close to 70%. The former sets contained primarily proteins belonging to the DPP family while the latter sets represent random proteins and proteases. Furthermore, actives (~94%) from DPP4-TRN provided higher percentages than their inactive counterpart (~84%–89%).
Limitations
In exploring the chemical space of DPP4 inhibitors through various means, an issue arises pertaining to the possibility of chemical space bias that may be inherently present in the compiled datasets. It should be noted that compounds were derived from the BindingDB, and although it is assumed to house nearly all (if not all) bioactivity data of DPP4, there is a possibility that some negative results for investigated compound series against DPP4 may not be published, while those that are published are those reporting favorable results for compounds affording nanomolar potency or those that further optimize lead compounds undergoing clinical trials. Bias may arise from medicinal chemists who may have inherent preference for certain chemical scaffolds, which could be attributed to the existence of common chemistry or the use of known fragments commonly found in drugs called privileged structures.63 Thus, great caution should be taken in evaluating the essential functionality giving rise to potent bioactivity.
Conclusion
The search for novel antidiabetic agents has become increasingly important in drug design and development in light of the continual increase in the prevalence of diabetes worldwide. The inhibition of DPP4 is one strategy to combat diabetes. This study reports the large-scale chemical space exploration and QSAR investigation of DPP4 inhibitors. The QSAR model constructed by 13 descriptors provided good predictive performance as represented by an Acc close to 83.0% and a MCC as high as 0.644 for tenfold CV. In addition, a set of descriptors was identified as informative features influencing the predictive performance. The univariate analysis revealed the inherent physicochemical properties and important substructures governing inhibitory activity. The active inhibitors were found to be larger and more charged, polar, flexible, and stable than the inactive inhibitors. Furthermore, the chemical substructure analysis suggested that highly lipophilic aromatic-based and pyrrolidine-based fragments may be essential for DPP4 inhibition. Furthermore, the scaffold analysis revealed piperazine to be a privileged structure affording DPP4 inhibitory activity. Finally, our findings may provide a deeper understanding and pertinent knowledge for the design and development of DPP4 inhibitors.
Acknowledgments
This work was supported by the following funding agencies: Mahidol University Postdoctoral Fellowship (to W Shoombuatong under the supervision of C Nantasenamat and V Prachayasittikul) and an Annual Budget Grant (BE 2556-2558) from Mahidol University.
Disclosure
The authors report no conflicts of interest in this work.
References
Shaw JE, Sicree RA, Zimmet PZ. Global estimates of the prevalence of diabetes for 2010 and 2030. Diabetes Res Clin Pract. 2010;87:4–14. | ||
Centers for Disease Control and Prevention. National Diabetes Statistics Report, 2014. 2014. Available from: http://www.cdc.gov/diabetes/data/statistics/2014statisticsreport.html. Accessed Juyly 7, 2015. | ||
American Diabetes Association. Economic costs of diabetes in the U.S. in 2012. Diabetes Care. 2013;36:1033–1046. | ||
Moller DE. New drug targets for type 2 diabetes and the metabolic syndrome. Nature. 2001;414:821–827. | ||
Moneva MH, Dagogo-Jack S. Multiple drug targets in the management of type 2 diabetes. Curr Drug Targets. 2002;3:203–221. | ||
Holst JJ, Deacon CF. Inhibition of the activity of dipeptidyl-peptidase IV as a treatment for type 2 diabetes. Diabetes. 1998;47:1663–1670. | ||
Juillerat-Jeanneret L. Dipeptidyl peptidase IV and its inhibitors: therapeutics for type 2 diabetes and what else? J Med Chem. 2014;57: 2197–2212. | ||
Patel BD, Ghate MD. Recent approaches to medicinal chemistry and therapeutic potential of dipeptidyl peptidase-4 (DPP-4) inhibitors. Eur J Med Chem. 2014;74:574–605. | ||
Kawalec P, Mikrut A, Łopuch S. The safety of dipeptidyl peptidase-4 (DPP-4) inhibitors or sodium-glucose cotransporter 2 (SGLT-2) inhibitors added to metformin background therapy in patients with type 2 diabetes mellitus: a systematic review and meta-analysis. Diabetes Metab Res Rev. 2014;30:269–283. | ||
Karagiannis T, Boura P, Tsapas A. Safety of dipeptidyl peptidase 4 inhibitors: a perspective review. Ther Adv Drug Saf. 2014;5:138–146. | ||
Zhao Y, Yang L, Zhou Z. Dipeptidyl peptidase-4 inhibitors: multitarget drugs, not only antidiabetes drugs. J Diabetes. 2014;6:21–29. | ||
Havale SH, Pal M. Medicinal chemistry approaches to the inhibition of dipeptidyl peptidase-4 for the treatment of type 2 diabetes. Bioorg Med Chem. 2009;17:1783–1802. | ||
Nantasenamat C, Isarankura-Na-Ayudhya C, Naenna T, et al. A practical overview of quantitative structure-activity relationship. Excli J. 2009;8:74–88. | ||
Nantasenamat C, Isarankura-Na-Ayudhya C, Prachayasittikul V. Advances in computational methods to predict the biological activity of compounds. Expert Opin Drug Discov. 2010;5:633–654. | ||
Nicola G, Liu T, Gilson MK. Public domain databases for medicinal chemistry. J Med Chem. 2012;55:6987–7002. | ||
Scior T, Bernard P, Medina-Franco JL, Maggiora GM. Large compound databases for structure-activity relationships studies in drug discovery. Mini Rev Med Chem. 2007;7:851–860. | ||
Liu T, Lin Y, Wen X, Jorissen RN, Gilson MK. BindingDB: a web-accessible database of experimentally determined protein-ligand binding affinities. Nucleic Acids Res. 2007;35:D198–D201. | ||
Zhou B, Ha M, Wang C. An Improved Algorithm of Unbalanced Data SVM. In: Cao BY, Wang G, Chen S, Guo S, editors. Fuzzy Information and Engineering 2010. Vol 1. Berlin, Heidelberg: Springer; 2010:549–555. | ||
Funatsu K, Miyao T, Arakawa M. Systematic generation of chemical structures for rational drug design based on QSAR models. Curr Comput Aided Drug Des. 2011;7:1–9. | ||
Tetko IV, Sushko I, Pandey AK, et al. Critical assessment of QSAR models of environmental toxicity against Tetrahymena pyriformis: focusing on applicability domain and overfitting by variable selection. J Chem Inf Model. 2008;48:1733–1746. | ||
Liu R, Tawa G, Wallqvist A. Locally weighted learning methods for predicting dose-dependent toxicity with application to the human maximum recommended daily dose. Chem Res Toxicol. 2012;25: 2216–2226. | ||
Osoda T, Miyano S. 2D-Qsar for 450 types of amino acid induction peptides with a novel substructure pair descriptor having wider scope. J Cheminform. 2011;3:50. | ||
MarvinSketch, Version 6.2.1. Budapest: ChemAxon Ltd.; 2014. Available from: http://www.chemaxon.com | ||
OpenEye Scientific Software. Babel, Version 3.3.0. Santa Fe: OpenEye Scientific; 2014. Available from: http://www.eyesopen.com | ||
Frisch MJ, Trucks GW, Schlegel HB, et al. Gaussian 09, Revision A.1; Wallingford, Connecticut, 2009. | ||
Nantasenamat C, Li H, Mandi P, et al. Exploring the chemical space of aromatase inhibitors. Mol Divers. 2013;17:661–677. | ||
Goodman SN. Toward evidence-based medical statistics. 1: The P value fallacy. Ann Intern Med. 1999;130:995–1004. | ||
Jolliffe IT. Principal component analysis. In: Everitt BS, Howell DC, editors. Encyclopedia of Statistics in Behavioral Science. John Wiley and Sons, Inc.; 2005;3:1580–1584. | ||
Ringnér M. What is principal component analysis? Nat Biotechnol. 2008;26:303–304. | ||
Lê S, Josse J, Husson F. FactoMineR: an R package for multivariate analysis. J Stat Softw. 2008;25:1–18. | ||
Palomba D, Martínez MJ, Ponzoni I, Díaz MF, Vazquez GE, Soto AJ. QSPR models for predicting log P(liver) values for volatile organic compounds combining statistical methods and domain knowledge. Molecules. 2012;17:14937–14953. | ||
Hammann F, Gutmann H, Baumann U, Helma C, Drewe J. Classification of cytochrome p(450) activities using machine learning methods. Mol Pharm. 2009;6:1920–1926. | ||
Witten IH, Frank E, Hall MA. Data Mining: Practical Machine Learning Tools and Techniques. 3rd ed. Amsterdam: Morgan Kaufmann; 2011. | ||
Quinlan JR. C4.5: programs for machine learning. San Francisco: Morgan Kaufmann; 1993. | ||
JChem, Version 14.8.18.0. Budapest: ChemAxon Ltd.; 2014. Available from: http://www.chemaxon.com | ||
Morris GM, Huey R, Lindstrom W, et al. AutoDock4 and AutoDockTools4: Automated docking with selective receptor flexibility. J Comput Chem. 2009;30:2785–2791. | ||
Chen YF, Hsu KC, Lin SR, Wang WC, Huang YC, Yang JM. SiMMap: a web server for inferring site-moiety map to recognize interaction preferences between protein pockets and compound moieties. Nucleic Acids Res. 2010;38:W424–W430. | ||
DeLano WL. PyMol, version 0.99; Schrödinger, LLC; 2010. | ||
Metzler WJ, Yanchunas J, Weigelt C, et al. Involvement of DPP-IV catalytic residues in enzyme–saxagliptin complex formation. Protein Sci. 2008;17:240–250. | ||
Kondo T, Sugimoto I, Nekado T, et al. Design and synthesis of long-acting inhibitors of dipeptidyl peptidase IV. Bioorg Med Chem. 2007;15:2715–2735. | ||
Haffner CD, McDougald DL, Reister SM, et al. 2-Cyano-4-fluoro-1-thiovalylpyrrolidine analogues as potent inhibitors of DPP-IV. Bioorg Med Chem Lett. 2005;15:5257–5261. | ||
Senten K, Daniëls L, Van der Veken P, et al. Rapid parallel synthesis of dipeptide diphenyl phosphonate esters as inhibitors of dipeptidyl peptidases. J Comb Chem. 2003;5:336–344. | ||
Demuth HU, Baumgrass R, Schaper C, Fischer G, Barth A. Dipeptidylpeptidase IV – inactivation with N-peptidyl-O-aroyl hydroxylamines. J Enzyme Inhib. 1988;2:129–142. | ||
Snow RJ, Bachovchin WW. Boronic acid inhibitors of dipeptidyl peptidase IV: A new class of immunosuppressive agents. In: Maryanoff BE, Maryanoff CA, editors. Advances in Medicinal Chemistry. Vol 3. Elsevier; 1995:149–177. | ||
Sorbera LA, Revel L, Castañer J. P32/98: Antidiabetic Dipeptidyl-Peptidase IV Inhibitor. Drugs Future. 2001;26:859–864. | ||
Epstein BJ. Drug evaluation: PSN-9301, a short-acting inhibitor of dipeptidyl peptidase IV. Curr Opin Investig Drugs. 2007;8:331–337. | ||
Parmee ER, He J, Mastracchio A, et al. 4-Amino cyclohexylglycine analogues as potent dipeptidyl peptidase IV inhibitors. Bioorg Med Chem Lett. 2004;14:43–46. | ||
Brockunier LL, He J, Colwell LF Jr, et al. Substituted piperazines as novel dipeptidyl peptidase IV inhibitors. Bioorg Med Chem Lett. 2004; 14:4763–4766. | ||
JKlustor, Version 14.8.18.0. Budapest: ChemAxon Ltd.; 2014. Available from: http://www.chemaxon.com | ||
Bemis GW, Murcko MA. The properties of known drugs. 1. Molecular frameworks. J Med Chem. 1996;39:2887–2893. | ||
Yap CW. PaDEL-descriptor: an open source software to calculate molecular descriptors and fingerprints. J Comput Chem. 2011;32: 1466–1474. | ||
Klekota J, Roth FP. Chemical substructures that enrich for biological activity. Bioinformatics. 2008;24:2518–2525. | ||
Breiman L. Random forests. Mach Learn. 2001;45:5–32. | ||
Breiman L, Friedman J, Stone CJ, Olshen RA. Classification and regression trees. CRC press, New York; 1984. | ||
Nabeno M, Akahoshi F, Kishida H, et al. A comparative study of the binding modes of recently launched dipeptidyl peptidase IV inhibitors in the active site. Biochem Biophys Res Commun. 2013;434:191–196. | ||
Yoshida T, Akahoshi F, Sakashita H, et al. Discovery and preclinical profile of teneligliptin (3-[(2S,4S)-4-[4-(3-methyl-1-phenyl-1H-pyrazol-5-yl)piperazin-1-yl]pyrrolidin-2-ylcarbonyl]thiazolidine): A highly potent, selective, long-lasting and orally active dipeptidyl peptidase IV inhibitor for the treatment of type 2 diabetes. Bioorg Med Chem. 2012;20:5705–5719. | ||
Yoshida T, Sakashita H, Akahoshi F, Hayashi Y. [(S)-gamma-(4-Aryl-1-piperazinyl)-l-prolyl]thiazolidines as a novel series of highly potent and long-lasting DPP-IV inhibitors. Bioorg Med Chem Lett. 2007;17:2618–2621. | ||
Kim D, Wang L, Beconi M, et al. (2R)-4-oxo-4-[3-(trifluoromethyl)-5,6-dihydro[1,2,4]triazolo[4,3-a]pyrazin-7(8H)- yl]-1-(2,4,5-trifluorophenyl)butan-2-amine: a potent, orally active dipeptidyl peptidase IV inhibitor for the treatment of type 2 diabetes. J Med Chem. 2005; 48:141–151. | ||
Xu J, Ok HO, Gonzalez EJ, et al. Discovery of potent and selective beta-homophenylalanine based dipeptidyl peptidase IV inhibitors. Bioorg Med Chem Lett. 2004;14:4759–4762. | ||
Kim HJ, Kwak WY, Min JP, et al. Dipeptidyl peptidase-4 inhibitor with β-amino amide scaffold: synthesis, SAR and biological evaluation. Bioorg Med Chem Lett. 2012;22:5545–5549. | ||
Kim MK, Chae YN, Kim HD, et al. DA-1229, a novel and potent DPP4 inhibitor, improves insulin resistance and delays the onset of diabetes. Life Sci. 2012;90:21–29. | ||
Kim D, Kowalchick JE, Brockunier LL, et al. Discovery of potent and selective dipeptidyl peptidase IV inhibitors derived from beta-aminoamides bearing subsituted triazolopiperazines. J Med Chem. 2008;51:589–602. | ||
DeSimone RW, Currie KS, Mitchell SA, Darrow JW, Pippin DA. Privileged structures: applications in drug discovery. Comb Chem High Throughput Screen. 2004;7:473–494. |
Supplementary materials
 | Figure S1 Cumulative variance from PCA analysis of active and inactive DPP4 inhibitors. |
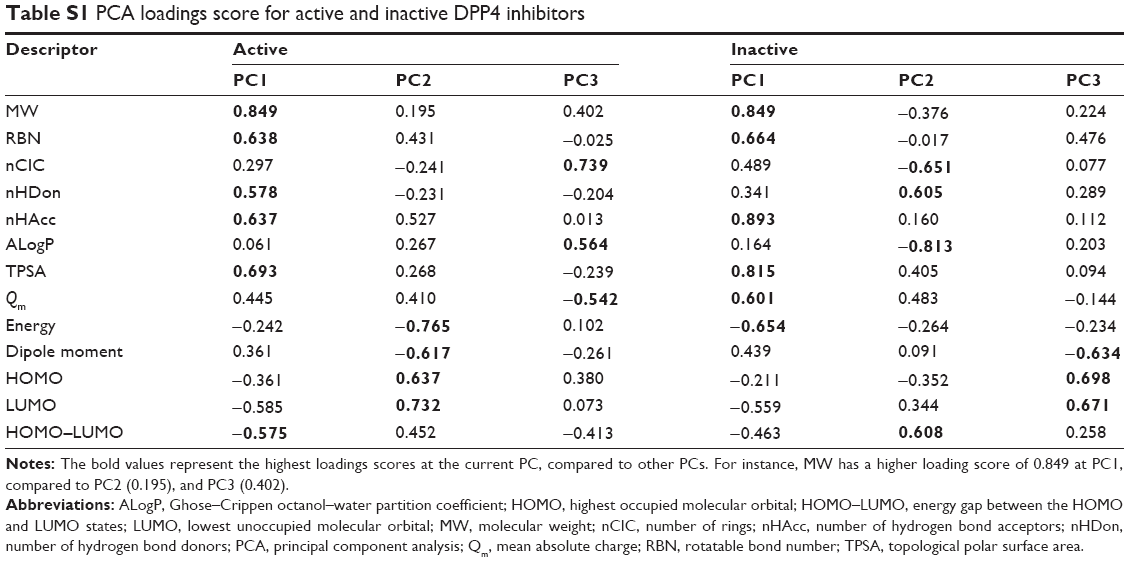 | Table S1 PCA loadings score for active and inactive DPP4 inhibitors |
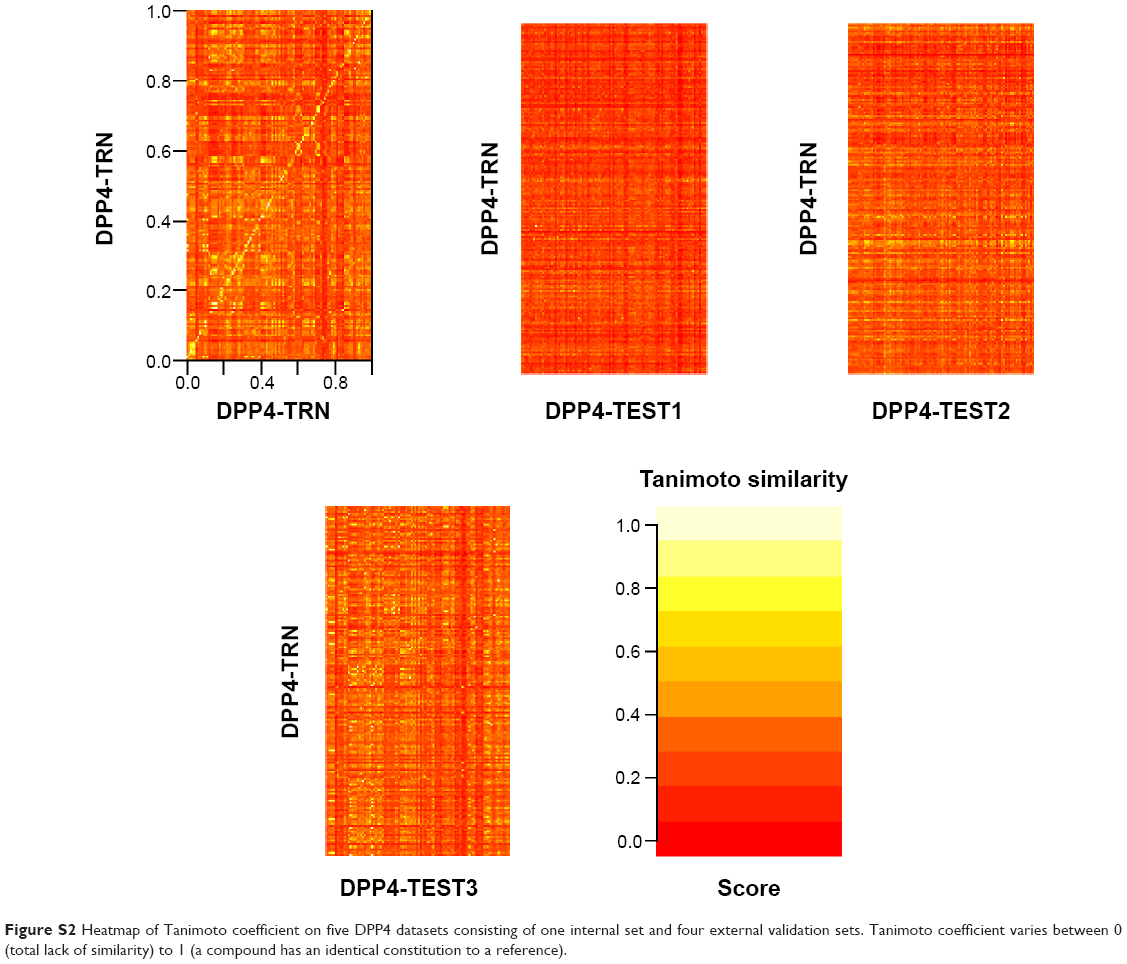 | Figure S2 Heatmap of Tanimoto coefficient on five DPP4 datasets consisting of one internal set and four external validation sets. Tanimoto coefficient varies between 0 (total lack of similarity) to 1 (a compound has an identical constitution to a reference). |
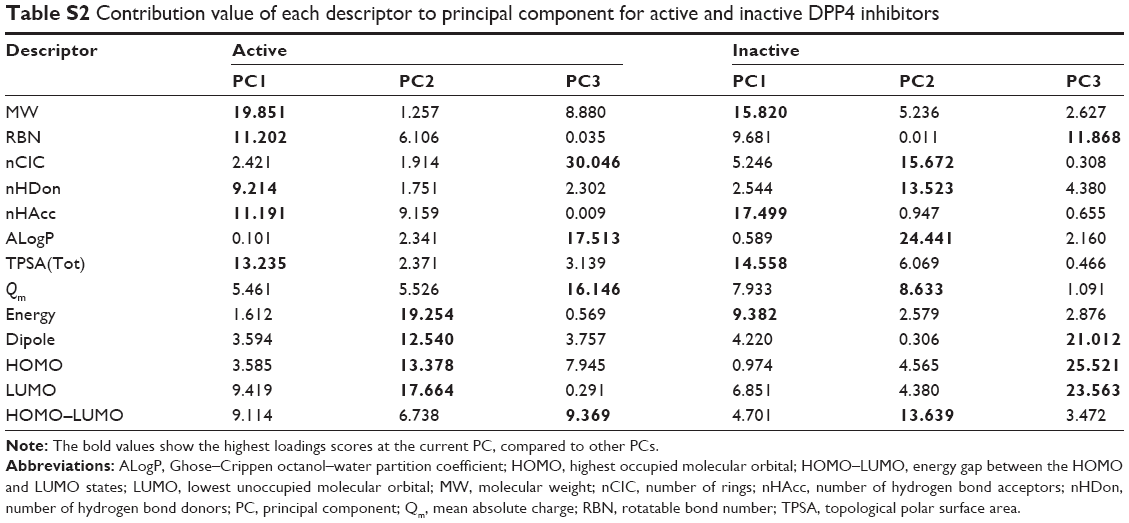 | Table S2 Contribution value of each descriptor to principal component for active and inactive DPP4 inhibitors |
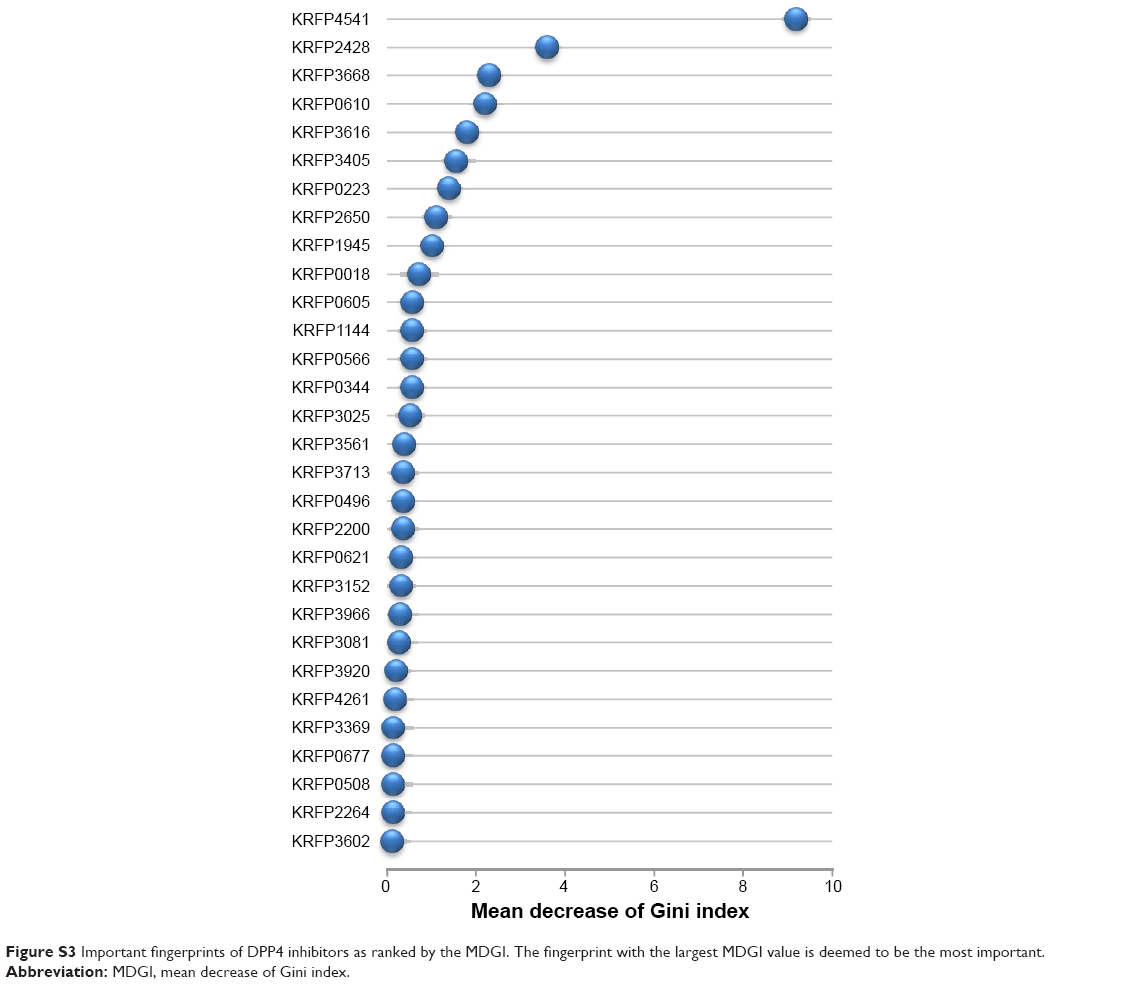 | Figure S3 Important fingerprints of DPP4 inhibitors as ranked by the MDGI. The fingerprint with the largest MDGI value is deemed to be the most important. |
 | Table S3 PCA loadings score for active I and active II DPP4 inhibitors |
 | Table S4 Contribution value of each descriptor to principal components for active I and active II DPP4 inhibitors |
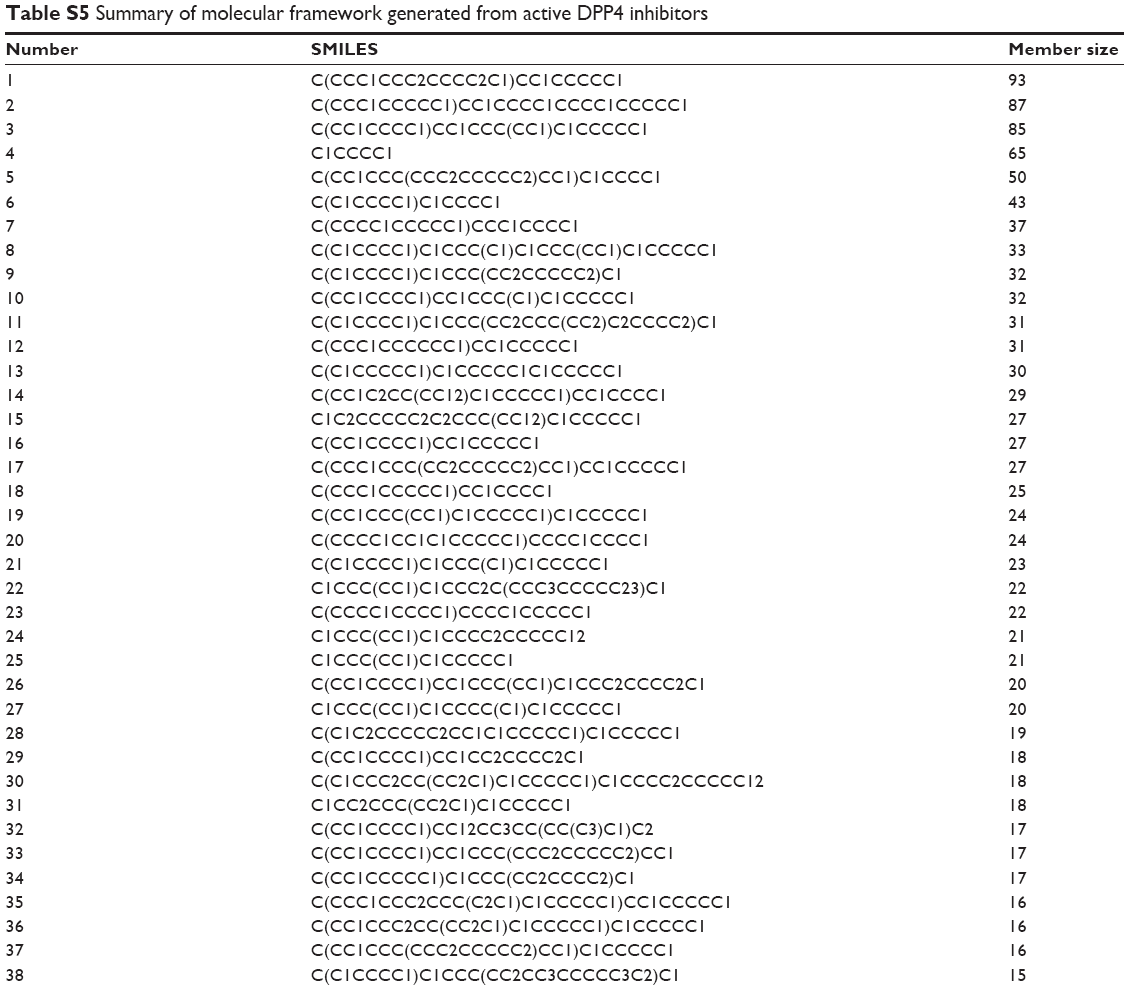 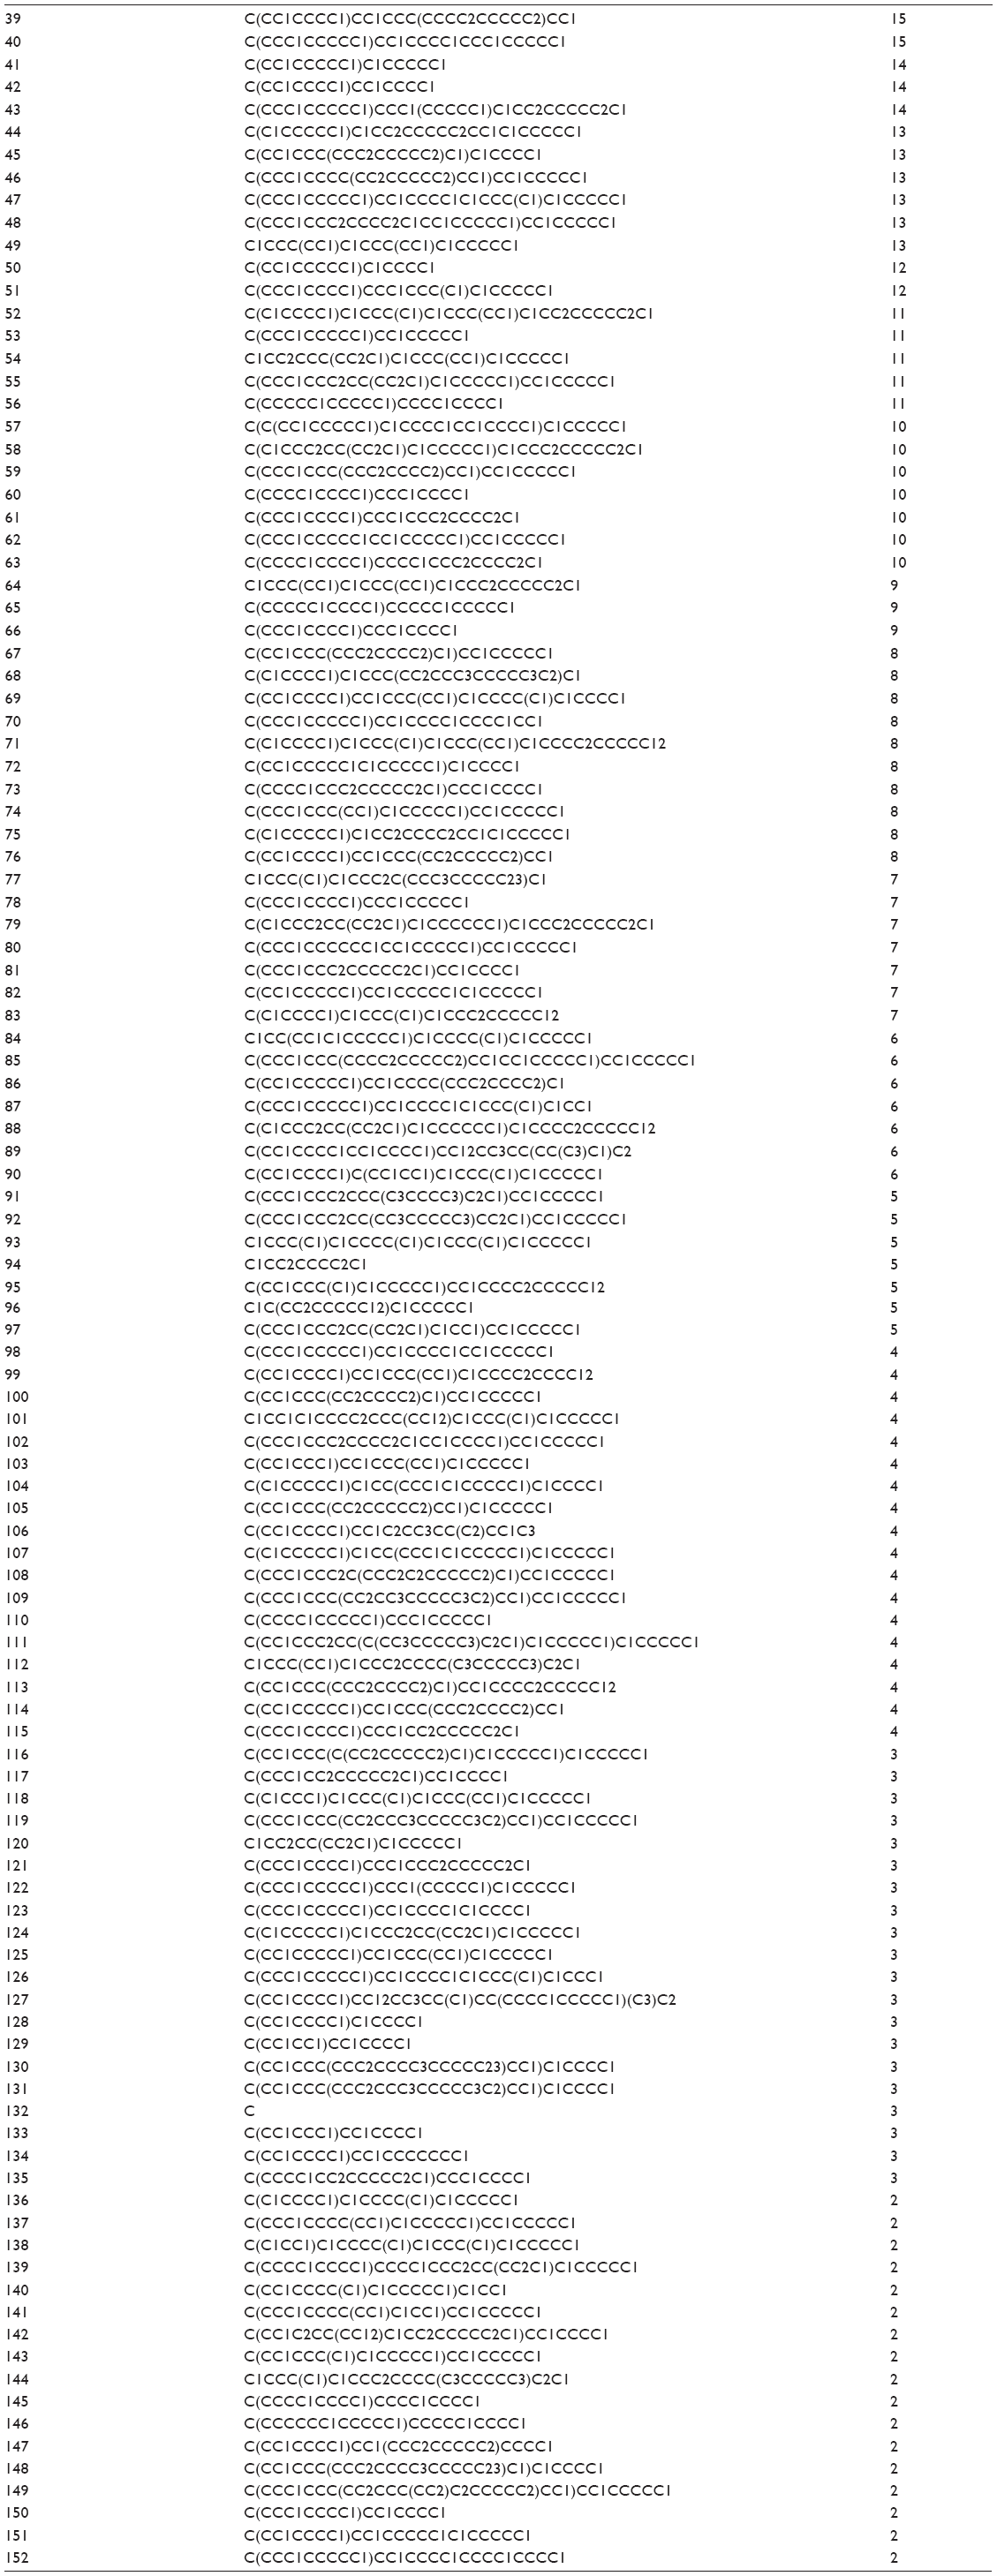   | Table S5 Summary of molecular framework generated from active DPP4 inhibitors |
 | Table S6 Summary of molecular framework generated from inactive DPP4 inhibitors |
 | Table S7 Summary of important structural fingerprints ranked by the MDGI |
 | Table S8 Applying Lipinski’s rule of five on investigated data sets |
 © 2015 The Author(s). This work is published and licensed by Dove Medical Press Limited. The full terms of this license are available at https://www.dovepress.com/terms.php and incorporate the Creative Commons Attribution - Non Commercial (unported, v3.0) License.
By accessing the work you hereby accept the Terms. Non-commercial uses of the work are permitted without any further permission from Dove Medical Press Limited, provided the work is properly attributed. For permission for commercial use of this work, please see paragraphs 4.2 and 5 of our Terms.
© 2015 The Author(s). This work is published and licensed by Dove Medical Press Limited. The full terms of this license are available at https://www.dovepress.com/terms.php and incorporate the Creative Commons Attribution - Non Commercial (unported, v3.0) License.
By accessing the work you hereby accept the Terms. Non-commercial uses of the work are permitted without any further permission from Dove Medical Press Limited, provided the work is properly attributed. For permission for commercial use of this work, please see paragraphs 4.2 and 5 of our Terms.