")
Back to Journals » International Journal of Nanomedicine » Volume 14
Natamycin solid lipid nanoparticles – sustained ocular delivery system of higher corneal penetration against deep fungal keratitis: preparation and optimization
Authors Khames A, Khaleel MA , El-Badawy MF, El-Nezhawy AOH
Received 11 October 2018
Accepted for publication 22 February 2019
Published 8 April 2019 Volume 2019:14 Pages 2515—2531
DOI https://doi.org/10.2147/IJN.S190502
Checked for plagiarism Yes
Review by Single anonymous peer review
Peer reviewer comments 3
Editor who approved publication: Prof. Dr. Anderson Oliveira Lobo
Ahmed Khames,1,2 Mohammad A Khaleel,3 Mohamed F El-Badawy,4,5 Ahmed OH El-Nezhawy6,7
1Department of Pharmaceutics and Industrial pharmacy, College of Pharmacy, Taif University, Taif 21974, Saudi Arabia; 2Department of Pharmaceutics and Industrial Pharmacy, Faculty of Pharmacy, Beni-Suef University, Beni-Suef 62521, Egypt; 3Department of Clinical Pharmacy, School of Pharmaceutical Sciences, Universiti Sains Malaysia, Minden, Penang 11800, Malaysia; 4Department of Microbiology and Immunology, Faculty of Pharmacy, Misr University for Science and Technology, Cairo, Egypt; 5Department of Pharmaceutical Microbiology, College of Pharmacy, Taif University, Taif, Saudi Arabia; 6Department of Pharmaceutical Chemistry, College of Pharmacy, Taif University, Taif, Saudi Arabia; 7Department of Chemistry of Natural and Microbial Products, National Research Center, Dokki, Cairo, Egypt
Background: Fungal keratitis (FK) is a serious pathogenic condition usually associated with significant ocular morbidity. Natamycin (NAT) is the first-line and only medication approved by the Food and Drug Administration for the treatment of FK. However, NAT suffers from poor corneal penetration, which limits its efficacy for treating deep keratitis.
Purpose: The objective of this work was to prepare NAT solid lipid nanoparticles (NAT-SLNs) to achieve sustained drug release and increased corneal penetration.
Methods: NAT-SLNs were prepared using the emulsification-ultrasonication technique. Box–Behnken experimental design was applied to optimize the effects of independent processing variables (lipid concentration [X1], surfactant concentration [X2], and sonication frequency [X3]) on particle size (R1), zeta potential (ZP; R2), and drug entrapment efficiency (EE%) (R3) as responses. Drug release profile, ex vivo corneal permeation, antifungal susceptibility, and cytotoxicity of the optimized formula were evaluated.
Results: The optimized formula had a mean particle size of 42 r.nm (radius in nanometers), ZP of 26 mV, and EE% reached ~85%. NAT-SLNs showed an extended drug release profile of 10 hours, with enhanced corneal permeation in which the apparent permeability coefficient (Papp) and steady-state flux (Jss) reached 11.59×10⁻² cm h-1 and 3.94 mol h-1, respectively, in comparison with 7.28×10⁻² cm h-1 and 2.48 mol h-1 for the unformulated drug, respectively. Antifungal activity was significantly improved, as indicated by increases in the inhibition zone of 8 and 6 mm against Aspergillus fumigatus ATCC 1022 and a Candida albicans clinical isolate, respectively, and minimum inhibitory concentration values that were decreased 2.5-times against both of these pathogenic strains. NAT-SLNs were found to be non-irritating to corneal tissue. NAT-SLNs had a prolonged drug release rate, that improved corneal penetration, and increased antifungal activity without cytotoxic effects on corneal tissues.
Conclusion: Thus, NAT-SLNs represent a promising ocular delivery system for treatment of deep corneal keratitis.
Keywords: Natamycin, solid lipid nanoparticles, fungal keratitis, Box–Behnken design, ocular drug delivery, corneal permeation
Introduction
Keratitis is a serious medical condition in which corneal layers become inflamed and results from bacterial, viral, or fungal invasion of the corneal stoma that results in damage and destruction of the corneal layers.1,2 Yeast (Candida) or filamentous fungi (Fusarium and Aspergillus) are the most common fungi responsible for corneal attack that progresses to fungal keratitis (FK).3
FK is the most elusive type of corneal infection (relative to bacterial and viral keratitis) and is associated worldwide with significant ocular morbidity, including ocular opacity, and may cause blindness.4 Ocular trauma resulting from excessive use of broad spectrum antibiotics and steroids disturbs the surface corneal microorganism balance that facilitates pathogen invasion of ocular tissue. In farm environments, contamination of ocular injuries by soil and plant residuals (usually rich in Fusarium), especially in temperate and tropical climates, is a supportive and predisposing factor for FK.5
Symptoms of FK include sudden eye pain, excessive eye tearing with purulent secretions, increased light sensitivity, and reduced vision. White/gray infiltrate lesions with feathery borders usually develop in infected cornea; satellite lesions with hypopyon may also appear.6
Antifungal drugs, including polyenes, triazoles, and echinocandins, are used to treat FK. However, treatment of FK can be hindered by difficulties with specimen collection that limit microbiological investigation and diagnosis and by poor corneal penetration of antifungal drugs.3,4
Natamycin (NAT) is a broad spectrum and strong tetraene polyene antifungal drug that is safe and effective at low concentrations and is the first-line treatment for FK. The activity of NAT against fungi is predominantly fungicidal and is dose-dependent.7 NAT is the only drug approved by the Food and Drug Administration for the treatment of FK.8 According to American Academy of Ophthalmology guidelines, NAT is the drug of choice against filamentous FK but, due to poor corneal penetration, case management is difficult, and a long course therapy is needed (5% NAT eye drops every 1–2 hours for 4–6 weeks).9
NAT is a high molecular weight structure that contains a macro-cyclic lactone-ring. The water solubility of NAT is low that hinders its penetration into deep corneal layers and the anterior chamber, which limits its use as monotherapy only for superficial keratitis.9,10 NAT is a white to creamy-white crystalline powder that is nearly tasteless and odorless. It has a melting point of 290°C and water solubility of 4,100 mg/L at 21°C in a pH range of 5.5–7.5. It can be sterilized at 116°C for 30 minutes without any significant degradation.11,12
Ocular drug delivery is a significant pharmaceutical challenge due to the complex structure of the eye.13 For conventional delivery systems, different barriers usually decrease pre-corneal drug absorption. These barriers include drainage and washout of the applied formula (especially from eye solution), drug metabolism that reduces the corneal residence time of susceptible drugs, and naso-lachrymal drainage. These factors reduce the pre-corneal drug half-life to ~1–3 minutes, which significantly decreases therapeutic efficiency.14,15 The epithelial barrier represents the main obstacle for ocular absorption of applied drugs since it is the main route through which drugs pass into the aqueous humor. The epithelial barrier has a lipophilic layer consisting of tight junctions that resist passage of hydrophilic drugs and macromolecules into the cornea. Hence, the epithelium represents the main barrier for ocular absorption of hydrophilic drugs.16,17
Development and production of modified, therapeutically efficient, ocular delivery systems with better corneal penetration, prolonged ocular residence time, and better mucoadhesive properties, combined with high patient compliance and a low-cost benefit is a significant and attractive scientific area.18,19 Nanotechnology represents a novel trend for developing new therapies and optimizing available conventional ways through the production of colloidal drug delivery system with particle sizes in the range of 1–1,000 nm.19–21
Solid lipid nanoparticles (SLNs), composed of physiologically tolerated solid lipids dispersed in an aqueous surfactant solution in the range of 100–150 nm, are an alternative to classical colloidal carrier systems.22,23 They have many advantages including high drug loading ability, high stability with minimum drug leakage, minimum physiological toxicity, controlled and/or sustained drug release, drug targeting, and large-scale production suitability. Due to their lipophilic nature and small particle size, they are efficient in penetrating physiological barriers. In addition to their mucoadhesive properties24 and sterilization tolerance,25 SLNs represent an efficient ocular drug delivery system with enhanced corneal absorption, increased ocular bioavailability, extended ocular retention time, and a sustained drug release profile without impairing vision.26
In a recent report,27 NAT-loaded PEGylated nano-lipid carriers with hydrophilic surface characteristics were prepared for ocular delivery using a hot homogenization technique. Formulation was optimized using a Box–Behnken design that modified the lipid layer composition and homogenization time. In vitro and in vivo corneal permeation of the prepared formula was studied. In our study, the SLN technique was used as an alternative nano-lipid ocular delivery system for NAT without application of a hydrophilic PEG coat to affect sustained drug release properties, increased antifungal activity, and corneal penetration for treatment of deep corneal keratitis. To obtain the smallest particle size that significantly affects penetration, the high-pressure homogenization method – used in a recently published study – was replaced by ultrasonication at high frequency during SLN preparation. Also, stearyl amine was added as a surface charge modifier to impart positive zeta potential (ZP) to ensure extended conjunctival residence time and higher corneal penetration.27 In addition, the lipid and aqueous phase composition and sonication frequency in the production of SLN formulations were optimized using a Box–Behnken statistical design. In this work, solid state characterization and compatibility, drug release rate and pattern, antifungal activity, ex vivo corneal permeation, and safety of the optimized NAT-SLN formula were studied.
Materials and methods
Materials
NAT was purchased from Sigma-Aldrich Co. (St Louis, MO, USA). Precirol ATO 5®, Gelucire 50/13, Transcutol P, and Compritol 888 were gifts from Gattefosse SAS (Saint-Priest Cedex, France). Kolliphor EL, Solutol HS 15, Pluronic f68, glyceryl monostearate, stearic acid, palmitic acid, cetostearyl alcohol, stearylamine, and Tween 80 were purchased from EMD Millipore (Billerica, MA, USA). All HPLC grade solvents were purchased from Sigma-Aldrich Co. and were used without further purification.
Methodology
Screening of solid lipid materials
Compritol 888, Precirol ATO 5®, palmitic acid, stearic acid, cetostearyl alcohol, and glyceryl monostearate were tested as lipid cores of NAT-SLNs, in terms of their drug solubilizing ability.
Determination of NAT lipid solubility
The solubility of NAT in different solid lipids was determined by measuring the drug partitioning behavior between an aqueous solution and the tested lipid according to the modified method used by Joshi and Patravale.28 For this, NAT (5 mg) was added to 10 mL (1:1 w/w) of a water/lipid mixture that was then shaken in a 70°C water bath for 1 hour. The aqueous layer was separated by allowing the mixture to cool to room temperature followed by centrifugation at 15,000 rpm for 15 minutes. The aqueous layer was collected with a syringe, and NAT content was determined using an HPLC method.29 The lipid solubility of NAT was calculated by subtraction of the aqueous layer concentration from the total amount of added drug and was expressed as a percentage.
Selection of surfactant (surface active agent [SAA])
For the selection of the most appropriate SAA (surfactant) to be used in the preparation of NAT-SLNs, a fixed amount of the selected molten solid lipid (4%) was mixed with aqueous SAA (3%) solution at 70°C in a 10 mL volume. The mixture was vortexed for 5 minutes followed by sonication for 2 minutes. Finally, the mixture was rapidly cooled in an ice bath and the resultant dispersion was evaluated by measuring particle size (radius in nanometers [r.nm]), ZP (mV), and polydispersity index (PDI). Following the preparation of the material and overnight storage at room temperature, precipitation was visually examined under adequate illuminated conditions. Results were recorded and compared.
Experimental design
A three-level, three-factor Box–Behnken statistical design (Design Expert, Version 8.0.3; Stat-Ease Inc., Minneapolis, MN, USA) was used to optimize the preparation of NAT-SLNs. Based on initial trials, three levels of solid lipid concentration (X1), surfactant concentration (X2), and sonication frequency (X3) were selected as independent variables. The three levels of the independent variables and the response constraints are summarized in Table 1. Based on the proposed experimental design, which describes the main, interaction, and quadratic effects of selected independent variables on the characteristics of the prepared NAT-SLN formulae including particle size (R1), ZP (R2), and drug content (R3) as dependent variables (responses), a matrix of 17 runs (representing NAT-SLN formulae), including five center points, was prepared and evaluated for the observed response values (Table 2). For optimization, the collected response values were fitted to linear, linear two-factor interaction (2FI), quadratic, and cubic models and different polynomial equations were generated. The model with higher determination coefficients and significance value at the determined probability level was suggested by the software. Statistical validation of the derived mathematical polynomial equations was performed using the ANOVA provision available in the software. Three dimensional (3D) surface and perturbation plots were also generated to further investigate the results.
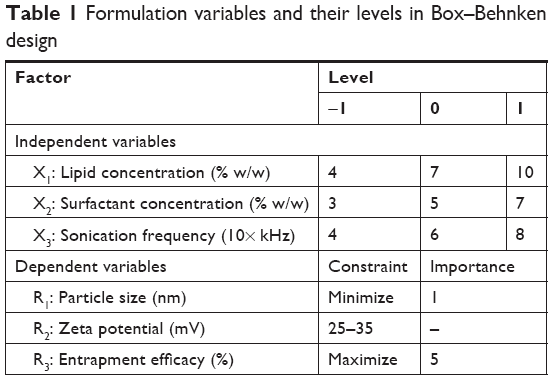 | Table 1 Formulation variables and their levels in Box–Behnken design |
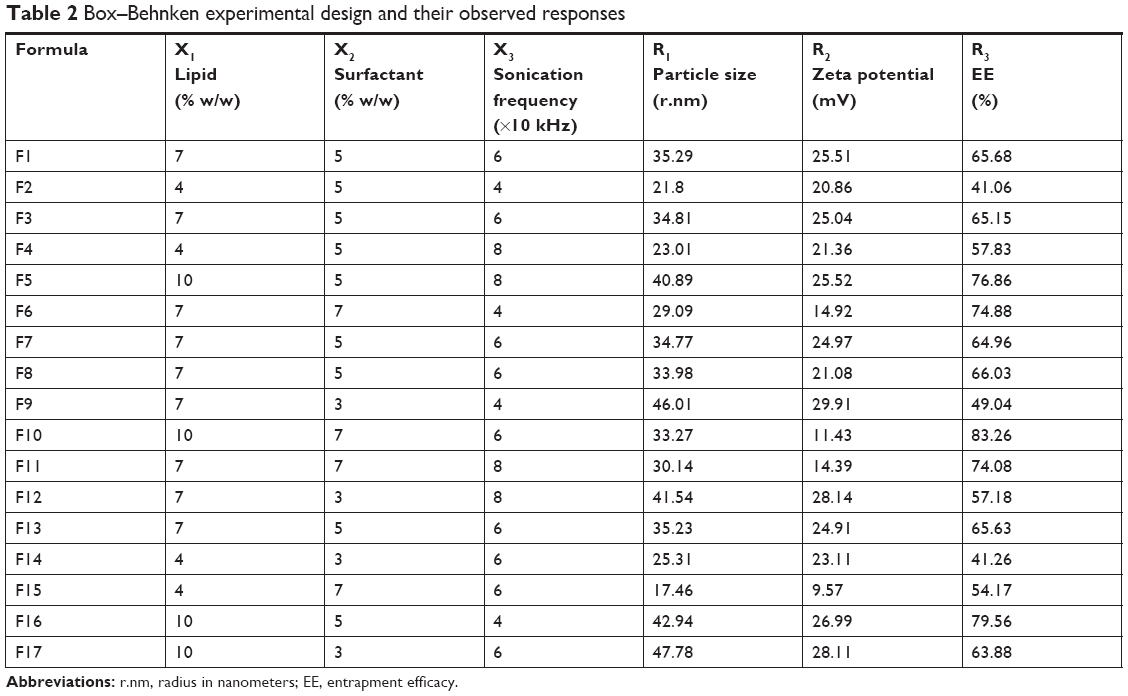 | Table 2 Box–Behnken experimental design and their observed responses |
Validation of the experimental method
Based on the proposed constraints of the three responses, the numerical prediction optimization function of Design Expert Software was used to validate the optimization procedure. Two NAT-SLN formulae were optimized based on the calculated desirability as checkpoints. Formulations were prepared according to the proposed optimal composition and were tested for different responses. The observed values were compared to the predicted values and then prediction errors (%) were calculated.
Preparation of SLNs
According to the proposed experimental design matrix shown in Table 2, NAT-SLN formulations were prepared based on the hot emulsification-ultrasonication technique30 using Precirol ATO 5® as solid lipid (4%–10% w/w), Pluronic f68 as SAA (3%–7% w/w), and a sonication frequency (40 to 80 kHz). NAT (0.5%), Precirol ATO 5®, and 0.5% stearyl amine (as a surface charge modifier) were dissolved in a suitable volume of methanol with the aid of a vortex mixer. Methanol was completely evaporated in a rotary evaporator and the drug-loaded lipid layer was then melted by heating at 60°C–70°C. An aqueous surfactant solution was prepared in double-distilled water and heated to the same temperature. The melted drug-loaded lipid formulation was dispersed in surfactant solution in a water bath and then the obtained pre-emulsion was homogenized (10,000 rpm at 70°C) for 10 minutes. The resultant hot O/W emulsion was then sonicated using a probe sonicator (Rivotek, Mumbai, India) at the specified sonication frequency for 5 minutes. For lipid crystallization and the formation of SLNs, the mixture was cooled in an ice water bath for a sufficient amount of time (~15 minutes).
Particle size (PS) measurement and size distribution
The average r.nm and PDI of the prepared NAT-SLN formulations were determined by photon correlation spectroscopy using a Malvern Zetasizer 4 (Nano ZS, Zen 3600; Malvern Instruments, Malvern, UK) equipped with a 5-mV He–Ne laser (633 nm) at 25°C (Malvern Instruments) with a fixed angle of 90° and at 25°C after suitable dilution. Each value is the average of three measurements.
ZP measurement
The particle surface charge, expressed as ZP, was determined by zeta-nanoparticle electrophoresis analysis using a Malvern Zetasizer 4 (Nano ZS, Zen 3600) at 25°C after suitable dilution with double distilled water to an adequate intensity. Each measurement was performed at least in triplicate. The pH values of the samples were always maintained in the range of 7±0.5.
Entrapment efficiency (EE)
The aqueous phase concentration of NAT (free drug) was measured as a criterion for the EE of the prepared SLNs. A Centrisart apparatus was used to separate the two phases as follows: 2.5 mL of undiluted NAT-SLNs was packed into the outer tube and the tube content was then centrifuged at 10,000 rpm for 1 hour. The aqueous phase in the recovery chamber was separated and analyzed using an HPLC assay method29 to determine the NAT concentration. EE was calculated as:
|
|
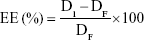
where DI is the initial drug amount used in the preparation and DF is the amount of free drug in the aqueous phase.
Determination of drug release rate from the prepared SLN formulations
The release rate of NAT from the optimized SLN formulae was studied in simulated ophthalmic conditions using a modified rotating paddle dialysis bag diffusion technique31,32 in 150 mL artificial tear fluid (containing sodium chloride: 0.670 g, sodium bicarbonate: 0.200 g, calcium chloride dehydrate: 0.008 g, and purified water: 100 mL, pH 7.4)33 as a dissolution medium maintained at 37°C±0.5°C and 50 rpm. Formula samples (3 mL) were packed into dialysis bags with a 12 kDa MWCO that were immersed in the dissolution medium. Sample aliquots (5 mL) were withdrawn with replacement at predetermined time intervals for 10 hours and were then filtered (0.45 μm). The drug concentration and cumulative percentage of drug release were determined using an HPLC assay method.29 For comparison, the dissolution rate of plain drug was also determined. The mean of six determinations was calculated.
Mathematical kinetic modeling of drug release data
The kinetics of NAT release from optimized SLN formulae were analyzed using KinetDS 3.0 software (Aleksander Mendyk, GNU GPLv3 license, 2007). Data were analyzed to quantitatively determine the mechanism of drug release according to different mathematical models, including zero-order, first-order, Higuchi, Korsmeyer-Peppas, and Weibull diffusion models.
Solid state characterization and compatibility studies
NAT-SLN formula, plain drug, and formula components were subjected to the following studies.
Differential scanning calorimetry (DSC)
Samples (10 mg) were weighed separately into an aluminum pan of a differential scanning calorimeter (Perkin-Elmer DSC4; PerkinElmer Inc., Waltham, MA, USA) and continuously purged together with a blank with nitrogen gas over a temperature range of 25°C–350°C with a heating rate of 10°C/min. Enthalpies were calculated and DSC thermograms were recorded and analyzed.
Infrared (IR) spectroscopy
Samples were mixed separately with dry KBr powder (400 mg) and compressed into a transparent disc under 10.000–15.000 pounds/inch2 of pressure and scanned in the range of 4,000–500 cm−1 with an IR spectrophotometer (Shimadzu IR-435; Shimadzu, Kyoto, Japan) at ambient temperature. The IR spectra of the samples were recorded and analyzed.
Antifungal susceptibility testing
The antifungal activity of optimized NAT-SLN formulae and plain NAT against Aspergillus fumigatus ATCC-1022 and a Candida albicans clinical isolate was tested using the modified Kirby–Bauer method and the broth micro-dilution method.34 Inhibition zone diameters and minimum inhibitory concentrations (MICs) were measured and compared.
Ex vivo corneal permeation studies
To investigate the corneal permeation efficacy of the prepared NAT-SLN formula, freshly excised goat corneas were used35 as follows: whole goat eyeballs were obtained from an abattoir and were transported to the laboratory in cold artificial tear saline (4°C). The cornea and a small layer (5–6 mm) of abutting scleral tissue were carefully removed, washed several times with cold saline, and stored in cold artificial tear buffer saline (pH 7.4) until use. Drug permeation was studied in a modified Franz diffusion cell in which suitable volumes of the optimized NAT-SLN formula and a drug saline suspension of the same concentration (3% w/v) were separately packed into the donor compartment in close contact with the epithelial side and then the cell top was completely sealed. The drug was allowed to freely permeate for 5 hours into the artificial tear fluid in the acceptor compartment with continuous stirring at 37°C±0.5°C. At pre-specified time intervals, sample aliquots were collected from the acceptor compartment (with replacement to maintain sink conditions) that were then analyzed by HPLC to measure drug content. Apparent permeability coefficient (Papp) and steady-state flux (Jss) of the drug were calculated using the following equation and were compared.
|
|
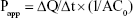
where ΔQ/Δt is the steady-state flux (μmol/h), C0 is the initial concentration in the donor chamber (μmol/mL), and A is the surface area of the corneal layer (cm2).36 The data were recorded as the mean ± SD of six determinations.
Histopathological studies
Potential corneal irritation caused by NAT-SLN was examined.37 Briefly, fresh goat corneas were separately incubated with NAT-SLN (5% w/v), normal saline as a positive control, and 0.1% SDS as a negative control in sterile 50 mL tubes for 10 days. After incubation, the corneas were aseptically removed and washed with sterile PBS then immediately fixed with an 8% (w/w) formalin solution. The fixed corneal tissue was further dehydrated using ascending concentrations of ethyl alcohol followed by tissue clearing using xylene. Paraffin embedding was performed and paraffin blocks were prepared followed by cross-sectioning with a microtome. Thin paraffin films were transferred onto glass slides, stained with H&E, and examined under a light microscope using the 10× objective lens. Images were recorded and compared.
Results and discussion
Selection of solid lipid and SAA
The ability of SLN formulations to tolerate a specific drug is mainly affected by the drug solubility within the solid lipid core.38 To maximize the drug loading and EE of the prepared SLN formulation, the solubility of NAT in different solid lipids was evaluated, which allowed for the selection of a solid lipid that was suitable for preparing the SLN formulation.
NAT lipid solubility was calculated as the percentage of drug that partitioned to the melted fatty layer after shaking with water as described in the “Materials and methods” section. Precirol ATO 5® and Compritol 888 showed higher NAT solubilizing ability, with percent drug partitioned values of 69.61% and 64.49%, respectively (Figure 1A). These results correlated with the imperfect matrix structure of Precirol ATO 5® and Compritol 888 molecules, which are formed due to the mono-, di-, and triglyceride contents that impart loose, highly porous structural characteristics, which allows easier accommodation and higher solubility of the drug.39 Precirol ATO 5® is palmitostearate glyceride mixture while Compritol 888 is behenate glyceride mixture;40 the diversity of Precirol ATO 5® fatty acid content with subsequent looser structure explain its higher drug entrapment ability than Compritol 888, so it was selected to be used as lipid core for the preparation of NAT-SLNs in this study.38
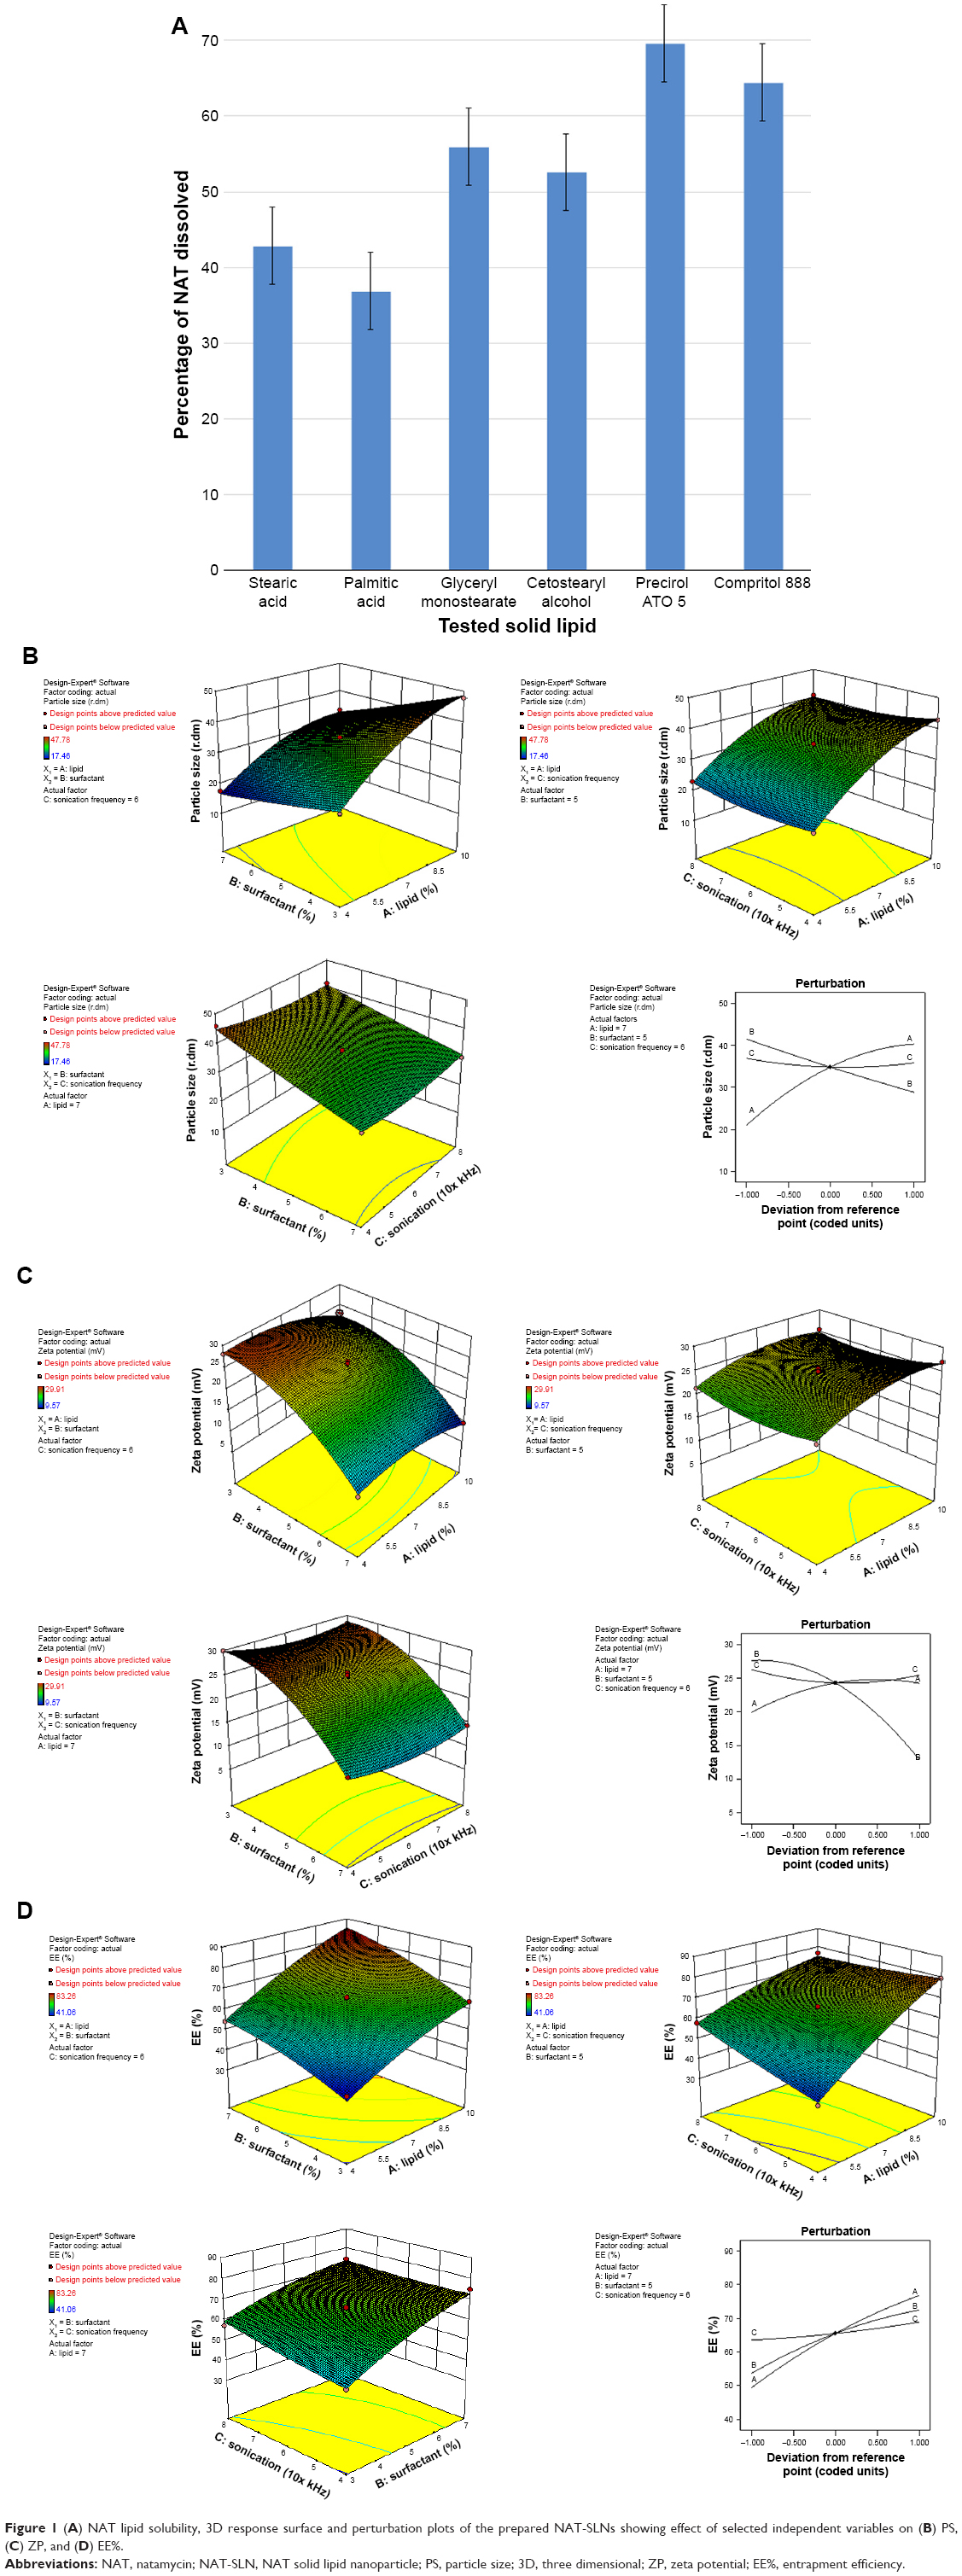 | Figure 1 (A) NAT lipid solubility, 3D response surface and perturbation plots of the prepared NAT-SLNs showing effect of selected independent variables on (B) PS, (C) ZP, and (D) EE%. |
For SAA selection, SLN formulations alone were prepared using different SAAs and evaluated for PS, ZP, PDI, and precipitation. As shown in Table 3, the Pluronic f68-based SLN formula had the smallest PS (42 r.nm), an acceptable ZP (26.7 mV),41 and an acceptable PDI (0.224); in addition, the formula did not show any signs of precipitation. Thus, Pluronic f68 was selected as the optimal SAA for preparing NAT-SLN formulations. The PS of SLN formulations is largely dependent on the hydrophilic/lipophilic balance (HLB) value of the applied surfactant, in which higher HLB values correlate with smaller-sized particles.42 The high HLB value of Pluronic f68 (HLB =29), in comparison with other tested SAA,43 could explain the collected results.
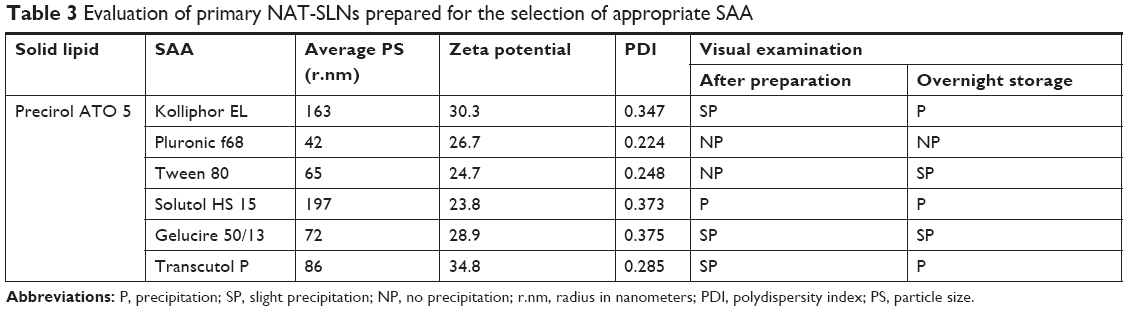 | Table 3 Evaluation of primary NAT-SLNs prepared for the selection of appropriate SAA |
Statistical analysis of experimental data
Statistical experimental designs allow multifactorial statistical analysis to be used in the selection of control variables that significantly affect a specified response with minimal process variation, which strengthens the collected results and obviates the need to perform further inspection.44 The Box–Behnken design is a simple statistical experimental tool for studying interactive factorial effects and deriving polynomial equations based on few experiments relative to other similar designs.44 Thus, Box–Behnken design was used to study the effect of three different levels of solid lipid concentration (X1), surfactant concentration (X2), and sonication frequency (X3) on the characteristics of NAT-SLN formulae, including PS (R1), ZP (R2), and EE% (R3). According to the proposed matrix design, the selected independent variables had a significant effect on the observed responses, as shown in Table 2.
Fitting the collected results to different polynomial model equations showed that all three independent variables had quadratic interactive effects on the observed responses, with a maximized multiple correlations and adjusted coefficients as well as the predicted sum of squares and significant statistical terms at the selected probability level. The high agreement between the predicted and adjusted R2 (difference <0.2) and the low SD suggests a nonlinear correlation between the tested factors and the observed responses, as shown in Table 4. Adequate precision values >4 that reflect an insignificant effect for uncontrollable experimental factors may be a major source of variability and are usually described as a noise signal.
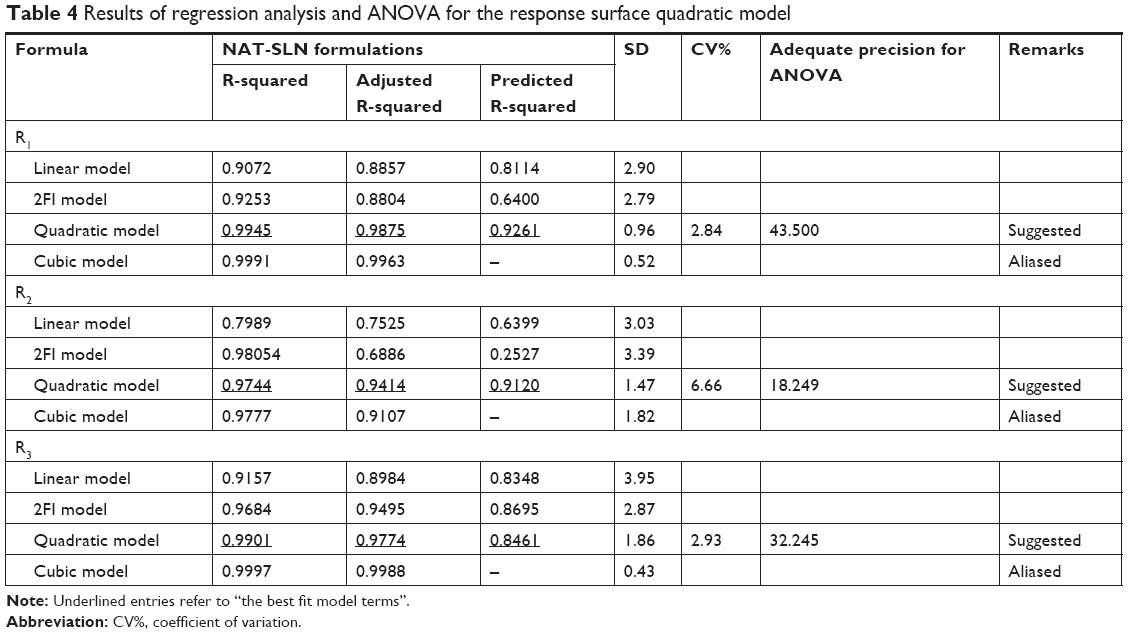 | Table 4 Results of regression analysis and ANOVA for the response surface quadratic model |
ANOVA was applied to validate the derived polynomial quadratic equations. As shown in Table 5, ANOVA results revealed significant model F-values with a probability <0.0001 for the three responses, indicating an adequate signal with a minimal noise effect (there is only a 0.01% chance of noise). These results are in accordance with the calculated adequate precision values that confirm the suitability of the suggested model equations for navigating the design space.
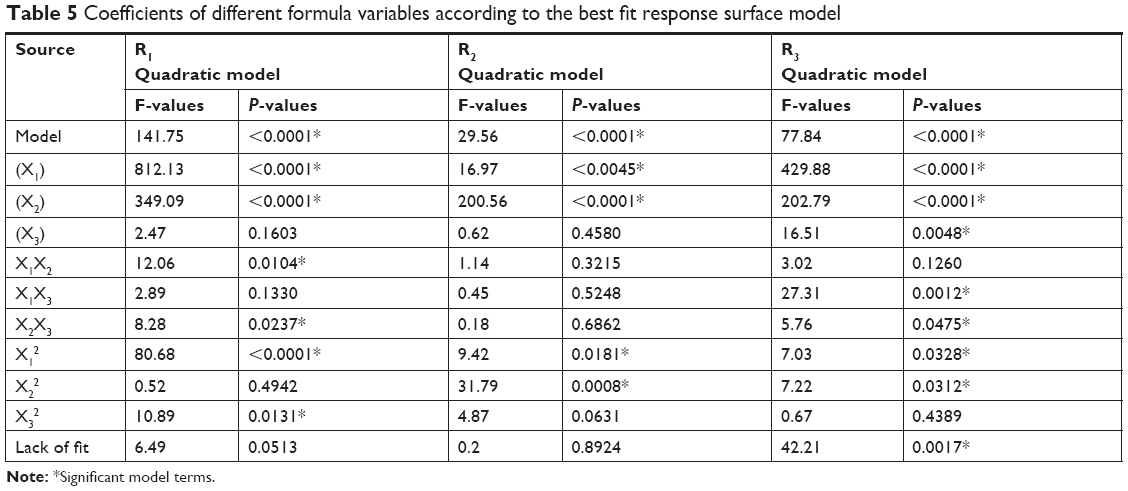 | Table 5 Coefficients of different formula variables according to the best fit response surface model |
To further elucidate the main and interactive effects of the independent factors on PS (R1), ZP (R2), and EE% (R3), results of the response surface analysis were plotted in 3D model graphs, as shown in Figure 1B–D. These plots allow for the effect of a binary interaction of every two independent factors on each response to be studied, while keeping the third factor at a constant level. To compare and quantify the effect of an individual variable on each response, perturbation plots were constructed so that the behavior of each response could be followed when one factor changes within the specified constraint range while keeping the other two factors constant. Perturbation plot is also considered to be an efficient tool for comparing the effects of all three factors at any particular point in the design space.
Effect on particle size
The PS of SLNs is determined by several factors, including the type and concentration of lipid/SAA, the preparation conditions of homogenization, and sonication time and speed.38
As shown in Table 2 and Figure 1B, the PS range of the prepared NAT-SLNs was 17.46 r.nm (F15) to 47.78 r.nm (F17); the quantitative interaction effects of X1, X2, and X3 on PS are expressed by the following quadratic regression equation:
|
|
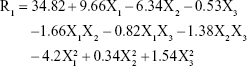
Values of P>F<0.05 indicates significant model terms, where the positive value of the coefficient indicates a synergistic effect on response and a negative value indicates an antagonistic effect. ANOVA results indicated that only the model terms X1, X2, X1X2, X2X3, X12, and X32 had a significant effect on PS. X1 and X2 represent the main effects due to changing one variable at a time within its specified constraint range, while X1X2, X2X3, X12, and X32 represent the interaction effect on PS when two variables are simultaneously changed.
According to the results presented in Table 5, solid lipid concentration (X1) had a synergistic effect on PS, where F5, F10, F16, and F17 (X1=10%) had a significantly larger PS than F4, F15, F2, and F14 (X1=4%), respectively, at constant X2 and X3. This could be explained by the increased consistency and surface tension of the formula, as solid lipid content increases with subsequent PS enlargement.45 The SAA concentration had an antagonistic effect on PS, where F6, F10, F11, and F15 (X2=7%) had a significantly smaller PS than F9, F17, F12, and F14 (X2=3%), respectively, when X2 and X3 were kept constant. The interaction effects of X1X2 and X2X3 resulted in a significant nonlinear decrease in PS, from 25.31 to 17.46 r.nm and from 47.78 to 33.27 r.nm when X2 increased from 3% to 7% at 4% and 10% X1 levels, respectively. The effect of SAA on the PS of SLN formulations may be attributed to the significant lowering of surface tension and surface free energy (SFE) of the formulations that were generated due to high shearing conditions during preparation, which decreased PS. PS also decreased from 46.01 to 29.09 r.nm and from 41.54 to 30.14 r.nm when X2 increased from 3% to 7% at 4% and 8% X3 levels, respectively. It was noted that the effect of SAA on increased PS was less prominent at a higher sonication frequency, which causes larger increases in SFE and minimizes the effect of SAA on surface tension and hence on PS. The synergistic quadratic effect of sonication frequency (X32) on PS with significant model term confirms the effect of an increased sonication frequency on SFE of the formula mixture, with a subsequent significant decrease in physical stability as the internal phase tends to spontaneously re-aggregate, which increases the PS.46 Simultaneous changes of X3 and X1 had a negligible effect on PS, as indicated by their insignificant coefficient terms. Comparison of the coefficient values of significant model terms in the equation showed that lipid concentration (X1) had a greater influence on PS with higher exponent (9.66) while X2X3 had the least significant impact on PS. A perturbation plot was constructed to further evaluate the effect of X1, X2, and X3 on PS at any specified point, which confirmed that lipid concentration (X1) had a major effect on PS.
Effect on ZP
ZP is the electro-kinetic potential that determines the stability of colloidal dispersions, including SLN formulations. ZP is a measure of inter-particulate repulsion within the colloidal system that hinders internal phase agglomeration and re-aggregation. ZP is usually determined by the chemical composition and HLB of the applied surfactant. SLNs with a low ZP are unstable and are highly likely to coalescence during storage. A ZP of 30 mV indicates physical stability of a formula.47
In ocular drug delivery, surface charges play a critical role in corneal drug absorption, since corneal epithelial cells are negatively charged. Therefore, cationic SLNs usually have extended conjunctival residence times and higher levels of corneal penetration due to modification of corneal morphology through ionic interactions.47,48 The charge-inducing agent stearyl amine was added to the SLNs during preparation to optimize ZP (based on the results of preliminary experiments). Due to stearyl amine lipophilic nature, it is entrapped within the lipid core while the substituted charged amine groups that project outward serve as a positively charged repulsive layer on the particle surface.26
ZP (R2) values for the prepared NAT-SLNs ranged from 9.57 mV (F15) to 29.91 mV (F9). The effects of the interaction of independent factors on ZP are illustrated in Figure 1C. The quadratic equation that describes these effects is shown below.
|
|
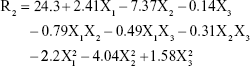
According to the ANOVA results, only model terms X1, X2, X12, and X22 were significant, with P-values <5%, as shown in Table 5. The SAA concentration had a main (X2) and quadratic (X22) antagonistic effect on ZP, with a prominent impact on the main effect, as indicated by its higher coefficient value (7.37) relative to other significant factor coefficients in the polynomial equation. The ZP-values of F6, F10, F11, and F15 (X2=7%) showed a significant decrease in comparison with F9, F17, F12, and F14 (X2=3%), respectively, when X1 and X3 were kept constant. The results also showed that the lipid concentration had a main and quadratic synergistic effect on ZP but with less impact, as indicated by their coefficient values in the regression equation (2.14 and 2.2, respectively). This can be explained by the positive effect of lipid concentration on PS, with a subsequent increase in particle surface area in order to accommodate a larger charge density and hence higher ZP. Generally, the proximity of ZP-values within the experimental design matrix reflects the role of stearyl amine in controlling the surface charge of the prepared SLNs. A perturbation plot confirmed the major effect of SAA concentration (X2) on ZP relative to other variables.
Effects on EE
According to the results shown in Table 2, the EE% ranged from 41.06% (F2) to 83.26% (F10), depending on different factor levels. The derived polynomial quadratic equation for the EE is given as:
|
|
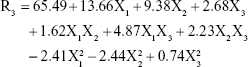
Results shown in Table 5 indicate that X1, X2, X3, X1X3, X2X3, X12, and X22 are significant model terms with P>F<0.05. The three independent variables (X1, X2, X3) had positive synergistic main effects on EE%, where independently increasing each variable while keeping other variables constant caused a significant increase in entrapped drug percentage. The higher value of the X1 coefficient (13.66) indicates that the lipid concentration is the major factor that affects EE. Comparison of NAT EE% in SLN formulae F2, F4, F14, and F15 with that in F16, F5, F17, and F10, respectively, demonstrates that increasing the lipid concentration from 4% to 10% resulted in a significant increase when other factors were kept constant. Increasing the SAA concentration (X2) also led to a significant increase in drug EE%, as indicated by its high positive coefficient (9.38). The significant increase in NAT EE% in SLN formulae F9, F14, F17, and F12 (1% SAA) in comparison with that in F7, F15, F10, and F11 (3% SAA), respectively, confirms the synergistic effect of SAA concentration on drug EE%. The response surface plots (Figure 1D) summarizes the interactive effects of all three factors on NAT EE%. At low lipid concentration, increasing X3 from a low to high level caused an increase in EE% from 41.06% to 57.83%; however, this effect is inhibited at high lipid concentration, where EE% changed slightly from 79.56% to 76.86%. This could be attributed to the increased viscosity of the formula mixture with lipid concentrations that interfere with drug solubility within the lipid core. The significant increase in drug EE% when both the variables were simultaneously increased (from 41.06% to 76.86%) confirms the proposed explanation in which a higher sonication frequency overcame the significant increase in mixture viscosity due to an increased lipid concentration with a positive effect on drug solubility within the lipid core and EE%. Increasing the SSA concentration and sonication frequency also demonstrated minor positive interaction effect on EE%, as indicated by the small coefficient (2.23) in which the % NAT entrapped increased from 49.04% to 74.08% when both the variables were simultaneously increased to a higher level. It was also noted that at a higher SSA concentration, an increase in sonication frequency had no effect on EE%, which may be correlated to saturation of the lipid core due to the solubilizing effect of SAA on NAT.
In summary, application of ultrasonication at high frequency during SLN preparation resulted in a smaller PS (<90 nm) as compared to 225 nm in a previous report,27 with a narrow PDI. Also, addition of stearyl amine as a charge modifier not only imparted a positive charge onto the prepared particles but also allowed more control over the ZP-value with insignificant variation. It was also noted that the quadratic interactive model best fit the data with significant terms for the selected variables as compared to the 2FI model for the previously selected optimization parameters depending on lipid phase composition only for the prepared surface-modified NLCs.27
Optimization and validation of the collected data
According to the results presented in Table 6, for the optimized NAT-SLN formulae selected based on higher desirability (Figure 2), the observed values for R1, R2, and R3 are in high agreement with the numerically predicted values that were generated based on the proposed constraints of minimum PS, ZP in the range of 25–35 mV, maximum EE%, with a low prediction error percentage. These results validate the optimization procedure and support the derived regression model equations for the prediction of responses at the selected variable levels.
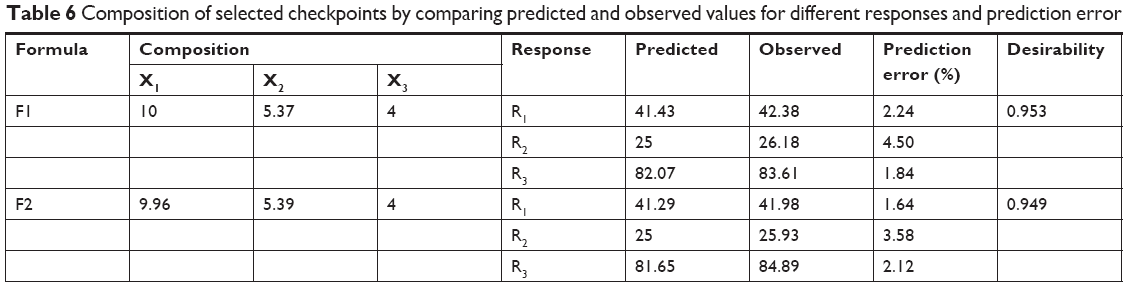 | Table 6 Composition of selected checkpoints by comparing predicted and observed values for different responses and prediction error |
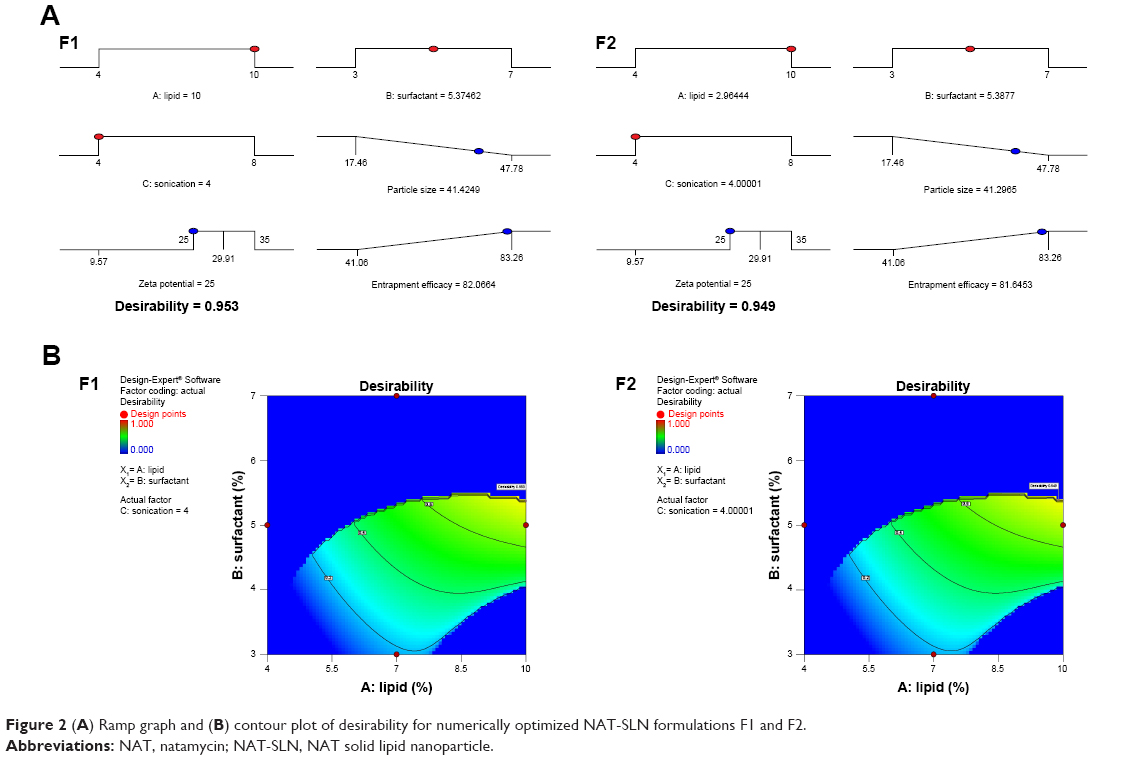 | Figure 2 (A) Ramp graph and (B) contour plot of desirability for numerically optimized NAT-SLN formulations F1 and F2. |
Release studies
The in vitro drug release rate of optimized NAT-SLNs in simulated artificial tear fluid was studied using the dialysis bag diffusion technique at 37°C±0.5°C; release profiles are illustrated in Figure 3A. NAT showed a slow, controlled, and extended release pattern from SLN formulae, in which the percentage of drug released reached 94.91% and 93.13% from NAT-SLN F1 and F2, respectively. Free NAT had a rapid release rate under the experimental conditions, in which >90% of the drug was released within 2 hours as compared to 56.72% and 53.98% from the NAT-SLN optimized formulae F1 and F2, respectively. It was also noted that the pattern of drug release from SLN formulae showed a biphasic pattern, with an initial high-release burst during the first 2 hours, followed by a slow, extended, and sustained release over 8 hours. This release pattern is common in matrix-based formulae including SLN, in which drug release occurs mainly by diffusion through the lipid matrix and/or biodegradation and surface erosion of the lipid matrix.48 The initial burst drug release rate is usually due to adsorption of the drug on the particle surface and solubilization of the particle from the outer most layer. Release of significantly large amounts of drug during this short phase (exceeded 50%) is correlated with higher production temperatures that cause significant changes in the drug partition coefficient with subsequent localization on the lipid particle surface and the larger specific surface of the smaller particles. Over time, the release rate declines because of the effect of the slow and controlled diffusion of the dissolution medium through the deeper matrix layer that affects drug solubilization, which increases the viscosity of the stagnant layer that occurs due to matrix erosion and also retards penetration of medium through the matrix and slows the dissolution process.26,49
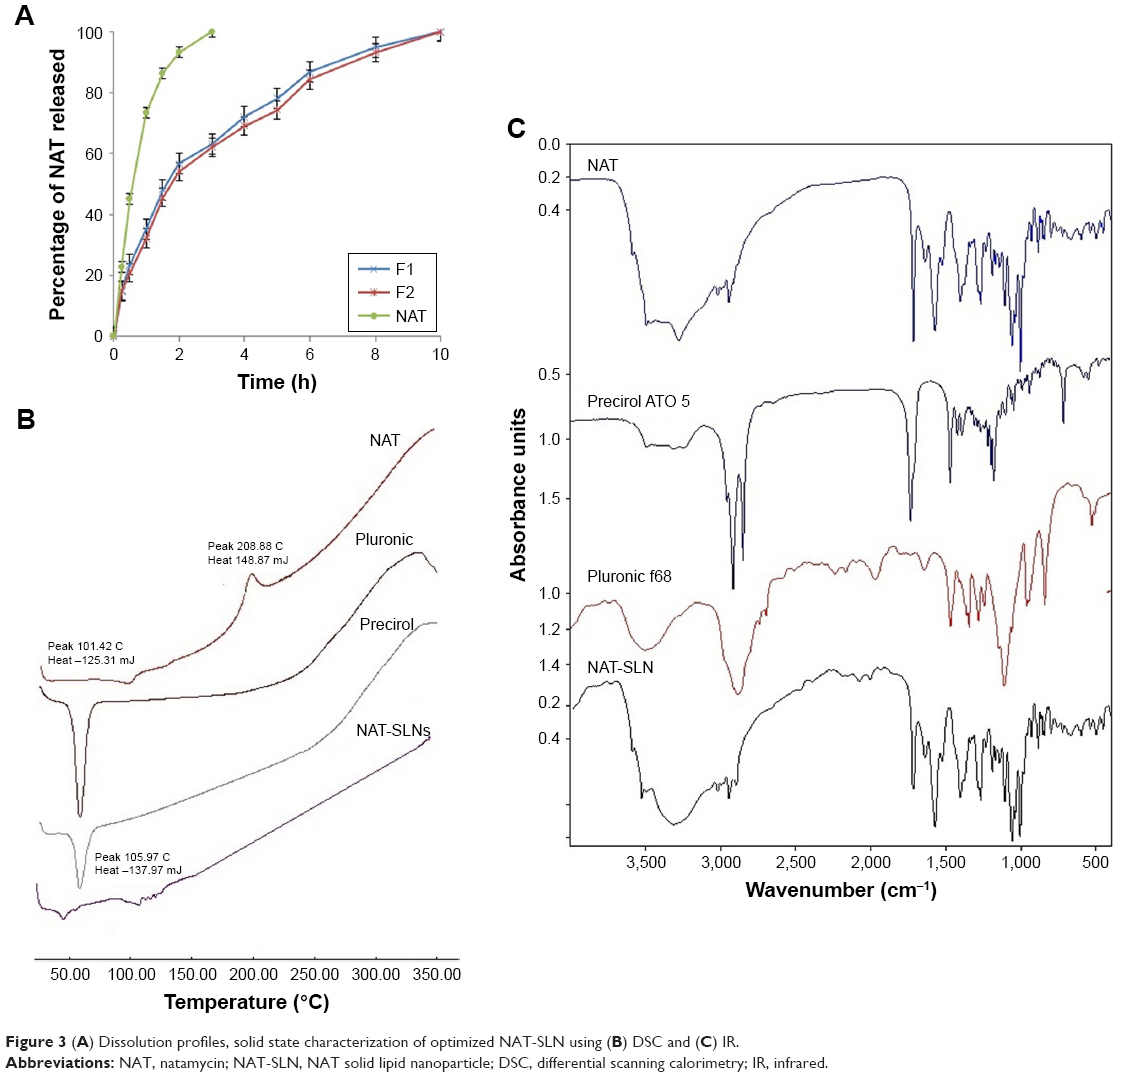 | Figure 3 (A) Dissolution profiles, solid state characterization of optimized NAT-SLN using (B) DSC and (C) IR. |
Kinetic analysis of the data of NAT release from optimized SLN formulae was determined depending on the calculated correlation coefficient (R2) value for each kinetic model. The results showed that NAT release followed the Weibull diffusion model, with R2 equal to 0.9940 and 0.9935 for optimized formula F1 and F2, respectively. This confirms that the proposed matrix structure had uniform drug distribution rather than core/coat structure formation.26 Other groups obtained similar results for SLN formulae where the Weibull model was found to be suitable to describe the complex multi-mechanistic drug release pattern (dissolution, diffusion, and mixed dissolution-diffusion) expected from SLN formulations.50 The model equation showed an A-value of 1.159 and 1.156 (>0.89) for optimized formula F1 and F2, respectively, indicating super case II transport characteristics in which drug release occurs mainly due to disentanglement and erosion of the matrix.51
Solid state characterizations and compatibility studies
Solid state characterizations and compatibility studies were performed on NAT-SLN formula, plain drug, and formula components. Figure 3B shows the DSC thermogram of plain NAT. Two broad endothermic peaks are observed: one at 101.42°C due to loss of water crystallization and another at 208.88°C due to drug melting,52 indicating sample purity. The DSC thermogram of the NAT-SLN showed complete disappearance of the plain drug peak, indicating efficient drug distribution within the lipid matrix and loss of crystallinity. The absence of any significant thermal changes in the Precirol ATO 5® and Pluronic f68 thermograms indicates compatibility of the formula mixture. Figure 3C shows the IR spectrum of plain NAT, with the main characteristic functional groups at 3,492.77 cm−1 (alcohol O−H), 3,278.44 cm−1 (primary N−H), 3,017.98 cm−1 (=C−H), 3,492.77–2,978.44 cm−1 (carboxylic O−H), 2,945.08 cm−1 (C−H stretching), and 1,715.49 cm−1 (C=O stretching). These main characteristic functional groups were all retained in the spectrum of SLN formula, which eliminates the possibility of any chemical interaction and indicates compatibility of the selected NAT-SLN formula mixture.
Antifungal susceptibility testing
Antifungal studies revealed that NAT possesses enhanced antifungal activity when formulated in the SLN form. The inhibition zone for NAT-SLN was increased by 8 and 6 mm relative to unformulated NAT when tested against A. fumigatus ATCC 1022 and a C. albicans clinical isolate, respectively. Specifically, the inhibition zones of unformulated NAT against A. fumigatus ATCC 1022 and the C. albicans clinical isolate were 18 and 17 mm, respectively, while the inhibition zones for NAT-SLN were 26 and 23 mm, respectively, as shown in Table 7 and Figure 4B. The MIC values of NAT-SLN against A. fumigatus ATCC 1022 and the C. albicans clinical isolate were decreased 2.5 times relative to the MIC values of unformulated NAT. Specifically, the MIC values of NAT against A. fumigatus ATCC 1022 and the C. albicans clinical isolate were 1 and 8 μg/mL, respectively. In contrast, the MIC values of NAT-SLN against A. fumigatus ATCC 1022 and the C. albicans clinical isolate were 0.4 and 3.2 μg/mL, respectively. Based on this study, we conclude that SLN formulation enhanced the antifungal activity of NAT in which the MIC values of the nano-formula were decreased 2.5 times relative to the unformulated form.
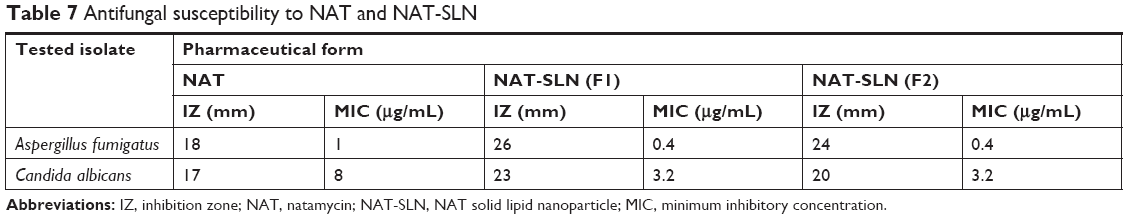 | Table 7 Antifungal susceptibility to NAT and NAT-SLN |
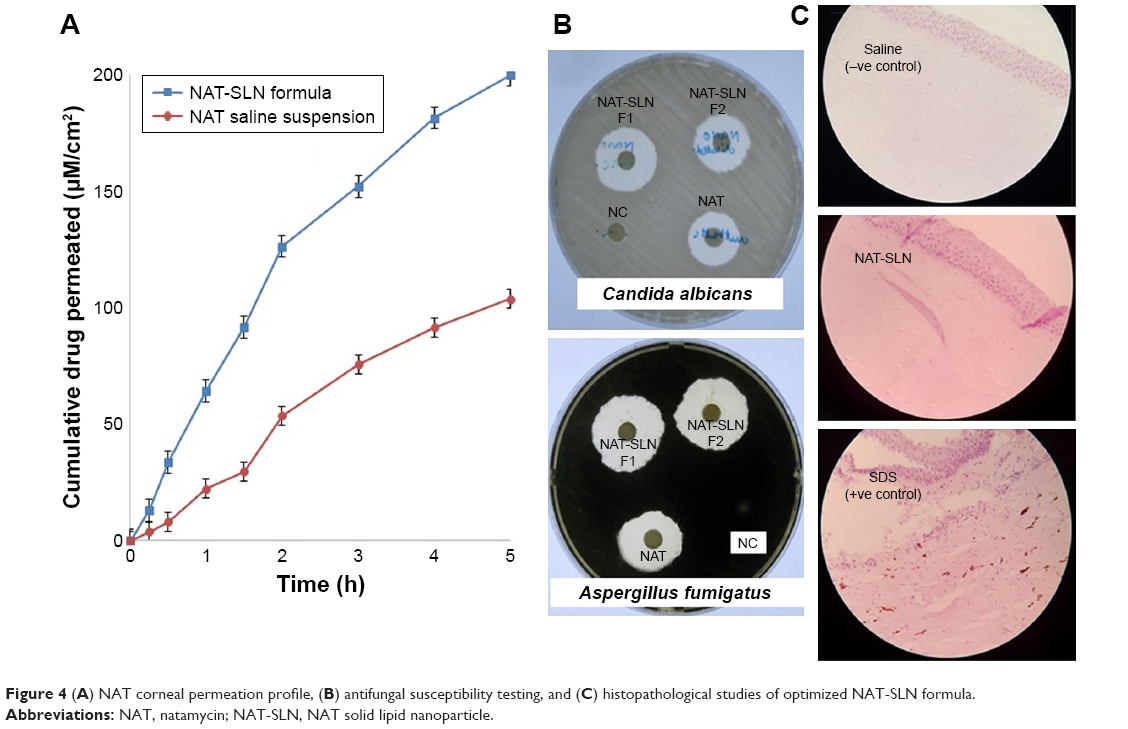 | Figure 4 (A) NAT corneal permeation profile, (B) antifungal susceptibility testing, and (C) histopathological studies of optimized NAT-SLN formula. |
Ex vivo corneal permeation studies
SLNs can effectively cross the corneal epithelium because of their lipophilic characteristics and nano-size that result in increased absorption and ocular bioavailability of the loaded drug.27 Depending on the results of the previous study, optimized NAT-SLN (F1) was selected for further ex vivo corneal permeation by measuring the apparent permeability (Papp), which describes the flux as a rate of drug accumulation in the acceptor compartment of the Franz cell per tissue surface area. Figure 4A shows the cumulative amount of permeated NAT per unit area (μM/cm2) as a function time (hours) over 5 hours. Steady-state flux (Jss) was calculated as the slope of the linear terminal part of the permeation curve.35 The calculated Papp and Jss of NAT were 11.59×10⁻² cm h−1 and 3.94 mol h−1 and 7.28×10⁻² cm h−1 and 2.48 mol h−1 for formulated SLN and unformulated drug, respectively. These results confirmed increased ocular absorption and improved drug antifungal activity in deep corneal layers of the prepared NAT-SLNs.
Histopathological studies
Histopathological investigation of potential NAT-SLN corneal irritation revealed a normal ocular surface structure for both the negative control and test material in which there were no morphological changes in the epidermal corneal layers (Figure 4C). In contrast, 0.1% SDS resulted in significant alteration in the corneal epidermal layers. SLN was found to be non-irritating to the corneal epidermal layer.
Conclusion
The optimization process for the prepared NAT-SLN formulae showed the significant effect of the selected variables on NAT-SLN characteristics. Lipid concentration had a major positive effect on PS and EE% while SAA concentration had a marked negative effect on PS and ZP. Sonication frequency had a significant effect on PS. Physical characterization of optimized formula revealed a small PS (42 nm), good ZP (25 mV), and high drug EE% (84%). The formula mixture was compatible and the drug had an extended release profile for 8 hours. Papp and Jss indicated significant improvement in corneal permeation. Wider inhibition zones and lower MICs were observed for NAT-SLNs against the tested fungi relative to the plain drug, indicating enhanced antifungal activity of the NAT-SLNs. Ex vivo histopathological studies did not show any morphological changes or signs of irritation. This confirms the suitability of using NAT-SLN as an ocular delivery system to provide prolonged, potent antifungal activity at lower NAT concentrations, and as an alternative to conventional drops to treat deep corneal FK.
The authors are currently working on additional in vivo studies to investigate ocular tolerance and corneal permeation of the optimized NAT-SLN formula and are studying the pharmacokinetic and pharmacodynamic properties of the permeation process in rabbit eyes. Also, the in vivo antifungal efficacy of the optimized NAT-SLN formula will be studied in an induced FK model.
Acknowledgments
The authors acknowledge the financial support offered by the Deanship of Scientific Research, Taif University, Taif, KSA (Research project number 1-438-5848) for the completion of this project.
Disclosure
The authors report no conflicts of interest in this work.
References
Wong T-Y, Ng T-P, Fong K-S, et al. Risk factors and clinical outcomes between fungal and bacterial keratitis: a comparative study. CLAO J. 1997;23(4):275–281. | ||
Sharma N, Chacko J, Velpandian T, et al. Comparative evaluation of topical versus intrastromal voriconazole as an adjunct to natamycin in recalcitrant fungal keratitis. Ophthalmology. 2013;120(4):677–681. doi:10.1016/j.ophtha.2012.09.023 | ||
Elshiek H, Pineda R. Fungal keratitis. Al-Basar Int J Ophthalmol. 2015;3:1. doi:10.4103/1858-6538.169310 | ||
Ansari Z, Miller D, Galor A. Current thoughts in fungal keratitis: diagnosis and treatment. Curr Fungal Infect Rep. 2013;7(3):209–218. doi:10.1007/s12281-013-0150-110.1007/s12281-013-0150-1 | ||
Saha S, Banerjee D, Khetan A, et al. Epidemiological profile of fungal keratitis in urban population of West Bengal, India. Oman J Ophthalmol. 2009;2(3):114. doi:10.4103/0974-620X.57310 | ||
Srinivasan M, Mascarenhas J, Prashanth C. Distinguishing infective versus noninfective keratitis. Indian J Ophthalmol. 2008;56(3):203. doi:10.4103/0301-4738.40358 | ||
Biswas NR, Verma K, Gupta SK, et al. Antifungal drugs for ophthalmic use. In: Gupta AK, Krishna V, editors. Clinical Ophthalmology-Contemporary Perspectives. 9th ed. India: 2009:96–104. | ||
Qiu S, Zhao G-Q, Lin J, et al. Natamycin in the treatment of fungal keratitis: a systematic review and Meta-analysis. Int J Ophthalmol. 2015;8(3):597. | ||
American Academy of Ophthalmology. Fungal Keratitis – Latin America. American Academy of Ophthalmology. October 1, 2014. Available from: www.aao.org/topic-detail/fungal-keratitis–latin-america. Accessed May 12, 2017. | ||
Müller GG, Kara-José N, Castro R. Antifungals in eye infections: drugs and routes of administration. Rev Bras Oftalmol. 2013;72(2):132–141. doi:10.1590/S0034-72802013000200014 | ||
Dong X, Qian T, Gao W. The mechanism of action and research methods of natamycin and polyene antimycotics. Chin J Mod Appl Pharm. 2010;27(10):878–882. | ||
Koontz JL, Marcy JE, Barbeau WE, et al. Stability of natamycin and its cyclodextrin inclusion complexes in aqueous solution. J Agric Food Chem. 2003;51(24):7111–7114. doi:10.1021/jf030333q | ||
Remington LA. Clinical Anatomy of the Visual System E-Book. PA, USA: Elsevier Health Sciences; 2011. | ||
Patel A, Cholkar K, Agrahari V, et al. Ocular drug delivery systems: an overview. World J Pharmacol. 2013;2(2):47. doi:10.5497/wjp.v2.i2.47 | ||
Gaudana R, Ananthula HK, Parenky A, et al. Ocular drug delivery. AAPS J. 2010;12(3):348–360. doi:10.1208/s12248-010-9183-3 | ||
Agrahari V, Mandal A, Agrahari V, et al. A comprehensive insight on ocular pharmacokinetics. Drug Deliv Transl Res. 2016;6(6):735–754. doi:10.1007/s13346-016-0339-2 | ||
Achouri D, Alhanout K, Piccerelle P, et al. Recent advances in ocular drug delivery. Drug Dev Ind Pharm. 2013;39(11):1599–1617. doi:10.3109/03639045.2012.736515 | ||
Yellepeddi VK, Palakurthi S. Recent advances in topical ocular drug delivery. J Ocul Pharmacol Ther. 2016;32(2):67–82. doi:10.1089/jop.2015.0047 | ||
Dubald M, Bourgeois S, Andrieu V, et al. Ophthalmic drug delivery systems for antibiotherapy – a review. Pharmaceutics. 2018;10(1):10. doi:10.3390/pharmaceutics10010010 | ||
Nagarwal RC, Kant S, Singh P, et al. Polymeric nanoparticulate system: a potential approach for ocular drug delivery. J Control Release. 2009;136(1):2–13. doi:10.1016/j.jconrel.2008.12.018 | ||
Kammari R, Das NG, Das SK. Nanoparticulate systems for therapeutic and diagnostic applications. In: Emerging Nanotechnologies for Diagnostics, Drug Delivery and Medical Devices. Mitra AK, Cholkar K, Mandal A, editors. PA, USA: Elsevier; 2017:105–144. | ||
Ram DT, Debnath S, Babu MN, et al. A review on solid lipid nanoparticles. Res J Pharm Technol. 2012;5(11):2. | ||
Mishra D, Dhote V, Pradyumna M. Solid lipid nanoparticles: a promising colloidal carrier. In: Chourasia MK, Chaurasia M, Jain NK, editors. Novel Carriers for Drug Delivery. Warszawa, Poland: PharmaMed Press; 2014;278–301. | ||
Singh A, Ubrane R, Prasad P, et al. Preparation and characterization of rizatriptan benzoate loaded solid lipid nanoparticles for brain targeting. Mater Today Proc. 2015;2(9):4521–4543. doi:10.1016/j.matpr.2015.10.067 | ||
El-Salamouni NS, Farid RM, El-Kamel AH, et al. Effect of sterilization on the physical stability of brimonidine-loaded solid lipid nanoparticles and nanostructured lipid carriers. Int J Pharm. 2015;496(2):976–983. doi:10.1016/j.ijpharm.2015.10.043 | ||
Khames A. Preparation and characterization of sildenafil loaded solid lipid nanoparticles: drug delivery system suitable for nebulization ahmed khames. Der Pharmacia Lettre. 2107;9(3):98–112. | ||
Patil A, Lakhani P, Taskar P, et al. Formulation development, optimization, and in vitro–in vivo characterization of natamycin-loaded pegylated nano-lipid carriers for ocular applications. J Pharm Sci. 2018;107(8):2160–2171. doi:10.1016/j.xphs.2018.04.014 | ||
Joshi M, Patravale V. Formulation and evaluation of nanostructured lipid carrier (NLC)–based gel of Valdecoxib. Drug Dev Ind Pharm. 2006;32(8):911–918. doi:10.1080/03639040600814676 | ||
Thangabalan B, Kumar PV. Analytical method development and validation of Natamycin in eye drop by RP-HPLC. Asian J Pharm Clin Res. 2013;6:134–135. | ||
Battaglia LS, Gallarate M, Panciani P, et al. Techniques for the Preparation of Solid Lipid Nano and Microparticles. In: Application of Nanotechnology in Drug Delivery. London, UK: IntechOpen; 2014. Available from: https://www.intechopen.com/books/application-of-nanotechnology-in-drug-delivery/techniques-for-the-preparation-of-solid-lipid-nano-and-microparticles [online]. Accessed July 6, 2018. | ||
Baranowski P, Karolewicz B, Gajda M, et al. Ophthalmic drug dosage forms: characterisation and research methods. Sci World J. 2014;2014:14. | ||
Satya D, Suria K, Muthu P. Advanced approaches and evaluation of ocular drug delivery system. Am J Pharmtech Res. 2011;1(4):72–92. | ||
Hao J, Fang X, Zhou Y, et al. Development and optimization of solid lipid nanoparticle formulation for ophthalmic delivery of chloramphenicol using a Box-Behnken design. Int J Nanomedicine. 2011;6:683. doi:10.2147/IJN.S25646 | ||
El-Badawy MF, Tawakol WM, El-Far SW, et al. Molecular identification of aminoglycoside-modifying enzymes and plasmid-mediated quinolone resistance genes among Klebsiella pneumoniae clinical isolates recovered from Egyptian patients. Int J Microbiol. 2017;2017:12. | ||
Dave V, Paliwal S. A novel approach to formulation factor of aceclofenac eye drops efficiency evaluation based on physicochemical characteristics of in vitro and in vivo permeation. Saudi Pharm J. 2014;22(3):240–245. doi:10.1016/j.jsps.2013.03.001 | ||
Rojas Gómez R, Restrepo Valencia P. In vitro-in vivo Pharmacokinetic correlation model for quality assurance of antiretroviral drugs. Colomb Méd. 2015;46(3):109–116. | ||
Puranik K, Tagalpallewar A. Voriconazole in situ gel for ocular drug delivery. SOJ Pharm Pharm Sci. 2015;2(2):1–10. doi:10.15226/2374-6866/2/2/00128 | ||
Vivek K, Reddy H, Murthy RS. Investigations of the effect of the lipid matrix on drug entrapment, in vitro release, and physical stability of olanzapine-loaded solid lipid nanoparticles. AAPS Pharm Sci Tech. 2007;8(4):16–24. doi:10.1208/pt0801016 | ||
Müller RH, Maèder K, Gohla S. Solid lipid nanoparticles (SLN) for controlled drug delivery a review of the state of the art. Eur J Pharm Biopharm. 2000;50(1):161–177. | ||
Abd-Elbary A, Tadros MI, Alaa-Eldin AA. Sucrose stearate-enriched lipid matrix tablets of etodolac: modulation of drug release, diffusional modeling and structure elucidation studies. AAPS Pharm Sci Tech. 2013;14(2):656–668. doi:10.1208/s12249-013-9951-3 | ||
NanoComposix. Zeta potential analysis of nanoparticles. 2012;1.1:1–6. Available from: https://cdn.shopify.com/s/files/1/0257/8237/files/nanoComposix_Guidelines_for_Zeta_Potential_Analysis_of_Nanoparticles.pdf. Accessed August 12, 2018. | ||
Bahari LAS, Hamishehkar H. The impact of variables on particle size of solid lipid nanoparticles and nanostructured lipid carriers; a comparative literature review. Adv Pharm Bull. 2016;6(2):143. doi:10.15171/apb.2016.021 | ||
Rowe RC, Sheskey PJ, Owen SC. Handbook of Pharmaceutical Excipients. Vol. 6. London: Pharmaceutical press; 2006. | ||
Montgomery DC. Design and Analysis of Experiments. 9th ed. Hoboken (NJ): John Wiley & Sons, Inc; 2017. Available from: https://www. wiley.com/en-us/Design+and+Analysis+of+Experiments%2C+9th+E dition-p-9781119113478 [online]. Accessed June 17, 2018. | ||
Thakkar HP, Desai JL, Parmar MP. Application of Box–Behnken design for optimization of formulation parameters for nanostructured lipid carriers of candesartan cilexetil. Asian J Pharm. 2014;8:2. | ||
Tanvir S, Qiao L. Surface tension of nanofluid-type fuels containing suspended nanomaterials. Nanoscale Res Lett. 2012;7(1):226. doi:10.1186/1556-276X-7-226 | ||
Li X, Lin X, Zheng L, et al. Effect of poly (ethylene glycol) stearate on the phase behavior of monocaprate/Tween80/water system and characterization of poly (ethylene glycol) stearate-modified solid lipid nanoparticles. Colloids Surf A Physicochem Eng Asp. 2008;317(1–3):352–359. doi:10.1016/j.colsurfa.2007.11.011 | ||
Seyfoddin A, Shaw J, Al-Kassas R. Solid lipid nanoparticles for ocular drug delivery. Drug Deliv. 2010;17(7):467–489. doi:10.3109/10717544.2010.483257 | ||
Sawant KK, Dodiya SS. Recent advances and patents on solid lipid nanoparticles. Recent Pat Drug Deliv Formul. 2008;2(2):120–135. doi:10.2174/187221108784534081 | ||
Barzegar-Jalali M, Adibkia K, Valizadeh H, et al. Kinetic analysis of drug release from nanoparticles. J Pharm Pharm Sci. 2008;11(1):167–177. | ||
Peppas NA, Sahlin JJ. A simple equation for the description of solute release. III. Coupling of diffusion and relaxation. Int J Pharm. 1989;57(2):169–172. doi:10.1016/0378-5173(89)90306-2 | ||
Cevher E, Şensoy D, Zloh M, et al. Preparation and characterisation of natamycin: γ-cyclodextrin inclusion complex and its evaluation in vaginal mucoadhesive formulations. J Pharm Sci. 2008;97(10):4319–4335. doi:10.1002/jps.21312 |
 © 2019 The Author(s). This work is published and licensed by Dove Medical Press Limited. The full terms of this license are available at https://www.dovepress.com/terms.php and incorporate the Creative Commons Attribution - Non Commercial (unported, v3.0) License.
By accessing the work you hereby accept the Terms. Non-commercial uses of the work are permitted without any further permission from Dove Medical Press Limited, provided the work is properly attributed. For permission for commercial use of this work, please see paragraphs 4.2 and 5 of our Terms.
© 2019 The Author(s). This work is published and licensed by Dove Medical Press Limited. The full terms of this license are available at https://www.dovepress.com/terms.php and incorporate the Creative Commons Attribution - Non Commercial (unported, v3.0) License.
By accessing the work you hereby accept the Terms. Non-commercial uses of the work are permitted without any further permission from Dove Medical Press Limited, provided the work is properly attributed. For permission for commercial use of this work, please see paragraphs 4.2 and 5 of our Terms.