")
Back to Journals » International Journal of Nanomedicine » Volume 14
MRI Detectable Polymer Microspheres Embedded With Magnetic Ferrite Nanoclusters For Embolization: In Vitro And In Vivo Evaluation
Authors Qin XY, Liu XX, Li ZY, Guo LY, Zheng ZZ, Guan HT, Song L, Zou YH, Fan TY
Received 21 March 2019
Accepted for publication 25 September 2019
Published 18 November 2019 Volume 2019:14 Pages 8989—9006
DOI https://doi.org/10.2147/IJN.S209603
Checked for plagiarism Yes
Review by Single anonymous peer review
Peer reviewer comments 2
Editor who approved publication: Professor Lei Yang
Xiao-Ya Qin,1,2,* Xiao-Xin Liu,1,2,* Zi-Yuan Li,1,2 Li-Ying Guo,1,2 Zhuo-Zhao Zheng,3 Hai-Tao Guan,4 Li Song,4 Ying-Hua Zou,4 Tian-Yuan Fan1,2
1The State Key Laboratory of Natural and Biomimetic Drugs, School of Pharmaceutical Sciences, Peking University, Beijing, People’s Republic of China; 2Beijing Key Laboratory of Molecular Pharmaceutics and New Drug Delivery Systems, School of Pharmaceutical Sciences, Peking University, Beijing, People’s Republic of China; 3Department of Nuclear Medicine, Beijing Tsinghua Changgung Hospital, Beijing, People’s Republic of China; 4Department of Interventional Radiology and Vascular Surgery, Peking University First Hospital, Beijing, People’s Republic of China
*These authors contributed equally to this work
Correspondence: Tian-Yuan Fan
Department of Pharmaceutics, School of Pharmaceutical Sciences, Peking University, Xueyuan Road No.38, Haidian District, Beijing 100191, People’s Republic of China
Tel/fax +86 10 8280 5123
Email [email protected]
Objective: The objective of this study was to develop magnetic embolic microspheres that could be visualized by clinical magnetic resonance imaging (MRI) scanners aiming to improve the efficiency and safety of embolotherapy.
Methods and discussion: Magnetic ferrite nanoclusters (FNs) were synthesized with microwave-assisted solvothermal method, and their morphology, particle size, crystalline structure, magnetic properties as well as T2 relaxivity were characterized to confirm the feasibility of FNs as an MRI probe. Magnetic polymer microspheres (FNMs) were then produced by inverse suspension polymerization with FNs embedded inside. The physicochemical and mechanical properties (including morphology, particle size, infrared spectra, elasticity, etc.) of FNMs were investigated, and the magnetic properties and MRI detectable properties of FNMs were also assayed by vibrating sample magnetometer and MRI scanners. Favorable biocompatibility and long-term MRI detectability of FNMs were then studied in mice by subcutaneous injection. FNMs were further used to embolize rabbits’ kidneys to evaluate the embolic property and detectability by MRI.
Conclusion: FNMs could serve as a promising MRI-visualized embolic material for embolotherapy in the future.
Keywords: polymerized microspheres, magnetic ferrite nanoclusters, magnetic resonance imaging, embolization, microwave-assisted solvothermal method
Introduction
Transcatheter arterial embolization (TAE) is one of the most important interventional therapies, mainly used for the treatment of unresectable tumors, symptomatic uterine fibroids, arteriovenous malformations, and hemorrhage. In the process of TAE, the embolic agents are delivered through microcatheters to the target vessels and block the vessels to achieve the treatment purpose.1–4
Generally, TAE requires to use X-ray digital subtraction angiography (DSA) and iodic angiographic agent to observe blood flow so as to judge indirectly the circumstances of the target vessels before and during embolization as well as the embolic endpoints.5 However, simply using DSA cannot confirm the exact location of the embolic agents and thus cannot meet clinical requirements to ensure embolic agents of proper volume were at the target site. In the last two decades, developing magnetic resonance imaging (MRI) as a feasible alternative or adjunctive imaging modality of DSA for the guidance of endovascular interventions has attracted increasing attention.6,7 Compared with X-ray, interventional therapy monitored by MRI has the merits of non-ionization radiation and high tissue resolution,7,8 thus is preferred by both doctors and patients clinically. Some researchers have achieved in combining DSA and MRI to guide the renal artery embolization of dogs.9 Others have increased the success rate of uterine fibroids embolization or improved the therapeutic capabilities of hepatocellular carcinoma chemoembolization with the hybrid of DSA and MRI in clinical studies.10,11 Recently, using a magnetically assisted remote-controlled catheter under real-time MRI guidance, renal artery embolization with gadolinium (Gd)-impregnated microspheres was successfully performed in pigs.12
MRI-visualized embolic microspheres have also been developed to improve the efficiency and safety of embolization.8,13,14 By using MRI-visualized microspheres, their position and compactness in blood vessel can be monitored by MRI and the embolic endpoints can be accurately judged, which is considered very important in chemoembolization, especially in the treatment of highly vascularized tumors. In addition, the distribution of embolization agents can offer feedback for radiologists to adjust intervention technology in time and provide individualized embolization, which would improve the overall therapeutic effects and lower the risk of operations.15–17
Superparamagnetic iron oxide nanoparticles (SPIONs) have already been encapsulated in various microspheres, such as microspheres of chitosan,13,18 alginate,14,15 poly (lactic acid)/poly (ethylene glycol),19 and poly (lactide-co-glycolide),20,21 to prepare MRI-visualized embolic agents due to their relatively low cytotoxicity, long-term contrast enhancement, low cost, and easy availability. However, the imaging intensity of SPIONs embedded in microspheres is not enough in some cases when more detailed information is needed. Therefore, to improve the imaging quality of SPIONs would be a wise choice. Increasing the particle size of SPIONs could induce a higher value of transverse relaxivity and enhanced MRI detectability, but the increase of particle size was limited to some extent (approximately 15 nm) otherwise the SPIONs would lose superparamagnetic property and easily aggregate in solution.22 Magnetic ferrite nanoclusters (FNs) appear the most promising magnetic material to solve the above problems. FNs are the secondary structure consisting of multiple single superfine iron oxide nanocrystal, ie, clustering individual SPIONs into clusters, which were shown to have higher T2 relaxivity rate than single iron oxide nanoparticles due to synergistic magnetism, contributing to better MRI detectability, while retaining the superparamagnetic characteristics in the meantime.23,24
In addition, though various kinds of materials have been applied in the research of embolization microspheres, only hydrophilic polymer microspheres, such as Embospheres, DC beads, and Hepaspheres, are widely used in clinical embolotherapy, as they feature the advantages of smooth surface, round particle sizes, satisfactory biocompatibility and elasticity, stability, and permanent embolism (non-degradation).25–27
In this study, MRI detectable microspheres were designed and prepared with FNs embedded in polymer microspheres (FNMs), aiming to improve the efficiency and safety of embolotherapy. In brief, FNs were synthesized with microwave-assisted solvothermal reduction method and characterized as an excellent T2-weighted contrast agent. Afterwards, the FNs were embedded into hydrophilic poly (acrylic acid) microspheres to acquire the MRI detectable magnetic microspheres for embolization. The properties of FNMs were evaluated comprehensively and systematically for potential clinical application, including morphology, size distribution, elasticity, in vitro MR imaging, biocompatibility, and long-term MRI detectability in mice as well as embolic feasibility and MRI visibility in rabbits.
Materials And Methods
Materials
Iron chloride and Tween 80 were purchased from Tianjin Guangfu Fine Chemical Research Institute (Tianjin, China). Ethylene glycol, trisodium citrate, and sodium acetate were purchased from Beijing Chemical Works (Beijing, China). Acrylic acid (AA, purity ≥ 98%) was supplied by Wulian Chemical Factory (Shanghai, China). Potassium persulfate was purchased from Sinopharm Chemical Reagent Co., Ltd. (Beijing, China). N, N′-methylenebisacrylamide was purchased from Junyao Albert Biotechnology Company (Beijing, China). Liquid paraffin was purchased from Tianjin Bodi Chemical Co., Ltd. (Tianjin, China). Span 80 was purchased from Xilong Chemical Co., Ltd. (Shantou, China). Hydroxylamine hydrochloride and O-phenanthroline Hydrate were obtained from Yingdaxigui Chemical Reagent Factory (Tianjin, China). Agarose, pentobarbital sodium, and sodium carboxylmethyl cellulose were purchased from Sigma Aldrich (USA). Embospheres were purchased from Biosphere Medical Inc. (USA). Iodixanol injections were supplied by GE Healthcare Ireland (Ireland). All the other solvents and reagents were of analytical grade and used as received without further purification otherwise noted.
Synthesis Of Magnetic Ferrite Nanoclusters
FNs were synthesized with a microwave-assisted solvothermal reduction method based on previous report.28 In a typical procedure, iron chloride, trisodium citrate, and sodium acetate at a molar ratio of 1:0.34:7.3 were dissolved in ethylene glycol. Then, the solution was placed in a microwave synthesizer (Discover SP, CEM, USA) and heated to 190°C for 200 s. After cooling to room temperature, black precipitate was collected using a permanent magnet, washed with ethanol and deionized water successively, followed by lyophilized, and stored at room temperature for further use.
Characterizations Of FNs
Morphology Of FNs
The morphology of FNs was examined via transmission electron microscopy (TEM; JEM-1200EX, JEOL, Japan) operating at 100 kV.29 The sample was prepared by placing a drop of suspension (FNs in absolute ethanol) onto a carbon-coated copper grid and dried naturally.
Particle Size And Size Distribution Of FNs
The particle size and size distribution of FNs in water were determined by a dynamic light scattering instrument (DLS; Zetasizer NanoZS, Malvern, UK) at a wavelength of 633 nm, scattering angle of 90° and temperature of 25°C.29
Infrared Spectra Of FNs
Fourier transform infrared spectroscopic measurement of FNs was carried out on a Fourier transform infrared spectrometer (5DX, Thermo Nicolet Corporation, USA) in a scanning range of 4000–400 cm−1 using a KBr pressed tablet.30
X-Ray Diffractometer Of FNs
The X-ray diffraction (XRD) patterns of the lyophilized FNs were analyzed by an X-ray powder diffractometer (Mini Flex 600 X, Rigaku, Japan) with Cu Kα radiation (λ=1.5406 Å) at 40 kV and 15 mA, scanning from 10° to 80° at a scan rate of 4°/min.30
X-Ray Photoelectron Spectroscopy Of FNs
X-ray photoelectron spectroscopy (XPS) was performed on an X-ray photoelectron spectrometer (Axis Ultra, Kratos, England) using monochromatic Al Kα radiation. Pass energy of 160 eV and step size of 1.00 eV were employed for survey spectrum of FNs. For Fe 2p high-resolution spectrum, pass energy of 40 eV and step size of 0.10 eV were adopted.31,32
Iron Content Of FNs
The iron content of FNs was measured according to the previous report.33 Ten milligrams of FNs were digested in 2 mL of mixed acid solution (fuming nitric acid and concentrated hydrochloric acid mixed at a volume ratio of 1:4) for 30 mins. The resultant solution was diluted with water to 100 mL. Afterwards, 5 mL of the diluted solution was put in a volumetric flask, followed by adding 1 mL of hydroxylamine hydrochloride solution (10%, w/w), 2 mL of 1, 10-phenanthroline (0.15%, w/w), 5 mL of sodium acetate solution (1 mol/L), and proper amount of water to a total volume of 100 mL. The absorbances of reactants were determined at 510 nm with a UV-visible spectrometer (UV-1100, Mapada Instruments Co., Ltd. Shanghai). The iron contents of samples were obtained from a standard curve of the absorbances and known concentrations of iron. The experiments were conducted in triplicate.
Magnetic Property Of FNs
The magnetic property of FNs was measured on a vibrating sample magnetometer (VSM; PPMS-9, Quantum Design, USA) with magnetic field in the range of ±6 kOe at room temperature.34
T2 Relaxivity Of FNs
To determine the T2 relaxivity (r2), FNs were suspended in agarose gel (1%, w/v) at a series concentration to avoid sedimentation. The accurate iron concentrations of the samples were determined by inductively coupled plasma mass spectroscopy (ICP-MS; Perkin Elmer, MA, USA). The T2 relaxation time was measured using a 3 Tesla MRI scanner (GE Medical Systems, LLC, USA) with a fast spin echo (FSE) sequence of the following parameters: repetition time (TR) = 1000 ms, echo time (TE) = 5.9–47.1 ms, field of view (FOV) = 20 × 20 cm, flip angle = 45°, and slice thickness = 3.0 mm. The r2 of FNs was calculated by the linear regression of the inverse relaxation times as a function of the iron concentrations (mM Fe) according to literature.35
Preparation Of FNMs
FNMs were prepared by inverse suspension polymerization method.26,34 Briefly, 40 mL of liquid paraffin containing 0.134 g of Span 80 (oil phase) was added into a three-necked flask equipped with a mechanical stirrer. Ninety milligrams of FNs were dispersed in a blended aqueous solution of acrylic acid (monomer, 1.8 g), potassium persulfate (initiator, 68 mg), and N, N′-methylenebisacrylamide (crosslinker, 77 mg). The resultant water phase was then added into the oil phase under stirring. The polymerization reaction was carried out at 55°C for 4 hrs under the protection of nitrogen. Finally, the microspheres were washed with Tween 80 solution (0.5%, w/v) and deionized water successively. The FNMs in size range of 100–900 μm were collected by wet-sieving.36
Poly (acrylic acid) microspheres without the addition of FNs were also prepared and collected within the size range of 100–900 μm, which were called blank polymer microspheres (BMs) and used as a control of FNMs in this study.
For special use in later experiments, some of the FNMs and BMs were separated into subgroups of 100–300 μm, 300–500 μm, 500–700 μm, and 700–900 μm with wet-sieving method.36 After sorting, each subgroup of microspheres was confirmed within the accurate size range by measuring the diameters of microspheres with optical microscope. All of the FNMs and BMs were lyophilized or stored in saline for further analysis.
Characterizations Of FNMs
Morphology Of FNMs
The morphology of FNMs as well as BMs was observed with optical microscope (XTZ-D/T, Shanghai Optical Instrument Factory No. 6, China) and environmental scanning electron microscope (ESEM; FEI Quanta 200F, EDAX/AME-TEK, US). The FNMs were also investigated under TEM with the operation as same as that of FNs except that the lyophilized FNMs were cut into thin slices so as to avoid obtaining dark photographs.34
Particle Size And Size Distribution Of FNMs
The diameters of FNMs as well as BMs in saline were measured under optical microscope, and the frequency histograms with 50 μm intervals were drawn. The number-average diameters (Dn) of FNMs and BMs were determined by measuring at least 1000 individual microspheres.26,37
Infrared Spectra Of FNMs
Fourier transform infrared spectroscopic measurements of lyophilized FNMs as well as BMs were performed separately in the same condition as that for FNs.26,34
X-Ray Diffractometer Of FNMs
The lyophilized FNMs were grounded into powder and tested by XRD in the same condition as that for FNs.19,34
X-Ray Photoelectron Spectroscopy Of FNMs
XPS for lyophilized FNMs was performed in the same condition as that for FNs.17,34
Iron Content Of FNMs
The iron contents of FNMs in whole size (100–900 μm) and different subgroups (100–300 μm, 300–500 μm, 500–700 μm, and 700–900 μm) were measured separately. Briefly, 0.5 mL of wet FNMs or 24 mg of lyophilized FNMs were digested in 5 mL of mixed acid solution and the following procedures were as same as described in the “Iron content of FNs” section.38 Correspondingly, the iron contents in terms of weight per volume of FNMs or in terms of weight percentage of FNMs were measured and calculated.
Magnetic Property Of FNMs
The magnetic property of lyophilized FNMs was measured by VSM in the same condition as that for FNs.19
Elasticity Of FNMs
To evaluate elasticity, the FNMs and BMs in size of 700–750 μm were selected. A series of tests were performed with texture analyzer (TA. XTPlus, Stable Micro Systems, UK) as described in our previous work, including compression test for monolayer of microspheres, stress relaxation test for monolayer of microspheres, compression test for single microsphere, and repeated compression test for single microsphere. All tests were performed at room temperature and repeated at least three times.26
MR Imaging Of FNMs In Vitro
Four subgroups of FNMs (100–300 μm, 300–500 μm, 500–700 μm, and 700–900 μm) were suspended evenly in agarose gel (1%, w/v) with concentrations of FNMs at 4%, 8%, 16%, and 32% (v/v) in 1.5 mL of Eppendorf tubes. T2-weighted images were taken using a 3.0 T MRI device (Magnetom Trio Tim, Siemens, Germany) with a turbo spin echo (TSE) sequence under the operational parameters described as follows: TR = 3000 ms, TE = 88 ms, FOV = 12 × 12 cm, flip angle = 150°, slice thickness = 3.0 mm, and matrix = 179 × 256.34
MR Imaging And Histocompatibility Of FNMs In Mice
Subcutaneous Injection
Fifteen female adult Kun Ming mice (approximately 25 g of initial weight) were purchased from Peking University Experimental Animal Center (Beijing, China). The experiment was performed following the National Institutes of Health guidelines and was approved by the Animal Care Committee of Peking University Health Science Center. All animals were anesthetized by intraperitoneal injection of chloral hydrate (4%, w/v, 0.1 mL/10 g body weight). FNMs in subgroup of 100–300 μm were selected and autoclaved at 121°C for 30 mins. The sterilized FNMs were suspended in sodium carboxylmethyl cellulose solution (1%, w/v) at a volume radio of 1:7, and 0.2 mL of the suspension was injected subcutaneously into the back of each mouse.17,34
MR Imaging In Mice
The MRI examinations were performed with a 3.0 T MR scanner (Magnetom Trio Tim, Siemens, Germany) with a wrist coil. Three mice were scanned before and at 0 d, 14 d, and 28 d after the injection. All these MRI images were taken and compared among the same animals.34 The imaging parameters of multi-slice T2-weighted TSE sequence were as follows: TR = 4710 ms, TE = 88 ms, FOV = 12 × 12 cm, flip angle = 150°, slice thickness = 3.0 mm, and matrix = 179 × 256. To qualify the signal enhancement, we identified the injection area as the regions of interest (ROIs) and calculated the signal-to-noise ratio (SNR) by the equation: SNRmice = SImice/SDnoise, where SI represents signal intensity and SD represents standard deviation. Then, the contrast enhancement was defined as the change of SNR, ie, △SNR = (|SNRpost -SNRpre|)/SNRpre.39
Histocompatibility
Three mice were sacrificed at 2 h, 2 d, 7 d, 14 d, and 28 d post injection, respectively. The tissues surrounded by FNMs were excised for histological section, stained by hematoxylin and eosin, and then observed with an optical microscope (Bx-51, Olympus, Japan). The pathologic evaluations of all specimens were performed by a professional pathologist.37,40
Renal Embolization And MR Imaging Of FNMs In Rabbits
Renal Embolization
The following experiment was also performed following the National Institutes of Health guidelines and was approved by the Animal Care Committee of Peking University Health Science Center. Two male New Zealand white rabbits with an average weight of 3.5 ± 0.1 kg were anesthetized by injection of pentobarbital sodium solution (2%, w/v, 30 mg/kg body weight) via marginal ear vein. The right femoral artery was surgically exposed and punctured. Under the guidance of DSA (Innova®4100, GE Healthcare Technologies, USA), a 2.8 Fr catheter (Progreat®, Terumo Co., Tokyo, Japan) was inserted into the left renal artery by a guidewire, and Iodixanol was infused through the catheter to show the renal vessels. Then, 0.3 mL of FNMs suspended in a mixed solution of Iodixanol (0.3 mL) and saline (0.2 mL) was delivered slowly to the renal trunk.17 Arteriograms were performed before and after embolization to confirm the blood flow of kidney. The catheter was gently pulled out after the operation, and the incision was closed properly.40
MR Imaging In Rabbits
To evaluate the detectability of FNMs by MRI, the rabbits were scanned before and after embolization by a clinical 3.0 T MRI device (GE Medical Systems, LLC, USA) with a knee array coil. The scans were performed with the following two sequences, respectively: T2-weighted fast spin echo sequence (FSE; OA × T2 PROPELLER: TR = 3478 ms, TE = 57 ms, FOV = 20 × 20 cm, flip angle = 180°, slice thickness = 4.0 mm and matrix = 256 × 256) and T2*-weighted gradient recalled echo sequence (GRE; OA × 2D MERGR: TR = 551 ms, TE = 5.2 ms, FOV = 20 × 20 cm, flip angle = 20°, slice thickness = 4.0 mm, and matrix = 256 × 224).17 We also introduced △SNR to qualify the efficacy of contrast enhancement. For transverse images, △SNR was used to show the changes of SNR before and after embolization, △SNR = (|SNRpost – SNRpre|)/SNRpre.39 While for sagittal images, △SNR was employed to indicate the changes of SNR between the unembolized (right) and embolized (left) kidneys, which was given by △SNR = (|SNRleft – SNRright|)/SNRright.
Statistical Analysis
All quantitative data were expressed as mean ± SD. Statistical significance analysis between experimental groups was performed using Student’s t-test in an SPSS statistical package (version 20.0; IBM Corp., Armonk, New York, USA). Differences were considered statistically significant with a P-value < 0.05 and highly significant with a P-value < 0.01.
Results And Discussion
Synthesis Of FNs
We have mainly two considerations for the synthesis of FNs. First, microwave radiation was introduced to the solvothermal reduction method instead of traditional heating. It shortened the reaction time from hours to minutes, highly saved energy, and provided uniform nucleation environment which could lead to good quality of iron oxide nanocrystals.41 Meanwhile, in order to provide potential for the future industrial production and clinical application, inexpensive, non-toxic and easily obtained chemicals were selected as reactants, like iron chloride, trisodium citrate, and sodium acetate.42
For the mechanism of reaction, sodium acetate was considered to provide an alkali environment where Fe3+ could gradually hydrolyze into hydroxide and its intermediate products, which were reduced by ethylene glycol. Sodium citrate acted as a surfactant to modify the iron oxide particles and control the size of crystalline grains grown.43,44 The formation of the FNs was supposed to follow a two-stage growth model, in which primary iron oxide nanocrystals first nucleated via the reduction reaction between iron chloride and ethylene glycol, and then aggregated into larger secondary particles as reported in literature.45
Preparation Of FNMs
In this study, the FNMs were developed aiming for translational medicine. As the most commonly used embolic microspheres in clinic are polymerized microspheres (such as Embospheres, DC beads, and HepaSpheres), FNs were thus designed to be entrapped in poly (acrylic acid) microspheres. To our knowledge, it was the first trial to load magnetic nanoclusters on microspheres by inverse suspension polymerization method. FNs were first mixed with the monomer of acrylic acid, and then with the accomplishment of polymerization reaction, FNs were embedded in the poly (acrylic acid) microspheres. By using this method, the contents of FNs in FNMs could be simply adjusted by adding different quantities of FNs to the polymerization reaction system. Besides, the impact of FNs loaded on the FNMs could be easily found by comparing the properties between FNMs and BMs.
Characterizations Of FNs And FNMs
Morphology Of FNs And FNMs
The TEM images of FNs are presented in Figure 1. The secondary structure of FNs could be observed clearly, which was composed of primary iron oxide nanoparticles.
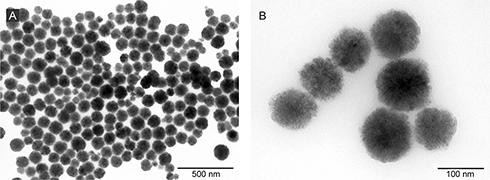 |
Figure 1 TEM images of FNs at a magnification of 10 k (A) and 40 k (B). Abbreviations: TEM, transmission electron microscopy; FNs, magnetic ferrite nanoclusters. |
The morphological features of FNMs were investigated with optical microscopy, ESEM and TEM with BMs as a contrast (Figure 2). As shown in the optical macrographs (Figure 2A and B), both BMs and FNMs were spherical and highly dispersed. BMs were transparent spheres, while black FNs could be found concentrated at the center of FNMs. In the images of ESEM (Figure 2C and D), spherical BMs and FNMs were both visualized with smooth surface. Thus, the FNMs were proved to be spherical embolic microspheres, which were reported to be more easily calibrated and precisely delivered to the target vessels of occlusion compared with irregular embolic particles.16 The TEM images (Figure 2E and F) confirmed the FNs were distributed inside the FNMs. At high magnification (Figure 2F), only small amount of FNs could be observed scattered into primary structure, indicating the FNs maintained good secondary structure during the polymerization of FNMs.
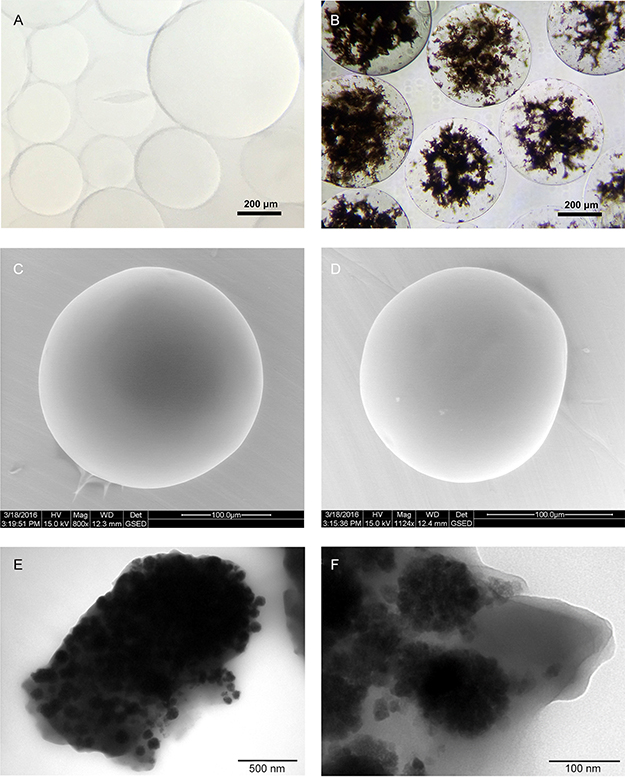 |
Figure 2 Morphology of microspheres. Notes: BMs under optical microscope (A); FNMs under optical microscope (B); BMs under ESEM (C); FNMs under ESEM (D); FNMs under TEM at a magnification of 8 k (E) and 50 k (F). Abbreviations: BMs, blank polymer microspheres; FNMs, magnetic polymer microspheres; ESEM, environmental scanning electron microscope; TEM, transmission electron microscopy. |
Particle Size Of FNs And FNMs
The mean diameter of FNs was 104 ± 17 nm by measuring all the clusters in the scope of TEM image (Figure 1A). The value fell within the size range of FNs (50–200 nm) reported in literature.28,35 The average hydrodynamic diameter of FNs detected by DLS was 155 ± 16 nm with polydispersity index of 0.14 (Figure 3A). It was considered that the appearance of hydrodynamic layer on the surface of FNs resulted in larger particle size when FNs were put in water and measured by DLS.46
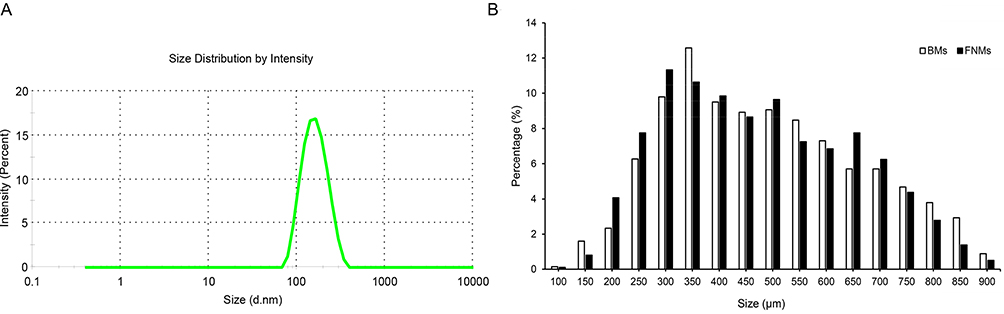 |
Figure 3 DLS intensity distributions of FNs (A) and size distribution of the BMs (blank column) and FNMs (black column) (B). Abbreviations: DLS, dynamic light scattering; FNs, magnetic ferrite nanoclusters; BMs, blank polymer microspheres; FNMs, magnetic polymer microspheres. |
Size distribution of FNMs and BMs were shown in Figure 3B. The average diameter was 448 ± 172 μm and 462 ± 177 μm for FNMs and BMs, respectively. Significant differences were found between FNMs and BMs in both size distribution and average diameter (p < 0.05), suggesting the loading of FNs reduced the size of microspheres. The particle size of commercially available embolic microspheres is usually in the range of 40–1200 μm and the microspheres are often separated into different subgroups. For instance, Embospheres are sorted into 40–120 μm, 100–300 μm, 300–500 μm, 500–700 μm, 700–900 μm, and 900–1200 μm, and DC beads are classified to 100–300 μm, 300–500 μm, 500–700 μm, and 700–900 μm.16,27 Thus, the particle size of FNMs prepared within the range of 100–900 μm was considered to meet the clinical needs well.
Infrared Spectra Of FNs And FNMs
Figure 4 describes the FT-IR spectra of the FNs, BMs, and FNMs. A strong absorption peak was observed at 577 cm−1 for FNs (Figure 4A), which was assigned to the characteristic of Fe–O vibration of iron oxide.47 Meanwhile, the distinctive peaks at 1609 cm−1 and 1384 cm−1 were attributed to the typical absorption peaks of asymmetric and symmetric stretching of COO-, suggesting a successful modification of trisodium citrate to the magnetic nanoparticles. For both BMs (Figure 4B) and FNMs (Figure 4C), the absorption peaks at 3423 cm−1 and 1723 cm−1 were attributed to O–H and C=O stretching vibration of carboxyl group,48 and the peak at 2920 cm−1 was assigned to the stretching vibration of –CH2–, confirming the successful polymerization of double bonds (–C=C–) of acrylic group.26 Moreover, the peak at 577 cm−1 attributed to the Fe–O stretching vibration could also be found in FNMs, indicating that FNs were successfully loaded on the FNMs.
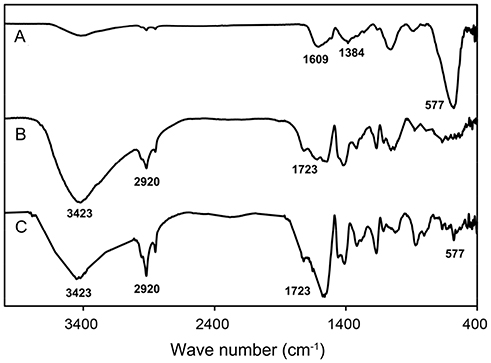 |
Figure 4 FT-IR spectra of FNs (A), BMs (B) and FNMs (C). Abbreviations: FT-IR, Fourier transform infrared; FNs, magnetic ferrite nanoclusters; BMs, blank polymer microspheres; FNMs, magnetic polymer microspheres. |
XRD Of FNs And FNMs
The XRD pattern of FNs was shown in Figure 5A. The FNs were confirmed in inverse spinel structure with the characteristic peaks at 2θ of 30.3°, 35.7°, 43.2°, 57.3°, and 62.9°, which could be indexed to the (220), (311), (400), (511), and (440) lattice planes of Fe3O4 (JCPDS card No. 85–1436), respectively.34 The average crystallite size of primary nanocrystals of FNs was calculated to be approximately 14 nm according to the Scherrer’s equation based on the strongest peak (311) of XRD pattern,49 which was consistent with the range of primary nanoparticle size of FNs (4–15.7 nm) reported in literature.23,50,51
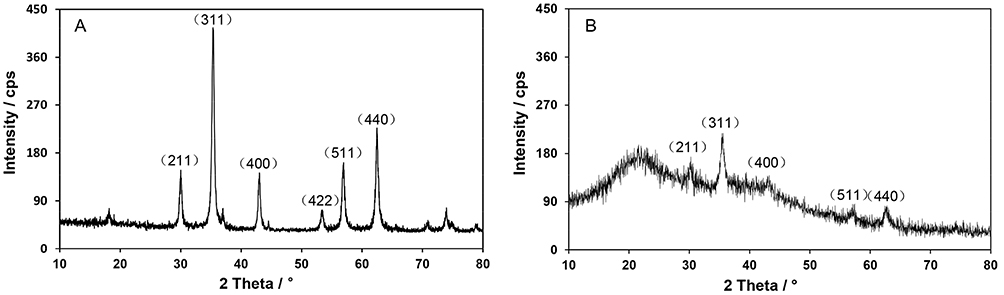 |
Figure 5 The XRD patterns of FNs (A) and FNMs (B). Abbreviations: XRD, X-ray diffraction; FNs, magnetic ferrite nanoclusters; FNMs, magnetic polymer microspheres. |
The XRD spectrum of FNMs was displayed in Figure 5B. Nearly all the characteristic peaks of FNs could be detected in the XRD pattern of FNMs, indicating the crystalline structure of FNs remained unchanged during the polymerization of FNMs. The well-maintained crystallinity of FNs was considered very important for keeping the saturation magnetization52 and ensuring the MRI detectability of FNMs.53 The broad peak appeared in the range from 15° to 25° suggested the existence of amorphous polymer in FNMs,19 which lead to several diffraction peaks in XRD spectrum undistinguished compared with those of FNs.
XPS Of FNs And FNMs
As the XRD patterns of magnetite (Fe3O4) and maghemite (γ-Fe2O3) were similar,31 XPS spectra were further performed to verify the compositions of Fe3O4 in FNs and FNMs. The XPS survey spectra of FNs and FNMs are shown in Figure 6A and C, respectively. The main peaks could be ascribed to Fe, C, O, and Na elements as labeled. The Fe 2p spectra of FNs and FNMs are shown separately in Figure 6B and D. The two broad peaks located at 710.5 eV and 723.5 eV for FNs were, respectively, ascribed to the Fe 2p3/2 and Fe 2p1/2 of Fe3O4. Usually, the Fe3+ in γ-Fe2O3 exhibits a shakeup satellite peak around 719.0 eV. The absence of this characteristic peak in the XPS spectrum of FNs confirmed the pure magnetite phase in FNs.31,32 For the spectrum of FNMs, peaks at 710.5 eV and 723.5 eV could also be observed, while the peak at 719.0 eV was difficult to be identified. Considering the polymerization reaction of FNMs was under the protection of nitrogen, the FNs in FNMs were convinced not to be oxidized to maghemite, ie, to be magnetite.
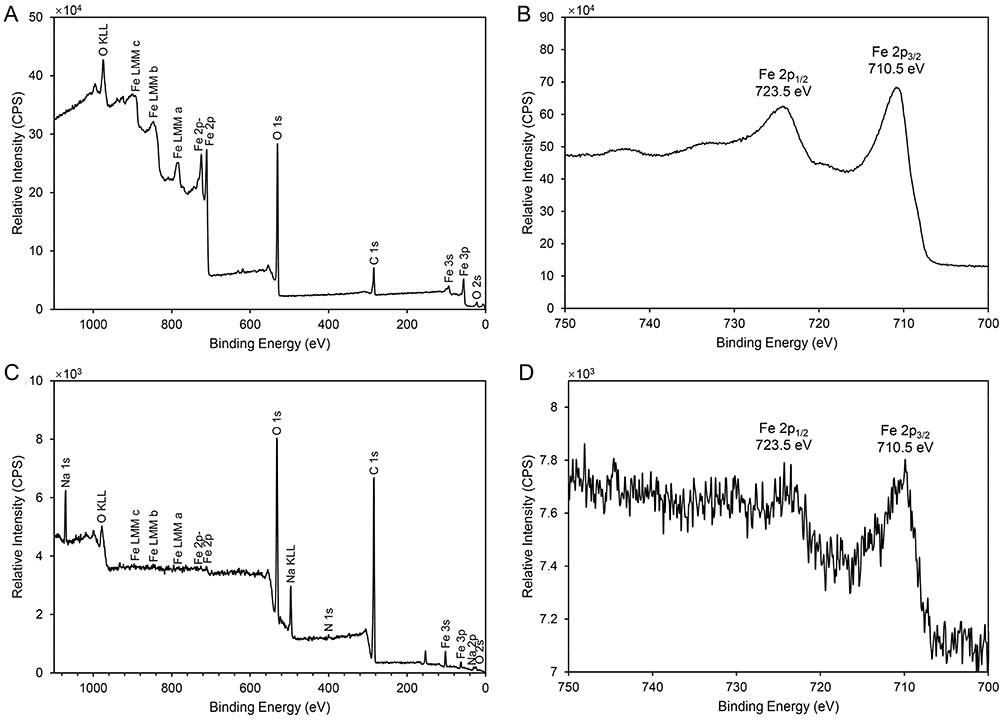 |
Figure 6 The XPS spectra of FNs and FNMs. Notes: XPS survey spectrum (A) and Fe 2p XPS spectrum (B) of FNs; XPS survey spectrum (C) and Fe 2p XPS spectrum (D) of FNMs. Abbreviations: XPS, X-ray photoelectron spectroscopy; FNs, magnetic ferrite nanoclusters; FNMs, magnetic polymer microspheres. |
Iron Content Of FNs And FNMs
The iron content measured in freeze-dried FNs was 62.6 ± 1.8% (w/w). As the FNs were confirmed to be magnetite (according to the results of XPS), the iron content in the FNs was converted to the content of Fe3O4, which was as high as 86.4 ± 2.5% (w/w).
The iron contents of FNMs in whole size and in different subgroups were also measured and converted to the contents of Fe3O4. By comparing the iron contents in FNs with those in FNMs, the quantity of FNs in FNMs could be calculated. All the data are listed in Table 1. The FNs content in FNMs for whole size (100–900 μm) was 1.79 ± 0.04 mg/mL or 3.72 ± 0.08% (w/w), and the content for each subgroup was close to this value, suggesting that the FNs were encapsulated in the FNMs homogenously.
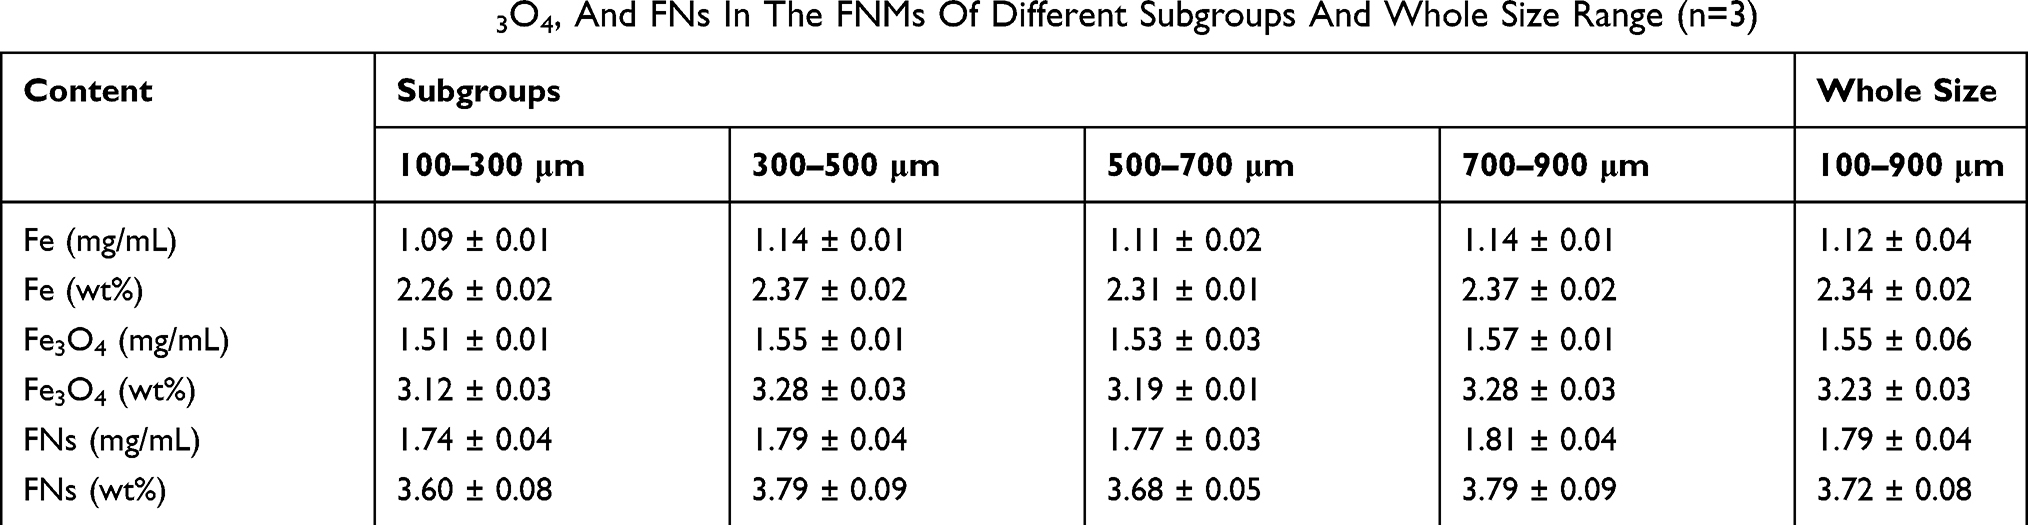 |
Table 1 The Content Of Fe, Fe3O4, And FNs In The FNMs Of Different Subgroups And Whole Size Range (n=3) |
The content of FNs was optimized to an appropriate extent in the preparation of FNMs, as higher content tended to increase the MRI detectability of FNMs but deteriorate the physical and embolic property of FNMs (eg, decrease the elasticity).
Two expressions were used to describe the Fe3O4 content of FNMs. The Fe3O4 content in terms of weight percentage was considered a common way to characterize the chemical property of FNMs. While in clinical application, radiologists prefer measuring embolic microspheres by volume rather than by weight. Besides, it is supposed that microspheres embolized in vivo are stacked in blood vessels and the detectability of microspheres by MRI is associated with the bulk density of magnetic material in microspheres. Therefore, Fe3O4 content in terms of per volume of FNMs could provide more practical and helpful information for MRI detectable embolotherapy.34
Magnetic Properties Of FNs And FNMs
The magnetization curves of FNs and FNMs are shown in Figure 7. The saturated magnetization, coercivity, and residual magnetization of FNs were 71.0 emu/g, 45.0 Oe, and 7.8 emu/g, respectively. Compared with the results in literature, where the saturated magnetizations of magnetic nanoclusters were reported in the range of 21.2 to 80.4 emu/g,45,49 the saturated magnetization of FNs was thought relatively high. The coercivity of FNs was also within the reported range of 0.25 to 47.7 Oe, which was considered acceptable, indicating that the FNs possessed more uniform shape and fewer defects.45,49 Thus, the FNs prepared in this study were proved to be an excellent material for further MRI detectable study.
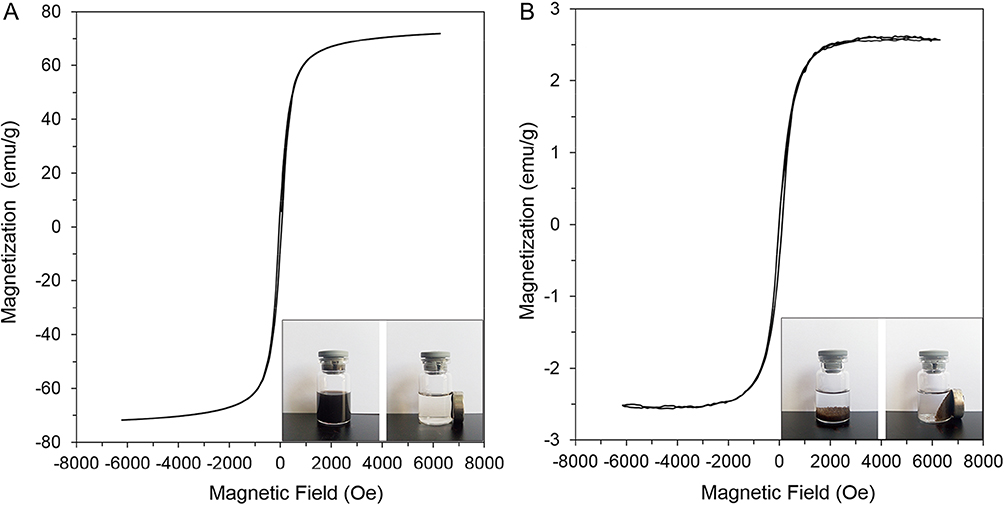 |
Figure 7 The hysteresis loops of FNs (A) and FNMs (B) at room temperature. Notes: The inserts in (A) were photographs of the FNs dispersed in the water and responding to external magnetic field, respectively. The inserts in (B) were photographs of the FNMs dispersed in the water and responding to external magnetic field, respectively. Abbreviations: FNs, magnetic ferrite nanoclusters; FNMs, magnetic polymer microspheres. |
The magnetization curve of FNMs exhibited a similar pattern with that of FNs. The value of saturated magnetization, coercivity, and residual magnetization for FNMs was 2.58 emu/g, 60.0 Oe, and 0.3 emu/g, respectively. To our knowledge, the saturated magnetization has not been reported for magnetic microspheres loaded with iron oxide nanoclusters. While for those loaded with iron oxide nanoparticles, the saturated magnetizations were reported to be 0.67, 1.66, and 5.44 emu/g.34,54,55 Compared with these data, the saturated magnetization of FNMs was at a higher level. Besides, the saturated magnetization of FNMs could be increased by adding more amount of FNs, as it was reported the saturated magnetization of magnetic microspheres is proportional to the concentration of magnetic materials loaded on.19,34
To compare the magnetic property of FNs before and after being loaded on FNMs, the saturated magnetization of FNs in FNMs was calculated according to the content of FNs measured in the “Iron content of FNs and FNMs” section. The value was calculated as 69.4 emu/g (equals to 2.58 emu/g divided by 3.72%), which was very close to that of FNs (71.0 emu/g) before entrapped in FNMs, indicating that the magnetic property of FNs was not influenced by the preparation of FNMs. Similar calculations were also performed to the reported microspheres loaded with magnetic nanoparticles, and the corresponding saturated magnetizations of nanoparticles were obtained to be 9.1 emu/g (equals to 1.66 emu/g divided by 18.25%), 19.7 emu/g (equals to 0.67 emu/g divided by 3.4%), and 60.4 emu/g (equals to 5.44 emu/g divided by 9%).34,54,55 Therefore, the calculated saturated magnetization of FNs in FNMs calculated was at the highest level among them.
The inserts in Figure 7A and B demonstrated, respectively, the state of FNs and FNMs in water with or without magnetic field. Both FNs and FNMs showed fast response to the foreign magnet, which further indicated they possessed excellent magnetic property.14
Elasticity Of FNMs
To illustrate the elasticity of FNMs, BMs were used as a control. By comparing the elasticity of FNMs and BMs, the effect of loading FNs could be easily understood. Embospheres have been utilized in clinical practice for years and their elasticity has been studied in literature.26,56 In this part, the data of Embospheres were quoted from our previous report and compared with those of FNMs.26
Compression test was often used to evaluate the rigidity of microspheres.26,57 The compression curves of FNMs, BMs, and Embospheres are shown in Figure 8A. The curves of FNMs and BMs were very close. The FNMs and BMs exhibited a lower compression resistance than Embospheres. The modulus of FNMs (62.80 ± 5.40 kPa), BMs (77.22 ± 0.44 kPa), and Embospheres (158.27 ± 13.54 kPa) is listed in Table 2. It suggested that FNMs were softer and might occlude blood vessels more distally than BMs and Embospheres (P < 0.01).
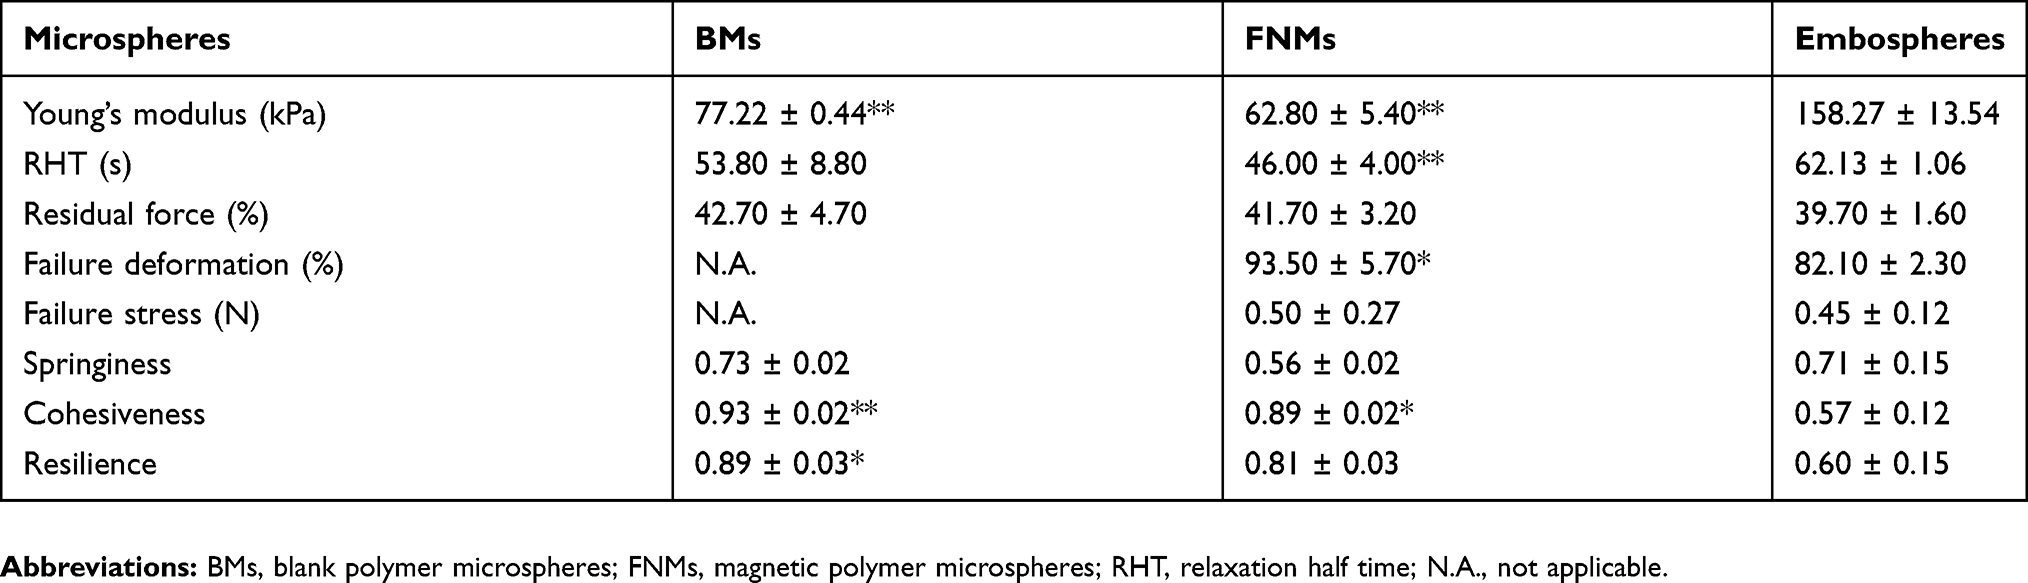 |
Table 2 Young’s Modulus, Relaxation Half Time (RHT), Failure Deformation, Failure Stress, Springiness, Cohesiveness, And Resilience Of BMs And FNMs (n=3) (Compared With Embospheres) |
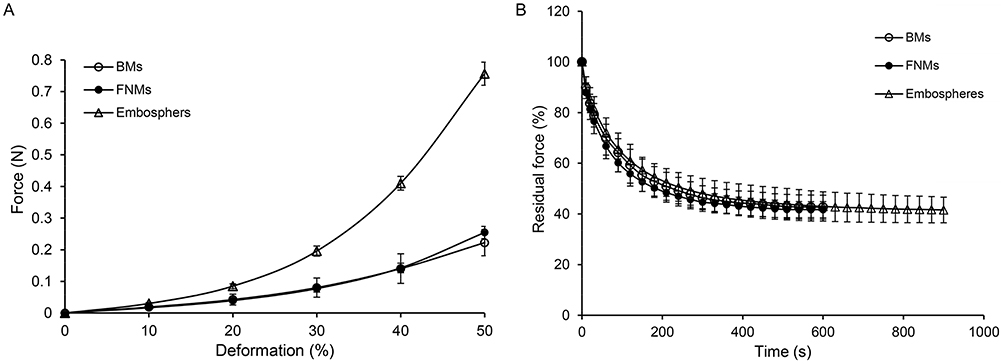 |
Figure 8 Compression curves (A) and stress relaxation curves (B) of different microspheres. Abbreviations: BMs, blank polymer microspheres; FNMs, magnetic polymer microspheres. |
The relaxation test was designed to simulate the process when microspheres were blocked in the blood vessels.26,57 The stress relaxation curves of FNMs, BMs, and Embospheres are shown in Figure 8B. The RHT values of FNMs (46.00 ± 4.00 s) and BMs (53.80 ± 8.80 s) were shorter than that of Embospheres (62.13 ± 1.06 s). All of the three microspheres had similar residual force (P > 0.05) (shown in Table 2).
The test of failure stress and failure deformation was measured to reveal the maximal pressure and deformation for embolic microspheres to stand.26,57 During the test, none of the BMs was compressed broken. For the FNMs and Embospheres, the failure deformation was 93.50 ± 5.70% and 82.10 ± 2.30%, and the failure stresses were 0.50 ± 0.27 N and 0.45 ± 0.12 N, respectively. The results demonstrated the BMs and FNMs could stand greater deformation than Embospheres (P < 0.05), indicating they might take lower risk to be broken than Embospheres during the process of embolization.
To investigate the recovery ability of embolic agents, the repeated compression test was employed.26,57 The data of springiness, cohesiveness, and resilience of BMs, FNMs, and Embospheres are presented in Table 2. Compared with BMs, the springiness and resilience of FNMs decreased, but the cohesiveness was similar. The results showed that the recovery ability of FNMs was not as good as that of BMs, but it was better than that of Embospheres.
In summary, compared with the BMs, the loading of FNs softened the FNMs, but the whole impact on the elasticity of FNMs was very limited.
T2 Relaxivity Of FNs And MRI Imaging Of FNMs In Vitro
The plot of 1/T2 versus iron concentration of FNs in vitro is presented in Figure 9. According to the figure, relaxation rate was found to be linearly related with the iron concentration from 0.035 to 0.17 mM (R2 = 0.998). The r2 value (slope of the line) of FNs was determined to be 402.4 ± 9.1 s−1mM−1, which was considered in upper level compared with those (ranging from approximately 100 s−1mM−1 to 400 s−1mM−1 at a magnetic field strength of 3T) of nanoclusters reported in literatures,58–60 while the commercial nanoparticles of Feridex and Resovist were reported with r2 values of 93 and 143 s−1mM−1 at a magnetic field strength of 3 T, respectively.61 It was clearly demonstrated that FNs achieved a high MRI contrast effect and were well worth using in the MRI detectable microspheres.
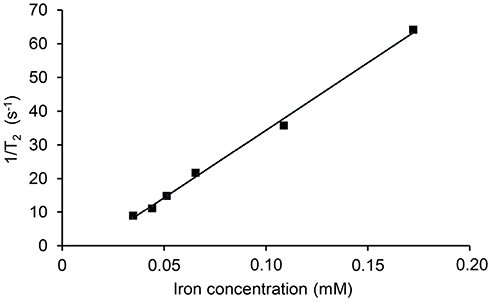 |
Figure 9 T2 relaxivity measurement of FNs. Abbreviation: FNs, magnetic ferrite nanoclusters. |
The FNMs were qualitatively evaluated for their MRI detectability. In this test, microspheres were embedded into agar gel homogeneously to simulate the in vivo embolization condition, as agar gel was reported to resemble the soft tissue of human body.62 As illustrated in Figure 10, all subgroups (100–300 µm, 300–500 µm, 500–700 µm, and 700–900 µm) of FNMs could be detected by MRI and negatively enhanced the T2-weighted MRI images, even at a relatively low concentration of 4%, while BMs in all subgroups could not be detected. In each subgroup of FNMs, the MR signal intensity decreased with the increasing of FNMs concentration; at the same concentration, large size of FNMs was more easily detected than small size ones, which might be due to the overlapped images of large FNMs with high concentrations of FNs.63
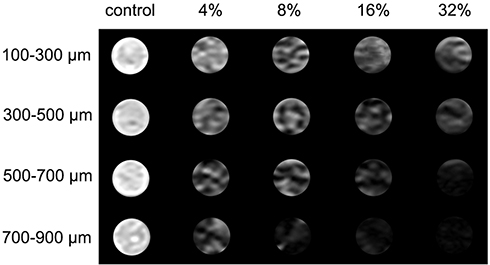 |
Figure 10 T2-weighted MR images of in vitro gel phantom from left to right column: BMs with the concentration of 32% (v/v) (as controls) and FNMs with concentrations of 4%, 8%, 16%, and 32% (v/v). Abbreviations: MR, magnetic resonance; BMs, blank polymer microspheres; FNMs, magnetic polymer microspheres. |
MR Imaging And Histocompatibility Of FNMs In Mice
MR Imaging In Mice
The MR detectability of FNMs was confirmed in mice by subcutaneous injection. The typical T2-weighted MR images of a mouse before and at 0 d, 14 d, and 28 d after subcutaneous injection are shown in Figure 11A. Dark signal areas (pointed out by arrows) could be detected in the subcutaneous tissue where FNMs were injected. The data of △SNR were plotted over time in Figure 11B. The △SNR values were 82.3 ± 5.6%, 79.7 ± 2.8%, and 79.1 ± 8.9% at 0 d, 14 d, and 28 d, respectively, and no significant difference was found among them (p>0.05). The result demonstrated that long-term detectability of FNMs could be achieved in vivo under T2-weighted MR imaging, which lasted at least 28 days.
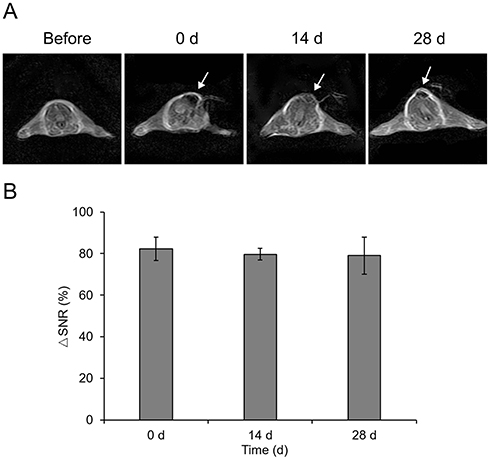 |
Figure 11 The typical T2-weighted MR images of the same mouse before, immediately after, at 14 d and 28 d after subcutaneous injection of FNMs into the back (A) and the quantificational analysis of signal-to-noise changes at the corresponding time points after the injection into three mice (B). Note: The arrows denoted the dark signal area induced by FNMs. Abbreviations: MR, magnetic resonance; FNMs, magnetic polymer microspheres; △SNR, the change of signal-to-noise ratio. |
Histocompatibility Of FNMs
FNMs were considered foreign matters after being injected into the bodies of animals and produced an inflammatory reaction in the organism.64 The inflammatory reaction can be divided into several phases: alteration (injury), exudation, and proliferation. The last two phases are sometimes subdivided into neutrophil, macrophage, and fibroblast phases. The proliferation phase of inflammation is at the same time the first phase of tissue repair.65
Representative histopathological micrographs of the subcutaneous tissues around FNMs are presented in Figure 12. At 2 hrs after subcutaneous injection (Figure 12A), the presence of mild edema, vascular congestion expansion, a few neutrophils, and monocytes could be seen. This tissue reaction was neutrophil phase that occurs during the first few hours of injection,65 indicating the initial inflammatory response was started. At 2 d (Figure 12B), massive infiltration of inflammatory cells could be seen. At 7 d (Figure 12C), the generation of collagen fibers and hyperplasia of small vessels was visible with a number of monocytes. Afterwards, obvious proliferation of collagen fibers around the FNMs was observed with the number of monocyte infiltration decreasing dramatically at 14 d (Figure 12D), confirming that the inflammation had been controlled.64 Till 28 d (Figure 12E), the FNMs were encapsulated by hyperplastic fibrous connective tissue and the inflammatory reaction disappeared. These results showed that the tissue inflammation caused by injection of FNMs was mild and controllable, indicating that FNMs possessed good tissue compatibility.
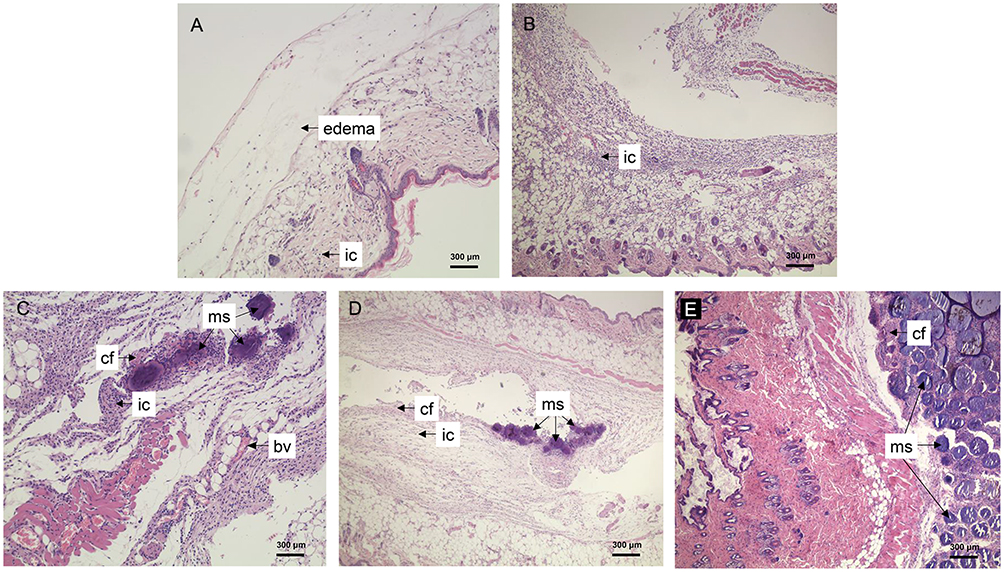 |
Figure 12 Histological features of mice after subcutaneous injection of FNMs at 2 h (A), 2 d (B), 7 d (C), 14 d (D), and 28 d (E). Abbreviations: FNMs, magnetic polymer microspheres; ic, inflammatory cells; cf, collagen fibers; bv, blood vessels; ms, microspheres. |
Renal Embolization And MR Imaging Of FNMs In Rabbits
Renal Embolization
The embolization of renal artery was successfully achieved in each of the experimental animals, proving the feasibility of FNMs as an embolic agent. The difference of angiogram pre- and post-embolization could be explained by the blood flow to kidney. Before embolization (Figure 13A), renal arterial angiogram appeared a good image of trunk and branches of renal arteries, and renal parenchyma was stained. However, most of the artery images in the embolized kidney disappeared and only the arterial trunk could be observed without staining of the renal parenchyma in the angiograms after embolization (Figure 13B) due to the vascular occlusion caused by FNMs.40,66
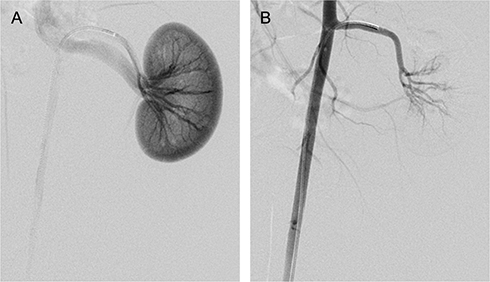 |
Figure 13 Arterial angiogram of a rabbit’s left kidney, before embolization (A) and immediately after embolization (B). Note: The peripheral blood vessels were occluded with FNMs (100–300 μm) after embolization.Abbreviation: FNMs, magnetic polymer microspheres. |
MR Imaging In Rabbits
The MR imaging detectability of small-sized FNMs (100–300 μm) was assessed in rabbits, as they were reported more difficult to be detected than large-sized ones.18,67 The results are shown in Figure 14 and Table 3.
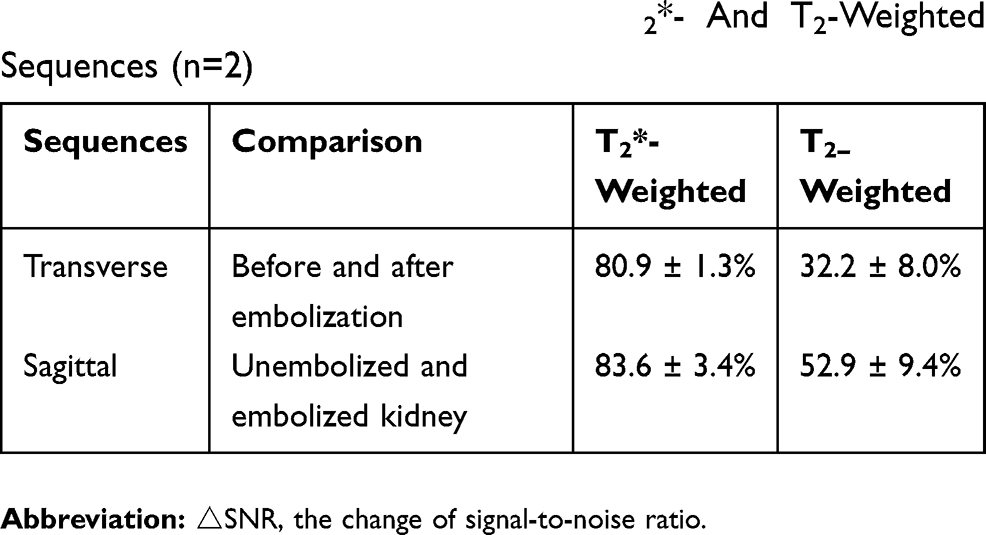 |
Table 3 △SNR Of The Rabbits Embolized With FNMs In Transverse And Sagittal Images With T2*- And T2-Weighted Sequences (n=2) |
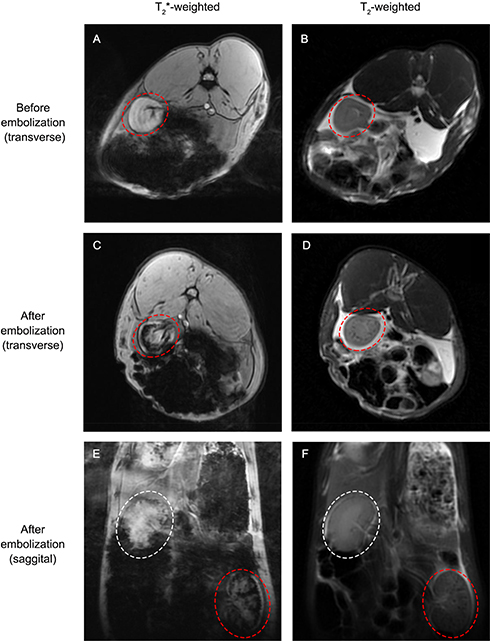 |
Figure 14 MR images of embolized kidney with T2*- and T2-weighted sequences before and after embolization. Notes: The rabbit’s left embolized kidney was denoted by red elliptical rings while the right untreated kidney was denoted by white elliptical rings. Abbreviation: MR, magnetic resonance. |
Two kinds of common sequences in clinic were adopted in this study. Thereinto, T2*-weighted Merge sequence was more sensitive to inhomogeneity-induced dephasing, depiction, and quantification of the existence of iron,68,69 but could not reduce the effect of respiratory motion on images, while T2-weighted Propeller sequence was just the reverse.17 Figure 14A and B are transverse T2*-weighted and T2-weighted MR images of the rabbit’s left kidney before embolization, respectively. Figure 14C and D are images after the rabbit’s embolization accordingly. Compared with the left kidney before embolization in Figure 14A and B, there were dark circular traces appearing on the kidney after embolization (Figure 14C and D), as nanoscale iron oxide could shorten the transverse relaxation of surrounding protons and produce predominant T2 relaxation effects (negative contrast) in T2 images.34 A comparison of the two sequences revealed that FNMs were distinctly visualized on T2*-weighted images and detected only vaguely on T2-weighted images (△SNR was 80.9 ± 1.3% and 32.2 ± 8.0%, respectively), in accordance with other related study where T2*-weighted images were superior to T2 images on magnetic ferrite-enhanced MR imaging.70
Figure 14E and F are sagittal T2*-weighted and T2-weighted MR images (the rabbit’s left and right kidneys were denoted by red and white elliptical rings separately) after embolization, respectively, in which the differences between embolized left kidney and right untreated kidney could be easily distinguished in one image. Comparing the left and right kidneys in Figure 14E and F, there were also some dark traces on the embolized left kidney caused by FNMs, especially in T2*-weighted image (△SNR was 83.6 ± 3.4% and 52.9 ± 9.4%, respectively), which was consistent with the transverse images. Besides, combining the information of both transverse and sagittal images could be useful for stereotactic localization of the FNMs in vivo.17 The positions of FNMs shown in MRI images were largely coincident with what was shown in post-embolization DSA image (Figure 14B), suggesting that FNMs had good potential to be traced under MRI during and after embolization.
Such MR imaging capability of FNMs (even the small-size group) is supposed to bring great benefit to imaging-guided embolization surgery for the treatment of cancer and allow MRI assessments of continued occlusion in target blood vessels after embolotherapy.15,16
Herein, kidney was chosen to be embolized because its blood vessels were more simple than other organs (eg, liver), allowing convenient observation for the flow of contrast agents and evaluation of embolic effect. In addition, animals were expected to survive longer as kidneys were in pair and when one was embolized the other could continue working.17 Nevertheless, more experimental animals and pre-clinical animal models are needed in the future research.
Conclusion
In this study, the magnetic ferrite nanoclusters with a high r2 value (402.4 ± 9.1 s−1mM−1) were synthesized by a facile and quick microwave-assisted solvothermal reduction method. MRI detectable FNMs were successfully prepared by loading the resultant FNs into poly (acrylic acid) microspheres with inverse suspension polymerization method. The resultant FNMs well meet the requirements for embolization with excellent roundness, smooth surface, particle size range, good compressibility as well as biocompatibility. The in vitro and in vivo MRI studies both showed that FNMs could provide negative contrast enhancement in T2/T2*-weighted MR imaging and be sensitively detected by MRI. On the basis of these results, FNMs could serve as a potential MRI detectable embolic agent for TAE in evaluating the spatial distribution of embolic microspheres inside the target tissues during and after embolization, which might ultimately improve the efficacy and safety of embolotherapy.
Acknowledgment
This study was supported by the National Natural Science Foundation of China (Grant No. 81571779).
Disclosure
The authors report no conflicts of interest in this work.
References
1. Yamakado K, Nakatsuka A, Kobayashi S, et al. Radiofrequency ablation combined with renal arterial embolization for the treatment of unresectable renal cell carcinoma larger than 3.5 cm: initial experience. Cardiovasc Intervent Radiol. 2006;29(3):389–394. doi:10.1007/s00270-004-0090-9
2. Goodwin SC, Wong GCH. Uterine artery embolization for uterine fibroids: a radiologist’s perspective. Clin Obstet Gynecol. 2001;44(2):412–424. doi:10.1097/00003081-200106000-00026
3. Khan SU, Rahman KM, Siddiqui MR, et al. Endovascular embolization of life threatening intracranial arterio-venous malformation. Mymensingh Med J. 2010;19(3):438–441.
4. Murakami R, Ichikawa T, Kumazaki T, Kobayashi Y, Ogura J, Kurokawa A. Transcatheter arterial embolization for postpartum massive hemorrhage: a case report. Clin Imaging. 2000;24(6):368–370.
5. Sharma KV, Bascal Z, Kilpatrick H, et al. Long-term biocompatibility, imaging appearance and tissue effects associated with delivery of a novel radiopaque embolization bead for image-guided therapy. Biomaterials. 2016;103:293–304. doi:10.1016/j.biomaterials.2016.06.064
6. Teichgräber UK-M, Streitparth F, Güttler FV. High-field open MRI-guided interventions. In: Kahn T, Busse H, editors. Interventional Magnetic Resonance Imaging. Berlin, Heidelberg: Springer Berlin Heidelberg; 2012:145–157.
7. Krombach GA. MRI guidance of vascular applications. In: Kahn T, Busse H, editors. Interventional Magnetic Resonance Imaging. Berlin, Heidelberg: Springer Berlin Heidelberg; 2012:175–188.
8. Cilliers R, Song Y, Kohlmeir EK, Larson AC, Omary RA, Meade TJ. Modification of embolic-PVA particles with MR contrast agents. Magn Reson Med. 2008;59(4):898–902. doi:10.1002/mrm.21518
9. Wilson MW, Fidelman N, Weber OM, et al. Experimental renal artery embolization in a combined MR imaging/angiographic unit. J Vasc Interventional Radiol. 2003;14(9, Part 1):1169–1175. doi:10.1097/01.rvi.0000086539.44800.c5
10. Vogl TJ, Balzer JO, Mack MG, Bett G, Oppelt A. Hybrid MR interventional imaging system: combined MR and angiography suites with single interactive table. Feasibility study in vascular liver tumor procedures. Eur Radiol. 2002;12(6):1394–1400. doi:10.1007/s00330-002-1312-7
11. Vin AP, Rhee TK, Ryu RK, et al. Use of a combined MR imaging and interventional radiology suite for intraprocedural monitoring of uterine artery embolization. J Vasc Interventional Radiol. 2007;18(11):1362–1367. doi:10.1016/j.jvir.2007.07.019
12. Lillaney PV, Yang JK, Losey AD, et al. Endovascular MR-guided renal embolization by using a magnetically assisted remote-controlled catheter system. Radiology. 2016;281(1):219–228. doi:10.1148/radiol.2016152036
13. Kang MJ, Oh IY, Choi BC, et al. Development of superparamagnetic iron oxide nanoparticles (SPIOs) embedded chitosan microspheres for magnetic resonance (MR) traceable embolotherapy. Biomol Ther (Seoul). 2009;17(1):98–103. doi:10.4062/biomolther.2009.17.1.98
14. Wang Q, Liu S, Yang F, Gan L, Yang X, Yang Y. Magnetic alginate microspheres detected by MRI fabricated using microfluidic technique and release behavior of encapsulated dual drugs. Int J Nanomedicine. 2017;12:4335–4347. doi:10.2147/IJN.S131249
15. Kim D-H, Li W, Chen J, et al. Multimodal imaging of nanocomposite microspheres for transcatheter intra-arterial drug delivery to liver tumors. Sci Rep. 2016;6:29653. doi:10.1038/srep29653
16. Laurent A. Microspheres and nonspherical particles for embolization. Tech Vasc Interv Radiol. 2007;10(4):248–256. doi:10.1053/j.tvir.2008.03.010
17. Li Z-Y, Qin X-Y, Guo L-Y, et al. Poly(acrylic acid) microspheres loaded with superparamagnetic iron oxide nanoparticles for transcatheter arterial embolization and MRI detectability: in vitro and in vivo evaluation. Int J Pharm. 2017;527(1–2):31–41. doi:10.1016/j.ijpharm.2017.04.069
18. Choi SY, Kwak BK, Shim HJ, Lee J, Hong SU, Kim KA. MRI traceability of superparamagnetic iron oxide nanoparticle-embedded chitosan microspheres as an embolic material in rabbit uterus. Diagn Interventional Radiol. 2015;21(1):47–53. doi:10.5152/dir.2014.14015
19. Masoud F, Soodeh S. Magnetic nanoparticles-loaded PLA/PEG microspheres as drug carriers. J Biomed Mater Res Part A. 2015;103(5):1893–1898. doi:10.1002/jbm.a.35317
20. Chen J, Sheu AY, Li W, et al. Poly(lactide-co-glycolide) microspheres for MRI-monitored transcatheter delivery of sorafenib to liver tumors. J Controlled Release. 2014;184:10–17. doi:10.1016/j.jconrel.2014.04.008
21. Chen J, White SB, Harris KR, et al. Poly(lactide-co-glycolide) microspheres for MRI-monitored delivery of sorafenib in a rabbit VX2 model. Biomaterials. 2015;61:299–306.
22. Xie X, Zhang C. Controllable assembly of hydrophobic superparamagnetic iron oxide nanoparticle with mPEG-PLA copolymer and its effect on MR transverse relaxation rate. J Nanomater. 2011;2011:7. doi:10.1155/2011/152524
23. Pöselt E, Kloust H, Tromsdorf U, et al. Relaxivity optimization of a PEGylated iron-oxide-based negative magnetic resonance contrast agent for T2-weighted spin–echo imaging. ACS Nano. 2012;6(2):1619–1624. doi:10.1021/nn204591r
24. Jia J, Yu JC, Zhu X-M, Chan KM, Wang Y-XJ. Ultra-fast method to synthesize mesoporous magnetite nanoclusters as highly sensitive magnetic resonance probe. J Colloid Interface Sci. 2012;379(1):1–7. doi:10.1016/j.jcis.2012.04.035
25. Jordan O, Denys A, De Baere T, Boulens N, Doelker E. Comparative study of chemoembolization loadable beads: in vitro drug release and physical properties of DC bead and hepasphere loaded with doxorubicin and irinotecan. J Vasc Interventional Radiol. 2010;21(7):1084–1090. doi:10.1016/j.jvir.2010.02.042
26. Cui D-C, Lu W-L, Sa E-A, Gu M-J, Lu X-J, Fan T-Y. Poly(acrylic acid) microspheres loaded with lidocaine: preparation and characterization for arterial embolization. Int J Pharm. 2012;436(1):527–535. doi:10.1016/j.ijpharm.2012.07.020
27. Osuga K, Maeda N, Higashihara H, et al. Current status of embolic agents for liver tumor embolization. Int J Clin Oncol. 2012;17(4):306–315. doi:10.1007/s10147-012-0445-1
28. Zhang H, Zhong X, Xu -J-J, Chen H-Y. Fe3O4/polypyrrole/Au nanocomposites with core/shell/shell structure: synthesis, characterization, and their electrochemical properties. Langmuir. 2008;24(23):13748–13752. doi:10.1021/la8028935
29. Pothayee N, Balasubramaniam S, Pothayee N, et al. Magnetic nanoclusters with hydrophilic spacing for dual drug delivery and sensitive magnetic resonance imaging. J Mater Chem B Mater Biol Med. 2013;1(8):1142–1149. doi:10.1039/c2tb00275b
30. Xuan S, Wang Y-XJ, Yu JC, Cham-Fai Leung K. Tuning the grain size and particle size of superparamagnetic Fe3O4 microparticles. Chem Mater. 2009;21(21):5079–5087. doi:10.1021/cm901618m
31. Jiang H, Han X, Li Z, et al. Superparamagnetic core–shell structured microspheres carrying carboxyl groups as adsorbents for purification of genomic DNA. Colloids Surf A. 2012;401:74–80. doi:10.1016/j.colsurfa.2012.03.024
32. Yang J, Zou P, Yang L, et al. A comprehensive study on the synthesis and paramagnetic properties of PEG-coated Fe3O4 nanoparticles. Appl Surf Sci. 2014;303:425–432. doi:10.1016/j.apsusc.2014.03.018
33. Talelli M, Rijcken CJF, Lammers T, et al. Superparamagnetic iron oxide nanoparticles encapsulated in biodegradable thermosensitive polymeric micelles: toward a targeted nanomedicine suitable for image-guided drug delivery. Langmuir. 2009;25(4):2060–2067. doi:10.1021/la8036499
34. Wang H, Qin X-Y, Li Z-Y, et al. Preparation and evaluation of MRI detectable poly (acrylic acid) microspheres loaded with superparamagnetic iron oxide nanoparticles for transcatheter arterial embolization. Int J Pharm. 2016;511(2):831–839. doi:10.1016/j.ijpharm.2016.07.028
35. Xuan S, Wang F, Lai JMY, et al. Synthesis of biocompatible, mesoporous Fe3O4 nano/microspheres with large surface area for magnetic resonance imaging and therapeutic applications. ACS Appl Mater Interfaces. 2011;3(2):237–244. doi:10.1021/am1012358
36. Hosch S, Zibulski P. The influence of inconsistent wet-sieving procedures on the macroremain concentration in waterlogged sediments. J Archaeol Sci. 2003;30(7):849–857. doi:10.1016/S0305-4403(02)00263-7
37. Meng W-J, Lu X-J, Wang H, et al. Preparation and evaluation of biocompatible long-term radiopaque microspheres based on polyvinyl alcohol and lipiodol for embolization. J Biomater Appl. 2015;30(2):133–146. doi:10.1177/0885328215575622
38. Zhang Q, Wang C, Qiao L, Yan H, Liu K. Superparamagnetic iron oxide nanoparticles coated with a folate-conjugated polymer. J Mater Chem. 2009;19(44):8393–8402. doi:10.1039/b910439a
39. Huang G, Li H, Chen J, et al. Tunable T1 and T2 contrast abilities of manganese-engineered iron oxide nanoparticles through size control. Nanoscale. 2014;6(17):10404–10412. doi:10.1039/c4nr02680b
40. Lu X-J, Zhang Y, Cui D-C, et al. Research of novel biocompatible radiopaque microcapsules for arterial embolization. Int J Pharm. 2013;452(1):211–219. doi:10.1016/j.ijpharm.2013.05.001
41. Palanisamy K, Kim Y, Kim H, Kim JM, Yoon W-S. Self-assembled porous MoO2/graphene microspheres towards high performance anodes for lithium ion batteries. J Power Sources. 2015;275:351–361. doi:10.1016/j.jpowsour.2014.11.001
42. Zhou L, Deng H, Wan J, Shi J, Su T. A solvothermal method to produce RGO-Fe3O4 hybrid composite for fast chromium removal from aqueous solution. Appl Surf Sci. 2013;283:1024–1031. doi:10.1016/j.apsusc.2013.07.063
43. Jing X, Liu T, Wang D, Liu J, Meng L. Controlled synthesis of water-dispersible and superparamagnetic Fe3O4 nanomaterials by a microwave-assisted solvothermal method: from nanocrystals to nanoclusters. Crystengcomm. 2017;19(34):5089–5099. doi:10.1039/C7CE01191A
44. Hu H, Sun J, Huang G, et al. Preparation of amino-functionalized magnetite nanoclusters by ring-opening polymerization and application for targeted magnetic resonance imaging. J Mater Sci. 2013;48(21):7686–7695. doi:10.1007/s10853-013-7588-y
45. Jianping G, Yongxing H, Maurizio B, Yadong Y. Superparamagnetic magnetite colloidal nanocrystal clusters. Angewandte Chemie Int Ed. 2007;119(23):4420–4423.
46. Gao J, Ran X, Shi C, Cheng H, Cheng T, Su Y. One-step solvothermal synthesis of highly water-soluble, negatively charged superparamagnetic Fe3O4 colloidal nanocrystal clusters. Nanoscale. 2013;5(15):7026–7033. doi:10.1039/c3nr00931a
47. Roca AG, Veintemillas-Verdaguer S, Port M, Robic C, Serna CJ, Morales MP. Effect of nanoparticle and aggregate size on the relaxometric properties of MR contrast agents based on high quality magnetite nanoparticles. J Phys Chem B. 2009;113(19):7033–7039. doi:10.1021/jp807820s
48. Răcuciu M, Creangă DE, Airinei A. Citric-acid-coated magnetite nanoparticles for biological applications. Eur Phys J E. 2006;21(2):117–121. doi:10.1140/epje/i2006-10051-y
49. Sung Lee J, Myung Cha J, Young Yoon H, Lee J-K, Keun Kim Y. Magnetic multi-granule nanoclusters: a model system that exhibits universal size effect of magnetic coercivity. Sci Rep. 2015;5:12135. doi:10.1038/srep12135
50. Yoon KY, Kotsmar C, Ingram DR, et al. Stabilization of superparamagnetic iron oxide nanoclusters in concentrated brine with cross-linked polymer shells. Langmuir. 2011;27(17):10962–10969. doi:10.1021/la2006327
51. Kostopoulou A, Brintakis K, Vasilakaki M, et al. Assembly-mediated interplay of dipolar interactions and surface spin disorder in colloidal maghemite nanoclusters. Nanoscale. 2014;6(7):3764–3776. doi:10.1039/c3nr06103e
52. Hong RY, Pan TT, Li HZ. Microwave synthesis of magnetic Fe3O4 nanoparticles used as a precursor of nanocomposites and ferrofluids. J Magn Magn Mater. 2006;303(1):60–68. doi:10.1016/j.jmmm.2005.10.230
53. Nandwana V, Ryoo S-R, Kanthala S, et al. Engineered theranostic magnetic nanostructures: role of composition and surface coating on magnetic resonance imaging contrast and thermal activation. ACS Appl Mater Interfaces. 2016;8(11):6953–6961. doi:10.1021/acsami.6b01377
54. Hagit A, Soenke B, Johannes B, Shlomo M. Synthesis and characterization of dual modality (CT/MRI) core−shell microparticles for embolization purposes. Biomacromolecules. 2010;11(6):1600–1607. doi:10.1021/bm100251s
55. Xue P, Gu Y, Su W, Shuai H, Wang J. In situ one-pot preparation of superparamagnetic hydrophilic porous microspheres for covalently immobilizing penicillin G acylase to synthesize amoxicillin. Appl Surf Sci. 2016;362:427–433. doi:10.1016/j.apsusc.2015.11.209
56. Hidaka K, Moine L, Collin G, et al. Elasticity and viscoelasticity of embolization microspheres. J Mech Behav Biomed Mater. 2011;4(8):2161–2167. doi:10.1016/j.jmbbm.2011.08.001
57. Hidaka K, Nakamura M, Osuga K, Miyazaki H, Wada S. Elastic characteristics of microspherical embolic agents used for vascular interventional radiology. J Mech Behav Biomed Mater. 2010;3(7):497–503. doi:10.1016/j.jmbbm.2010.05.004
58. Paquet C, de Haan HW, Leek DM, et al. Clusters of superparamagnetic iron oxide nanoparticles encapsulated in a hydrogel: a particle architecture generating a synergistic enhancement of the T2 relaxation. ACS Nano. 2011;5(4):3104–3112. doi:10.1021/nn2002272
59. Park J, Park S, Kim S, et al. HER2-specific aptide conjugated magneto-nanoclusters for potential breast cancer imaging and therapy. J Mater Chem B. 2013;1(36):4576–4583. doi:10.1039/c3tb20613k
60. Choo ESG, Tang X, Sheng Y, Shuter B, Xue J. Controlled loading of superparamagnetic nanoparticles in fluorescent nanogels as effective T2-weighted MRI contrast agents. J Mater Chem. 2011;21(7):2310–2319. doi:10.1039/C0JM03232H
61. Rohrer M, Bauer H, Mintorovitch J, Requardt M, Weinmann H-J. Comparison of magnetic properties of MRI contrast media solutions at different magnetic field strengths. Invest Radiol. 2005;40(11):715–724. doi:10.1097/01.rli.0000184756.66360.d3
62. Hellerbach A, Schuster V, Jansen A, Sommer J. MRI phantoms - are there alternatives to agar? PLoS One. 2013;8:8. doi:10.1371/journal.pone.0070343
63. Chung E-Y, Kim H-M, Lee G-H, et al. Design of deformable chitosan microspheres loaded with superparamagnetic iron oxide nanoparticles for embolotherapy detectable by magnetic resonance imaging. Carbohydr Polym. 2012;90(4):1725–1731. doi:10.1016/j.carbpol.2012.07.058
64. Luo S, Song S, Zheng C, et al. Biocompatibility of bletilla striata microspheres as a novel embolic agent. Evidence-Based Complementary Altern Med. 2015. doi:10.1155/2015/840896
65. Shishatskaya EI, Voinova ON, Goreva AV, Mogilnaya OA, Volova TG. Biocompatibility of polyhydroxybutyrate microspheres: in vitro and in vivo evaluation. J Mater Sci Mater Med. 2008;19(6):2493–2502. doi:10.1007/s10856-007-3345-6
66. Lee HS, Hee Kim E, Shao H, Kook Kwak B. Synthesis of SPIO-chitosan microspheres for MRI-detectable embolotherapy. J Magn Magn Mater. 2005;293(1):102–105. doi:10.1016/j.jmmm.2005.01.049
67. Namur J, Chapot R, Pelage J-P, et al. MR imaging detection of superparamagnetic iron oxide–loaded tris-acryl embolization microspheres. J Vasc Interventional Radiol. 2007;18(10):1287–1295. doi:10.1016/j.jvir.2007.07.015
68. Jian-Ying L, Jing D, Dong L, et al. T2* MRI of minimal hepatic encephalopathy and cognitive correlates in vivo. J Magn Reson Imaging. 2013;37(1):179–186. doi:10.1002/jmri.23811
69. Alústiza JM, Artetxe J, Castiella A, et al. MR quantification of hepatic iron concentration. Radiology. 2004;230(2):479–484. doi:10.1148/radiol.2302020820
70. Kim SH, Choi D, Lim JH, et al. Optimal pulse sequence for ferumoxides-enhanced MR imaging used in the detection of hepatocellular carcinoma: a comparative study using seven pulse sequences. Korean J Radiol. 2002;3(2):87–97. doi:10.3348/kjr.2002.3.2.87
 © 2019 The Author(s). This work is published and licensed by Dove Medical Press Limited. The full terms of this license are available at https://www.dovepress.com/terms.php and incorporate the Creative Commons Attribution - Non Commercial (unported, v3.0) License.
By accessing the work you hereby accept the Terms. Non-commercial uses of the work are permitted without any further permission from Dove Medical Press Limited, provided the work is properly attributed. For permission for commercial use of this work, please see paragraphs 4.2 and 5 of our Terms.
© 2019 The Author(s). This work is published and licensed by Dove Medical Press Limited. The full terms of this license are available at https://www.dovepress.com/terms.php and incorporate the Creative Commons Attribution - Non Commercial (unported, v3.0) License.
By accessing the work you hereby accept the Terms. Non-commercial uses of the work are permitted without any further permission from Dove Medical Press Limited, provided the work is properly attributed. For permission for commercial use of this work, please see paragraphs 4.2 and 5 of our Terms.