")
Back to Archived Journals » Energy and Emission Control Technologies » Volume 3
Methane emissions and climatic warming risk from hydraulic fracturing and shale gas development: implications for policy
Authors Howarth R
Received 1 July 2015
Accepted for publication 20 August 2015
Published 8 October 2015 Volume 2015:3 Pages 45—54
DOI https://doi.org/10.2147/EECT.S61539
Checked for plagiarism Yes
Review by Single anonymous peer review
Peer reviewer comments 3
Editor who approved publication: Dr Adolfo Perujo
Video abstract presented by Howarth.
Views: 1138
Robert W Howarth
Department of Ecology and Environmental Biology, Cornell University, Ithaca, NY, USA
Abstract: Over the past decade, shale gas production has increased from negligible to providing >40% of national gas and 14% of all fossil fuel energy in the USA in 2013. This shale gas is often promoted as a bridge fuel that allows society to continue to use fossil fuels while reducing carbon emissions since less carbon dioxide is emitted from natural gas (including shale gas) than from coal and oil per unit of heat energy. Indeed, carbon dioxide emissions from fossil fuel use in the USA declined to some extent between 2009 and 2013, mostly due to economic recession but in part due to replacement of coal by natural gas. However, significant quantities of methane are emitted into the atmosphere from shale gas development: an estimated 12% of total production considered over the full life cycle from well to delivery to consumers, based on recent satellite data. Methane is an incredibly powerful greenhouse gas that is >100-fold greater in absorbing heat than carbon dioxide, while both gases are in the atmosphere and 86-fold greater when averaged over a 20-year period following emission. When methane emissions are included, the greenhouse gas footprint of shale gas is significantly larger than that of conventional natural gas, coal, and oil. Because of the increase in shale gas development over recent years, the total greenhouse gas emissions from fossil fuel use in the USA rose between 2009 and 2013, despite the decrease in carbon dioxide emissions. Given the projections for continued expansion of shale gas production, this trend of increasing greenhouse gas emissions from fossil fuels is predicted to continue through 2040.
Keywords: shale gas, natural gas, methane, greenhouse gases, global warming, bridge fuel
Introduction
Shale gas is natural gas tightly held in shale formations, and as for conventional natural gas, shale gas is composed largely of methane. The difference between shale gas and conventional natural gas is the mode of extraction. Shale gas cannot be obtained commercially using conventional techniques and has entered the market only recently as industry has used two relatively new technologies to extract it: high-precision horizontal drilling with high-volume hydraulic fracturing. Over the past decade, shale gas development in the USA has increased rapidly, a trend that both the Energy Information Agency (EIA) of the US Department of Energy and the industry expect to continue1–3 (Figure 1). To date, almost all shale gas production in the world has occurred in the USA, a condition likely to continue for at least another decade.2 The EIA projections for future growth in shale gas development may well be too rosy because both the expense of developing shale gas and the pattern of production from a shale gas well have proven to differ dramatically from that seen in conventional gas wells, with very rapid declines over the first year or two.4 An independent assessment concludes that shale gas production in the USA is likely to underperform the EIA estimates by almost 40% between now and 2040.5 However, all these estimates are highly uncertain. If the EIA projections prove true, what might some of the environmental and public health consequences be?
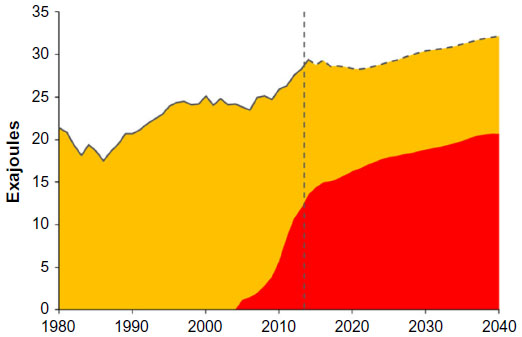 | Figure 1 Natural gas production in the USA from 1980 to 2013 and future natural gas production until 2040 as predicted by the US Department of Energy in the Annual Energy Outlook 2015.1 Conventional gas is indicated in yellow, shale gas in red. |
Since shale gas development is a recent phenomenon, scientific investigations on its environmental and public health consequences are also quite new, with the first peer-reviewed studies published only in 2011.6,7 Nonetheless, the literature has quickly grown, and evidence is accumulating of many adverse effects, including surface and groundwater contamination,8 degraded air quality,9,10 increased release of greenhouse gases,11,12 increased frequency of earthquakes,13 and evidence of harm to the health of humans and domestic animals, including farm livestock.7,14–18
The natural gas industry often points out that hydraulic fracturing has been in use for >60 years, implying that there is little new about shale gas development.19 The scale of hydraulic fracturing used to develop shale gas, however, is far greater than the fracturing employed in previous decades for conventional gas, with two orders of magnitude increase in the volume of water and chemicals used from the hydraulic fracturing and even proportionally greater return of fracturing wastes to the surface.6 Further, the use of high-volume hydraulic fracturing with high-precision directional drilling to develop shale gas leads to an intensity of development not generally seen with conventional natural gas and to the redevelopment of regions where conventional gas has largely played out, which may intensify some effects such as air emissions due to interactions with old wells and formations.20 The appropriate focus when considering the environmental and public health effects of shale gas development is on the entire enterprise and use of the gas and not merely on the process of hydraulic fracturing.
This paper focuses on the role of methane emissions in determining the greenhouse gas footprint of shale gas. Natural gas, including shale gas, is often promoted as a bridge fuel that will allow society to continue to use fossil fuels over the coming decades while reducing carbon emissions. This was highlighted, for example, by President Obama in his State of the Union speech in January 2014.21 For a given unit of energy consumed, the emissions of carbon dioxide from natural gas are substantially lower than from oil or coal,11,22 which is the basis for the bridge fuel concept. However, natural gas is composed mostly of methane, a greenhouse gas that on a mass-to-mass basis is >100 times more powerful than carbon dioxide as an agent of global warming for the time when both gases persist in the atmosphere.23 Consequently, even small releases of methane to the atmosphere from the development and use of shale gas can greatly influence the greenhouse gas footprint of shale gas.
How much methane is emitted?
My coauthors and I published the first peer-reviewed assessment of methane emissions from shale gas development in 2011.11 We concluded that 3.8% (±2.2%) of the total lifetime production of methane from a conventional gas well is emitted into the atmosphere, considering the full life cycle from well to final consumer.11 The data available for estimating emissions from shale gas were more scarce and more poorly documented at that time, but we estimated that the full life cycle emissions of shale gas were ~1.5-fold higher than that of conventional natural gas, or 5.8% (±2.2%).11 We attributed the higher emissions to venting of gas during the flowback period following high-volume hydraulic fracturing, although a subsequent study identified other sources as well, such as drilling through strata previously developed for coal and conventional natural gas.20 For both conventional gas and shale gas, we estimated the “downstream” emissions associated with storing gas and delivering it to market to be 2.5% (±1.1%), so our estimates for “upstream” emissions at the well site and from gas processing averaged 1.3% for conventional natural gas and 3.3% for shale gas.11,12
Through 2010, the US Environmental Protection Agency (EPA) continued to estimate emissions for conventional natural gas as 1.1%, with 0.9% of this from downstream emissions and 0.2% from upstream emissions, based on a joint EPA and industry study from 1996, as I discuss elsewhere.12 They did not separately consider shale gas emissions. Soon after our paper was published in 2011, the EPA released new estimates that were very similar to ours in terms of upstream emissions: 1.6% for conventional natural gas and 3.0% for shale gas.12 They kept their downstream emission estimates at 0.9%, yielding full life cycle emissions of 2.5% and 3.9%, respectively, for conventional gas and shale gas. EPA subsequently reduced their estimates for upstream emissions, cutting them approximately in half, relying on a non-peer-reviewed industry report24 asserting that the 2011 estimates had been too high.12,25 This yielded a full life cycle emission estimate for all natural gas in the USA, considering the contributions from both conventional and shale gas as of 2009, of 1.8%.12 The inspector general of the EPA has called for improvements in the agency’s approach in estimating emissions,26 at least in part because of the 2013 decision to lower emission estimates.12,25
In our original 2011 paper, we called for new and better studies of methane emissions from the natural gas industry,11 and in fact, many studies have been published in the subsequent 4 years. In 2014, I published a review of the new studies that had come out through February 2014.12 One of these studies evaluated a large set of data from monitoring stations across the USA for the period 2007–2008, before the large increase in shale gas production, and concluded that the EPA estimate of 1.8% emission was clearly too low by a factor of at least 2 and that full life cycle emissions from conventional natural gas must be ≥3.6% on average across the USA.27 Other, shorter term studies evaluated upstream emissions from shale gas and other unconventional gas development (ie, tight sands), with two finding high emissions (4%–9%)25,28 and one published by Allen et al finding low emissions (0.4%).29 In a summary published in early 2014, Brandt et al concluded that emissions from the natural gas industry, including both conventional gas and shale gas, could best be characterized as averaging 5.4% (±1.8%) for the full life cycle from well to consumer.30 I accepted that conclusion and presented it as the best value in my 2014 review.12
Further thought and subsequent studies published since February 2014 have led me to reconsider. I now believe that emissions from conventional natural gas are somewhat <5.4%, based on the 14C content of atmospheric methane globally, and emissions from shale gas are likely substantially more, based on global trends observed from satellite data and new evidence that the 2013 report by Allen et al of only 0.4% emissions29 is likely to be flawed.
14C content of methane and emissions from conventional natural gas
The 14C radiocarbon content of methane in the planet’s atmosphere provides a constraint on the emission rate from conventional natural gas systems. On average during the years 2000–2005, 30% of atmospheric methane was 14C “dead”, indicating that it came from fossil sources.31,32 During this time period, the total global flux of methane to the atmosphere was probably in the range of 548 (±22) Tg CH4 per year.33 Therefore, the flux from fossil sources, 30% of the total flux, would have been ~165 Tg CH4 per year. These fossil sources include fluxes associated with coal, oil, and natural gas development as well as natural seeps. Using global production data for coal and oil34 and well-accepted methane emission factors for these two fuels as described elsewhere,11 I estimate the combined methane emissions from oil and coal as ~50 Tg CH4 per year. Using the 5.4% emission rate and global natural gas production estimates34 for the years 2000–2005 yields a methane emission of 130 Tg CH4 per year from the natural gas industry or 180 Tg CH4 per year from all fossil fuels. This is too high compared to the 14C constraint, suggesting that an emission rate of 5.4% for conventional gas is too high, even if natural seeps are negligible, as assumed by the Intergovernmental Panel on Climate Change (IPCC) in 2007 in their fourth assessment report.35 Flux estimates from natural seeps are poorly constrained, but these natural emissions may be as great as 50 Tg CH4 per year or higher.31 If we instead use the mean emission factor from our 2011 paper for conventional natural gas of 3.8%,11 the global flux from natural gas emissions is estimated as 91 Tg CH4 per year, giving an emission flux from all fossil fuels of ~140 Tg CH4 per year and an estimate of emissions from natural seeps of 15 Tg CH4 per year. This combination is plausible, if uncertain, and the 3.8% factor agrees well with the robust conclusion from Miller et al that emissions from conventional natural gas systems in the USA, from before the shale gas boom, must have been at least 3.6% of production.27
How high are methane emissions from shale gas?
A paper published by Schneising et al in the fall of 2014 used satellite data to assess global and regional trends in atmospheric methane between 2003 and 2012.36 Methane concentrations rose dramatically in the northern hemisphere, particularly after 2008. In a detailed comparison across the USA for the time periods 2006–2008 (before there was much shale gas or shale oil development) and 2009–2011 (after shale gas and oil production began in earnest), atmospheric methane concentrations rose dramatically in many of the major shale-producing regions. By evaluating trends in drilling and hydraulic fracturing activity, Schneising et al estimated methane emission rates of 9.5% (±7%) in terms of energy content during the 2009–2011 period for the two large shale regions – the Eagle Ford in Texas and the Bakken in North Dakota – where they felt most comfortable in estimating emissions.36 They reported similar methane emissions for the Marcellus shale, but with much greater uncertainty in the analysis of the satellite data because of sparser spacing of wells, the mountainous terrain, and the proximity of the region to the Great Lakes. For the Bakken, shale oil production was far greater than gas production during this time period,37 and the methane emissions may have been more associated with the oil production. However, natural gas was the dominant form of shale energy produced in the Eagle Ford formation between 2009 and 2011, contributing 75% of all shale energy with oil contributing 25%.37 For the Marcellus shale, virtually all shale energy production through 2011 came from shale gas and not oil.37 Therefore, it seems reasonable to attribute a methane emission rate of ~9.5% to shale gas development in the Eagle Ford and Marcellus formations.
The satellite methane emission estimate is largely for upstream emissions and does not fully account for downstream emissions during storage and delivery of gas to customers, which may on average add another 2.5% of methane emission.11,12,22 The conclusion is that shale gas development during the 2009–2011 period, on a full life cycle basis including storage and delivery to consumers, may have on average emitted 12% of the methane produced. This is more than twice what we had estimated for shale gas in our 2011 analysis,11 but the satellite-based estimate is based on more robust data and integrates across a period of 2 years. These shale gas emissions already may have a globally observable effect on methane in the atmosphere.36
The satellite-based estimate is ~20-fold greater than the estimate presented by Allen et al,29 a study that worked closely with industry to measure emissions from various component processes of shale gas development. In my 2014 review, I suggested that the study by Allen et al may represent a best-case scenario for low emissions, given that measurements were made only at sites where industry allowed.12 Since then, two papers published in 2015 have indicated that in fact the data in the Allen et al’s paper may be flawed. Allen et al used a high-flow analyzer that employs two independent sensors, switching between a catalytic oxidation detector when methane levels are low and a thermal conductivity detector when methane concentrations are greater. Howard et al noted that the high-flow analyzer is prone to underestimating methane fluxes when switching between detectors.38 A follow-up paper by Howard et al carefully evaluated the use of a high-flow analyzer by Allen et al and concluded that “the data reported by Allen et al. (2013) suggest their study was plagued by such sensor failure”, and as a result “their study appears to have systematically underestimated emissions.”39 The sensor failure issue may well have affected other data reported by industry to the EPA and used by the EPA in their assessment of methane emissions, leading to serious underestimation.38,39
Several other recent studies have estimated upstream methane emissions from shale gas and other unconventional natural gas development (ie, from tight-sand formations) using more robust and more integrated measurement techniques such as airplane flyovers, but still with highly variable results. Estimates were ~30% greater than the satellite-derived data for one gas field,40 were comparable in two other cases,20,25 were only about half as much for two sets of measurements in another gas field,28,41 and were substantially less in three other cases.40 Peischl et al have suggested that higher emissions are associated with wet-gas fields and lower emissions with dry-gas fields.40 Alternatively, the variation in emissions may simply reflect variance in space and/or in time: many of these studies were quite short in duration, for example, based on measurements made during airplane flyovers of just 1–2 days.20,40 It is also important to note that these emission estimates are given as percentages of the gas production rates. The activity of the natural gas industry and rates of production in various gas fields are quite variable in time, and some of the differences in percentage emission rates may reflect this variability. For instance, Caulton et al reported high emission rates in the southwestern Pennsylvania portion of the Marcellus shale based on a June 2012 flyover,20 while Peischl et al reported a very low percentage of emission rate in the northeastern Pennsylvania portion of the Marcellus shale from a July 2013 flyover.40 Between these two flights, gas drilling activity for shale gas fell by 64% due to low prices for gas,42 yet shale gas production remained high based on prior drilling and hydraulic fracturing.1 If methane emission is more related to drilling and hydraulic fracturing activity than to production, these rapid changes in activity may explain at least part of the differences between the two estimates for Marcellus shale. I therefore conclude that the satellite data36 provide the most robust estimates for upstream methane emissions from shale gas operations to date.
Is natural gas a bridge fuel?
Natural gas is widely promoted as a bridge fuel, a source of energy that allows society to continue to use fossil fuels while reducing greenhouse gas emissions over the next 2 decades or so, until renewable energy sources can more fully come on line. Our 2011 paper challenged that view because of methane emissions from natural gas, although we tempered our conclusion because of the uncertainty in methane emissions from shale gas development.11 We also observed that the time frame over which one compares the consequences of emissions of carbon dioxide and methane is important in determining the overall greenhouse gas footprint of natural gas. While many studies have made this comparison only by averaging the radiative forcing of the two gases over a time of 100 years following emission, we compared on a 20-year timescale as well, following the lead of Hayhoe et al22 and Lelieveld et al.43 Methane has a residence time in the atmosphere of only 12 years,23,33 while the influence of carbon dioxide emissions persists in the atmosphere for many hundreds of years or longer.23 While both gases are in the atmosphere, the greenhouse warming effects of methane are >100-fold greater than for carbon dioxide on a mass-to-mass basis.23 When compared on a 100-year average time after emission, the emitted methane is largely absent from the atmosphere for almost 90% of that time, which greatly underplays the importance of methane while it is in the atmosphere.
Our 2011 paper was criticized for comparing the consequences of methane and carbon dioxide over a 20-year period in addition to the 100-year period, with some authors stating that only a 100-year period should be used under the guidance of the IPCC.44,45 This was never the case, and in the fourth synthesis report in 2007, the IPCC presented analyses based on both 20- and 100-year time periods.35 Further, in the fifth synthesis report in 2013, the IPCC explicitly weighed in on this controversy, stating that “there is no scientific argument for selecting 100 years compared with other choices”, and “the choice of time horizon […] depends on the relative weight assigned to the effects at different times”.23
So what is the best choice of timescale? Given current emissions of greenhouse gases, the Earth is predicted to warm by 1.5°C above the preindustrial baseline within the next 15 years and by 2°C within the next 35 years.46,47 Not only will the damage caused by global warming increase markedly but also at these temperatures, the risk of fundamentally altering the climate system of the planet becomes much greater.48,49 Further, reducing emissions of carbon dioxide will do little if anything to slow the rate of global warming over these decadal time periods.47 On the other hand, reducing emissions of methane has an immediate effect of slowing the rate of global warming.47 For these reasons, comparing the global warming consequences of methane and carbon dioxide over relatively short time periods is critical. The use of a global warming potential (GWP) estimate for the 20-year time period from the IPCC fifth assessment report provides a convenient approach for doing so.23 This GWP value of 86 is the relative radiative forcing for methane compared to that of carbon dioxide, averaged over 20 years, for two equal masses of the gases emitted into the atmosphere today.
Figure 2 compares the greenhouse gas footprint of shale gas with that of conventional natural gas, oil, and coal. Methane emissions of shale gas are derived from the satellite-based estimates of Schneising et al36 with an additional 2.5% emission rate assumed from downstream transport, storage, and distribution systems.11,12,22 Methane emissions for the other fuels are those used in our 2011 paper, which is 3.8% (±2.2%) for conventional natural gas.11 Methane emissions are converted to carbon dioxide equivalents using the 20-year GWP value of 86 from the IPCC assessment.23 While for a given unit of energy produced, carbon dioxide emissions are less for shale gas and conventional natural gas than those for oil and coal, the total greenhouse gas footprint of shale gas is substantially greater than that of the other fossil fuels when methane emissions are included (Figure 2). Note that this is true even for the low-end estimates of methane emissions from the Schneising et al study. The greenhouse gas footprint of conventional natural gas is also higher than that of conventional oil and coal for the mean estimate of methane emissions and still greater than or comparable to that of these other fuels even at the low-end estimate for methane emissions. Natural gas – and shale gas in particular – is not a bridge fuel when methane emissions are considered over an appropriate timescale.
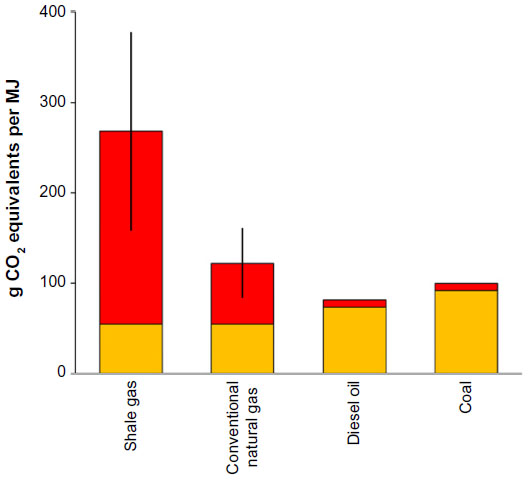 | Figure 2 The greenhouse gas footprints of shale gas, conventional natural gas, oil, and coal expressed as g CO2 equivalents per MJ of heat produced. |
Trends in greenhouse gas emissions from fossil fuels in the USA
Figure 3 shows the greenhouse gas emissions from all use of fossil fuels in the USA from 1980 to 2013 and projections for emissions through 2040, based on data for fossil fuel use and projections of future use from the EIA Annual Energy Outlook 2015 report1 and carbon dioxide emissions per unit of energy produced for each fuel.11,22 Total carbon dioxide emissions fell in the early 1980s due to economic recession, but as the economy recovered, emissions rose steadily until the great recession of 2008. Carbon dioxide emissions continued to fall from 2008 to 2013 and are predicted to remain relatively flat through 2040.1 President Obama and others have attributed the decrease in carbon dioxide emissions since 2008 to a switch from coal to shale gas,21,50 although a recent analysis by Feng et al concludes that the sluggish economy was the more significant cause.51
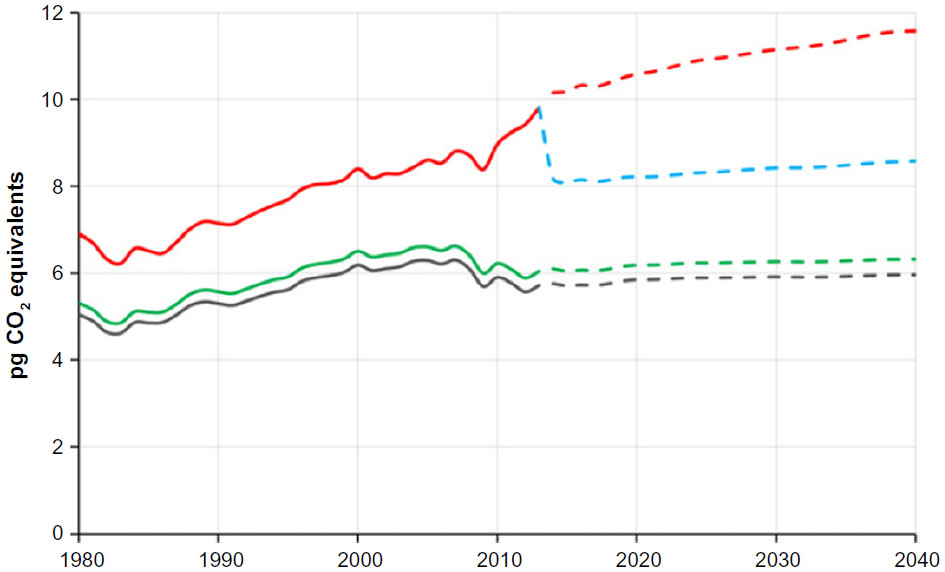 | Figure 3 Trends in greenhouse gas emissions from fossil fuel use in the USA from 1980 to 2013 and future trends predicted until 2040 based on historical energy use and energy predictions in the Annual Energy Outlook 2015.1 Shown are: emissions just for carbon dioxide (gray line); emissions for carbon dioxide and for methane using EPA assumptions, which undervalue the importance of methane (green line); emissions for carbon dioxide and methane based on emission factors for conventional natural gas, oil, and coal from Howarth et al,11 mean methane emission estimates for shale gas of 12% based on Schneising et al36 as discussed in the text, and a global warming potential for methane of 86 (red line); and future emissions for carbon dioxide and methane based on the same assumptions as for the red line, except assuming that shale gas emissions can be brought down to the level for conventional natural gas (blue line). Historical data are shown by solid lines; dashed lines represent future predictions. |
When methane emissions are included in the analysis, we see some important differences in trends in national greenhouse gases. For the top line in Figure 3, methane emissions are included as carbon dioxide equivalents using the 20-year GWP of 86 from the IPCC fifth assessment23 and methane emission factors from the 2011 study by Howarth et al11 for coal, conventional oil, and conventional natural gas and a factor of 12% based on the satellite data discussed earlier for shale gas. In this analysis, methane contributes 28% of total fossil fuel emissions for the USA in 1980 and 42% in 2013 (Figure 3). The increasing trend in the relative importance of methane in the greenhouse gas emissions of the USA is due to an increasingly large portion of the nation’s fuel mix coming from natural gas and particularly from shale gas for the time since 2009.1 Shale gas production was negligible before 2005 (Figure 1) but rose to contribute 14% of all fossil fuel energy used in the USA in 2013.1 Importantly, while carbon dioxide emissions fell between 2008 and 2013, total greenhouse gas emissions including methane fell only briefly in 2008 before beginning a rapid increase that lasted through 2013 and are projected to continue to rise through 2040.
The US EPA includes methane emissions in the natural gas inventory, but they do so in a manner that greatly undervalues their importance. This can be seen in Figure 3, where the green line that is just above and closely tracks the gray line for carbon dioxide emissions is based on EPA assumptions: a methane emissions rate of only 1.8% from natural gas and a GWP of 21 based on the 100-year time period from the second IPCC assessment from 1996.52 Note that the EPA used this GWP value of 21 for many years, through 2013, before switching to the 100-year value of 25 in 2014 from the IPCC fourth assessment from 2007. The 2013 assessment of the IPCC gives a GWP value of 34 for the 100-year period but, as noted earlier, also states that the 100-year time frame is arbitrary. A shorter time frame, such as the 20-year GWP of 86 used in the top line in Figure 3, far better accounts for the importance of methane to global warming in the critical next few decades as the temperature is predicted to reach 1.5°C–2°C above the preindustrial baseline if methane emissions are not reduced.
Implications for policy on shale gas
As of January 2015, the US EPA has taken some steps to reduce emissions from shale gas, but how effective these will be in reducing methane emissions remains unclear. A draft regulation proposed in 2012 would have prevented the venting of methane during the flowback period following hydraulic fracturing, with some exceptions such as for wells in frontier regions not yet serviced by pipelines.53 This would be important, since such venting can emit a large amount of methane.11 However, the final regulation distinguishes between two phases of flowback, an “initial flowback stage” and a “separation flowback stage”. Venting of methane and other gas is explicitly allowed during the initial stage, and recovery of the gas is only required during the separation stage.53 The separation stage is supposed to commence as soon as it is technically feasible to use a flowback gas separator. At this stage, EPA requires that the gas be sold to market, reinjected into the ground, used as an onsite fuel, or, if none of these are possible, flared (ie, burned). No direct venting of gas is allowed during this separation flowback stage, “except when combustion creates a fire or safety hazard or can damage tundra, permafrost or waterways”.53 Much is left to operator judgment as to when the shift from the initial stage to the separation stage occurs and whether an exception is necessary, which would seem to make enforcement of these regulations difficult.
Further, EPA continues to ignore some methane emission sources, such as during the drilling phase. Caulton et al identified many wells that were emitting high levels of methane during this drilling phase, before the drillers had even reached the target shale, and long before hydraulic fracturing,20 perhaps because drillers were encountering pockets of methane gas from abandoned conventional gas wells or abandoned coal mines. Our understanding of emission sources remains uncertain, with the study of shale gas methane emissions commencing only in the past few years.6 Adequate regulation to reduce emissions requires better knowledge of sources, as well as better oversight and enforcement.
Nonetheless, methane emissions from shale gas can be reduced to some extent. I suggest that the best-case scenario would have these emissions reduced to the level for conventional natural gas, or ~3.8% for the full well-to-consumer life cycle. This best-case scenario is explored in Figure 3 (dashed blue line), where it is assumed that shale gas methane emissions are reduced from 12% to 3.8% as of 2014. Even still, methane accounts for 30% of total greenhouse gas emissions from fossil fuels in the USA throughout the period from 2014 to 2040 under this scenario, and total emissions continue to rise, albeit more slowly than without the aggressive reduction in shale gas methane emissions. This best-case scenario seems unlikely, and actual emissions from shale gas are likely to range between 3.8% and 12%, giving total greenhouse gas emissions for all fossil fuels that lie between the dashed red and blue lines in Figure 3.
Methane emissions severely undercut the idea that shale gas can serve as a bridge fuel over the coming decades, and we should reduce our dependence on natural gas as quickly as possible. One of the most cost-effective ways to do so is to replace in-building use of natural gas for domestic space and water heating with high-efficiency heat pumps. Even if the electricity that drives these heat pumps comes from coal, the greenhouse gas emissions are far less than from the direct use of natural gas.12 Heating is the major use for natural gas in the USA, making this change of use imperative.
Concluding thoughts and a path forward
Should society continue to use coal rather than convert toward more electricity production from shale gas? Absolutely not. The carbon dioxide emissions from burning any fossil fuel will continue to influence the climate for hundreds of years into the future, and coal is the worst of the fossil fuels in terms of carbon dioxide emissions. Given the imperative of also reducing methane emissions to slow global warming over the coming few decades, though, the only path forward is to reduce the use of all fossil fuels as quickly as possible. There is no bridge fuel, and switching from coal to shale gas is accelerating rather than slowing global warming.
Fortunately, society does have a path forward: recent studies for the State of New York54 and for the State of California55 have demonstrated that we can move from a fossil fuel-driven economy to one driven totally by renewable energy sources (largely solar and wind) in a cost-effective way using only technologies that are commercially available today. The major part of the transition can be made within the next 15 years, largely negating the need for shale gas, with a complete transition possible by 2050. A critical part of these plans is to use modern, efficient technologies such as heat pumps and electric vehicles, which greatly reduce the overall use of energy. The cost of the transition is less than the cost currently paid for death and illness related to air pollution from using fossil fuels.54 The costs of renewable energy today are equal to or lower than those from using fossil fuels, when the external costs to health and the climate are considered.
In June 2015, six of the largest oil and gas companies in Europe including BP and Shell called for a carbon tax as a way to slow global warming.56 An editorial in the New York Times endorsed this idea,56 and indeed, a carbon tax is perhaps the best way to equalize the playing field for renewable energy technologies. The International Monetary Fund estimates that subsidies to fossil fuels globally are in the range of $5 trillion per year, with much of this due to the effects of global warming and consequences on human health.57 A carbon tax would help rectify these subsidies and help promote renewable energy. However, the editorial in the Times made a fundamental error by ignoring methane emissions when they wrote “this tax would reduce demand for high-carbon emission fuels and increase demand for lower emission fuels like natural gas”.56
Any carbon tax should recognize the two faces of carbon: the two major greenhouse gases, carbon dioxide and methane, are both carbon gases. Both of these carbon gases are critically important, and the 2013 IPCC synthesis report tells us that the effects of global methane being emitted today matches the consequences of carbon dioxide emissions as drivers of global warming.23 The modes of interaction with the planetary climate system are dramatically different, though. The climate is slow to respond to changes in carbon dioxide emissions, and so immediate reductions in emissions would take 30–40 years before having an influence on slowing warming, but the emissions have a warming effect on the climate that will persist for hundreds of years.23,46,47 The climate responds quickly to changes in methane emissions, and reducing methane emissions is essential for slowing climate change over the coming 30–40 years; however, the methane remains in the atmosphere for little more than 1 decade, and methane emissions have no lasting influence on the Earth’s climate systems in future centuries, unless global warming over the coming decades leads to fundamental thresholds and changes in the climate.12,23,46,47
A carbon tax that adequately addresses the immediacy of global climate change must include both carbon gases. Methane emissions should be taxed using the best available information on methane emissions. And the tax on methane should adequately reflect the importance of methane in current global warming and its influence in global warming over the critically important next few decades. Taxing methane emissions at 86 times the tax for carbon dioxide emissions, using the 20-year GWP from the most recent IPCC synthesis report,23 would accomplish this.
Acknowledgments
The author thanks Tony Ingraffea for his continued support and collegial interaction over the past 6 years in the joint work that has helped to lead to this paper. Funding was provided by the Park Foundation and an endowment given by David R Atkinson to Cornell University to support my position. Roxanne Marino and Melanie Hayn assisted with drafting the figures, and the manuscript benefited from advice and input from Roxanne Marino, my wife and long-term colleague. Two anonymous reviewers provided very helpful comments.
Disclosure
The author reports no conflicts of interest in this work.
References
Energy Information Agency. Annual Energy Outlook 2015. Washington, DC: United States Department of Energy, Energy Information Agency; 2015. | |
British Petroleum. BP Energy Outlook 2035. London: British Petroleum; 2015. | |
ExxonMobil. The Outlook for Energy: A View to 2040. Irving, TX: ExxonMobil; 2015. | |
Hughes D. Energy: a reality check on the shale gas revolution. Nature. 2013;494:307–308. | |
Hughes D. Drilling Deeper: A Reality Check for US Government Forecasts for a Lasting Tight Oil and Shale Gas Boom. Santa Rosa, CA: Post Carbon Institute; 2014. | |
Howarth RW, Ingraffea A. Should fracking stop? Yes, it is too high risk. Nature. 2011;477:271–273. | |
Colburn T, Kwiatkowski C, Schultz K, Bachran M. Natural gas operations from a public health perspective. Hum Ecol Risk Assess. 2011;17: 1039–1056. | |
US EPA. Assessment of the Potential Impacts of Hydraulic Fracturing for Oil and Gas on Drinking Water Resources (External Review Draft), EPA/600/R-15/047. Washington, DC: US Environmental Protection Agency; 2015. | |
Vinciguerra T, Yao S, Joseph Dadzie J, et al. Regional air quality impacts of hydraulic fracturing and shale natural gas activity: evidence from ambient VOC observations. Atmos Environ. 2015;110:144–150. | |
Pétron G. Air pollution issues associated with shale gas production. Bridge. 2014;44(2):19–27. | |
Howarth RW, Santoro R, Ingraffea A. Methane and the greenhouse gas footprint of natural gas from shale formations. Clim Change Lett. 2011;106:679–690. | |
Howarth RW. A bridge to nowhere: methane emissions and the greenhouse gas footprint of natural gas. Energy Sci Eng. 2014;2:47–60. | |
Weingarten M, Ge S, Godt JW, Bekins BA, Rubinstein JL. High-rate injection is associated with the increase in US mid-continent seismicity. Science. 2015;348:1336–1340. | |
Bamberger M, Oswald R. The Real Cost of Fracking: How America’s Shale Gas Boom Is Threatening Our Families, Pets, and Food. Boston, MA: Beacon Press; 2014. | |
Macy PG, Breech R, Chernaik M, et al. Air concentrations of volatile compounds near oil and gas production: a community-based exploratory study. Environ Health. 2014;13:82. | |
McKenzie LM, Guo R, Witter RZ, Savitz DA, Newman LS, Adgate JL. Birth outcomes and maternal residential proximity to natural gas development in rural Colorado. Environ Health Perspect. 2014;122: 412–417. | |
Adgate JL, Goldstein BD, McKenzie LM. Potential public health hazards, exposures and health effects from unconventional natural gas development. Environ Sci Technol. 2014;48:8307–8320. | |
Jemielita T, Gerton GL, Neidell M, et al. Unconventional gas and oil drilling is associated with increased hospital utilization rates. PLoS One. 2015;10(7):e0131093. | |
EnergyFromShale.org. What is Fracking? 2015. Available from: http://www.energyfromshale.org/articles/what-fracking?gclid=CLK_tYT5tMYCFcYkgQodC-gM6Q. Accessed June 29, 2015. | |
Caulton DR, Shepson PB, Santoro RL, et al. Toward a better understanding and quantification of methane emissions from shale gas development. Proc Nat Acad Sci U S A. 2014;111: 6237–6242. | |
Geman B. Obama, in Speech, Defends “All of the Above Energy Plan”. National Journal; 2014. Available from: http://www.nationaljournal.com/state-of-the-union-2014/obama-in-speech-defends-all-of-the-above-energy-plan-20140128. Accessed June 29, 2015. | |
Hayhoe K, Kheshgi HS, Jain AK, Wuebbles DJ. Substitution of natural gas for coal: climatic effects of utility sector emissions. Clim Change. 2002;54:107–139. | |
Intergovernmental Panel on Climate Change. Climate Change 2013: The Physical Science Basis. Cambridge: Cambridge University Press; 2013. | |
Shires T, Lev-On M. Characterizing Pivotal Sources of Methane Emissions from Unconventional Natural Gas Production: Summary and Analysis of API and ANGA Survey Responses. Washington, DC: American Petroleum Institute; 2012. | |
Karion A, Sweeney C, Pétron G, et al. Methane emissions estimate from airborne measurements over a western United States natural gas field. Geophys Res Lett. 2013;40:4393–4397. | |
US Environmental Protection Agency Office of Inspector General. EPA Needs to Improve Air Emissions Data for the Oil and Natural Gas Production Sector. Washington, DC: US Environmental Protection Agency; 2013. | |
Miller SM, Wofsy SC, Michalak AM, et al. Anthropogenic emissions of methane in the United States. Proc Nat Acad Sci U S A. 2013;110: 20018–20022. | |
Pétron G, Frost G, Miller BT, et al. Hydrocarbon emissions characterization in the Colorado front range – a pilot study. J Geophys Res. 2012;117:D04304. | |
Allen DT, VTorres VM, Thomas K, et al. Measurements of methane emissions at natural gas production sites in the United States. Proc Nat Acad Sci U S A. 2013;110:17768–17773. | |
Brandt AF, Heath GA, Kort EA, et al. Methane leaks from North American natural gas systems. Science. 2014;343:733–735. | |
Etiope GK, Lassey R, Klusman RW, Boschi E. Reappraisal of the fossil methane budget and related emission from geologic sources. Geophys Res Lett. 2008;35(9):L09307. | |
Lassey R, Lowe D, Smith A. The atmospheric cycling of radiomethane and the ‘fossil fraction’ of the methane source. Atmos Chem Phys. 2007;7:2141–2149. | |
Kirschke S, Bousquet P, Ciais P, et al. Three decades of global methane sources and sinks. Nat Geosci. 2013;6:813–823. | |
Energy Information Agency. International Energy Statististics. Washington, DC: US Department of Energy; 2015. | |
Intergovernmental Panel on Climate Change. IPCC Fourth Assessment Report (AR4), Working Group 1, The Physical Science Basis. Cambridge: Cambridge University Press; 2007. | |
Schneising O, Burrows JP, Dickerson RR, Buchwitz M, Reuters M, Bovensmann H. Remote sensing of fugitive emissions from oil and gas production in North American tight geological formations. Earths Future. 2014;2:548–558. | |
Energy Information Agency. Drilling Productivity Report for Key Tight Oil and Shale Gas Regions, August 2015. Washington, DC: US Department of Energy; 2015. | |
Howard T, Ferrarab TW, Townsend-Small A. Sensor transition failure in the high flow sampler: implications for methane emission inventories of natural gas infrastructure. J Air Waste Manag Assoc. 2015;65: 856–862. | |
Howard T. University of Texas study underestimates national methane emissions inventory at natural gas production sites due to instrument sensor failure. Energy Sci Eng. 2015; DOI:10.1002/ese3.81. | |
Peischl J, Ryerson TB, Aikin KC, et al. Quantifying atmospheric methane emissions from the Haynesville, Fayetteville, and Northeastern Marcellus shale gas production regions. J Geophys Res Atmos. 2015;120: 2119–2139. | |
Pétron G, Karion A, Sweeney C, et al. A new look at methane and nonmethane hydrocarbon emissions from oil and natural gas operations in the Colorado Denver-Julesburg Basin. J Geophys Res Atmos. 2014;119:6836–6852. | |
Richter W. This Chart Shows the True Collapse of Fracking in the US. Business Insider; 2015. Available from: http://www.businessinsider.com/this-chart-shows-the-true-collapse-of-fracking-in-the-us-2015-3. Accessed June 29, 2015. | |
Lelieveld J, Lechtenböhmer S, Assonov SS, et al. Greenhouse gases: low methane leakage from gas pipelines. Nature. 2005;434: 841–842. | |
Cathles LM, Brown L, Taam M, Hunter A. A commentary on “The greenhouse-gas footprint of natural gas in shale formations” by RW Howarth, R Santoro, and Anthony Ingraffea. Clim Change. 2012;113: 525–535. | |
Stephenson T, Valle JE, Riera-Palou X. Modeling the relative GHG emissions of conventional and shale gas production. Environ Sci Technol. 2011;45:10757–10764. | |
United Nations Environment Programme and World Meteorological Organization. Integrated Assessment of Black Carbon and Tropospheric Ozone: Summary for Decision Makers. Nairobi: United Nations Environment Programme; 2011. | |
Shindell D, Kuylenstierna JC, Vignati E, et al. Simultaneously mitigating near-term climate change and improving human health and food security. Science. 2012;335:183–189. | |
Hansen J, Sato M. Greenhouse gas growth rates. Proc Nat Acad Sci U S A. 2004;101:16109–16114. | |
Hansen J, Sato M, Kharecha P, Russell G, Lea DW, Siddall M. Climate change and trace gases. Philos Trans A Math Phys Eng Sci. 2007;365: 1925–1954. | |
Carey JM. Surprise Side Effect of Shale Gas Boom: A Plunge in US Greenhouse Gas Emissions. Forbes; 2012. Available from: http://www.forbes.com/sites/energysource/2012/12/07/surprise-side-effect-of-shale-gas-boom-a-plunge-in-u-s-greenhouse-gas-emissions/. Accessed June 29, 2015. | |
Feng K, Davis SJ, Sun L, Hubacek K. Drivers of the US CO2 emissions 1997–2013. Nat Commun. 2015;6:7714. | |
Intergovernmental Panel on Climate Change. IPCC Second Assessment, Climate Change; 1995. Nairobi: World Meteorological Organization and United Nations Environment Programme; 1996. | |
Environmental Protection Agency. Oil and natural gas sector: reconsideration of additional provisions of new source performance standards; final rule. 40 CFR part 60. Fed Regist. 2014;79(250):79018–79041. | |
Jacobson MZ, Howarth RW, Delucchi MA, et al. Examining the feasibility of converting New York State’s all-purpose energy infrastructure to one using wind, water, and sunlight. Energy Policy. 2013;57:585–601. | |
Jacobson MZ, Delucch MA, Ingraffea AR, et al. A roadmap for repowering California for all purposes with wind, water, and sunlight. Energy. 2014;73:875–889. | |
The New York Times Editorial Board. The case for a carbon tax. The New York Times; 2015. Available from: http://www.nytimes.com/2015/06/07/opinion/the-case-for-a-carbon-tax.html?_r=0. Accessed June 29, 2015. | |
International Monetary Fund. How Large Are Global Energy Subsidies? IMF Working Paper Number 15/105. Washington, DC: The International Monetary Fund; 2015. |
 © 2015 The Author(s). This work is published and licensed by Dove Medical Press Limited. The full terms of this license are available at https://www.dovepress.com/terms.php and incorporate the Creative Commons Attribution - Non Commercial (unported, v3.0) License.
By accessing the work you hereby accept the Terms. Non-commercial uses of the work are permitted without any further permission from Dove Medical Press Limited, provided the work is properly attributed. For permission for commercial use of this work, please see paragraphs 4.2 and 5 of our Terms.
© 2015 The Author(s). This work is published and licensed by Dove Medical Press Limited. The full terms of this license are available at https://www.dovepress.com/terms.php and incorporate the Creative Commons Attribution - Non Commercial (unported, v3.0) License.
By accessing the work you hereby accept the Terms. Non-commercial uses of the work are permitted without any further permission from Dove Medical Press Limited, provided the work is properly attributed. For permission for commercial use of this work, please see paragraphs 4.2 and 5 of our Terms.