")
Back to Journals » Clinical Interventions in Aging » Volume 13
Levels of serum sclerostin, FGF-23, and intact parathyroid hormone in postmenopausal women treated with calcitriol
Authors Cheng Q , Wu X, Du Y , Hong W, Tang W, Li H, Chen M, Zheng S
Received 2 September 2018
Accepted for publication 27 October 2018
Published 16 November 2018 Volume 2018:13 Pages 2367—2374
DOI https://doi.org/10.2147/CIA.S186199
Checked for plagiarism Yes
Review by Single anonymous peer review
Peer reviewer comments 3
Editor who approved publication: Dr Richard Walker
Qun Cheng,1–3 Xiaoxing Wu,1,2 Yanping Du,1–3 Wei Hong,1–3 Wenjing Tang,1–3 Huilin Li,1–3 Minmin Chen,1–3 Songbai Zheng3
1Department of Osteoporosis and Bone Disease, Huadong Hospital Affiliated to Fudan University, Shanghai, China; 2Research Section of Geriatric Metabolic Bone Disease, Shanghai Geriatric Institute, Shanghai, China; 3National Clinical Research Center for Aging and Medicine, Fudan University, Shanghai, China
Objective: This study aimed to determine the effect of calcitriol on serum concentrations of fibroblast growth factor-23 (FGF-23), sclerostin, intact parathyroid hormone (PTH), and handgrip strength in postmenopausal women with low bone mass.
Methods: A randomized, double-blind controlled trial was carried out among 141 postmenopausal women with low bone mass. Participants were randomized into two groups: 75 participants received calcitriol 0.5 μg/day and 66 participants received a placebo for 12 weeks.
Results: After 12-week calcitriol treatment, significant decreases in serum intact PTH (P=0.035) and sclerostin (P=0.039), as well as significant increases in serum creatinine (P=0.027), uric acid (P=0.032), 24-hour urinary calcium (P=0.0026), and left handgrip strength (P=0.03), were observed, compared to placebo group. Level of serum sclerostin was weakly but significantly positively correlated with serum PTH (r=0.277; P=0.01) and negatively correlated with 24-hour urinary calcium (r=−0.221; P=0.04) and left handgrip strength (r=−0.338; P=0.03) after calcitriol treatment. Multiple regression analysis demonstrated that decrease in serum sclerostin was associated with decrease in PTH serum level after calcitriol treatment (OR, 7.90; 95% CI, 2.28–27.42; P=0.002). However, no significant change in FGF-23 level was observed after calcitriol treatment.
Conclusion: Calcitriol treatment yields a considerable decrease in serum sclerostin and significant increase of handgrip strength, and the change in serum sclerostin is regulated by serum PTH and by muscle strength.
Keywords: calcitriol, FGF-23, fibroblast growth factor 23, handgrip, intact PTH, sclerostin
Introduction
Osteoporosis is a disease that affects primarily postmenopausal women, especially those with vitamin D deficiency and a lifestyle of low physical activity. In China, the prevalence of osteoporosis has grown rapidly, the prevalence of osteoporosis in people aged 50 years and older in 2015 being more than twice the prevalence identified in 2006 (34.65% vs 15.7%, respectively). The prevalence was higher in females than in males (25.41% vs 15.33%, respectively) and increased with age.1 Moreover, vitamin D deficiency is also very common in China. In our previous study,2 more than 82.5% of elderly community residents had vitamin D insufficiency, and approximately 43% had vitamin D deficiency – even during summer. Deficiency of vitamin D inevitably leads to secondary hyperparathyroidism, which augments bone resorption, compromises bone quality, and increases risk of falling and fractures.
Sclerostin is an osteocyte-secreted glycoprotein that inhibits osteoblast proliferation and differentiation, as well as promoting apoptosis by inhibiting canonical Wnt-signaling.3 Sclerostin may help modulate systemic and local factors, such as calcitriol, parathyroid hormone (PTH), glucocorticoids, and tumor necrosis factor (TNF)-alpha.4 We determined that serum sclerostin also positively correlates with bone mineral density (BMD), negatively correlates with serum TGF-beta, and changes with age in the postmenopausal period.5 Fibroblast growth factor-23 (FGF-23) is a bone-derived hormone that regulates homeostasis of phosphate and 1,25-dihydroxyvitamin D (1,25(OH)2D).6 As the most metabolically active form of vitamin D, 1,25(OH)2D plays a key role in the regulation of extracellular calcium concentration and bone metabolism. Calcitriol has been used widely to treat osteoporosis, especially in the elderly population in China. However, the effects of calcitriol on the levels of serum FGF-23 and sclerostin have not been determined; moreover, it remains unclear whether there are correlations among FGF-23, sclerostin, and calcitriol. In the current study, we assessed the effect of calcitriol on serum FGF-23 and sclerostin in postmenopausal women with low bone mass to ascertain the following: 1) whether serum FGF-23 and sclerostin significantly changed after calcitriol treatment; 2) whether these changes evoke corresponding changes in serum intact PTH (iPTH) and bone turnover; and 3) the changes in muscle mass and muscle strength during treatment.
Methods
Study design and study population
We carried out a randomized, double-blind controlled study. The logistics of calcitriol and placebo, along with each code for randomization, were prepared by personnel from the Department of Medicine, Qingdao Chia Tai Haier Pharmaceutical Co, Ltd, Qingdao, Shandong, China. Both investigators and participants were unaware of the codes.
All the participants were recruited from the town of Meilong in Minhang District of Shanghai, China, from November 2016 to April 2017. Totally, 320 postmenopausal women were recruited, and after excluding patients who did not give consent (58 patients), who had normal bone mass (44 patients), who had a level of serum 25(OH)2D that exceeded 30 ng/mL (45 patients), and who did not comply with or finish the study (32 patients), 141 participants completed the study and were included in the analysis. Based on a review of medical charts and physical examination, we selected participants in good health. All were able to walk independently. No included patient had severe disease that interfered with vitamin D metabolism, such as hyperthyroidism, hyperparathyroidism, hepatic failure, renal failure, or end-stage cancer. No included patient received medication that was likely to affect bone or vitamin D metabolism (eg, glucocorticoids, heparin, warfarin, thyroxine, sex hormones, bisphosphonates, selective estrogen-receptor modulators, calcitonin, PTH analogs, or calcitriol). This study was conducted in accordance with the Declaration of Helsinki. All participants provided written informed consent. Approval was obtained from the Huadong Hospital Ethics Committee, Shanghai, China (project number 2014K004).
Treatment
Participants were randomized to receive either calcitriol or placebo. The calcitriol group received oral calcitriol (Qingdao Chia Tai Haier Pharmaceutical Co, Ltd) at a dosage of 0.5 μg/day for 12 weeks. All the participants were required to avoid calcium supplements and were asked to maintain their usual dietary habits during the study period. According to a survey launched in 2015 in China, the average calcium intake from the food for old persons was about 400 mg/day; so, dietary calcium intake was lacking in China.7
Anthropometry
All anthropometric measurements were made by well-trained staff. Weight and height were determined with the participants dressed in light clothing and without wearing shoes. Body mass index (BMI) was calculated as the weight in kilograms divided by the square of the height in meters (kg/m2).
Handgrip measurement
Isometric handgrip was measured using a digital handgrip dynamometer (Takei Scientific Instruments, Niigata, Japan). Grip strength was measured three times per hand with the patient standing. The results were represented as the combined grip strength in kilograms, ie, the sum of the largest reading from each hand.
Laboratory analyses
Patients underwent collection of fasting serum samples for biochemical analysis, including bone turnover markers, calciotropic hormones, FGF-23, and sclerostin. These factors were analyzed at baseline and at the end of the study. Serum samples were collected between 0700 and 0900 hours after a 10-hour fast.
Bone density measurements
BMD values, including those for lumbar vertebrae (L1–4), left femoral neck (FN), and total hip, were measured using dual-energy X-ray absorptiometry (DXA; Hologic Delphi A; Hologic Inc, Waltham, MA, USA). Body composition was measured by a whole body scan with the same machine operated in the slow scan mode. To minimize interobserver variations, all scans and analyses were conducted by the same investigator. The day-to-day coefficients of variance (CVs) of these observations were 0.86% in the lumbar spine BMD, 1.86% in the femur BMD, 0.95% in the total hip BMD, and 0.74% in lean mass. The densitometer was standardized using a standard phantom prior to each measurement.
Analysis of serum FGF-23 and sclerostin levels
Commercially available ELISA kits for FGF-23 (Kainos Laboratories Inc, Tokyo, Japan; intraassay and interassay CV, <2.8% and <3.8%, respectively) and sclerostin (R&D Systems, Minneapolis, MN, USA; intraassay and interassay CV, <2.1% and <10.8%, respectively) were applied for measurement of serum FGF-23 and sclerostin.
Bone turnover markers
Serum osteocalcin (bone Gla protein [BGP]; Hoffman-La Roche Ltd., Basel, Switzerland) and serum cross-linked C-terminal telopeptide of type I collagen (CTX; Roche) were used as bone turnover markers. The within-run and between-run intra-assay CV was <7% for osteocalcin and <6% for CTX.
Calciotropic hormone measurements
Serum iPTH and 25(OH)2D were measured by electrochemiluminescence (Roche). The within-run intra-assay CV was <3.4%, and the between-run intra-assay CV was <7%.
Statistical analyses
Data were represented as mean±SD, mean (95% CI), and median (IQR) as appropriate. Variables were compared with the independent-samples Student’s t-test if normally distributed or with the Mann–Whitney U test if the distribution was skewed. Paired Student’s t-test and Wilcoxon signed-rank test were used for within-group comparisons before and after treatment. Pearson or Spearman correlation coefficients were determined to assess associations of serum sclerostin or FGF-23 with bone turnover markers, calciotropic hormones, and biochemical markers. Absolute changes in plasma FGF-23, sclerostin, iPTH, 25(OH)2D, calcium, phosphorus, ALP, uric acid, creatinine, bone turnover markers, 24-hour urinary calcium concentrations, and handgrip strengths from baseline to Week 12 were ascertained in the calcitriol treatment group. These parameters were stratified by the direction of the change from baseline to Week 12: decrease (Week 12 – baseline ≤0) or increase (Week 12 – baseline >0). Logistic regression modeling was performed to estimate the association of the decrease/increase in each analyte with the decrease/increase in sclerostin or FGF-23. All analyses were performed using SPSS 16.0 (IBM Corporation, Armonk, NY, USA). Two-tailed P-values <0.05 were considered statistically significant.
Results
Demographic information and baseline characteristics of the study subjects are shown in Table 1. There was no statistically significant difference for all the characteristics between the two groups. The BMD values of all participants were indicative of osteopenia or osteoporosis. Appendicular skeletal muscle mass index (ASMI = appendicular skeletal muscle mass/height2) was 6.23±0.73 kg/m2 or 5.95±0.69 kg/m2, respectively, which showed that these postmenopausal women did not suffer from sarcopenia according to the cut point value of our previous study.8 Blood levels of iPTH were 44.78±15.5 pg/mL and 47.0±21.1 pg/mL, respectively, and those of 25(OH)2D were 17.10±7.8 ng/mL and 15.8±9.6 ng/mL, respectively. Blood levels of sclerostin were 103.4±28.0 pg/mL and 120.55±52.6 pg/mL, respectively, and for FGF-23, the levels were 101.7±46.0 ng/mL and 118.79±24.7 ng/mL, respectively, which did not show any significant difference between the two groups (Table 1).
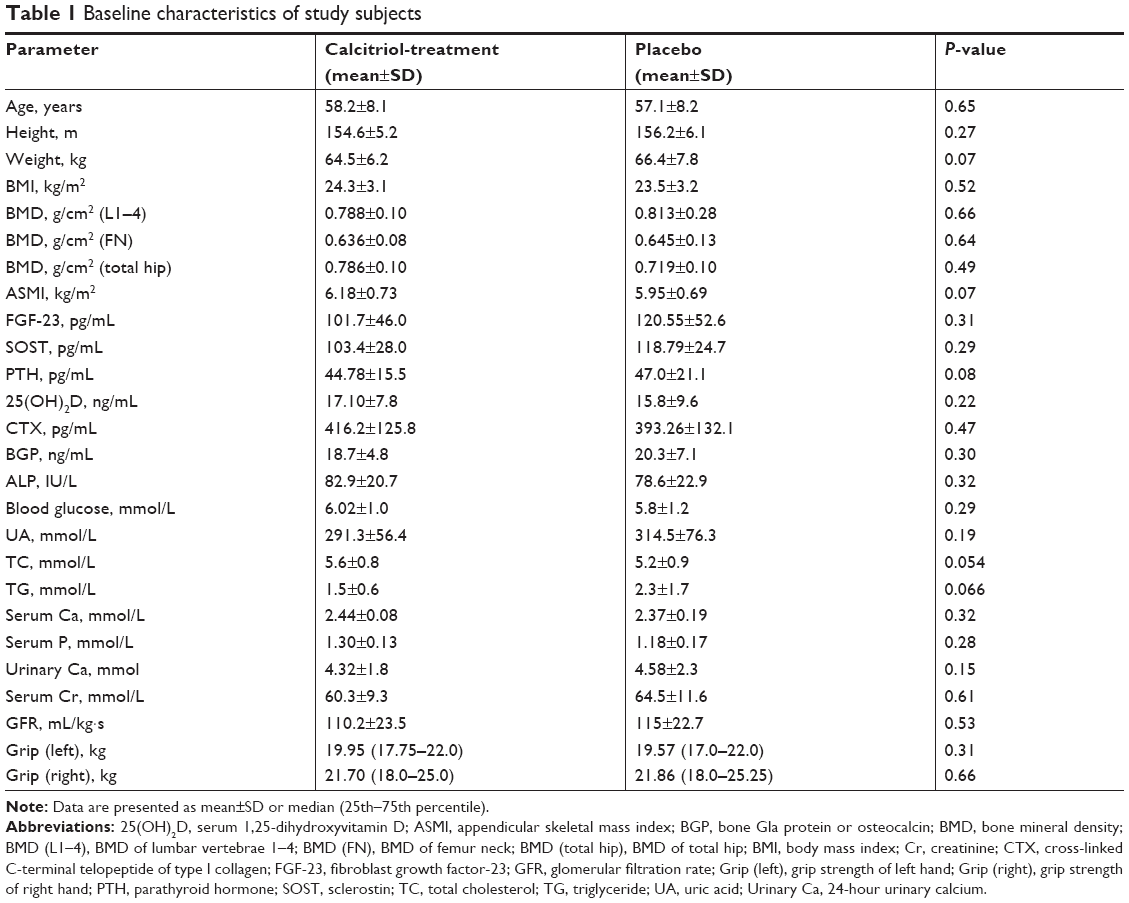 | Table 1 Baseline characteristics of study subjects |
In the calcitriol treatment group, serum iPTH, sclerostin, ALP, serum creatinine, uric acid, serum glucose, and 24-hour urinary calcium levels were found to be significantly changed posttreatment (Table 1). No significant change in serum levels of 25(OH)2D, FGF-23, calcium, or phosphorus were noted. Left handgrip strength increased significantly by 3.7% (P=0.019), but right handgrip strength did not change significantly. However, in the placebo group, there was no significant change for all the parameters between pretreatment and posttreatment values (Table 2). Treatment with calcitriol for 12 weeks resulted in a significant increase in serum uric acid and creatinine, but all of these parameters remained within the normal range from the pretreatment to the posttreatment periods (Table 2).
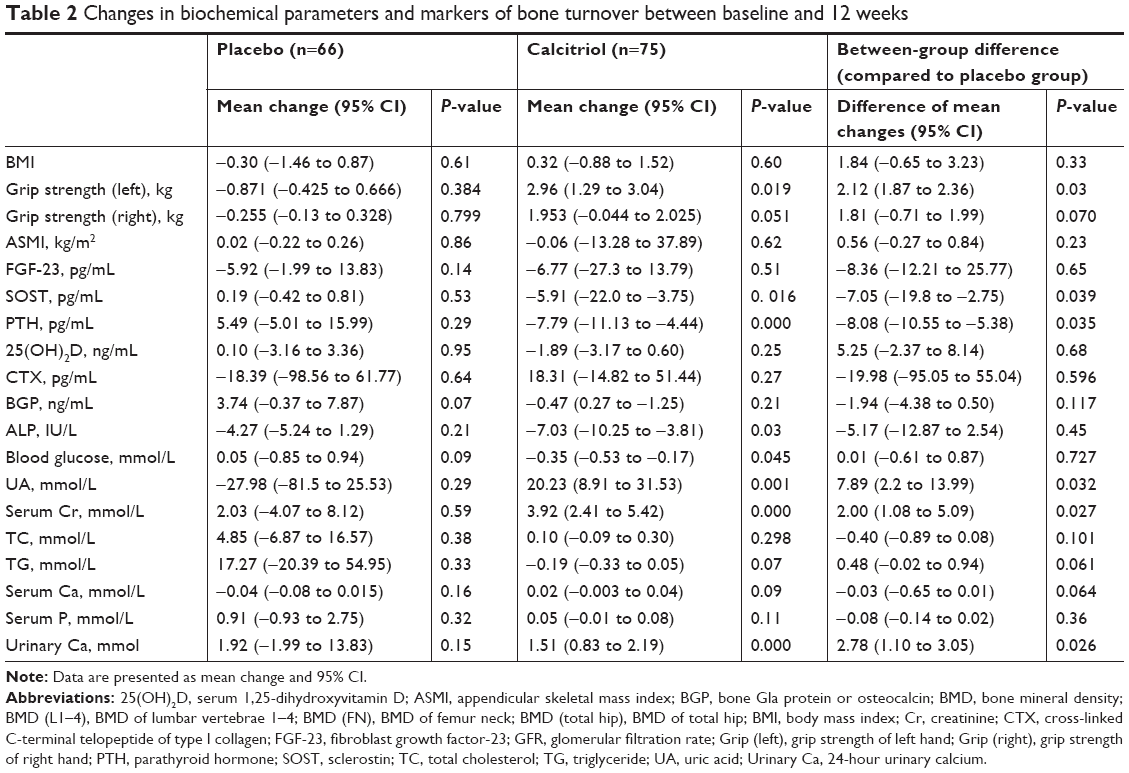 | Table 2 Changes in biochemical parameters and markers of bone turnover between baseline and 12 weeks |
As for the difference between the calcitriol and placebo groups after 12-week treatment, significant decreases in serum iPTH (mean change: −8.08 pg/mL, 95% CI: −10.55 to −5.38 pg/mL; P=0.035) and sclerostin (mean change: −7.05 pg/mL, 95% CI: −19.8 to −2.75 pg/mL; P=0.039), as well as significant increases in serum creatinine (mean change: 2.00 mmol/L, 95% CI: 1.08 to 5.09 mmol/L; P=0.027), uric acid (mean change: 7.89 mmol/L, 95% CI: 2.2 to 13.99 mmol/L; P=0.032), 24-hour urinary calcium (mean change: 2.78 mmol, 95% CI: 1.10 to 3.05 mmol; P=0.0026), and left handgrip strength (mean change: 2.12 kg, 95% CI: 1.87 to 2.36 kg; P=0.03) were observed, compared to the placebo group (Table 2).
Results of pretreatment and posttreatment correlation analyses of sclerostin and FGF-23 with bone metabolic markers and other parameters of calcitriol treatment group are summarized in Table 3. At baseline, sclerostin and FGF-23 were not correlated with 25(OH)2D, iPTH, bone turnover markers, or other parameters. In contrast, posttreatment serum sclerostin level was weakly but significantly positively correlated with iPTH level (r=0.277; P=0.01) and negatively correlated with left handgrip strength (r=−0.338; P=0.03) and 24-hour urinary calcium level (r=−0.221; P=0.04). Posttreatment serum FGF-23 level was negatively correlated with CTX (r=−0.326; P=0.02) and 24-hour urinary calcium (r=−0.356; P=0.01) levels (Table 3). We noted that urinary calcium was also negatively correlated with posttreatment iPTH level (r=−0.335; P=0.001); we further determined that, after adjusting for urinary calcium level, serum sclerostin was still positively correlated with iPTH (r=0.218; P=0.043) and negatively correlated with left handgrip strength (r=−0.317; P=0.041).
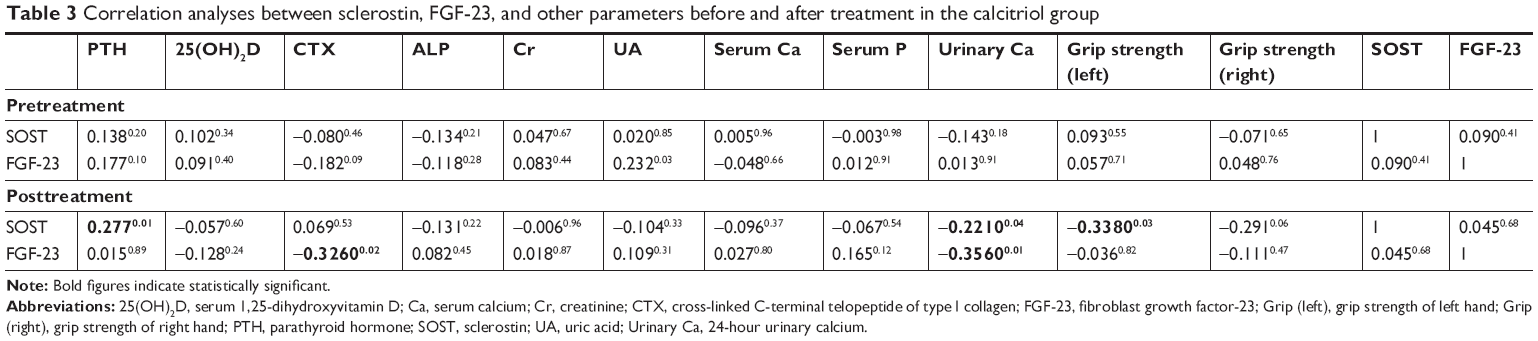 | Table 3 Correlation analyses between sclerostin, FGF-23, and other parameters before and after treatment in the calcitriol group |
Factors associated with a decrease in the serum sclerostin or FGF-23 level of the calcitriol treatment group are presented in Table 4. We constructed a multivariate logistic regression model to examine the relationship between any change in the parameters and the desired end point of a significant decrease in serum sclerostin level. We found that a decrease in serum iPTH was associated with a significant decrease in serum sclerostin after treatment with calcitriol (OR, 7.90; 95% CI, 2.28–27.42; P=0.002; Table 4).
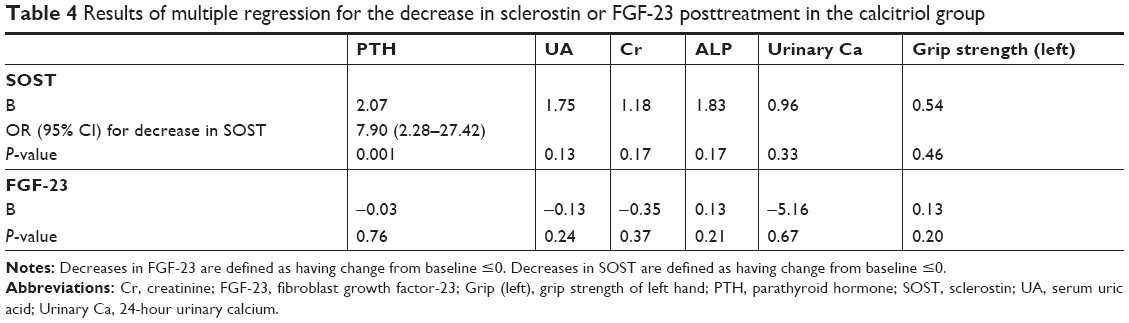 | Table 4 Results of multiple regression for the decrease in sclerostin or FGF-23 posttreatment in the calcitriol group |
Discussion
Both sclerostin and FGF-23 are produced in osteocytes, and they function as crucial calcium regulators in bone mineralization balance. Sclerostin and FGF-23 are known to inhibit bone formation, with several cross-sectional studies having identified inverse associations of serum FGF-239 and sclerostin10 with numerous biochemical markers of bone turnover. In this study, we found that calcitriol treatment yielded significant decreases in serum iPTH and sclerostin, as well as significant increases in serum creatinine, uric acid, and left handgrip strength. Thus, serum sclerostin was negatively regulated by calcitriol, and the change of sclerostin positively correlated with the change of iPTH.
Several studies have addressed the putative regulation of vitamin D by sclerostin, but no study has identified the reason and mechanism for this phenomenon. Sandal et al11 found that pregnant women with vitamin D deficiency had circulating sclerostin levels that were similar to those who were vitamin D sufficient. In a study that included 279 men and women, calcium and vitamin D supplementation at a dosage of 700 IU/day for 2 years increased serum sclerostin levels in men (13.1% increase; P<0.01 vs placebo) but did not change sclerostin levels significantly in women.12 Sankaralingam et al13 reported that intramuscular injection of a 300,000 IU bolus of vitamin D significantly increased the concentration of serum sclerostin. Acibucu et al14 evaluated a group of 44 patients with vitamin D deficiency who had a significant decrease (−19.4%; P<0.01) in sclerostin levels after being treated with monthly intramuscular injection of 300,000 IU of vitamin D (cholecalciferol). Cidem et al15 demonstrated that treatment of vitamin D–deficient patients with calcium at a dosage of 1,200 mg/day for 2 months and vitamin D3 at a dosage of 300,000 IU/week for 1 month produced significantly increased serum 25(OH)2D and significantly decreased serum sclerostin in these patients. In this study, we found that treatment using calcitriol 0.5 μg/day without calcium in postmenopausal women for only 12 weeks significantly increased muscle strength and depressed serum level of iPTH and sclerostin.
Active vitamin D can augment muscle strength and improve lower limb balance. The results of multiple studies have shown that postmenopausal women who take active vitamin D have increased muscle power, show a longer walking distance, and are more likely to have a normal PTH levels than are postmenopausal women who do not take active vitamin D.16,17 However, the beneficial effects of active vitamin D on muscle strength may be more pronounced when the muscle is weaker at baseline. This could explain why, in our study, treatment with calcitriol for 12 weeks, which was relatively short, only yielded a significant increase in handgrip strength on the left side, which is typically nondominant.
Sclerostin appears to be a fundamental regulator of bone mass. However, the factors determining the absolute level of sclerostin expression have not been established fully. Known regulators of sclerostin include mechanical loading (exercise)18 and PTH.19 Sclerostin also has been shown to be regulated by catabolic stimuli, such as TNF and TNF-related weak-inducer of apoptosis (TWEAK).20 Several lines of evidence have indicated that circulating sclerostin levels can be inhibited by treatment with PTH or by implementation of an exercise program. Routine exercise and continuous exposure to gravity are likely to be important factors in sclerostin regulation. In elderly individuals, increased muscle strength might increase mechanical loading of bone, which has been shown to inhibit sclerostin expression by osteocytes.19 Therefore, we speculate that in our study, increased muscle strength acts on bone to inhibit sclerostin expression after calcitriol treatment. These findings suggest that therapies targeting muscle in the setting of disuse atrophy may potentially attenuate bone loss and promote bone strength, the results being similar to those of a previous study.21
In our study, we demonstrated that serum creatinine and uric acid were significantly increased by calcitriol treatment. In the human body, serum creatinine originates from creatine, of which approximately 95% is stored in the skeletal muscle.22 In a clinical study, Baxmann et al23 found that serum and urinary creatinine correlated significantly with body weight and with lean (fat-free) mass. Huh et al24 also determined that serum creatinine correlated positively with total skeletal muscle mass and appendicular skeletal muscle mass, as well as being correlated negatively with body fat percentage. Because the amount of creatinine per unit of skeletal muscle mass and the breakdown rate of creatine are consistent metrics, it was suggested that concentration of plasma creatinine is a stable, direct reflection of skeletal muscle mass.25 Uric acid is another marker of muscle function. The findings of many studies have suggested that uric acid might play a protective role in the decline in muscle strength that occurs with aging. High levels of uric acid might counteract the excessive production of free radicals that damage muscle proteins and diminish muscle mass and strength.26 Macchi et al26 demonstrated that uric acid could have favorable effects on skeletal muscle strength in patients who are older. Molino-Lova et al27 showed that high levels of uric acid in serum were independently associated with better muscle function and that uric acid had a favorable effect on progression of sarcopenia among individuals in the oldest age group. Thus, muscle strength and volume correlate with the level of serum creatinine and uric acid in their physiologic range.
However, the effects of calcitriol on serum creatinine and uric acid have not been addressed sufficiently in the literature. In the current study, all the patients were healthy postmenopausal women who maintained their typical dietary habits and lifestyle and were monitored for only 12 weeks. Patients in this study had serum levels of creatinine and uric acid in the normal range pretreatment and posttreatment. Therefore, we speculate that the observed increases in serum creatinine and uric acid after calcitriol treatment can be attributed to improvements in muscle metabolism. So, we cannot rule out the possibility that the increased muscle strength caused by calcitriol treatment modulated the serum levels of sclerostin, creatinine, and uric acid.
Conclusion
Our results show that circulating concentrations of sclerostin and iPTH were decreased and serum creatinine, uric acid, and muscle strength were enhanced in response to treatment with calcitriol for 12 weeks. A significant correlation was seen among serum sclerostin, serum iPTH, and muscle strength posttreatment. These findings raise the possibility that calcitriol may mediate the levels of iPTH and skeletal anabolic metabolism, which, in turn, further suppresses the production of sclerostin. More research is warranted to dissect this putative physiologic mechanism.
Acknowledgments
We thank Xin Jiang, Hongli Shi, Jiemin Gan, and Huimin Zhou for their work on ELISA detection of sclerostin, FGF-23, and some biomarkers in this study, and we also like to thank all participants of the study and the involved laboratory staff. We also give great thanks to BioMed Proofreading® LLC for getting this manuscript edited by native English-speaking experts. This study was supported by the National Natural Science Foundation of China (NSFC; grant number 81471089), Natural Science Foundation of Shanghai (16411954600), Shanghai Hospital Development Center (SHDC12016201), and Shanghai Municipal Commission of Health (2013ZYJB0801).
Disclosure
The authors report no conflicts of interest in this work.
References
Chen P, Li Z, Hu Y. Prevalence of osteoporosis in China: a meta-analysis and systematic review. BMC Public Health. 2016;16(1):1039–1049. | ||
Cheng Q, Du Y, Hong W, et al. Factors associated to serum 25-hydroxyvitamin D levels among older adult populations in urban and suburban communities in Shanghai, China. BMC Geriatr. 2017;17(1):246. | ||
Canalis E. Management of endocrine disease: novel anabolic treatments for osteoporosis. Eur J Endocrinol. 2018;178(2):R33–R44. | ||
Hay E, Bouaziz W, Funck-Brentano T, Cohen-Solal M. Sclerostin and Bone Aging: A Mini-Review. Gerontology. 2016;62(6):618–623. | ||
Cheng Q, Tang W, Sheu TJ, et al. Circulating TGF-β1 levels are negatively correlated with sclerostin levels in early postmenopausal women. Clin Chim Acta. 2016;455:87–92. | ||
Shimada T, Hasegawa H, Yamazaki Y, et al. FGF-23 is a potent regulator of vitamin D metabolism and phosphate homeostasis. J Bone Miner Res. 2004;19(3):429–435. | ||
Su C, Zhang B, Wang H, et al. [Milk consumption and effects on dietary calcium among Chinese aged 45 and above in 15 provinces, 2015]. Wei Sheng Yan Jiu. 2018;47(2):194–198. Chinese [with English abstract]. | ||
Cheng Q, Zhu X, Zhang X, et al. A cross-sectional study of loss of muscle mass corresponding to sarcopenia in healthy Chinese men and women: reference values, prevalence, and association with bone mass. J Bone Miner Metab. 2014;32(1):78–88. | ||
Burnett-Bowie SM, Henao MP, Dere ME, Lee H, Leder BZ. Effects of hPTH(1-34) infusion on circulating serum phosphate, 1,25-dihydroxyvitamin D, and FGF23 levels in healthy men. J Bone Miner Res. 2009;24(10):1681–1685. | ||
Durosier C, van Lierop A, Ferrari S, Chevalley T, Papapoulos S, Rizzoli R. Association of circulating sclerostin with bone mineral mass, microstructure, and turnover biochemical markers in healthy elderly men and women. J Clin Endocrinol Metab. 2013;98(9):3873–3883. | ||
Sandal G, Pirgon O, Dundar B, Cetin H, Bayram HI. Serum Sclerostin Levels in Newborns Born to Mothers With Vitamin D Deficiency. J Investig Med. 2015;63(7):878–881. | ||
Dawson-Hughes B, Harris SS, Ceglia L, Palermo NJ. Effect of supplemental vitamin D and calcium on serum sclerostin levels. Eur J Endocrinol. 2014;170(4):645–650. | ||
Sankaralingam A, Roplekar R, Turner C, Dalton RN, Hampson G. Changes in Dickkopf-1 (DKK1) and Sclerostin following a Loading Dose of Vitamin D 2 (300,000 IU). J Osteoporos. 2014:7. | ||
Acibucu F, Dokmetas HS, Acibucu DO, Kilicli F, Aydemir M, Cakmak E. Effect of vitamin D treatment on serum sclerostin level. Exp Clin Endocrinol Diabetes. 2017;125(9):634–637. | ||
Cidem M, Karacan I, Arat NB, et al. Serum sclerostin is decreased following vitamin D treatment in young vitamin D-deficient female adults. Rheumatol Int. 2015;35(10):1739–1742. | ||
Setiati S, Anugrahini FJE, Fransiska JE, Tamin TZ, Istanti R. Combination of alfacalcidol and calcium improved handgrip strength and mobility among Indonesian older women: A randomized controlled trial. Geriatr Gerontol Int. 2018;18(3):434–440. | ||
Capatina C, Caragheorgheopol A, Berteanu M, Poiana C. Short-term Administration of Alphacalcidol Is Associated with More Significant Improvement of Muscular Performance in Women with Vitamin D Deficiency Compared to Native Vitamin D. Exp Clin Endocrinol Diabetes. 2016;124(8):461–465. | ||
Tu X, Rhee Y, Condon KW, et al. SOST downregulation and local Wnt signaling are required for the osteogenic response to mechanical loading. Bone. 2012;50(1):209–217. | ||
Leder BZ. Parathyroid Hormone and Parathyroid Hormone-Related Protein Analogs in Osteoporosis Therapy. Curr Osteoporos Rep. 2017;15(2):110–119. | ||
Vincent C, Findlay DM, Welldon KJ, et al. Pro-inflammatory cytokines TNF-related weak inducer of apoptosis (TWEAK) and TNFalpha induce the mitogen-activated protein kinase (MAPK)-dependent expression of sclerostin in human osteoblasts. J Bone Miner Res. 2009;24(8):1434–1449. | ||
Bettis T, Kim BJ, Hamrick MW. Impact of muscle atrophy on bone metabolism and bone strength: implications for muscle-bone crosstalk with aging and disuse. Osteoporos Int. 2018;29(8):1713–1720. | ||
Andrews R, Greenhaff P, Curtis S, Perry A, Cowley AJ. The effect of dietary creatine supplementation on skeletal muscle metabolism in congestive heart failure. Eur Heart J. 1998;19(4):617–622. | ||
Baxmann AC, Ahmed MS, Marques NC, et al. Influence of muscle mass and physical activity on serum and urinary creatinine and serum cystatin C. Clin J Am Soc Nephrol. 2008;3(2):348–354. | ||
Huh JH, Choi SI, Lim JS, Chung CH, Shin JY, Lee MY. Lower Serum Creatinine Is Associated with Low Bone Mineral Density in Subjects without Overt Nephropathy. PLoS One. 2015;10(7):e0133062. | ||
Patel SS, Molnar MZ, Tayek JA, et al. Serum creatinine as a marker of muscle mass in chronic kidney disease: results of a cross-sectional study and review of literature. J Cachexia Sarcopenia Muscle. 2013;4(1):19–29. | ||
Macchi C, Molino-Lova R, Polcaro P, et al. Higher circulating levels of uric acid are prospectively associated with better muscle function in older persons. Mech Ageing Dev. 2008;129(9):522–527. | ||
Molino-Lova R, Sofi F, Pasquini G, et al. Higher uric acid serum levels are associated with better muscle function in the oldest old: results from the Mugello Study. Eur J Intern Med. 2017;41:39–43. |
 © 2018 The Author(s). This work is published and licensed by Dove Medical Press Limited. The full terms of this license are available at https://www.dovepress.com/terms.php and incorporate the Creative Commons Attribution - Non Commercial (unported, v3.0) License.
By accessing the work you hereby accept the Terms. Non-commercial uses of the work are permitted without any further permission from Dove Medical Press Limited, provided the work is properly attributed. For permission for commercial use of this work, please see paragraphs 4.2 and 5 of our Terms.
© 2018 The Author(s). This work is published and licensed by Dove Medical Press Limited. The full terms of this license are available at https://www.dovepress.com/terms.php and incorporate the Creative Commons Attribution - Non Commercial (unported, v3.0) License.
By accessing the work you hereby accept the Terms. Non-commercial uses of the work are permitted without any further permission from Dove Medical Press Limited, provided the work is properly attributed. For permission for commercial use of this work, please see paragraphs 4.2 and 5 of our Terms.