")
Back to Archived Journals » Biosimilars » Volume 5
Label-free interaction analysis as a tool to demonstrate biosimilarity of therapeutic monoclonal antibodies
Authors Sinha-Datta U, Khan S, Wadgaonkar D
Received 27 March 2015
Accepted for publication 12 June 2015
Published 16 September 2015 Volume 2015:5 Pages 83—91
DOI https://doi.org/10.2147/BS.S85537
Checked for plagiarism Yes
Review by Single anonymous peer review
Peer reviewer comments 2
Editor who approved publication: Professor Shein-Chung Chow
Uma Sinha-Datta, Srijit Khan, Dhananjay Wadgaonkar
Fast Trak, GE Healthcare Life Science, John F Welch Technology Centre, Bangalore, India
Abstract: In the biosimilar eon, where various analytical platforms are needed to show biosimilarity, we demonstrate the use of surface plasmon resonance biosensor as a label-free interaction analysis tool to compare two therapeutic monoclonal antibodies (mAb1-i and mAb2-i) with their biosimilars (mAb1-B and mAb2-B1, B2, B3) based on kinetics, affinity, and thermal stability studies. We calculate active analyte concentration using Biacore systems' calibration-free concentration analysis method and demonstrate its importance for kinetic evaluation. The kinetic constants (ka and kd) and affinity constant (KD) of the mAbs for binding to specific antigens were evaluated. It was found that the biosimilars were very similar to their innovator with respect to binding to its antigen demonstrating functional similarity. To further confirm biosimilarity to the originator molecules, we conducted a thermal stability analysis of both mAbs using differential scanning calorimetry. This analysis showed good structural similarity in between innovator antibodies and biosimilars, with major Tm as 84.1°C (mAb1) and 72.8°C (mAb2), demonstrating structural similarity.
Keywords: surface plasmon resonance, Biacore, kinetics, low level of ligand immobilization, calibration-free concentration analysis, bivalent analytes, active concentration
Introduction
Monoclonal antibodies are an important class of proteins, contributing to ~60% of the biotherapeutics against a wide range of diseases. Like any other biotherapeutics, analytical data about structural and functional data of monoclonal antibodies form the foundation for biosimilar development program and can influence decisions about the type and amount of preclinical/clinical data needed. There has been increasing demands for screening methods that can supply high-quality antigen-binding or kinetic data for confident candidate selection, process optimization, in-process monitoring, stability and concentration determination, etc. In contrast to standard label-dependent, end-point screening methods such as ELISA, GE Healthcare’s Biacore systems utilize surface plasmon resonance (SPR) to monitor the association and dissociation of complexes in a real-time manner, facilitating the selection of antibodies based on functionally and structurally relevant kinetic properties.1–8
Binding kinetics is a time-dependent process that determines how fast/slow a complex forms or dissociates within a given time span, and the kinetic parameters (ka and kd) and affinity (KD) are obtained from the sensorgram shape with respect to the mathematical model describing the interaction. The association rate constant, ka, estimation is dependent on the concentration of unbound analytes, whereas the dissociation rate constant, kd, estimation is independent of the unbound analyte concentration.9,10 Hence, in order to obtain correct association rate constant and affinity KD values, it is important that we provide the correct analyte concentration. The correct analyte concentration is the concentration of analyte, which is capable of binding to the surface ligands, contributing to the observed binding.11 This is also known as the active concentration of the ligand. It becomes obvious that with change in ligand, the active concentration of analyte may vary. For example, quantitation of Rituximab (analyte) with anti Fc (ligand) may yield a different concentration when compared to quantitation of Rituximab (analyte) with CD20 (ligand). The traditional methods like UV absorption or colorimetric methods determine the total protein and hence sometime overestimate the analyte concentration. Providing overestimated analyte concentrations usually yield underestimated association rate constants. Concentrations determined using Biacore systems are based on the amount of analyte binding to the ligand or the active concentration. Quantitation via such functional assays usually exploiting functionality may be irrelevant to the kinetic analysis if appropriate ligands are not used for concentration analysis – for instance, measuring total IgG with anti Fc antibody says nothing about the antigen-binding concentration. In addition, the functional assay-based concentration determination generally requires standards where the results are dependent on the functional quality of the standards.12 Biacore systems provide an alternative approach called calibration-free concentration analysis (CFCA), which determines the concentration of the analyte interacting with the ligand under conditions where rate is limited by analyte diffusion to the surface. This is a functional assay based on exactly the same binding characteristics as the kinetic analysis, and it measures the concentration without reference to a calibrated standard.11,13–15 In this paper, we show a procedure for generating high-quality kinetic data for two bivalent analyte monoclonal antibodies using very low levels of ligand immobilization. Such data lead us to compare two monoclonal antibodies functionally. Differential scanning calorimetry (DSC) is used to characterize protein stability in a label-free manner, by directly measuring the enthalpy (ΔH) and temperature (Tm) of thermally induced structural transitions of proteins in solution.16,17
In this era of biosimilars, where various analytical platforms are used to demonstrate the similarity of the biosimilars to its originator, kinetic data comparison plays an important role in comparing the structural and functional similarities.
Materials and methods
Therapeutic antibodies
The originator samples of therapeutic antibodies (mAb1-i and mAb2-i) and the biosimilar mAbs (mAb1-B and mAb2-B1, B2, B3 – three batches), all with total protein concentrations 1 mg · mL−1, were supplied by a leading pharmaceutical company in India. Antigens against the therapeutic antibodies (Ag1 and Ag2) were procured from either Sino Biological Inc. (Beijing, People’s Republic of China) or Thermo Fisher Scientific (Waltham, MA, USA).
Ligand immobilization
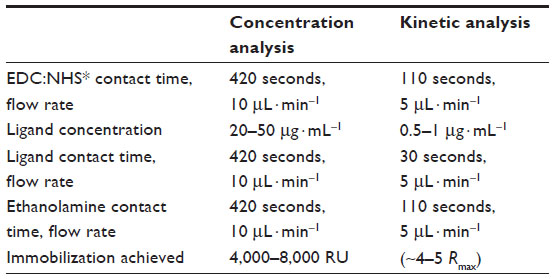
The antigens Ag1 or Ag2 were immobilized as ligands on Series S Sensor Chip CM5 (GE Healthcare, Bio-Sciences AB, Uppsala, Sweden) using amine coupling method with the immobilization wizard template provided in the Biacore T200 control software. For both quantitation and kinetic evaluation, mAbs were used as analytes as shown in Figure 1. For this, the chip surface was first activated using a 1:1 mixture of 0.4 M EDC and 0.1 M NHS (GE Healthcare), followed by covalent linking of the desired antigen with the carboxymethyl groups of the Sensor chip CM5 surface. The antigens were immobilized at pH 5 using 10 mM sodium acetate buffer (GE Healthcare). The unused activated Sensor chip surface was blocked with 1 M ethanolamine (GE Healthcare). Due to the difference in immobilization levels required for concentration and kinetic analysis,18 different immobilization protocols were followed as illustrated in Table 1.
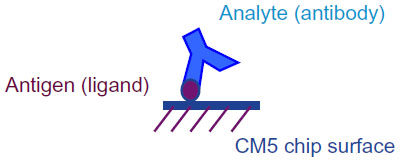 | Figure 1 Biacore T200 experimental setup. |
 | Table 1 Ligand immobilization |
Calibration-free concentration analysis
CFCA was performed using a Biacore T200 (GE Healthcare) to determine the active concentration of the mAbs. Experimental setup was done using the Biacore T200 control software method, and an unmodified Sensor chip surface was used as reference. CFCA was performed in duplicate by running two dilutions of mAbs typically ranging from 500× to 5,000× in HBS-EP+ buffer (GE Healthcare), and each dilution was run at two flow rates: 5 μL · min−1 and 100 μL · min−1. The diffusion coefficient of mAbs was estimated using an online tool to calculate diffusion coefficient based on its molecular weight and shape. The active concentrations were then evaluated using the Biacore T200 analysis software (Figure 2).
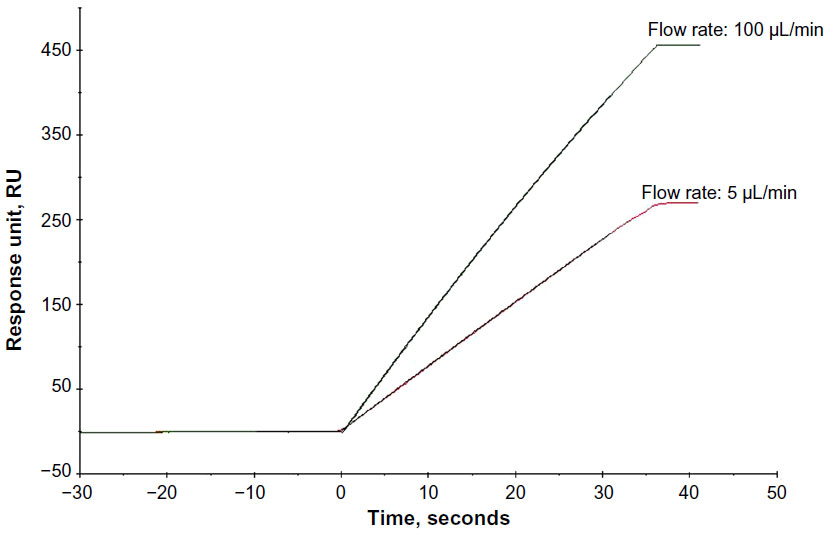 | Figure 2 Calibration-free concentration analysis. |
Kinetic analysis
Kinetic analysis was performed using a Biacore T200 (GE Healthcare). Each kinetic run was set up using the kinetic wizard template with six nonzero concentrations (in series), at least one of the concentration in duplicates (to check the surface performance) and a zero concentration. A blank immobilized surface was used as a reference surface, which was prepared as described in ligand immobilization step but without any ligand. All dilutions were prepared in HBS-EP+ running buffer (GE Healthcare). Regeneration between each cycle was performed using 10 mM glycine (GE Healthcare) at pH 2.5 for 30 seconds. Concentration series used for mAb1 was 0 nM, 1.7 nM, 3.3 nM, 6.7 nM, 16.7 nM, 33.3 nM, and 6.7 nM and that of mAb2 was 0 nM, 33.3 nM, 66.7 nM, 133.3 nM, 266.7 nM, 333.3 nM, and 133.3 nM. Post run, the data were evaluated using the 1:1 kinetic binding model in the Biacore T200 evaluation software to generate ka, kd, and KD.19 The evaluation software also generates chi-square value and U-value to determine the accuracy of these fitted parameters.20 The final kinetics and affinity data generated was an average of two independent kinetic runs.
DSC analysis
DSC analysis was performed using a MicroCal VP-Capillary DSC (Malvern Instruments, Malvern, UK). All mAbs were dialyzed overnight using a mini dialysis kit (GE Healthcare) with 1 kDa cutoff. The dialysis was performed against 1 L of 1× PBS with buffer change every 2 hours of dialysis (two times). Finally, overnight dialysis was performed to remove the formulation buffer and achieve normalized buffer condition for all samples. Approximately 400 μL of 0.5 mg · mL−1 of mAbs were transferred to 96-well plates (Malvern Instruments) and then loaded into the instrument auto sampler thermostated at 5°C until analysis. DSC scans were recorded from 20°C to 110°C at a scan rate of 1°C · min−1 for analysis with Origin 7. Raw DSC data were corrected for the instrumental baseline by subtraction of a corresponding buffer (PBS) reference scan.
Results
Ligand immobilization
In this step, the ligands were covalently linked to the carboxymethylated groups of Sensor Chip CM5. Like most proteins, antigen ligands Ag1 and Ag2 contain several primary amine groups; hence, efficient attachment was achieved without affecting its biological activity. These primary amine groups were covalently attached to the carboxyl group of the dextran matrix of the Series S Sensor Chip CM5 via the amine coupling method. In instances where the primary amine groups are at or near the active site of the ligand, the amine coupling method would result in loss of activity. However, this was not the case with antigens Ag1 and Ag2, and it yielded uniform and consistent binding with the respective mAb analytes.
Two different immobilization protocols were followed for different applications – concentration and kinetic analysis as illustrated in Table 1. For CFCA, the ligand immobilization levels achieved were 4,000–8,000 response unit (RU), whereas for kinetic evaluation extremely low levels of ligands were immobilized. This extreme low level of immobilized ligands can be represented as the maximum binding capacity (Rmax) of the surface, which was maintained to be ~4–5 Rmax for both Ag1 and Ag2.
Calibration-free concentration analysis
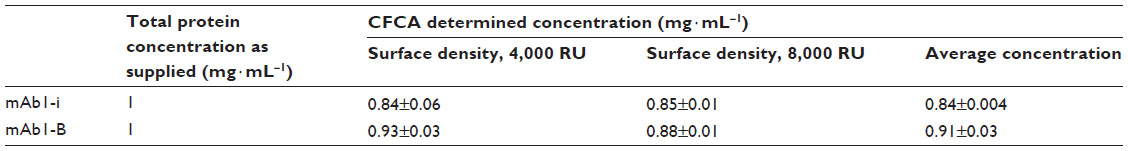
CFCA was performed on two separate surface densities, 4,000 (low) and 8,000 (high) RU. CFCA of mAb1 samples (1 mg · mL−1 each) revealed active concentrations (averaged from both surfaces) of 0.84±0.004 mg · mL−1 (i-originator) and 0.91±0.03 mg · mL−1 (b-biosimilar) with respect to ligand binding. The concentration determined using low- and high-surface densities estimated similar concentrations: 0.84±0.06 mg · mL−1 and 0.85±0.01 mg · mL−1 (mAb1-i) and 0.93±0.03 mg · mL−1 and 0.88±0.01 mg · mL−1 (mAb1-B), respectively (Table 2). CFCA analysis for mAb2 was not performed due to its slow association rate <5×10⁴ M−1 · s−1 (Table 3). Hence, for kinetic evaluation of mAb2 (both originator and biosimilar), total protein concentration (1 mg · mL−1) was used.
 | Table 2 CFCA quantitation of mAb1 |
 | Table 3 Kinetic and affinity data of mAbs |
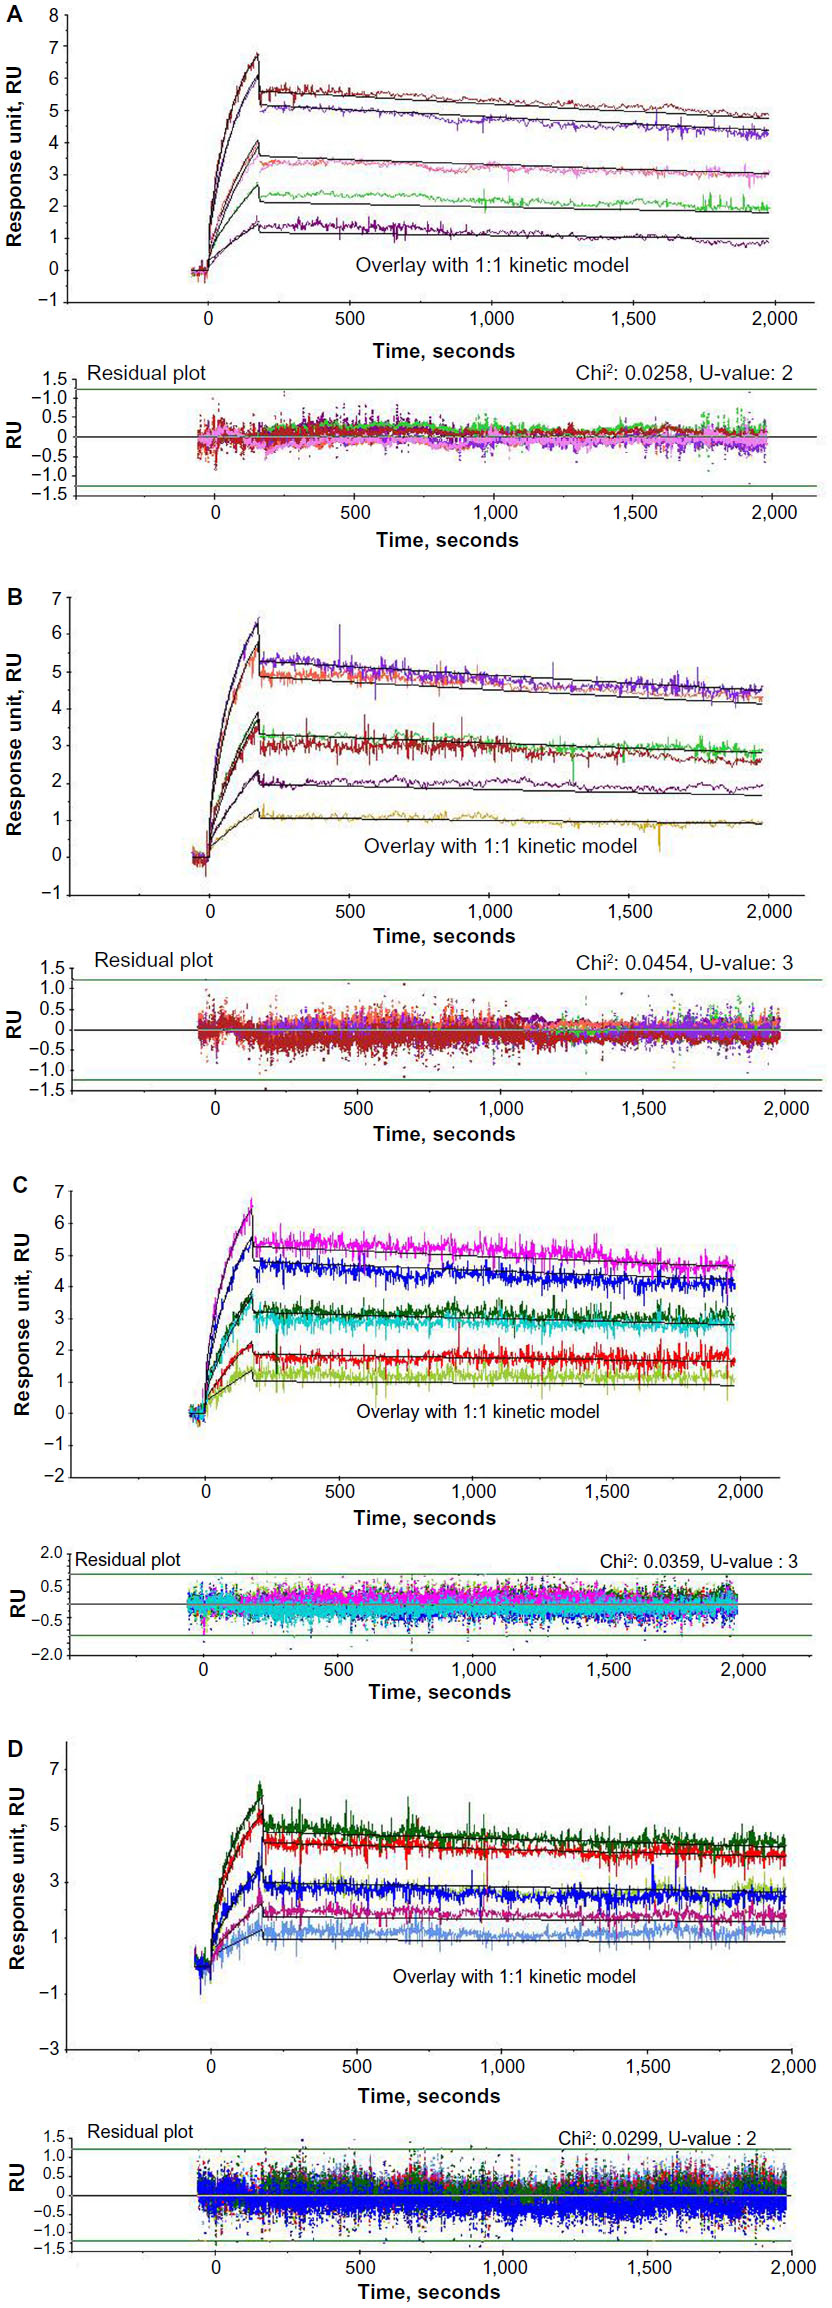
Kinetic analysis
The experimentally derived curve was fitted with the mathematically derived 1:1 curve as shown in Figures 3 and 4. The chi-square values for all the kinetic runs were very low ranging from 0.02 to 0.06, indicating good fit with the 1:1 binding model. The U-values for all the kinetic evaluations ranged from 2 to 5, indicating greater confidence in the evaluated data. Kinetic evaluation of mAb1-i revealed ka: 9.50±0.14 E+05 M−1 · s−1, kd: 8.28±0.12E−05 s−1, and KD: 8.72±0.25E−11 M and that of mAb1-B revealed ka: 9.78±0.67E+05 M−1·s−1, kd: 7.42±0.36E−05 s−1, and KD: 7.59±0.15E−11 M. For mAb2-i, ka: 4.79±2.05E+04 M−1·s−1, kd: 8.53±0.95E−05 s−1, and KD: 2.00±1.06E−09 M; for mAb2-B1, ka: 3.81±0.84E+04 M−1 · s−1, kd: 7.00±2.81E−05 s−1, and KD: 1.97±1.17E−09 M; for B2, ka: 4.00±1.59E+04 M−1 · s−1, kd: 5.91±1.73E−05 s−1, and KD: 1.70±1.11E−09 M; and for B3, ka: 3.69±0.77E+04 M−1 · s−1, kd: 5.79±1.14E−05 s−1, and KD: 1.64±0.65E−09 M (Table 3).
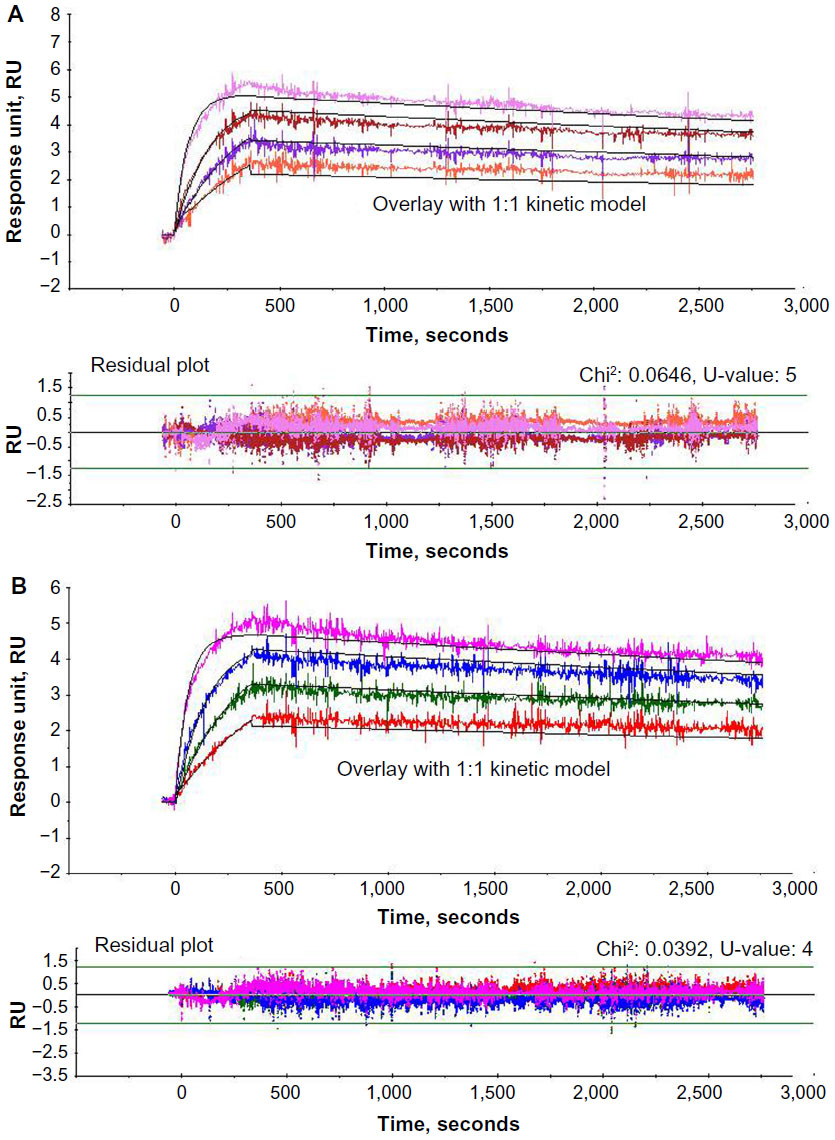 | Figure 3 Kinetic analysis of mAb1. |
 | Figure 4 Kinetic analysis of mAb2. |
DSC analysis
Protein unfolding was evaluated through heat change, and the thermal stability profiles were overlaid using Origin 7 (Figure 5). Examination of all thermogram data ranging between 55°C and 95°C spanned the complete denaturation profile for all samples. Temperatures of the peak maxima, Tm1 and Tm2, were considered for comparison of the originator and biosimilar mAbs. The DSC analysis showed that in case of both mAb1 and mAb2, the thermogram data of originator with respect to their biosimilars are similar and the temperature peak maxima (Tm1 and Tm2) are comparable, Tm1: 72.6°C±0°C, Tm2: 84.2°C±0.1°C (mAb1-i); Tm1: 72.8°C, Tm2: 84.1°C (mAb1-B) (Table 4); Tm1: 72.9°C±0.2°C, Tm2: 86.9°C±0.2°C (mAb2-i); Tm1: 72.8°C, Tm2: 86.7°C (mAb2-B1); Tm1: 72.7°C, Tm2: 86.0°C (mAb2-B2); Tm1: 72.9°C, Tm2: 86.7°C (mAb2-B3) (Table 4).
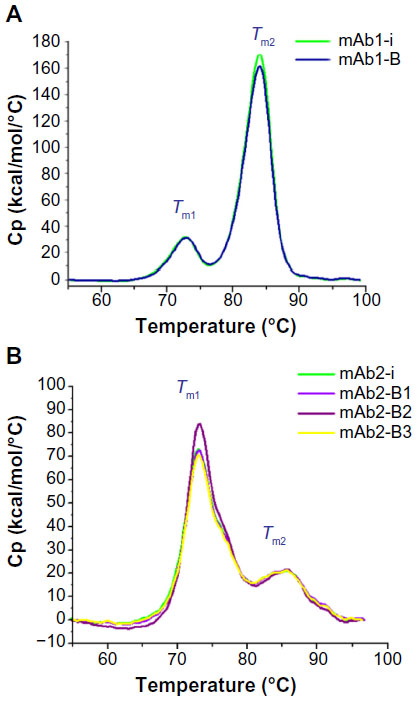 | Figure 5 DSC analysis of mAbs. |
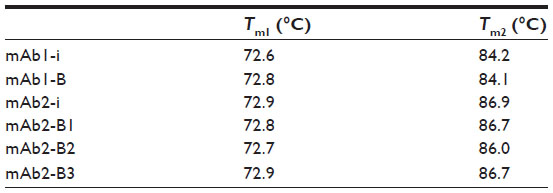 | Table 4 Comparison of melting temperatures of mAbs |
Discussion
CFCA allows active concentration determination with respect to binding to its ligands without the need of calibration standards. The concentration is derived from the binding rate of the analyte under mass-transport limited condition.4 In this study, we calculate the active concentration of mAbs (originator and biosimilar) with respect to its antigen binding, and hence it becomes the most accurate concentration for the kinetic data determination. Consistency of the concentrations evaluated from different ligand densities demonstrates that CFCA is a very robust method for the determination of active concentration. Well-separated initial association rates at two different flow rates (Figure 2) are the indication of adequate mass-transport limitation. The most common reasons for not achieving adequate mass-transport limitation are slow association rates usually <5×10⁴ M−1 · s−1 and molecular weight <5,000 g · mol−1. The kinetic analysis of mAb2 reveals slow/borderline association rates (~3.7–4.8×10⁴ M−1 · s−1) (Table 3); hence, kinetic evaluation was performed using total concentration as provided by the pharmaceutical company.
In this study, we evaluate the kinetic properties of mAbs binding to its antigens. The assay format used for Biacore T200 analysis is illustrated in Figure 1. This format was an easy choice as this allowed reuse of the same surface preparation for both originator and the biosimilar mAbs, thus allowing direct comparison of the mAbs. Avidity refers to binding of the antibody analytes to the surface ligands through two ligand binding sites. Binding of the bivalent analyte to the second site on the ligand does not change the RU, making it difficult to evaluate. To tackle this problem, we immobilized very low levels of ligand (antigen Ag1 or Ag2) such that only one analyte (mAb) is available to bind per ligand molecule and we substantially minimize the bivalency. The amount of ligand immobilized on the surface in such cases of extremely low levels of immobilization can only be determined by the maximum analyte binding capacity of the surface, referred as Rmax. For both the kinetic evaluations, the maximum surface binding capacity was maintained at Rmax 4–5 RUs, which was ensured by passing very high concentrations of analyte (mAbs). This in turn allowed 1:1 kinetic evaluation even with a bivalent antibody analyte.
During the evaluation, the experimentally derived curve was fitted with the mathematically derived 1:1 curve, and the deviation between the two curves was represented as the chi-square value. So, a good fit would have very low chi-square values. U-value is another statistical parameter, which was used to assess the goodness of fit for 1:1 binding. This parameter represents the uniqueness of the calculated rate constants and Rmax, determined by testing the dependence of fitting on correlated variations between selected variables. Lower values <15 indicate greater confidence in the results. A high value (>25) indicates that the reported kinetic constants contain no useful information. The data shown for this study have very low chi-square values ranging from 0.02 to 0.06 and U-value ranging from 2 to 5, thus strengthening the quality of the data generated with this assay procedure.
The kd obtained for both the antigen–analyte pairs were in the range of 10−5 s−1. This shows that the mAbs have slow dissociation rate, ~0.001% dissociation per second. Therefore, time required for 50% dissociation, half-life of the mAb-antigen complex is ~19.25 hours. Both Figures 3 and 4 correlate with this slow dissociation rate evident from the minimal rate of dissociation, as seen in the dissociation phase.
Biosimilar mAb1-B show great similarity with its originator mAb1-i showing very close values of ka, kd, and KD values with respect to its antigen binding (Table 3). The low standard deviation between the two independent experimental runs (<7%) indicate robust assay setup and high reproducibility of the data. mAb2 samples have greater differences in the kinetic values between the originator and biosimilar as compared to mAb1. This is probably due to the high standard deviations between two independent experiments. Like any other analytical tool, the variation in preparation of sample dilutions could result in overall high variation between the experiments. But the variation in the values is also dependent on the particular ligand–analyte pair. In such a case, the acceptable range of standard deviation for the particular ligand–analyte pair should be determined with multiple lots of originator samples to set the acceptance criteria for biosimilarity determination.
In this study, we highlight the use of binding kinetics and concentration analysis determined by SPR and Biacore systems as a tool that can be used to compare originator and biosimilar therapeutic antibodies based on functional properties. The thermal stability analysis using DSC allowed comparison of the antibodies based on their structural stability and provided information to further verify biosimilarity based on structural profile. The versatility of SPR analysis allows further analysis focusing on structural properties, for example, by immobilizing an anti Fc, anti-kappa, anti-acetylation antibodies, etc, followed by detailed binding kinetics analysis, and thereby provide more details for structural comparison between the originator and biosimilar antibodies.
Acknowledgments
We would like to thank Dr Ewa Pol, Scientist, GE Healthcare, Sweden, for reviewing the technical data. We thank Dr Marco Marenchino (Application Specialist, Malvern Instruments) for guiding us during the DSC experimental setup. We would also like to acknowledge Dr Rajesh Bhagwat (Business leader, Thermo Fisher Scientific) for initiating and supporting this project during his tenure in GE.
Disclosure
The authors report no conflicts of interest in this work.
References
Robert Karlsson. SPR for molecular interaction analysis: a review of emerging application areas, J Mol Recognit. 2004;17(3):151–161. | |
Jason-Moller L, Murphy M, Bruno J. Overview of Biacore systems and their applications. Chapter 19, Curr Protoc Protein Sci. 2006. | |
Katsamba PS et.al. Kinetic analysis of a high-affinity antibody/antigen interaction performed by multiple Biacore users., Anal Biochem., 2006; 15;352(2):208–221. | |
Malmborg AC, Borrebaeck CA. BIAcore as a tool in antibody engineering. J Immunol Methods. 1995;183(1):7–13. Review. | |
Alfthan K. Surface plasmon resonance biosensors as a tool in antibody engineering. Biosens Bioelectron. 1998;15;13(6):653–663. Review. | |
Fivash M, Towler EM, Fisher RJ. BIAcore for macromolecular interaction. Curr Opin Biotechnol. 1998;9(1):97–101. Review. | |
Malmqvist M. BIACORE: an affinity biosensor system for characterization of biomolecular interactions. Biochem Soc Trans. 1999;27(2):335–340. Review. | |
Löfås S. Optimizing the hit-to-lead process using SPR analysis. Assay Drug Dev Technol. 2004;2(4):407–415. Review. | |
Robert J Fisher, Matthew Fivash. Surface plasmon resonance based methods for measuring the kinetics and binding affinities of biomolecular interactions. Current Opinion in Biotechnology, 1994;5(4):389–395. | |
Stephen Hearty, Paul Leonard, and Richard O’Kennedy. Measuring Antibody–Antigen Binding Kinetics Using Surface Plasmon Resonance Antibody. Engineering: Methods and Protocols, Second Edition, Methods in Molecular Biology, vol. 907 | |
Ewa pol. The importance of correct protein concentration for kinetics and affinity determination in structure-function analysis. JoVE, 2010. | |
Malmqvist M, Karlsson R. Biomolecular interaction analysis: affinity biosensor technologies for functional analysis of proteins. Curr Opin Chem Biol. 1997;1(3):378–383. Review. | |
Christensen LL. Theoretical analysis of protein concentration determination using biosensor technology under conditions of partial mass transport limitation. Anal Biochem. 1997;249(2):153–164. Review. | |
Richalet-Sécordel PM, Rauffer-Bruyère N, Christensen LL, Ofenloch-Haehnle B, Seidel C, Van Regenmortel MH. Concentration measurement of unpurified proteins using biosensor technology under conditions of partial mass transport limitation. Anal Biochem. 1997;249(2):165–173. | |
Sigmundsson K, Másson G, Rice R, Beauchemin N, Obrink B. Determination of active concentrations and association and dissociation rate constants of interacting biomolecules: an analytical solution to the theory for kinetic and mass transport limitations in biosensor technology and its experimental verification. Biochemistry. 2002;41(26):8263–8276. | |
Wen J, Arthur K, Chemmalil L, Muzammil S, Gabrielson J, Jiang Y. Applications of differential scanning calorimetry for thermal stability analysis of proteins: qualification of DSC. J Pharm Sci. (2012) | |
Bruylants G, Wouters J, Michaux C. Differential Scanning Calorimetry in Life Science: Thermodynamics, Stability, Molecular Recognition and Application in Drug Design. Current Medicinal Chemistry (2005). | |
Goldstein B, Coombs D, He X, Pineda AR, Wofsy C. The influence of transport on the kinetics of binding to surface receptors: application to cells and BIAcore. J Mol Recognit. 1999;12(5):293–299. Review. | |
Lipschultz CA, Li Y, Smith-Gill S. Experimental design for analysis of complex kinetics using surface plasmon resonance. Methods. 2000;20(3):310–318. Review. | |
Annica Önell and Karl Andersson. Kinetic determinations of molecular interactions using Biacore—minimum data requirements for efficient experimental design. J. Mol. Recognit. 2005;18:307–317. |
 © 2015 The Author(s). This work is published and licensed by Dove Medical Press Limited. The full terms of this license are available at https://www.dovepress.com/terms.php and incorporate the Creative Commons Attribution - Non Commercial (unported, v3.0) License.
By accessing the work you hereby accept the Terms. Non-commercial uses of the work are permitted without any further permission from Dove Medical Press Limited, provided the work is properly attributed. For permission for commercial use of this work, please see paragraphs 4.2 and 5 of our Terms.
© 2015 The Author(s). This work is published and licensed by Dove Medical Press Limited. The full terms of this license are available at https://www.dovepress.com/terms.php and incorporate the Creative Commons Attribution - Non Commercial (unported, v3.0) License.
By accessing the work you hereby accept the Terms. Non-commercial uses of the work are permitted without any further permission from Dove Medical Press Limited, provided the work is properly attributed. For permission for commercial use of this work, please see paragraphs 4.2 and 5 of our Terms.