")
Back to Journals » International Journal of Nanomedicine » Volume 13
Involvement of complement activation in the pulmonary vasoactivity of polystyrene nanoparticles in pigs: unique surface properties underlying alternative pathway activation and instant opsonization
Authors Mészáros T , Kozma GT , Shimizu T, Miyahara K, Turjeman K, Ishida T, Barenholz Y, Urbanics R , Szebeni J
Received 3 January 2018
Accepted for publication 24 May 2018
Published 11 October 2018 Volume 2018:13 Pages 6345—6357
DOI https://doi.org/10.2147/IJN.S161369
Checked for plagiarism Yes
Review by Single anonymous peer review
Peer reviewer comments 3
Editor who approved publication: Dr Thomas Webster
Tamás Mészáros,1,2,* Gergely Tibor Kozma,2,* Taro Shimizu,3 Koga Miyahara,3 Keren Turjeman,4 Tatsuhiro Ishida,3 Yechezkel Barenholz,4 Rudolf Urbanics,1,2 János Szebeni1,2,5
1Nanomedicine Research and Education Center, Department of Pathophysiology, Semmelweis University, Budapest, Hungary; 2SeroScience Ltd, Budapest, Hungary; 3Department of Pharmacokinetics and Biopharmaceutics, Institute of Biomedical Sciences, Tokushima University, Tokushima, Japan; 4Laboratory of Membrane and Liposome Research, Department of Biochemistry and Molecular Biology, Institute for Medical Research Israel-Canada (IMRIC), The Hebrew University-Hadassah Medical School, Jerusalem, Israel; 5Department of Nanobiotechnology and Regenerative Medicine, Faculty of Health, Miskolc University, Miskolc, Hungary
*These authors contributed equally to this work
Background: It has been proposed that many hypersensitivity reactions to nanopharmaceuticals represent complement (C)-activation-related pseudoallergy (CARPA), and that pigs provide a sensitive animal model to study the phenomenon. However, a recent study suggested that pulmonary hypertension, the pivotal symptom of porcine CARPA, is not mediated by C in cases of polystyrene nanoparticle (PS-NP)-induced reactions.
Goals: To characterize PS-NPs and reexamine the contribution of CARPA to their pulmonary reactivity in pigs.
Study design: C activation by 200, 500, and 750 nm (diameter) PS-NPs and their opsonization were measured in human and pig sera, respectively, and correlated with hemodynamic effects of the same NPs in pigs in vivo.
Methods: Physicochemical characterization of PS-NPs included size, ζ-potential, cryo-transmission electron microscopy, and hydrophobicity analyses. C activation in human serum was measured by ELISA and opsonization of PS-NPs in pig serum by Western blot and flow cytometry. Pulmonary vasoactivity of PS-NPs was quantified in the porcine CARPA model.
Results: PS-NPs are monodisperse, highly hydrophobic spheres with strong negative surface charge. In human serum, they caused size-dependent, significant rises in C3a, Bb, and sC5b-9, but not C4d. Exposure to pig serum led within minutes to deposition of C5b-9 and opsonic iC3b on the NPs, and opsonic iC3b fragments (C3dg, C3d) also appeared in serum. PS-NPs caused major hemodynamic changes in pigs, primarily pulmonary hypertension, on the same time scale (minutes) as iC3b fragmentation and opsonization proceeded. There was significant correlation between C activation by different PS-NPs in human serum and pulmonary hypertension in pigs.
Conclusion: PS-NPs have extreme surface properties with no relevance to clinically used nanomedicines. They can activate C via the alternative pathway, entailing instantaneous opsonization of NPs in pig serum. Therefore, rather than being solely C-independent reactivity, the mechanism of PS-NP-induced hypersensitivity in pigs may involve C activation. These data are consistent with the “double-hit” concept of nanoparticle-induced hypersensitivity reactions involving both CARPA and C-independent pseudoallergy.
Keywords: adverse drug reactions, immunotoxicity, nanoparticles, pseudoallergy, anaphylatoxins, PIM cells, phagocytosis
Introduction
Intravenous (IV) therapy with nanoparticle-based medicines (nanomedicines), as well as with many other biologics and nonbiological complex drugs and agents can cause hypersensitivity reactions (HSRs), also known as “infusion” or “anaphylactoid” reactions. The rapidly arising symptoms, including but not limited to shortness of breath, facial redness and swelling, chest pain, back pain, flushing, rash, chills, panic and fever, are also typical of acute (type 1) allergy; however, a role for IgE has not been demonstrated in most of these reactions. As such, by basic immunology definition, these HSRs are “pseudoallergies”.
Based on the association of complement (C) activation with many of these adverse reactions, the term “complement-activation-related pseudoallergy” (CARPA) was introduced1 and with time increasingly considered as a clinically relevant concept in liposomal chemotherapy and other areas of IV pharmacotherapy,2–5 most recently in the medical use of nanoparticulate iron.6,7 Nevertheless, a recent review questioned the pseudoallergic nature of these HSRs, the role of C, and the use of pigs as a relevant model.8 The review concluded that “at present, current experimentally derived evidence is more in support of the rapid phagocytic response (RPR) hypothesis” (vs CARPA), essentially claiming that macrophage “bulimia” explains the HSRs independently of C activation. The assertion was not limited to the special case of polystyrene nanoparticle (PS-NP)-induced HSRs in pigs that an earlier study examined,9 but was proposed as a new theory of HSRs to compete with the CARPA concept.8
The experimental foundation of the RPR hypothesis was a joint international study involving pig experiments in our laboratory, wherein the animals were injected with PS-NPs of different shapes (spheres, rods, and disks), and the hemodynamic changes they caused were correlated with C activation by these particles in pig blood in vitro. It was found that the strongest pulmonary hypertensive effect of spherical PS-NPs, taken as a measure of HSRs, correlated with the clearance of these particles from the blood of mice in vivo, as well as with their rapid uptake by cultured macrophages, but not with C activation in a whole-blood assay in vitro.9 The inhibition of pulmonary reactivity by the macrophage inhibitor clodronate-containing liposomes was also taken as evidence of the causal role of macrophages in these reactions.9
While these data undoubtedly indicated a role of macrophages in HSRs, their interpretation as evidence for the absence of a role of C was recently revisited and reassessed,10 leading to the proposal that C activation could not be ruled out as a contributing mechanism of PS-NP-induced HSRs in pigs, at least on the basis of in vitro ELISA assays in pig whole blood.8 Here, we continued studying PS-NP-induced HSRs in pigs to provide experimental data pro or contra one of these theories.
Materials and methods
Materials
Carboxylated PS polybead microspheres (ie, PS-NPs) of 200, 500, and 750 nm diameter were purchased from Polysciences, Inc. (Warrington, PA, USA). The concentration (NPs/mL) was given by the manufacturer.11 A highly pure lipid mixture of hydrogenated soybean phosphatidylcholine (HSPC), cholesterol, and 1,2-distearoyl-sn-glycero-3-phosphoethanolamine-N-[methoxy(polyethylene glycol)-2,000] (DSPE-PEG2,000) 3:1:1 w:w was purchased from Lipoid (Ludwigshafen, Germany). Rose bengal (RB) and disodium salt were purchased from Alfa Aesar (Haverhill, MA, USA). The antiporcine C5b-9 (C9 neoepitope [C9neo]) (AE11) antibody was obtained from Thermo Fisher Scientific (Waltham, MA, USA), and fluorescein isothiocyanate (FITC)-conjugated antihuman C3b/iC3b (7C12) from Dr Ronald Taylor (University of Pennsylvania). Studies have shown 7C12 to cross-react with pig C3b/iC3b. MicroVue ELISA kits for human C3a, sC5b-9, Bb, and C4d were obtained from Teco Medical (Sissach, Switzerland). Zymosan and EDTA were from Sigma-Aldrich Co. (St Louis, MO, USA).
Preparation of liposomes
PEGylated nanoliposomes with the lipid composition of HSPC–cholesterol–DSPE-PEG2,000 (3:1:1 w:w) were prepared as described previously.12,13 In short, lipids were dissolved in absolute ethanol at 62°C–65°C, followed by hydration by ultrapure water to form multilamellar vesicles. These were downsized to form small unilamellar vesicles by stepwise extrusion through polycarbonate membranes (Osmonics, Trevose, PA, USA) using a Lipex extruder (Transferra Nanosciences, Burnaby, BC, Canada) starting at a pore diameter of 400 nm and ending at a pore diameter of 100 nm.
Physicochemical analysis of PS-NPs
Size and size distribution of PS-NPs were determined by dynamic light scattering.14 The ζ-potential was determined with a Zetasizer Nano ZS (Malvern Instruments, Malvern, UK) using sodium nitrate as electrolyte at 150 and 1.5 mM (high and low conductivity, respectively). Of note, sodium nitrate is much less destructive to electrodes than sodium chloride and has almost identical osmotic pressure and conductivity (Kanaan and Barenholz unpublished results). The morphology of PS-NPs was analyzed by cryo-transmission electron microscopy (cryo-TEM).15 Surface hydrophobicity was assessed by measuring the adsorption of the xanthene dye Rose bengal (RB) to NPs as described earlier.16 Briefly, 0.04 mg/mL RB (final concentration) was incubated with PS-NPs at increasing concentrations for 2 hours, followed by separation of NPs from the supernatant by ultracentrifugation at 155,000 g. Free RB was determined in the supernatant by reading OD550. For all these measurements, PEGylated (doxorubicin-free Doxil-like)13 nanoliposomes were used as reference. The surface area (SA) of PS-NPs and liposomes was calculated assuming that they were monodisperse, with diameter equal to the hydrodynamic diameter measured using dynamic light scattering. Total SA of PS-NPs was calculated according to the number of particles in each batch specified by the vendor,11 and for liposomes, it was measured with NanoSight tracking analysis (NanoSight NS300; Malvern Instruments).
Flow cytometry analysis of iC3b deposition and terminal complex (C5b-9) formation on PS-NPs in pig serum in vitro
A mixture of 500 and 750 nm PS-NPs was incubated with pig serum (1:39 volume ratio) at 37°C in a heated shaker. Concentrations of beads were adjusted to present an equal surface of 0.3 cm2/mL serum. Aliquots were taken at 0, 1, 3, 5, and 20 minutes, and C activation was terminated by adding an equal volume of ice-cold Dulbecco’s PBS (w/o Ca2+/Mg2+) containing 40 mM EDTA. PS-NPs incubated with serum for 20 minutes + 20 mM EDTA served as negative control for C activation. Subsequently, PS-NPs were pelleted by centrifugation (5,000 g for 6 minutes at 4°C), followed by washing twice in staining buffer (PBS–3% FBS–0.05% sodium azide). Particles were stained with anti-iC3b-FITC antibody (7C12) or anti-C9neo antibody (aE11) for 30 minutes at 4°C. After washing, anti-C9neo-labeled particles were further processed for indirect staining with PE-labeled antimouse antibody (BioLegend, San Diego, CA, USA) in staining buffer for 30 minutes at 4°C. Zero-minute samples were also stained directly by PE-labeled secondary antibody without aE11 to get the fluorescence background of anti-C9neo. Antibody and bead concentrations were the same in each group. After washing, flow cytometry was performed by FACScan (Becton-Dickinson, Franklin Lakes, NJ, USA) using Kaluza software for data analysis. Beads were discriminated by their side scattering signals and were identified from a single particle gate identified by the shortest width of FL2. The arithmetic mean value of FL1 (anti-iC3b-FITC staining) or FL2 (indirect anti-C9neo and secondary antibody-only staining) were identified for both bead populations. Preliminary studies showed no correlations between particle counts and fluorescence.
Detection of in vitro C activation by PS-NPs in pig serum by Western blot analysis
PS-NPs (diameters 200, 500, and 750 nm) were incubated with pig serum (Oriental Yeast, Tokyo, Japan) at 1:9 (v:v) for 2–30 minutes (final concentration 145 cm2/mL) at 37°C. Then, the mixture was diluted with 0.1% sodium dodecyl sulfate (SDS) buffer and then subjected to separation on a 5%–20% SDS polyacrylamide-gel electrophoresis-gradient gel under reducing conditions and transferred electrophoretically onto Hybond ECL (GE Healthcare UK Ltd, Little Chalfont, UK). The membrane was blocked with PBS/0.05% Tween 20 and 3% nonfat dry milk powder for 1 hour at room temperature. After three washes with PBS/0.05% Tween 20, membranes were incubated with anti-pig C3 antibody (rabbit polyclonal antibody, 1:1,000; LifeSpan Biosciences, Seattle, WA, USA) overnight at 4°C. After three washes, the membranes were incubated with HRP-conjugated anti-rabbit IgG (1:10,000; Thermo Fisher Scientific) for 1 hour at room temperature. After an additional three washes, the membranes were processed for enhanced chemiluminescence using ECL Plus chemiluminescence reagent (GE Healthcare UK Ltd). The obtained images were analyzed using an LAS-4000 EPUV mini and Multi Gauge version 3.2 (Fujifilm, Tokyo, Japan).
Detection of in vitro C activation by PS-NPs in human serum by ELISA
Normal human sera from healthy volunteers were incubated PS-NPs (volume ratio 1:4) of 200, 500, and 750 nm diameter for 45 minutes at 37°C in a shaker. The NP number in each sample was adjusted to 72.5 mm2/mL, based on SA calculations. The reaction was terminated with the sample diluents of the ELISA kits supplemented with 10 mM EDTA. Measurement of C3a, sC5b- sC5b-9, Bb, and C4d in the same samples was done with the respective ELISA kits by following the manufacturer’s instructions. OD was measured in a 96-well plate reader (FluoStar Omega, BMG Labtech, Ortenberg, Germany).
Monitoring of PS-NP-induced hemodynamic changes in pigs
The details of pig experiments were the same as described earlier.1,9,17,18 In brief, mixed breed male Yorkshire–Hungarian White Landrace pigs (2–3 months old, 18–22 kg) were obtained from the Animal Breeding and Nutrition Research Institute (Budapest, Hungary). Animals were sedated with Calypsol/xylazine and then anesthetized with isoflurane (2%–3% in O2). Intubation was performed with endotracheal tubes to maintain free airways and enable controlled ventilation if necessary. The animals were breathing spontaneously during the experiments. Surgery was done after povidone iodine (10%) disinfection of the skin. In order to measure pulmonary arterial pressure (PAP), a Swan–Ganz catheter (AI-07124, 5 Fr, 110 cm; Teleflex, Research Triangle Park, NC, USA) was introduced into the pulmonary artery via the right external jugular vein. Additional catheters were placed into the left femoral artery to record systemic arterial pressure, to the left external jugular vein for saline and drug administration, and to the left femoral vein for blood sampling. Heart rate was measured from electrocardiography signals, recorded through foam type Ag/AgCl monitoring electrodes (2228; 3M Health Care, Saint Paul, MN, USA). Blood pressure and heart rate signals were evaluated by LabChart Pro version 8 software (ADInstruments, Dunedin, New Zealand). All experiments were performed following national guidelines and regulations (40/2013. II. 14. government decree on animal testing) and ethical and legal permits obtained from Semmelweis University’s Veterinary Health and Ethical Committee and the Metropolitan Veterinary and Food Chain Inspection Station in Budapest, Hungary.
Treatment of pigs with PS-NPs
PS-NP test samples and zymosan were injected in the animals as bolus (<5 seconds) into the jugular vein, followed by a 5 mL wash with saline. Concentrations of different NPs in the stocks were adjusted to equal total SA, specified in the text.
Statistical analyses
Statistical methods applied included paired and unpaired t-tests, one-way ANOVA followed by Tukey’s multiple comparison, linear regression, and correlation analyses, as specified in the text. These analyses were performed using GraphPad Prism software (GraphPad Software, La Jolla, CA, USA).
Results
Physicochemical features of PS-NPs and liposomes
PS-NP dispersions and PEGylated liposomes were characterized for size, charge, morphology, and hydrophobicity. The results are shown in Table 1 and Figure 1A and B. Table 1 shows that all PS-NP dispersions and liposomes had unimodal, relatively narrow size distribution. It is also seen in the table that PS-NPs had strong negative surface charge at both low and high ionic strength, wherein the former values were closer to the “real” electric surface potential of PS-NPs, while the latter reflected more the conditions in biological fluids, such as plasma.19 In contrast to PS-NPs, PEGylated liposomes displayed only slight negative (practically neutral) surface charge at high ionic strength.
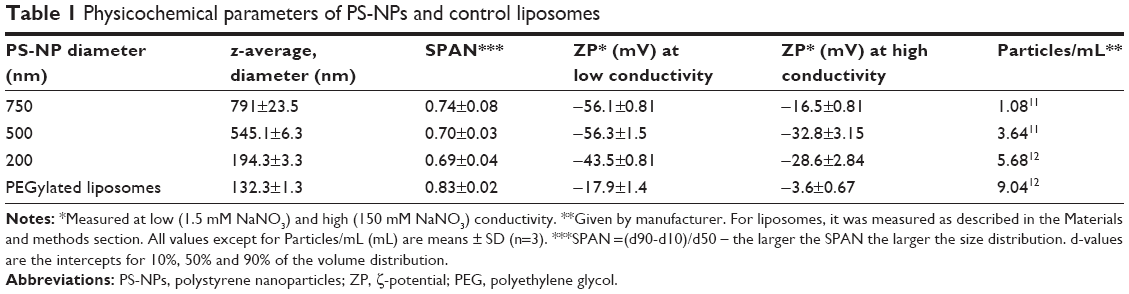 | Table 1 Physicochemical parameters of PS-NPs and control liposomes |
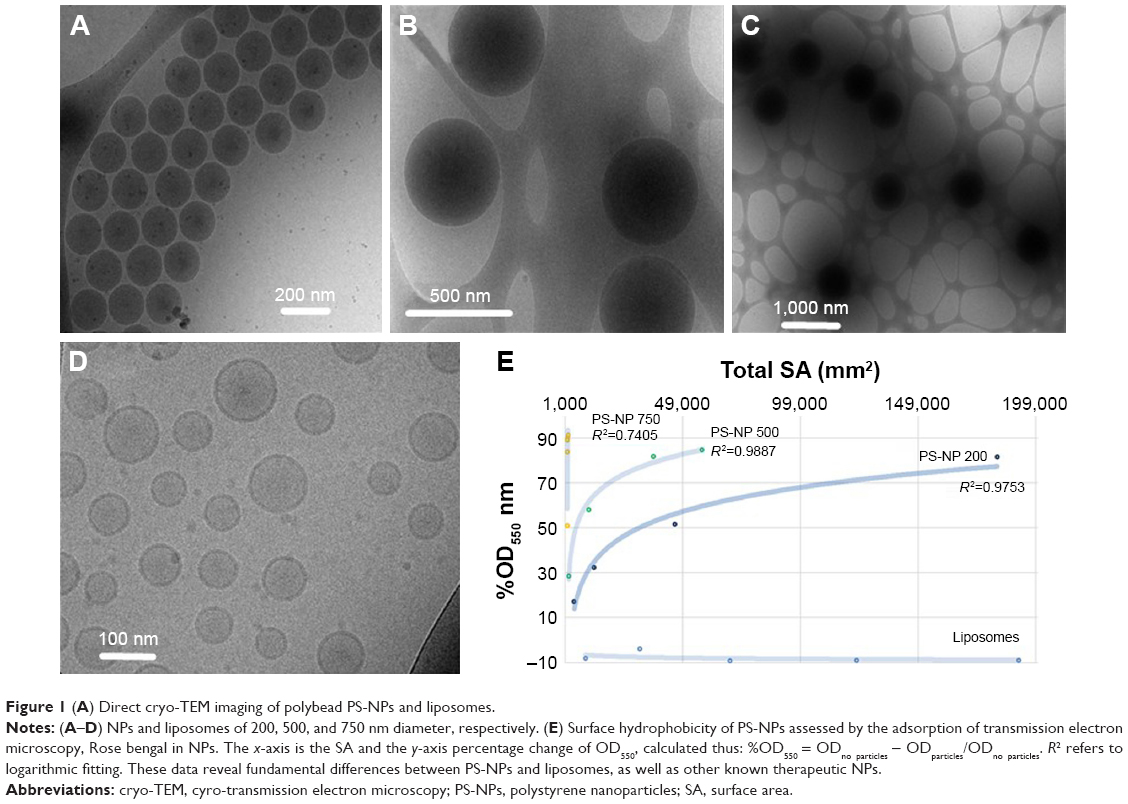 | Figure 1 (A) Direct cryo-TEM imaging of polybead PS-NPs and liposomes. |
Direct cryo-TEM imaging showed PS-NPs as dense black spheres with diameters corresponding to the vendor-specified values of 200, 500, and 750 nm11 (Figure 1A–C). Unilamellar PEGylated nanoliposomes were visible as black rings (Figure 1D). Measuring the partition of RB between phospholipid membranes and the water phase has been used in pharmaceutical studies to determine the surface hydrophobicity of NP drug-delivery vehicles.16 The assay principle is that the level of dye adsorption per unit of SA is directly proportional to the surface hydrophobicity, and the higher the hydrophobicity, the higher the adsorption. As shown in Figure 1E, plotting of OD550 against total particle SA resulted in a logarithmic curve for 200 and 500 nm PS-NPs, while the 750 nm PS-NPs adsorbed over 90% of the RB at very low concentration. PEGylated liposomes, on the other hand, did not adsorb the dye at all. Furthermore, the OD550/unit SA was proportional with NP size and reached a plateau, suggesting saturation of binding and particle geometry (curvature) having an inverse impact on adsorption. Possibly, the lower curvature with flatter surface plane favored the binding of RB. In conclusion, PS-NPs showed significant differences from PEGylated liposomes in surface charge, hydrophobicity, and internal content. Moreover, hydrophobicity depended on NP size, with absolute values increasing in the order 200<500<750 nm diameter.
Complement activation by PS-NPs in pig serum: flow cytometry evidence of terminal complex and C3b deposition
The flow cytometry histograms in Figure 2A illustrate the binding of C5b-9 and iC3b to 500 and 750 nm PS-NPs, reflected in the increased fluorescence of gated PS-NPs after 1 and 20 minutes’ incubation. Except for C5b- sC5b-9 binding to 500 nm PS-NPs, such increases were observed in four of seven pigs’ sera for both labels. Figure 2B shows that maximal changes compared to baseline were significant (P<0.05); nevertheless, the fact that positivity was not observed in all sera points to individual variation in C activation and deposition. The delay of maximal staining of iC3b vs C5b-9 (1 vs 20 minutes) in individual pigs is consistent with the kinetics of the formation of these C-activation byproducts, the former testifying for C5b and hence C5a formation, while the appearance of iC3b provides evidence of opsonization. Interestingly, 750 nm PS-NPs displayed stronger expression of these C-activation markers than 500 nm NPs, a difference that returned in other experiments of this study. Of note, 200 nm PS-NPs were not tested, as they were invisible to our flow cytometry instrument.
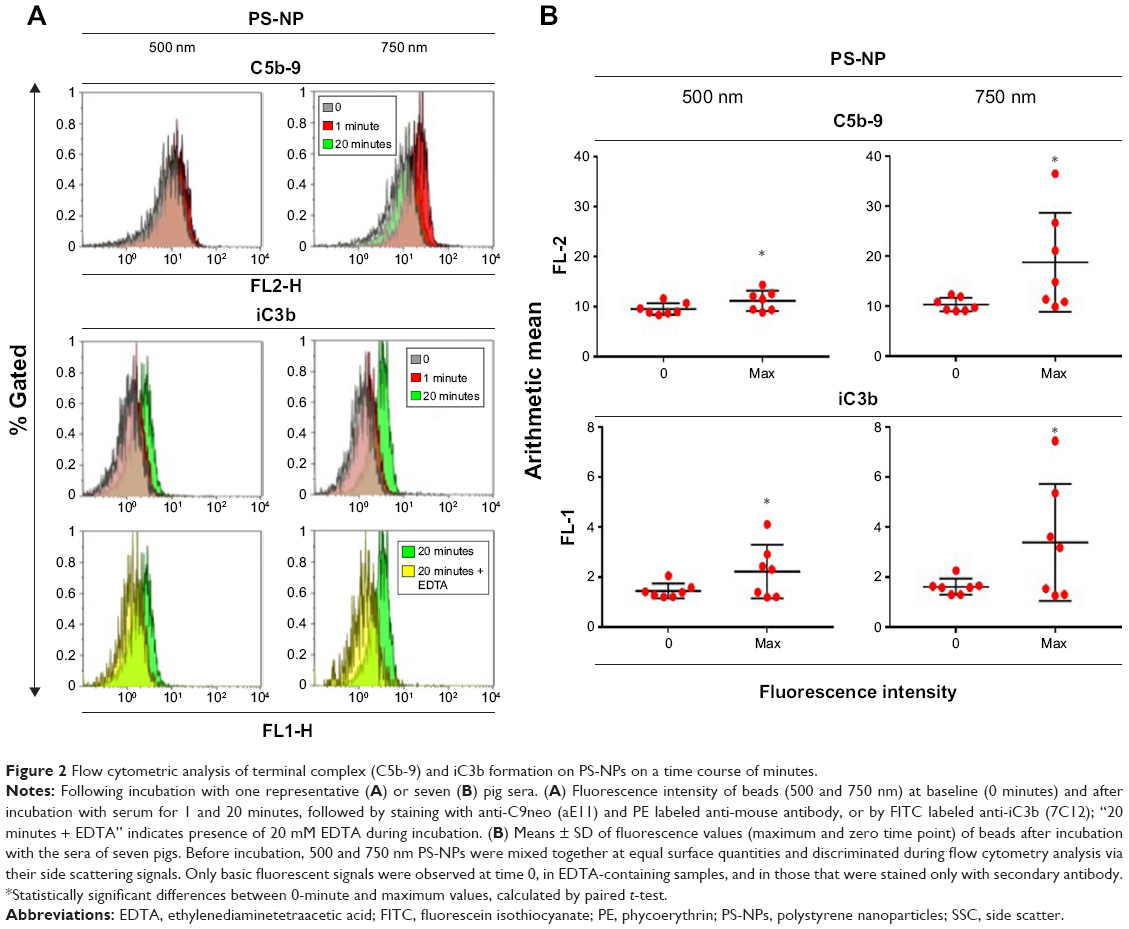 | Figure 2 Flow cytometric analysis of terminal complex (C5b-9) and iC3b formation on PS-NPs on a time course of minutes. |
Western blot evidence for opsonization of PS-NPs in pig serum
Immunochemical analysis of C3 following incubation with PS-NPs showed rapid time-dependent formation of bands below 60–70 kDa in case of 500 and 750 nm, but not 200 nm NPs. This observation indicates iC3b formation and its further proteolytic fragmentation on >200 nm PS-NPs (framed in red on Figure 3). Based on human data,20,21 the larger fragments can tentatively be identified as iC3b α’1 (Figure 3, upper red box) while the smaller fragments correspond to iC3b α’2 and/or C3dg and/or C3d (Figure 3, lower red box). Consistent with other findings in this study, the formation of α’2, C3dg and/or C3d was most pronounced on 750 nm PS-NPs. Since iC3b, C3dg and C3d are all known opsonins, these data provide evidence for PS-NP opsonization on a time scale of minutes.
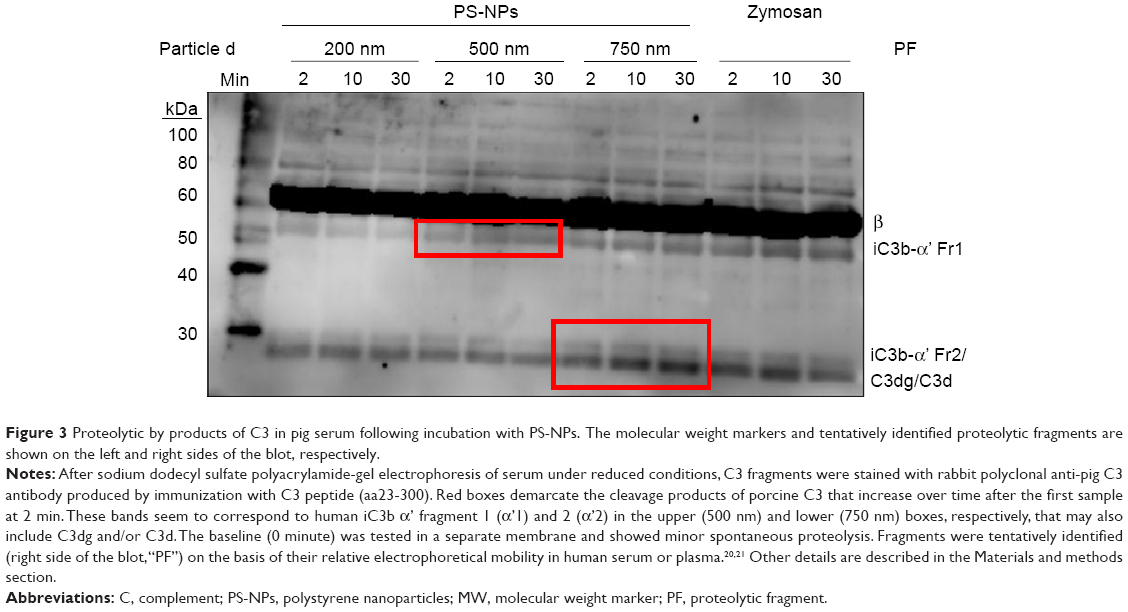 | Figure 3 Proteolytic by products of C3 in pig serum following incubation with PS-NPs. The molecular weight markers and tentatively identified proteolytic fragments are shown on the left and right sides of the blot, respectively. |
Complement activation by PS-NPs in normal human sera: dose and time dependence and activation pathway
Figure 4 shows that spherical 500 and 750 nm PS-NPs caused significant rises in sC5b-9 relative to PBS control, while 200 nm particles had only a minor, insignificant effect. The former data are in keeping with other studies on C activation by PS-NPs in human serum9,22 and are in sharp contrast with the lack of activation by the same PS-NPs in pig serum under similar conditions (inset in Figure 4).9
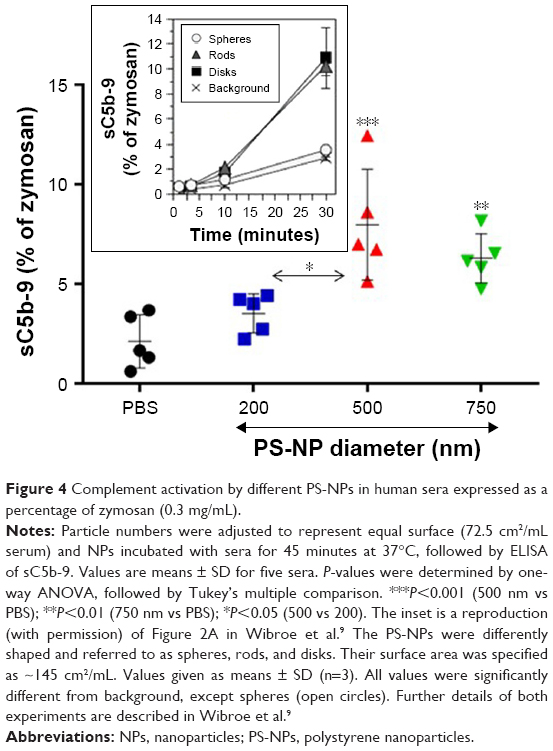 | Figure 4 Complement activation by different PS-NPs in human sera expressed as a percentage of zymosan (0.3 mg/mL). |
Since total SA was the same with all three NP types, the differences observed in sC5b-9 formation point to membrane curvature having an impact on C activation. Considering the surface requirement of C3-convertase assembly and hence launching of the terminal pathway, it is very likely that the flatter surface of larger particles played a role in their increased C activation.
Pathway of complement activation by PS-NPs in human sera
Figure 5 shows the effects of 200, 500, and 750 nm PS-NPs (of equal total SA) on C3a, Bb, sC5b-9, and C4d levels following incubation with different normal human serum (n=3–5) for 45 minutes. Consistently with Figure 4, 500 and 750 nm PS-NPs caused significant elevation sC5b-9, and C3a and Bb showed similar changes. On the other hand, C4d did not change. The latter observation, together with the significant rise of Bb, indicates alternative pathway activation.
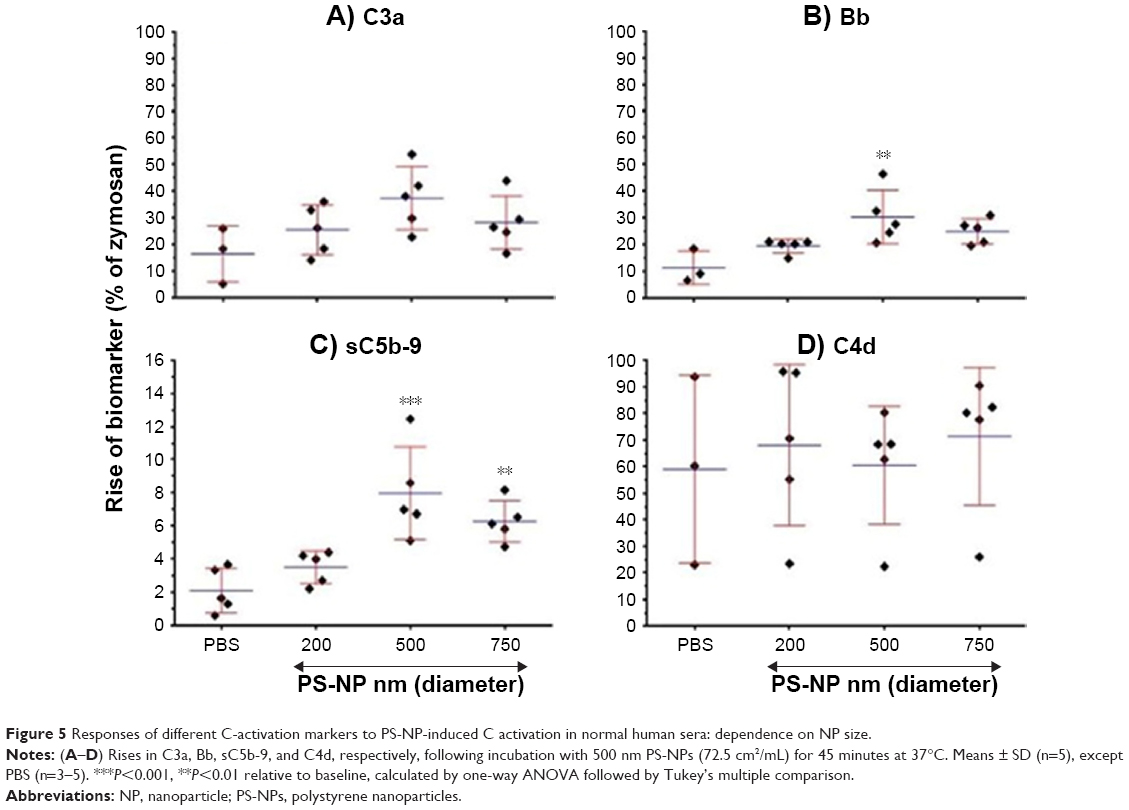 | Figure 5 Responses of different C-activation markers to PS-NP-induced C activation in normal human sera: dependence on NP size. |
The expression of C activation as percentage of zymosan in Figure 5 allows yet another conclusion: that C activation by PS-NPs was relatively weak compared to the effect of zymosan, at least under the conditions studied. It was a maximum of 10%–40% of the strength of zymosan for C3a and Bb taken as end points, and even less, <10%, with sC5b-9 readout. On the other hand, C4d increases were not significantly different from that caused by zymosan, which is in keeping with the fact that zymosan is primarily an alternative pathway activator.
Complement activation by PS-NPs in normal human sera: dose and time dependence
To understand C activation by PS-NPs in normal human serum further, we measured 500 nm PS-induced changes in C3a as a function of incubation time. Although the low values made it difficult to discern the initial kinetics of C activation, the linear regression line fitted on the data in Figure 6A suggests that C activation might have started instantly, within minutes. Figure 6B shows an experiment where we tested sC5b-9 formation as a function of 500 nm NP dose, expressed as multiples of 24.4 cm2/mL. The data suggested near-maximal effect at the latter dose in two of the three tested sera (donors 1 and 2). However, probably because of individual differences in C3-convertase and terminal-complex (C5b-9) formation, saturation was not reached in the remaining case (donor 3).
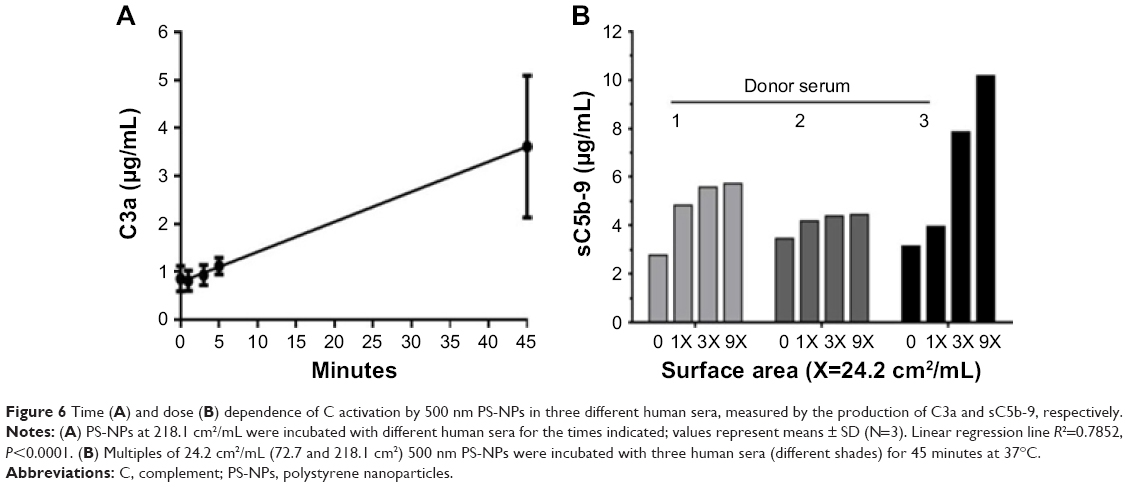 | Figure 6 Time (A) and dose (B) dependence of C activation by 500 nm PS-NPs in three different human sera, measured by the production of C3a and sC5b-9, respectively. |
Correlation between C activation by PS-NPs and pulmonary vasoactivity in pigs
The data presented thus far in pig and human sera provided evidence that C activation in blood may start within minutes after exposure to PS-NPs. This is consistent with the time course of pulmonary reaction in pigs, peaking at 2–5 minutes; however, in the absence of a specific and fully effective C inhibitor, it does not prove causal relationship. To fill this gap of information, we injected pigs with different PS-NPs to search for correlation between in vitro C activation and in vivo pulmonary reaction. Since flow cytometry and Western blotting were considered semiquantitative compared to ELISA, and since the available porcine ELISAs of C byproducts gave earlier contradicting data,9 we used the human data shown in Figure 4 for this correlation. Specifically, we injected 200, 500, and 750 nm PS-NPs in pigs at equivalent surface doses and monitored, among other parameters, the ensuing changes in PAP. These changes were quantified either as percentage change relative to baseline or area under the curve, as specified for each experiment, and values were correlated with the sC5b-9 values shown in Figure 4, also expressed as percentage change relative to baseline.
Nevertheless, as a first step, we had to establish the dynamic range of PS-NP-induced pulmonary hypertension in pigs for 200, 500, and 750 nm PS-NPs, applying identical total NP SAs. As shown in Figure 7A, the smallest dose of 200 nm NPs (5 ng/kg, blue line) did not cause any change in PAP, while identical surfaces of 500 (Figure 7B) and 750 nm (Figure 7C) PS-NPs led to massive pulmonary hypertension. These findings are consistent with the in vitro observations on C activation, opsonization, and iC3b formation caused by the same PS-NPs in Figures 2–4. Figure 7A–C also shows that ten- and 40-fold higher doses of all three NP types caused major increases in PAP response, and the dynamic window of the pulmonary hypertensive effect of PS-NPs was in a NP size-dependent subthreshold-dose range. The minimum effective (threshold) values were <50 ng/kg for 200 nm PS-NPs and <13 and <19 ng/kg for 500 and 750 nm PS-NPs (Figure 7A–C).
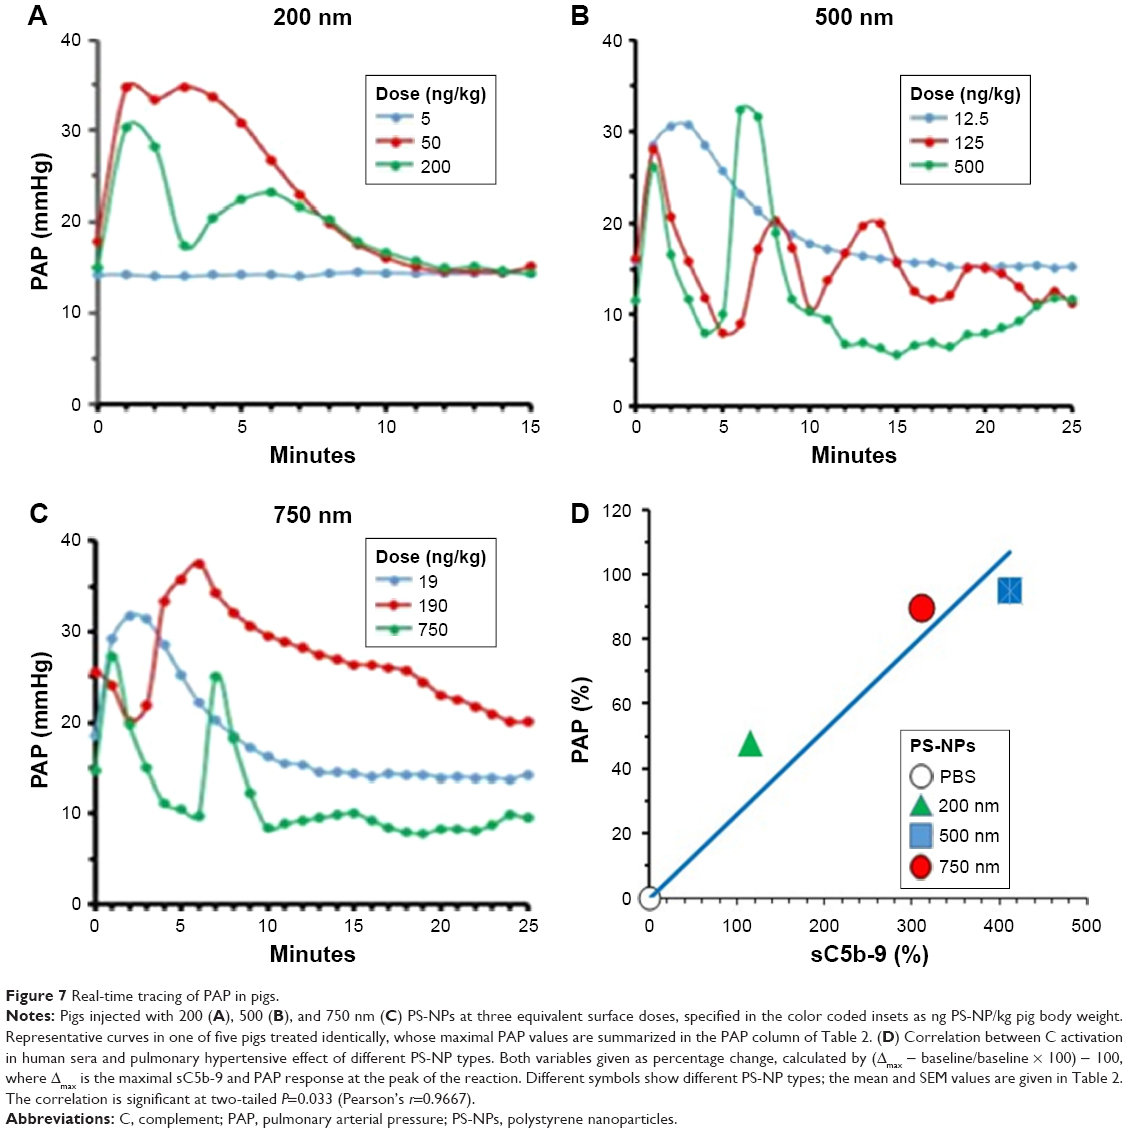 | Figure 7 Real-time tracing of PAP in pigs. |
The data in Figure 7 also illustrate the severe hemodynamic derangement following IV injection of PS-NPs which arises on similar time course as the opsonization of different-size NPs in pig sera in vitro (Figures 2 and 3). In addition, they highlight that 500 and 750 nm PS-NPs caused massive pulmonary hypertension at <20 ng/kg, which is at least ten times lower than the minimally reactive liposome or zymosan doses causing similar reactions.1,23–26 Therefore, these NPs represent the most effective inducers of pulmonary hypertension in pigs among a broad variety of NPs tested to date.1,23–26
The parallelism between C activation by different-size PS-NPs in human sera (Figure 4) and their pulmonary reactivity in pigs (Figure 7) is apparent from the data in Table 2 and Figure 7D, correlating the maximal PAP rises after injection of equivalent surface doses of different PS-NP types in five pigs.
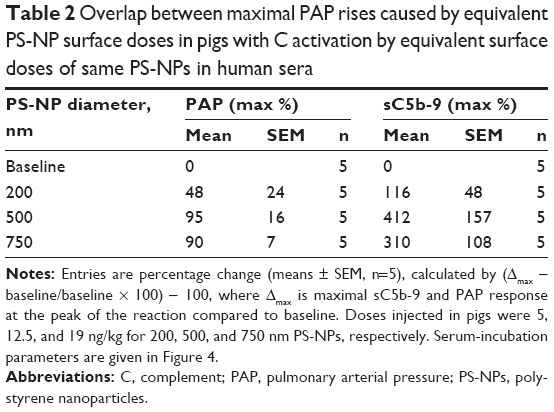 | Table 2 Overlap between maximal PAP rises caused by equivalent PS-NP surface doses in pigs with C activation by equivalent surface doses of same PS-NPs in human sera |
Plotting the mean PAP values against sC5b-9 (Figure 7D) followed by regression analysis indicated significant (P=0.03) correlation, which was remarkable considering that in vitro data were correlated with in vivo physiological changes in entirely different systems under entirely different conditions. This correlation represents a major argument for the relevance of C activation in PS-NP-induced pulmonary changes in pigs. Figure 8 extends the findings on the particle-size dependence of PS-NP-induced pulmonary hypertension of pigs inasmuch as it shows remarkable reproducibility of this size dependence (Figure 8A, top) and the fact that the systemic arterial pressure changes were relatively small or negligible (Figure 8A, bottom).
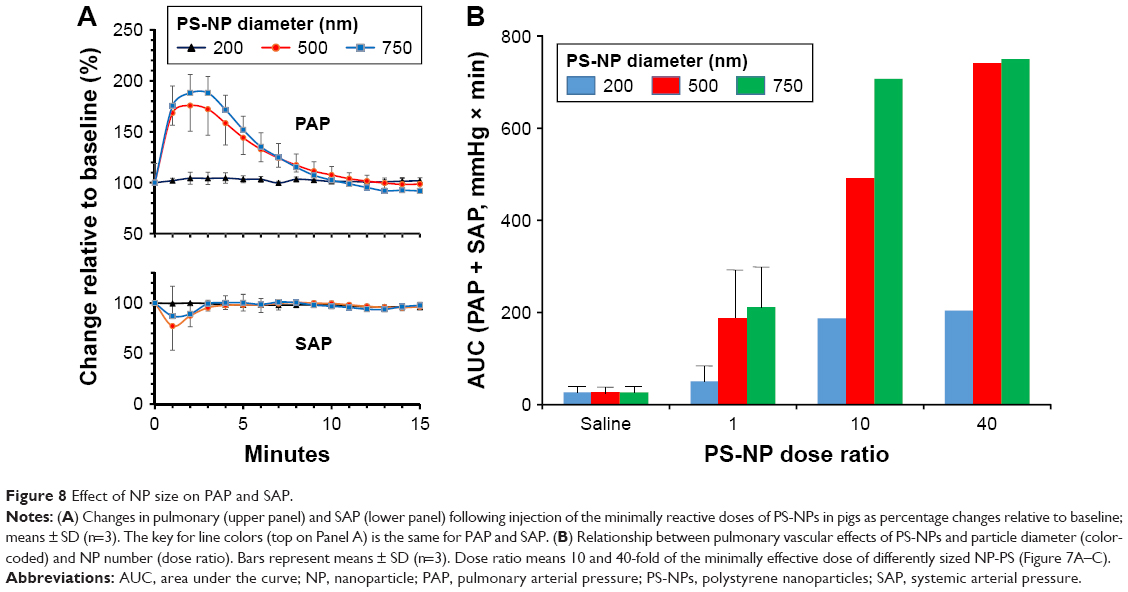 | Figure 8 Effect of NP size on PAP and SAP. |
Figure 8B shows that increasing the minimally reactive NP number tenfold led to increasing acceleration of pulmonary reaction to different-size NPs in the order 200<500<750 nm. Furthermore, increasing the minimal dose 40-fold yielded maximal effect only with the largest (750 nm) PS-NPs, suggesting that in addition to total SA, surface features also play a role in C activation. In our case, C activation was proportional with particle diameter in the 200–750 nm range, possibly because the efficiency of the buildup of C3/C5 convertases and opsonins were higher on flat than on curved surfaces.
Discussion
This study continued the exploration of the role of C activation in PS-NP-induced pulmonary hypertension in pigs to provide further information regarding the CARPA vs RPR theories.8,10 The importance of revisiting this issue lies in the clinical relevance of C being or not being involved in infusion reactions, since C-based predictive assays and C-inhibition-based preventive measures are still open, largely unexplored options in combating these adverse immune reactions.27 Inhibition of C activation as adjunct therapy against acute life-threatening immunoactivation is getting increasing recognition,28–30 so premature or unfounded exclusion of C activation as a key contributing mechanism of infusion reactions may be misleading in this field.
The original observations giving rise to questioning the role of C in the significant pulmonary hypertensive effect of 500 nm spherical PS-NPs in pigs was the lack of C activation in hirudinized pig whole blood in vitro. On the other hand, aspheric PS-NPs (rods and disks) derived by a film-stretching method did activate C in pig whole blood, yet they did not cause pulmonary reactions in vivo.9 On top of these controversial findings, all PS-NPs led to significant rises of sC5b-9 and C3bc in human whole blood.9 Keeping the goal of correlating in vitro C activation with in vivo pulmonary response without these inconsistencies, here, we used a simpler approach: instead of shape modification, we used only spherical PS-NPs whose diameters were different, namely, 200, 500, and 750 nm. Because spherical PS-NPs have been shown to bind to red blood cells,9 for these in vitro studies, we used sera, rather than whole blood.
The experimentally derived evidence in the present study seems more in support of the involvement than the irrelevance of C activation in PS-NP-induced HSRs in pigs. In particular, our demonstration of time-dependent formation of opsonic iC3b and its smaller, also opsonic fragments in pig serum incubated with PS-NPs, proceeding on the same minute scale that HSRs occur, provides multiple, coherent strong support to the idea that instant PS-NP-induced C activation in pig blood may contribute to the pulmonary reaction. The reason for the discrepancy between this and the previous study has not been clarified to date. As emphasized by many,10,31–34 the detection of C activation in animals in vivo may critically depend on methodology, and in vitro–in vivo extrapolations in this field have many potential pitfalls. It is notable in this regard that C activation by NPs is a dynamic, often reversible process that is influenced (in addition to the physicochemical properties of NPs and plasma factors) by the protein spectrum in the NP corona.35
As for the mechanism of C activation by PS-NPs, the present study indicated alternative-pathway C activation, at least in human serum. Whether or not this holds in pigs and other species as well remains to be established in the future. We also established a significant impact of NP size and thus surface geometry (curvature) on C activation, most likely related to the flatness of particle surfaces on which C proteins are deposited. Although we did not investigate, size-dependent aggregate formation36 may also play a role in C activation by PS-NPs, a possibility that requires further attention.
With regard to the RPR vs CARPA debate, since opsonization is a well-known trigger for enhanced phagocytic uptake,37–39 it is highly likely that it played a role in RPR, ie, “robust” uptake of PS-NPs by pulmonary intravascular macrophage cells.9 On this basis, the RPR theory is consistent, rather than compete with the CARPA concept. These ideas can be reconciled by the “double-hit” hypothesis on simultaneous, double, or multiple activation of allergy-mediating cells via different pathways.40,41 Nevertheless, the relative roles of different intracellular signaling channels, the complex relationship among anaphylatoxin effects, direct binding of NPs to a variety of pathogen-associated membrane receptors, C receptors, toll-like receptors, and many others, and phagocytosis and secretion of vasoactive mediators by allergy-mediating cells remain to be dissected. They may be more or less different for all NPs in different species for each individual case of HSRs.
In addressing the relevance of using PS-NPs to clarify the mechanism of nanomedicine-induced HSRs, the carboxylated PS-NPs studied here were not only highly hydrophobic but also more negatively charged than our control PEGylated nanoliposomes. Just like having high molar percentage of cholesterol in the bilayer of negatively charged liposomes,1,42 these features are known to accelerate C activation. On this basis, the use of PS-NPs as a nanomedicine-model system is questionable. As a matter of fact, on a weight basis, 500 and 750 nm PS-NPs have turned out to be the most potent inducers of cardiopulmonary distress in pigs studied for the past 20 years,18,43 most recently in minipigs for regulatory purposes.26 These NPs may thus join zymosan as a new positive standard for acute NP-induced HSRs that enables further dissection of their mechanism, in particular, the double-hit theory.
Finally, it should be pointed out that despite the worries about in vitro–in vivo projections, our results showing significant correlation between C activation by PS-NPs in human serum and their pulmonary hypertensive effect in pigs confirm the utility of in vitro C-activation assays in predicting the risk of NPs to cause severe infusion reactions in hypersensitive individuals. As emphasized in recent regulatory documents, there is a great need for such predictive tests for preclinical safety evaluation of nanomedicines.44,45 The present study suggests the use of the porcine CARPA model1,17,18 along with in vitro C assays in human serum to evaluate both the general and individual risks of severe HSRs to nanomedicines.
Acknowledgments
The authors acknowledge the support from European Union Seventh Framework Program grants NMP-2012–309820 (NanoAthero) and NMP-2013–602923 (TheraGlio), the Applied Materials and Nanotechnology Center of Excellence at Miskolc University, Hungary, and JSPS KAKENHI (Fund for the Promotion of Joint International Research [Fostering Joint International Research]) 15KK0310. Sincere thanks are due to Dr Ronald Taylor (University of Virginia) for providing anti-C3b/iC3b (7C12) and Dr Tom Eirik Mollnes (Oslo University, Norway) for C9neo (AE11) antibodies.
Disclosure
JS and RU are involved with SeroScience Ltd, an immunotoxicology contract-research organization. The authors report no other conflicts of interest in this work.
References
Szebeni J, Fontana JL, Wassef NM, et al. Hemodynamic changes induced by liposomes and liposome-encapsulated hemoglobin in pigs: a model for pseudoallergic cardiopulmonary reactions to liposomes. Role of complement and inhibition by soluble CR1 and anti-C5a antibody. Circulation. 1999;99(17):2302–2309. | ||
La-Beck NM, Gabizon AA. Nanoparticle Interactions with the Immune System: Clinical Implications for Liposome-Based Cancer Chemotherapy. Front Immunol. 2017;8:416. | ||
Szebeni J, Muggia F, Gabizon A, Barenholz Y. Activation of complement by therapeutic liposomes and other lipid excipient-based therapeutic products: prediction and prevention. Adv Drug Deliv Rev. 2011;63(12):1020–1030. | ||
Szebeni J, Muggia F, Barenholz Y. Case study: Complement activation related hypersensitivity reactions to PEGylated liposomal doxorubicin: Experimental and clinical evidence, mechanisms and approaches to Inhibition. In: Dobrovolskaia MA, McNeil SE, editors. Handbook of Immunological Properties of Engineered Nanomaterials. 2nd ed. Singapore: World Scientific Publishing Company; 2015:331–361. | ||
Szebeni J, Storm G. Complement activation as a bioequivalence issue relevant to the development of generic liposomes and other nanoparticulate drugs. Biochem Biophys Res Commun. 2015;468(3):490–497. | ||
Hempel JC, Poppelaars F, Gaya da Costa M, et al. Distinct in vitro Complement Activation by Various Intravenous Iron Preparations. Am J Nephrol. 2017;45(1):49–59. | ||
Macdougall IC, Vernon K. Complement Activation-Related Pseudo-Allergy: A Fresh Look at Hypersensitivity Reactions to Intravenous Iron. Am J Nephrol. 2017;45(1):60–62. | ||
Moghimi SM. Nanomedicine safety in preclinical and clinical development: focus on idiosyncratic injection/infusion reactions. Drug Discov Today. 2018;23(5):1034–1042. | ||
Wibroe PP, Anselmo AC, Nilsson PH, et al. Bypassing adverse injection reactions to nanoparticles through shape modification and attachment to erythrocytes. Nat Nanotechnol. 2017;12(6):589–594. | ||
Szebeni J. Mechanism of nanoparticle-induced hypersensitivity in pigs: complement or not complement? Drug Discov Today. 2018;23(3):487–492. | ||
Polysciences, Inc. Technical datasheet of carboxylated polystyrene nanoparticles; 2018. Available from:http://www.polysciences.com/default/catalog-products/microspheres-particles/polymer-microspheres/polybead-sup-r-sup-microspheres/polybead-sup-r-sup-functionalized-microspheres/polybead-carboxyl. Accessed Aug 28 2818. | ||
Turjeman K, Bavli Y, Kizelsztein P, et al. Nano-Drugs Based on Nano Sterically Stabilized Liposomes for the Treatment of Inflammatory Neurodegenerative Diseases. PLoS One. 2015;10(7):e0130442. | ||
Wei X, Cohen R, Barenholz Y. Insights into composition/structure/function relationships of Doxil gained from “high-sensitivity” differential scanning calorimetry. Eur J Pharm Biopharm. 2016;104:260–270. | ||
Barenholz Y, Amselem S. Quality control assays in the development and clinical use of liposome-based formulations. In: Gregoriadis G, editor. Liposome Technology. 2nd ed. Vol. I. Boca Raton, Fl: CRC Press; 1993:527–616. | ||
Talmon Y. Transmission electron microscopy of complex fluids: the state of the art. Berichte der Bunsengesellschaft für physikalische Chemie. 1996;100(3):364–372. | ||
Müller RH, Rühl D, Lück M, Paulke BR. Influence of fluorescent labelling of polystyrene particles on phagocytic uptake, surface hydrophobicity, and plasma protein adsorption. Pharm Res. 1997;14(1):18–24. | ||
Urbanics R, Bedőcs P, Szebeni J. Lessons learned from the porcine CARPA model: constant and variable responses to different nanomedicines and administration protocols. Eur J Nanomed. 2015;7(3):219–231. | ||
Szebeni J, Bedőcs P, Dézsi L, Urbanics R. A porcine model of complement activation-related pseudoallergy to nanopharmaceuticals: pros and cons of translation to a preclinical safety test. Prec Nanomed. 2018;2:63–72. | ||
Garbuzenko O, Zalipsky S, Qazen M, Barenholz Y. Electrostatics of PEGylated micelles and liposomes containing charged and neutral lipopolymers. Langmuir. 2005;21(6):2560–2568. | ||
Foley JH, Peterson EA, Lei V, Wan LW, Krisinger MJ, Conway EM. Interplay between fibrinolysis and complement: plasmin cleavage of iC3b modulates immune responses. J Thromb Haemost. 2015;13:610–618. | ||
Manning ML, Williams SA, Jelinek CA, Kostova MB, Denmeade SR. Proteolysis of complement factors iC3b and C5 by the serine protease prostate-specific antigen in prostatic fluid and seminal plasma. J Immunol. 2013;190(6):2567–2574. | ||
Al-Hanbali O, Rutt KJ, Sarker DK, Hunter AC, Moghimi SM. Concentration dependent structural ordering of poloxamine 908 on polystyrene nanoparticles and their modulatory role on complement consumption. J Nanosci Nanotechnol. 2006;6(9–10):3126–3133. | ||
Szebeni J, Baranyi L, Savay S, et al. Liposome-induced pulmonary hypertension: properties and mechanism of a complement-mediated pseudoallergic reaction. Am J Physiol. 2000;279(3):H1319–H1328. | ||
Szebeni J, Baranyi L, Sávay S, et al. Complement activation-related cardiac anaphylaxis in pigs: role of C5a anaphylatoxin and adenosine in liposome-induced abnormalities in ECG and heart function. Am J Physiol Heart Circ Physiol. 2006;290(3):H1050–H1058. | ||
Szebeni J, Bedocs P, Rozsnyay Z, et al. Liposome-induced complement activation and related cardiopulmonary distress in pigs: factors promoting reactogenicity of Doxil and AmBisome. Nanomedicine. 2012;8(2):176–184. | ||
Jackman JA, Mészáros T, Fülöp T, Urbanics R, Szebeni J, Cho NJ. Comparison of complement activation-related pseudoallergy in miniature and domestic pigs: foundation of a validatable immune toxicity model. Nanomedicine. 2016;12(4):933–943. | ||
Ricklin D, Barratt-Due A, Mollnes TE. Complement in clinical medicine: Clinical trials, case reports and therapy monitoring. Mol Immunol. 2017;89:10–21. | ||
Barratt-Due A, Thorgersen EB, Egge K, et al. Combined inhibition of complement C5 and CD14 markedly attenuates inflammation, thrombogenicity, and hemodynamic changes in porcine sepsis. J Immunol. 2013;191(2):819–827. | ||
Huber-Lang M, Barratt-Due A, Pischke SE, et al. Double blockade of CD14 and complement C5 abolishes the cytokine storm and improves morbidity and survival in polymicrobial sepsis in mice. J Immunol. 2014;192(11):5324–5331. | ||
Gustavsen A, Nymo S, Landsem A, et al. Combined Inhibition of Complement and CD14 Attenuates Bacteria-Induced Inflammation in Human Whole Blood More Efficiently Than Antagonizing the Toll-like Receptor 4-MD2 Complex. J Infect Dis. 2016;214(1):140–150. | ||
Dobrovolskaia MA. Pre-clinical immunotoxicity studies of nanotechnology-formulated drugs: Challenges, considerations and strategy. J Control Release. 2015;220(Pt B):571–583. | ||
Potter TM, Neun BW, Dobrovolskaia MA. In Vitro and In Vivo Methods for Analysis of Nanoparticle Potential to Induce Delayed-Type Hypersensitivity Reactions. Methods Mol Biol. 2018;1682:197–210. | ||
Neun BW, Ilinskaya AN, Dobrovolskaia MA. Analysis of Complement Activation by Nanoparticles. Methods Mol Biol. 2018;1682:149–160. | ||
Cedrone E, Neun BW, Rodriguez J, et al. Anticoagulants influence the performance of in vitro assays intended for characterization of nanotechnology-based formulations. Molecules. 2018;23(1):E12. | ||
Chen F, Wang G, Griffin JI, et al. Complement proteins bind to nanoparticle protein corona and undergo dynamic exchange in vivo. Nat Nanotechnol. 2017;12(4):387–393. | ||
Fülöp T, Nemes R, Mészáros T, et al. Complement activation in vitro and reactogenicity of low-molecular weight dextran-coated SPIONs in the pig CARPA model: Correlation with physicochemical features and clinical information. J Control Release. 2018;270:268–274. | ||
Newman SL, Mikus LK. Deposition of C3b and iC3b onto particulate activators of the human complement system. Quantitation with monoclonal antibodies to human C3. J Exp Med. 1985;161(6):1414–1431. | ||
Verbovetski I, Bychkov H, Trahtemberg U, et al. Opsonization of apoptotic cells by autologous iC3b facilitates clearance by immature dendritic cells, down-regulates DR and CD86, and up-regulates CC chemokine receptor 7. J Exp Med. 2002;196(12):1553–1561. | ||
Cunnion KM, Hair PS, Buescher ES. Cleavage of complement C3b to iC3b on the surface of Staphylococcus aureus is mediated by serum complement factor I. Infect Immun. 2004;72(5):2858–2863. | ||
Szebeni J, Bedőcs P, Urbanics R, et al. Prevention of infusion reactions to PEGylated liposomal doxorubicin via tachyphylaxis induction by placebo vesicles: a porcine model. J Control Release. 2012;160(2):382–387. | ||
Szebeni J, Bedőcs P, Csukás D, Rosivall L, Bünger R, Urbanics R. A porcine model of complement-mediated infusion reactions to drug carrier nanosystems and other medicines. Adv Drug Deliv Rev. 2012;64(15):1706–1716. | ||
Baranyi L, Szebeni J, Savay S, et al. Complement-Dependent Shock and Tissue Damage Induced by Intravenous Injection of Cholesterol-Enriched Liposomes in Rats. J Appl Res. 2003;3(3):221–231. | ||
Szebeni J, Fontana JL, Wassef NM, et al. Liposome-induced and complement-mediated cardiopulmonary distress in pigs as a model of pseudo-allergic reactions to liposomal drugs. Mol Immunol. 1998;35(6–7):401. | ||
EMA. Reflection paper on the data requirements for intravenous liposomal products developed with reference to an innovator liposomal product Available from: http://www.ema.europa.eu/docs/en_GB/document_library/Scientific_guideline/2013/03/WC500140351.pdf. Accessed August 28, 2018. | ||
FDA/CDER Guidance for Industry: Liposome Drug Products: Chemistry, Manufacturing, and Controls; Human Pharmacokinetics and Bioavailability; and Labeling Documentation. Available from: https://www.fda.gov/downloads/drugs/guidances/ucm070570.pdf. Accessed August 28, 2018. |
 © 2018 The Author(s). This work is published and licensed by Dove Medical Press Limited. The full terms of this license are available at https://www.dovepress.com/terms.php and incorporate the Creative Commons Attribution - Non Commercial (unported, v3.0) License.
By accessing the work you hereby accept the Terms. Non-commercial uses of the work are permitted without any further permission from Dove Medical Press Limited, provided the work is properly attributed. For permission for commercial use of this work, please see paragraphs 4.2 and 5 of our Terms.
© 2018 The Author(s). This work is published and licensed by Dove Medical Press Limited. The full terms of this license are available at https://www.dovepress.com/terms.php and incorporate the Creative Commons Attribution - Non Commercial (unported, v3.0) License.
By accessing the work you hereby accept the Terms. Non-commercial uses of the work are permitted without any further permission from Dove Medical Press Limited, provided the work is properly attributed. For permission for commercial use of this work, please see paragraphs 4.2 and 5 of our Terms.