")
Back to Journals » Clinical Interventions in Aging » Volume 9
Influence of aging on medial olivocochlear system function
Authors Lisowska G, Namyslowski G, Orecka B, Misiolek M
Received 5 February 2014
Accepted for publication 25 March 2014
Published 10 June 2014 Volume 2014:9 Pages 901—914
DOI https://doi.org/10.2147/CIA.S61934
Checked for plagiarism Yes
Review by Single anonymous peer review
Peer reviewer comments 4
Grazyna Lisowska, Grzegorz Namyslowski, Boguslawa Orecka, Maciej Misiolek
Department of Otolaryngology, Medical University of Silesia, Zabrze, Poland
Background: There is still controversy regarding the influence of aging on medial olivocochlear (MOC) system function. The main objective of this study is to measure age-related changes of MOC system function in people with normal hearing thresholds.
Method: Bilateral assessment of the MOC effect for click-evoked otoacoustic emissions (CEOAEs; at 70±3 dB peak sound pressure level [pSPL], click at 50/second, 260 repeats, 2.5–20 millisecond window) and for distortion product otoacoustic emissions (DPOAEs; with [frequencies] f2/f1=1.22, [levels of primary tones] L1=65 dB SPL and L2=55 dB SPL; DP-grams for 2f1-f2 were collected for the f1 frequencies varying from 977 Hz to 5,164 kHz, with the resolution of four points per octave) was performed in a group of 146 (n=292 ears) healthy, right-handed subjects aged from 10–60 years with a bilateral hearing threshold from 0.25–4.0 kHz, not exceeding 20 dB hearing level; normal tympanograms; and a threshold of the contralateral stapedial reflex for broadband noise (BBN) of 75 dB SPL or higher. The MOC inhibition was assessed on the basis of changes in OAE level during BBN contralateral stimulation at 50 dB sensation level (mean, 65±3 dB SPL).
Results: Comparative analysis of the MOC effect for CEOAE and DPOAE showed the weakest effect in the oldest age group (41–60 years) at almost all tested frequencies. Moreover, a weak, albeit significant, positive correlation between the level of OAE and the size of the MOC effect was documented.
Conclusion: On the basis of our study, we have found a decrease in the strength of the MOC system with increasing age in normally hearing subjects, as reflected by a decrease of the OAE suppression effects in older individuals and an increase of the number of CEOAE and DPOAE enhancements during contralateral acoustic stimulation in the elderly, especially in the high-frequency range.
Keywords: contralateral suppression, efferent suppression, MOC effect, MOC inhibition, otoacoustic emissions, medial olivocochlear system, age
Introduction
During the aging process, increasing disturbances in the functioning of cells and organs occur. Presbyacusis, or age-related hearing loss, is caused by involutionary changes in the peripheral components of the auditory system, including the inner ear, the spiral ganglion, and the cochlear nerve, as well as by changes in the auditory pathways and centers of the central nervous system. The following peripheral changes may be related to the course of presbyacusis: loss of outer hair cells (OHCs) in the organ of Corti, stiffening of the basilar membrane, bioelectrical changes in the cochlea, involutionary and degenerative processes within the stria vascularis, and decreases in the number of cells and axons within the cochlear nerve.1–3 Age-related degenerative changes in the central nervous system often involve the cochlear nucleus, nerves of the auditory pathway, the olivary nuclei in the pons, and other parts of the central auditory pathway. These changes are mostly related to disturbances in conduction, loss of neural pathways within the brainstem, and decreases in the number and reactivity of neurons.4,5 In addition, there are age-related changes in the brainstem resulting from changes in the functioning of calbindin and calretinin, two proteins that regulate calcium levels.6 Age-related anatomical and functional changes involving the medial olivocochlear (MOC) system also occur, often beginning in middle age.7
In the MOC, acetylcholine is the main inhibitory neurotransmitter. Tests using animal models showed a decrease of acetylcholine activity in the brainstem by 22% in nuclei of the inferior colliculus and by 56% in nuclei of the lateral lemniscus.8 Recent work of Lynch-Erhardt and Frisina9 confirms the occurrence of age-related changes in the cholinergic system, which includes the superior olivary complex and the cochlear nuclei. On the basis of the demonstration that functional and neurochemical changes in the MOC take place with age, we would expect a decrease in MOC function in older people.
The existing research literature thus very clearly documents that age-related changes occur in both the peripheral and central auditory systems. In fact, physiological changes in the inner ear and central auditory pathways are the primary source of hearing impairment in the elderly. It has been hypothesized that the efferent system serves a protective role in the auditory system and that the activation of the MOC system enhances the detection of sounds (speech perception) in the presence of background noise.10–12 Although the primary complaint of persons suffering from presbyacusis is an inability to understand speech in the presence of background noise, and although the MOC system is known to play a role in improving the auditory signal-to-noise ratio,13–15 only a few reports have evaluated changes in the MOC system as a function of age.7,16–20
In humans, assessment of the MOC system is possible through the use of a technique involving registration of otoacoustic emissions (OAEs). Otoacoustic emissions are sounds that arise in the ear canal when the tympanic membrane receives vibrations transmitted backward through the middle ear from the cochlea. Under the assumption that middle ear function is normal, reduced OAEs are an indication of dysfunction of the cochlear amplifier that requires normal function of OHCs and the stria vascularis. Therefore, OAEs have been widely used as an objective diagnostic tool allowing access to the OHC function. Traditionally, all types of evoked OAEs (ie, stimulus-frequency otoacoustic emissions, click-evoked otoacoustic emissions [CEOAEs], and distortion product otoacoustic emissions [DPOAEs]) have been viewed as manifestations of cochlear mechanical nonlinearity. Almost all clinically oriented studies in the field of OAEs used CEOAEs and/or DPOAEs, mostly because of an early availability of a commercial system (ILO; Otodynamics Ltd., Hatfield, UK).
There are two kinds of olivocochlear efferents: MOC and lateral olivocochlear efferents.10 Thick, myelinated MOC fibers to the cochlea originate in the medial part of the superior olivary complex on both sides and project through the vestibular nerve to the cochlea, where they innervate the OHCs. Thin, unmyelinated lateral olivocochlear fibers originate predominantly on the ipsilateral side. Their axons also travel through the vestibular nerve, but lateral olivocochlear fibers innervate auditory nerve fibers under inner hair cells. The contralateral MOC reflex crosses in the trapezoid body and uses uncrossed MOC fibers, whereas the ipsilateral reflex is a double-crossed reflex with crossings in the trapezoid body and in the crossed MOC fibers. In humans, ipsilateral and contralateral reflexes seem to be equally strong.11 The MOC-induced decrease in the gain of the cochlear amplifier can be measured noninvasively in humans by the changes they produce in OAEs. Typically, the MOC-induced effect has been termed “suppression”, whereas more recently it started to be called “MOC inhibition”. However, enhancements of the OAE level can be sometimes observed during contralateral acoustic stimulation (CAS).11
Multiple papers confirm that such testing of the MOC-induced effect provides a simple, objective method that allows assessment of the functional status of the MOC and cochlear integration.10–13,21–26
In this article, the size of the MOC effect was assessed according to OAE-level changes taking place during a contralateral stimulation. The main objective of this study was to measure age-related changes of MOC system functioning in people with normal hearing thresholds.
Materials and methods
Bilateral audiometric tests were initially performed in a group of 205 (n=410 ears) healthy, right-handed subjects aged between 10–60 years. Exclusion criteria for audiometric tests were abnormal results of otoscopic examination, history of ear diseases, noise exposition, use of ototoxic drugs, chronic metabolic diseases, head injuries with consciousness loss, and diseases of the central nervous system.
The tests included screening tests and assessment of the MOC effect for CEOAEs and for DPOAEs in particular age groups.
The first stage consisted of so-called screening tests, on the basis of which subjects were included or excluded from further testing. The screening tests included pure-tone audiometry (PTA) from 0.25–6 kHz, audiometric threshold for broadband noise (BBN), tympanometry, and contralateral acoustic reflex threshold (CART) for BBN and CEOAEs. PTA was performed in a soundproofed room, using a Grason-Stadler GSI-16 (Eden Prairie, MN, USA) audiometer. Middle ear pressure and CART for BBN were assessed using a Grason-Stadler GSI-33 oto-admittance meter.
After the abovementioned screening tests were performed, qualification for the MOC system evaluation was performed on the basis of the following criteria: bilateral hearing threshold 20 dB hearing level (HL) or better at octave frequencies between 0.25–4 kHz, normal tympanograms (static acoustic admittance between 0.35–1.75 mL/mmho and peak pressure between +50 and −100 daPa) in both ears, threshold of the contralateral stapedial reflex for BBN of 75 dB sound pressure level (SPL) or higher in both ears, and bilaterally present CEOAEs (overall response ≥3 dB SPL and reproducibility and stimulus stability exceeding 90% and 85%, respectively).
Using the abovementioned criteria, 146 healthy subjects were enrolled in the final study, making up the normative group (n=292 ears). The normative group was additionally divided into three age subgroups: 20–25 years of age, 26–40 years of age, and 41–60 years of age. Division into groups was performed on the basis of age without regard to level of performance within the first inclusion criterion (bilateral hearing threshold). Detailed characteristics of the tested subgroups are shown in Table 1.
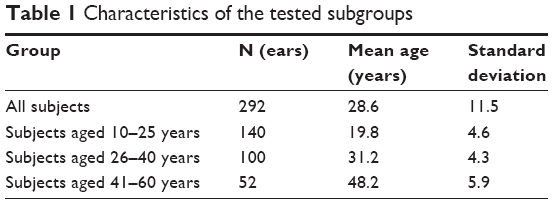 | Table 1 Characteristics of the tested subgroups |
The second stage of testing employed procedures aimed at assessment of the MOC effect in the tested groups. Assessment of the MOC-induced effect (MOC inhibition) was performed on the basis of changes in OAE levels during CAS. The size of the MOC effect was calculated using the relative subtraction method (eg, MOC effect was defined as the level difference of the OAE waveforms [in dB] between no-noise and noise conditions).22,25,26 Negative values therefore reflect suppression of the MOC system (contralateral suppression), whereas positive values indicate otoacoustic emissions level enhancement during CAS. On the basis of our previous results and review of the published data, we conclude that BBN acts in the most inhibitory manner when compared with narrow-band noise, tonal signals, and clicks. Therefore, BBN was used as contralateral stimulation in all further test procedures.21–24
The MOC-induced effects assessment
For all tested conditions, the MOC assessment was performed according to a single fixed scheme. The test was always performed in three measurement blocks: assessment of otoacoustic emissions without CAS, assessment of otoacoustic emissions with CAS that began about 3 seconds before otoacoustic emissions measurement was begun and ended about 3 seconds after the measurements were taken, and test–retest of otoacoustic emissions without CAS after about 2 minutes, which was designed to assess the stability of the probe in the ear canal. The abovementioned blocks of measurements are presented schematically in Figure 1. Cases in which measured level changes of otoacoustic emissions without CAS differed by more than 1 dB from the first measurement without CAS indicated lack of stability of the probe in the external ear canal; such results were excluded from further analysis. Only a few measurements were excluded from the final analysis because of probe instability. The contralateral stimulation was BBN at 50 dB sensation level (SL) and 125–12,000 Hz. BBN was generated using the Nicolet Spirit Viking™ series system (Natus Medical Incorporated, San Carlos, CA, USA) and was presented to the contralateral ear through an Etymotic ER3 (Elk Grove Village, IL, USA) insert earphone. CAS level was set at 50 dB SL (mean, 65 dB SPL), as such stimulation does not cause a measurable stapedial contralateral reflex in most subjects but does result in significant response from the MOC.24,25 However, the results reported by Guinan et al27 provided some evidence that clicks commonly used to evoke CEOAEs for the MOC tests may also elicit efferent activity by themselves when presented at usually used levels of around 70 dB pSPL, and they may also evoke the acoustic reflex. In addition, clicks presented at the typically used rate of 50/second are potent elicitors of efferent activity.27 Thus, it is possible that in some subjects, small effects of the CAS on CEOAEs observed in the study could be also related to these two mechanisms.
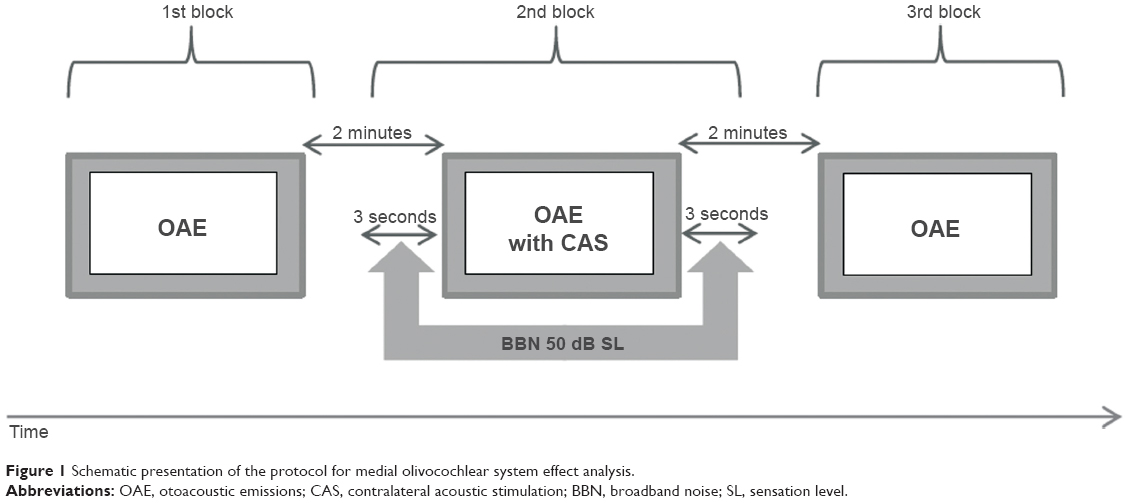 | Figure 1 Schematic presentation of the protocol for medial olivocochlear system effect analysis. |
Analysis included the results in which for response without CAS, the ratio signal to background noise (SNR) was equal or higher than 6 dB.
MOC-induced effects for CEOAEs
Assessment of the efferent effect of CEOAEs was performed using the Echoport ILO292 analyzer system, version 5.0 (Otodynamics). Otoacoustic emissions were performed separately for each ear. Before the test was begun, the software automatically checked the resonance of the external ear canal and the probe sealing.
CEOAEs were recorded in a nonlinear mode with 80 millisecond clicks presented at 70±3 dB pSPL at a rate of 50/second. This click level was chosen because, according to the literature, it appears that clicks of this strength cause a relatively strong otoacoustic emissions response, while at the same time, they do not significantly decrease the MOC effect.21,26 Recordings were time-windowed from 2.5–20 milliseconds. Responses to a total of 260 sets of clicks were averaged above the noise rejection level of 45 dB. The ILO292 averages into two alternate buffers: A and B. Signal is estimated from the (A+B)/2 waveform, and noise is estimated from the A-B difference waveform. Reproducibility is defined as the zero-lag correlation coefficient between A and B buffers. CEOAEs within the range of 1.0–5.0 kHz were measured. The overall CEOAE response, as well as the emissions for the half-octave bandwidth centered at 1, 2, 3, 4, and 5 kHz frequencies, was analyzed in the offline option.
Assessment of the MOC effect was performed in the three above-described measurement blocks in the entire tested group (146 subjects, n=292 ears). Because we analyzed only results in which the overall response without CAS was 3 dB SPL or higher and the SNR was 6 dB or higher, final calculation of the MOC effect was performed in the group of subjects described in Table 2.
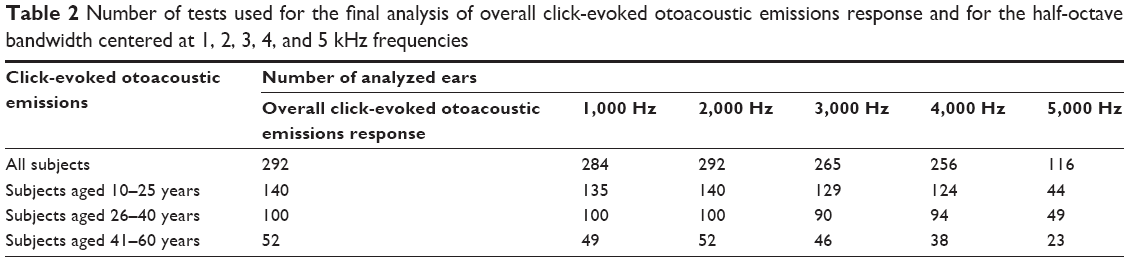 | Table 2 Number of tests used for the final analysis of overall click-evoked otoacoustic emissions response and for the half-octave bandwidth centered at 1, 2, 3, 4, and 5 kHz frequencies |
The MOC-induced effects for DPOAEs
The MOC effect for DPOAEs was performed using an ILO292 analyzer system, version 5.0. Emissions were measured using a two-channel probe. As for CEOAEs, a soft adapter was used to provide precise adaptation of the probe to the wall of the external ear canal. The otoacoustic emissions evoked by two tonal signals of different frequencies, f1 and f2, in a constant relation (f2/f1=1.22) were recorded. The levels of primary tones were different and were L1=65 and L2=55 dB SPL, respectively. Their choice was optimized based on the literature.28–30 The DP-grams for 2f1-f2 were collected for the f1 frequencies, varying from 977–5,164 kHz with the resolution of four points per octave.
MOC system assessment was carried out in the three above-described measurement blocks in almost all tested subjects (115 subjects, n=230 ears). Because of time limitations, no DPOAEs were performed in 31 of the subjects. Because analysis included only results in which the SNR without CAS was equal to or higher than 6 dB, final calculation of the MOC effect was performed in the group described in Table 3.
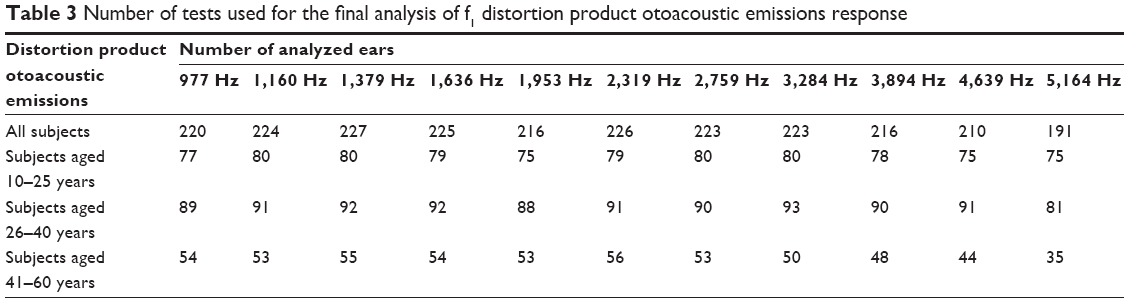 | Table 3 Number of tests used for the final analysis of f1 distortion product otoacoustic emissions response |
The protocol of the study was approved by the Local Bioethical Committee at the Medical University of Silesia. All experiments on humans were conducted in accordance with the Declaration of Helsinki (revision 6, 2008) regarding the principles of human experimentation.
Statistical analysis
Comparisons of the amplitude of otoacoustic emission without or with contralateral stimulation and of the MOC effect in different subgroups were made. Factorial analysis of variance (ANOVA) with two categorical predictors (ie, age group and frequency) was used for comparisons between the three age groups (eg, otoacoustic emission levels without CAS or the MOC effect levels). The Tukey test was used for multiple comparisons. In turn, the paired t-test was used for intragroup comparisons of otoacoustic emission levels with or without CAS at each frequency. The Bonferroni correction was used to counteract the problem of multiple comparisons (five frequencies for CEOAE and eleven frequencies for DPOAE).
Spearman’s correlation was used to assess relationships between frequency and MOC effect or the number of otoacoustic emissions level enhancements during CAS. Pearson’s correlation was used to assess relationships between the level of otoacoustic emissions and MOC effect level. All statistical analyses were performed at the 95% confidence interval (P<0.05), using STATISTICA 6.0 software (StatSoft, Tulsa, OK, USA).
Data presented in each figure represent means ± confidence intervals. The results in the text and tables are presented as means ± standard deviation.
Results
The mean hearing threshold, in decibels HL, was calculated at PTA-1 (mean at 250 Hz, 500 Hz, and 1 kHz), PTA-2 (mean at 1, 2, and 4 kHz), and PTA-3 (mean at 1, 2, 4, and 6 kHz), as well as for BBN. The results are shown in Table 4. Comparison of particular age groups revealed significant statistical differences only between the 41–60 year and 10–25 year age groups (P<0.01). No significant differences in mean hearing threshold for BBN were found among particular age groups.
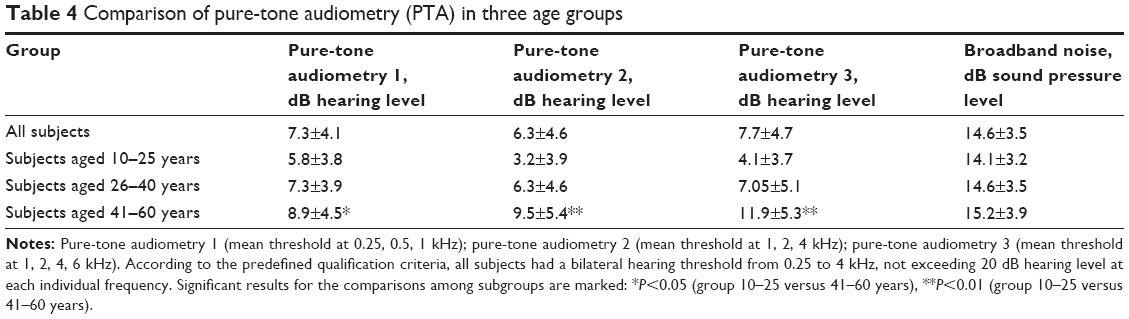 | Table 4 Comparison of pure-tone audiometry (PTA) in three age groups |
Consistent with the lack of significant differences among particular age groups in the mean acoustic threshold for BBN, we used BBN for each subject at 50 dB SL (the BBN levels were, depending on the individual acoustic threshold, from 60–69 dB SPL; the mean level was 65±3 dB SPL) to obtain identical conditions of CAS. Therefore, the BBN used as CAS did not exceed 69 dB SPL, allowing us to exclude the presence of measurable stapedial reflex in view of the predefined qualification criterion (CART ≥75 dB SPL). This allowed objective arrangement of the obtained results (changes during CAS), showing MOC functioning.
Age influence on contralateral CEOAE suppression
The level of CEOAEs without CAS was compared among the tested age groups (ANOVA with appropriate post hoc Tukey test). It was concluded that in the 10–25 year and 26–40 year subgroups, CEOAE level was similar in both overall response and at 1,000–4,000 Hz frequency (P>0.05), whereas significant differences were found between subgroups 10–25 and 41–60 years and 26–40 and 41–60 years, confirming the decrease in CEOAE level with age. The detailed results and comparisons between all subgroups are presented in Table 5 and Figure 2.
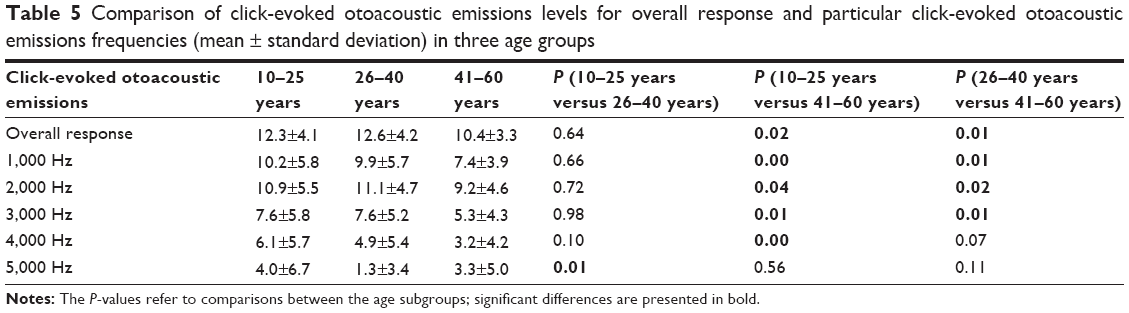 | Table 5 Comparison of click-evoked otoacoustic emissions levels for overall response and particular click-evoked otoacoustic emissions frequencies (mean ± standard deviation) in three age groups |
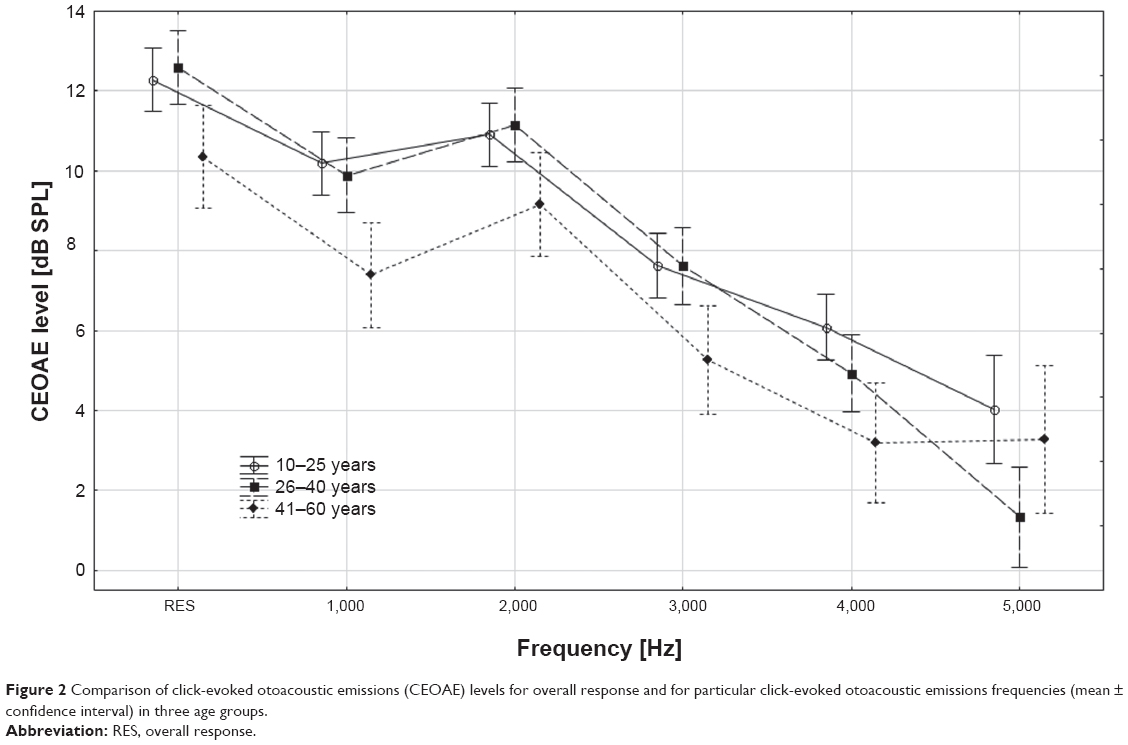 | Figure 2 Comparison of click-evoked otoacoustic emissions (CEOAE) levels for overall response and for particular click-evoked otoacoustic emissions frequencies (mean ± confidence interval) in three age groups. |
When comparing CEOAE level without and with CAS in the tested age subgroups (paired t-test with the Bonferroni correction), a significant decrease in emission level with CAS was found for most of the comparisons in the youngest and middle-age groups, but only for the total response and response at 1,000 Hz in the oldest group. These findings point to the age-related decrease in the contralateral suppression. Detailed results for all the variants of measurements are presented in Table 6.
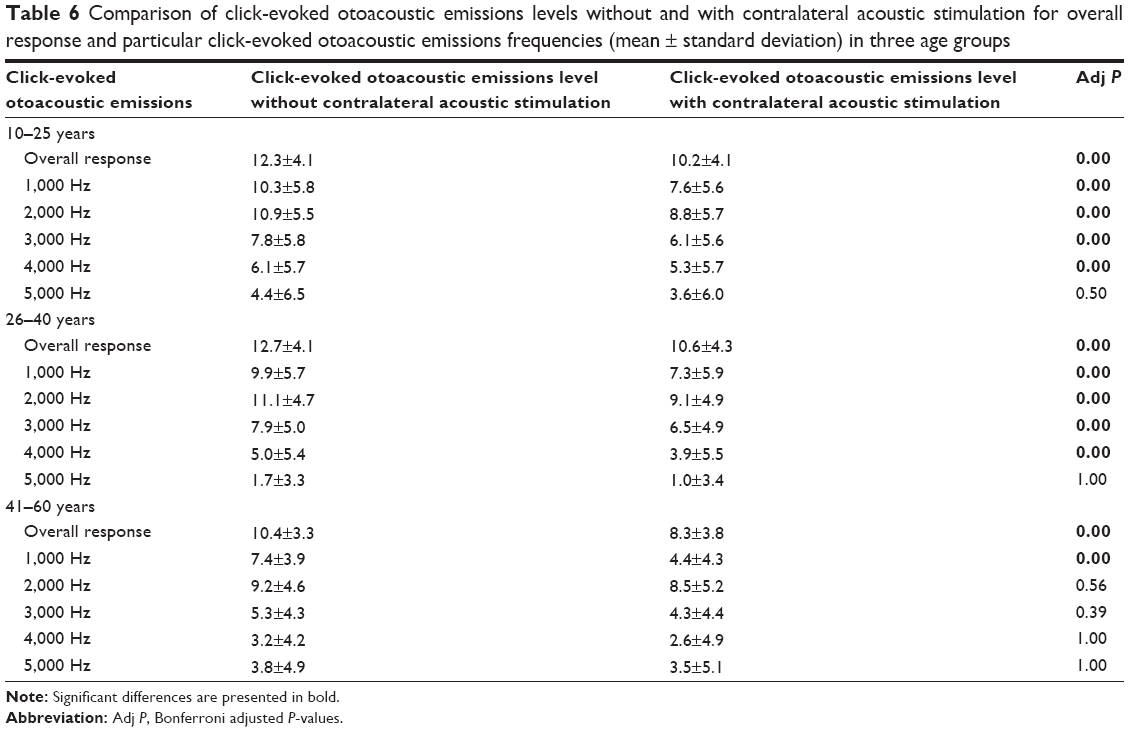 | Table 6 Comparison of click-evoked otoacoustic emissions levels without and with contralateral acoustic stimulation for overall response and particular click-evoked otoacoustic emissions frequencies (mean ± standard deviation) in three age groups |
The MOC effect was calculated for the tested age groups, using the relative subtraction method. In all the age groups, the MOC suppression was found to generally decline with frequency increase (Figure 3).
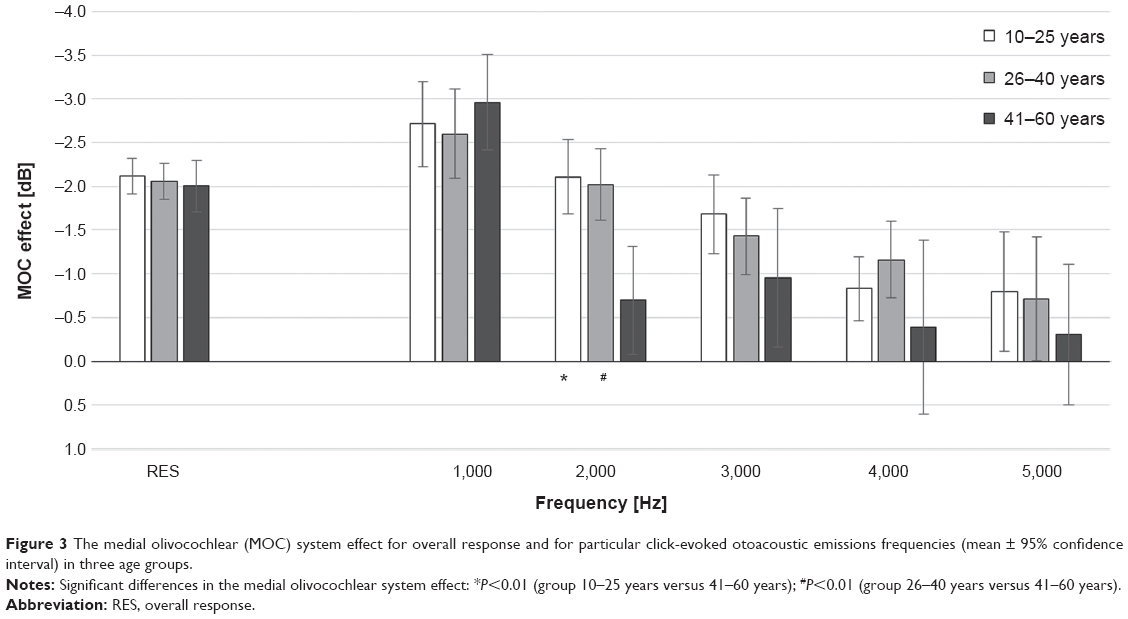 | Figure 3 The medial olivocochlear (MOC) system effect for overall response and for particular click-evoked otoacoustic emissions frequencies (mean ± 95% confidence interval) in three age groups. |
Comparison of the MOC effect among the tested age groups (ANOVA with appropriate post hoc Tukey test) showed that the weakest MOC effect occurred in the oldest age group (41–60 years); however, significant differences were noted only for subgroups 10–25 and 41–60 years at 2,000 Hz (P=0.0005) and between subgroups 26–40 years and 41–60 years at 2,000 Hz (P=0.002). For the overall response, the MOC effect was almost identical in all age groups, being −2.1±1.2 dB in the 10–25 year subgroup, −2.05±1.0 dB in the 26–40 year subgroup, and −2.0±1.1 dB in the 41–60 year subgroup.
However, the number of CEOAE level enhancements during CAS increased, together with the frequency increase in all age groups, from 12% at 1,000 Hz to 27% at 5,000 Hz (r=0.94 according to Spearman’s test; P=0.02) for the 10–25 years subgroup, from 7% at 1,000 Hz to 29% at 5,000 Hz (r=0.92 according to Spearman’s test; P=0.03) for the 26–40 years subgroup, and from 4% at 1,000 Hz to 43% at 5,000 Hz (r=0.94 according to Spearman’s test; P=0.02) for the oldest subgroup. Comparison of the number of CEOAE enhancements during CAS in the tested age groups showed that over the entire tested range, the mean percentage of enhancements in the 10–25 and 26–40 year subgroups was similar, at 17% and 15%, respectively, whereas the number of enhancements in the oldest group was significantly higher than in the younger subgroups, at 23% on average. In the oldest group, the number of enhancements increased markedly at high frequencies (at 4,000 Hz, 37% of enhancements, and at 5,000 Hz, 43% of enhancements).
Pearson’s analysis of correlation between the baseline CEOAE level and MOC effect revealed significant, albeit very weak, correlations at all examined frequencies: 1,000 Hz (r=−0.26; P=0.00), 2,000 Hz (r=−0.17; P=0.00), 3,000 Hz (r=−0.29; P=0.00), 4,000 Hz (r=−0.16; P=0.01), and 5,000 Hz (r=−0.29; P=0.00). The correlation was not observed for overall CEOAE response only (r=0.00; P=0.96). Therefore, we confirmed a very weak association between the two parameters: the higher the CEOAE level, the stronger the MOC suppression.
Age influence on contralateral DPOAE suppression
The DPOAE level without CAS was compared among the tested age groups (ANOVA with appropriate post hoc Tukey test), and it was concluded that DPOAE level in the tested frequency range was highest in the 10–25 year age group, lower in the 26–40 year subgroup, and lowest in the 41–60 year subgroup. The detailed results and the comparisons between all subgroups are presented in Table 7 and Figure 4.
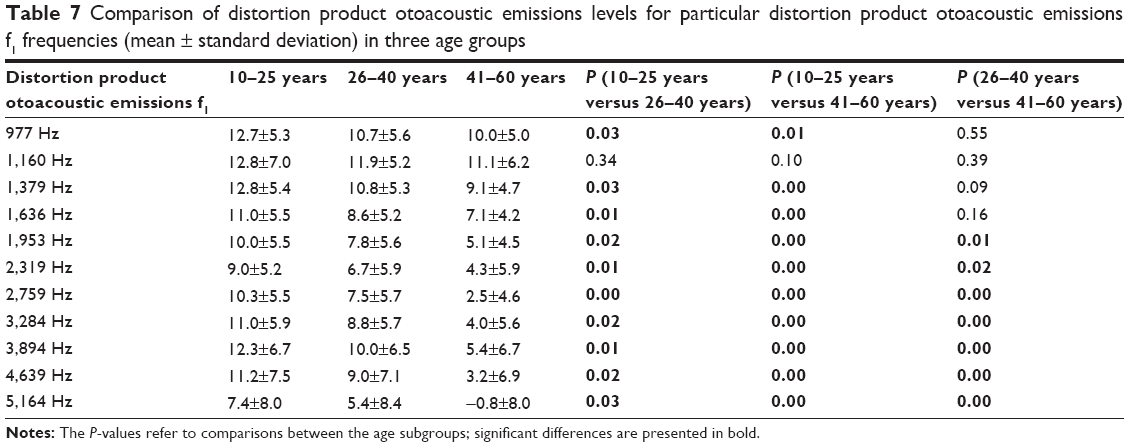 | Table 7 Comparison of distortion product otoacoustic emissions levels for particular distortion product otoacoustic emissions f1 frequencies (mean ± standard deviation) in three age groups |
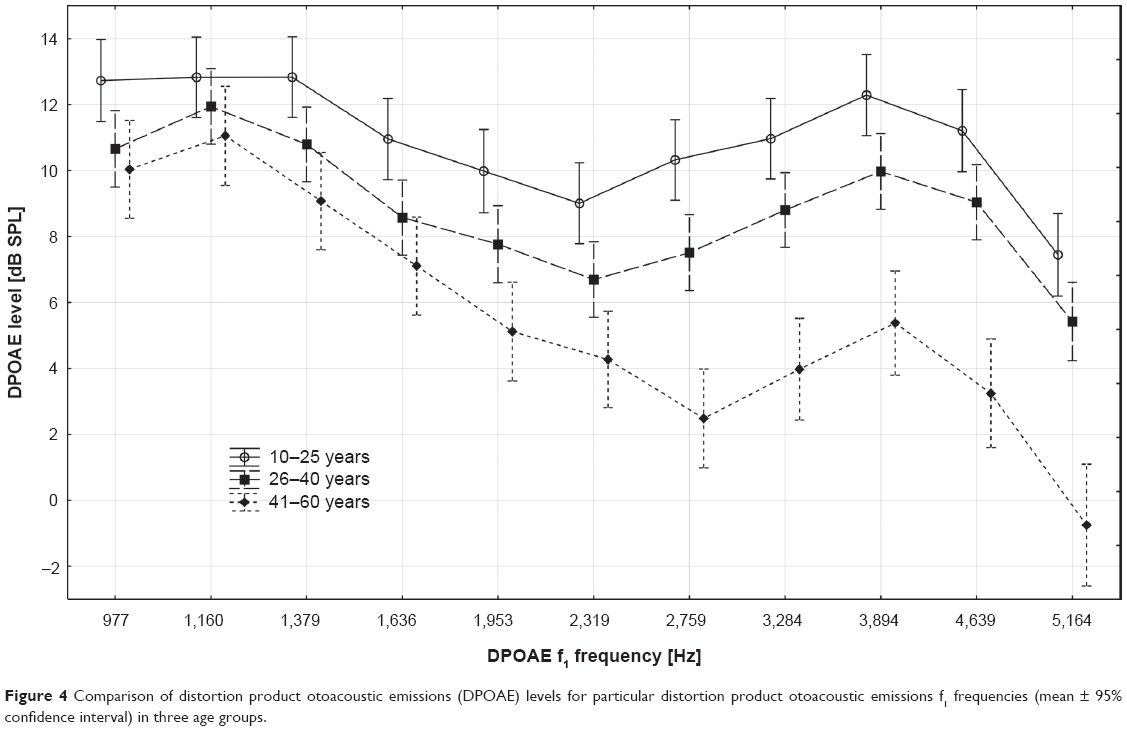 | Figure 4 Comparison of distortion product otoacoustic emissions (DPOAE) levels for particular distortion product otoacoustic emissions f1 frequencies (mean ± 95% confidence interval) in three age groups. |
The intragroup analysis of DPOAEs with and without CAS (paired t-test with the Bonferroni correction) revealed a significant decrease in emission level during CAS in most of the comparisons conducted among 10–25 and 26–40 year old subject groups, but only in a few variants tested in the oldest group. Detailed results for all the measurement variants are presented in Table 8.
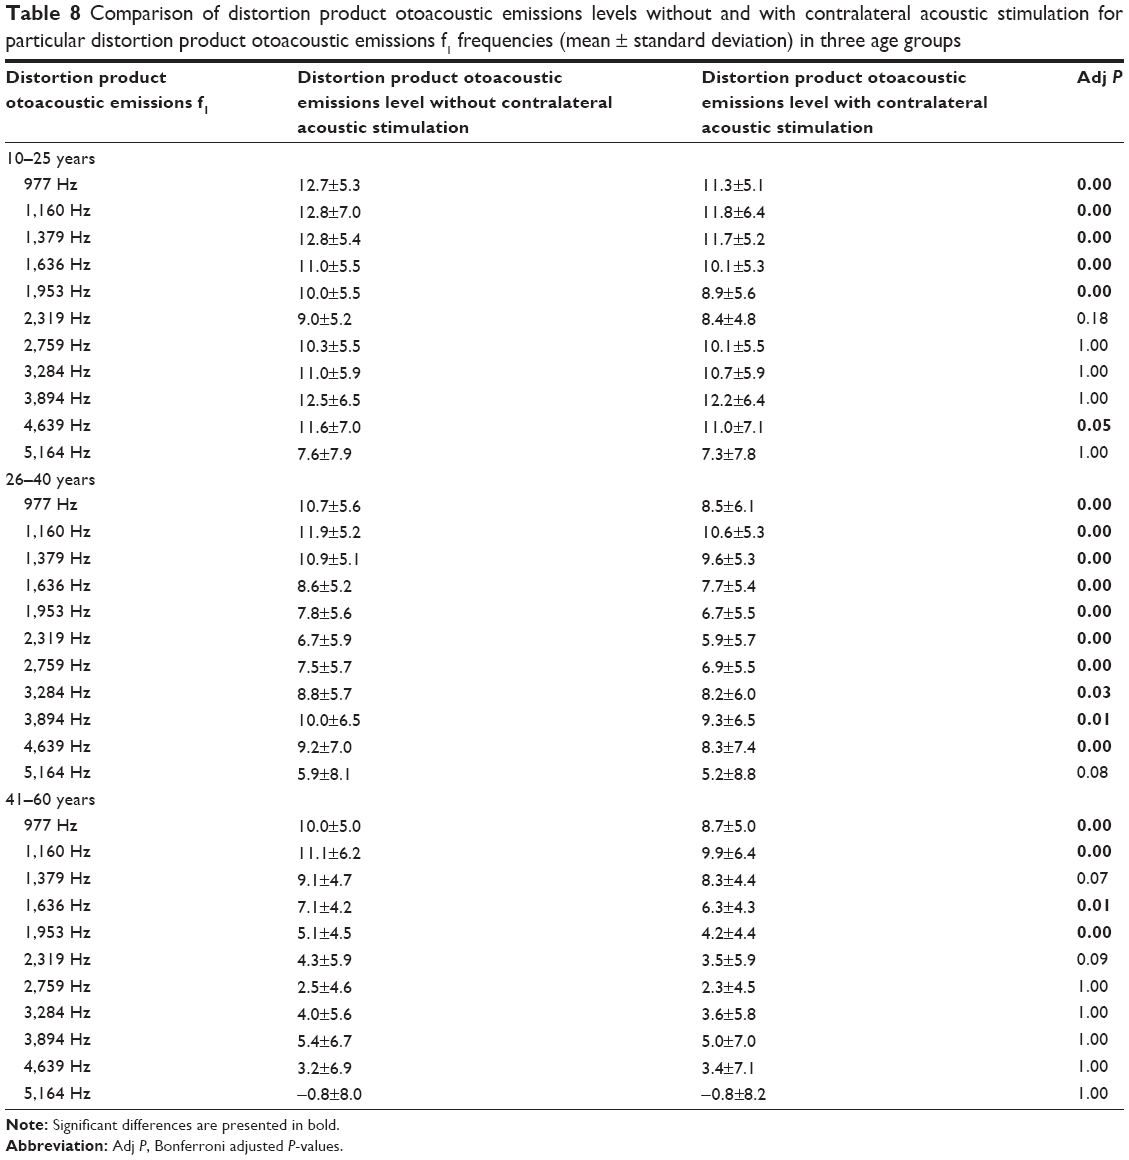 | Table 8 Comparison of distortion product otoacoustic emissions levels without and with contralateral acoustic stimulation for particular distortion product otoacoustic emissions f1 frequencies (mean ± standard deviation) in three age groups |
The MOC effects for the tested age groups were calculated using the relative subtraction method. For all the age groups, the MOC suppression turned out to be the strongest at low and medium frequencies (Figure 5). The mean MOC effect across the entire tested frequency range was −0.7±1.8 dB for 10–25 year old subjects, −1.0±1.7 dB for participants between 26 and 40 years of age, and 0.6±1.8 dB for the oldest subgroup.
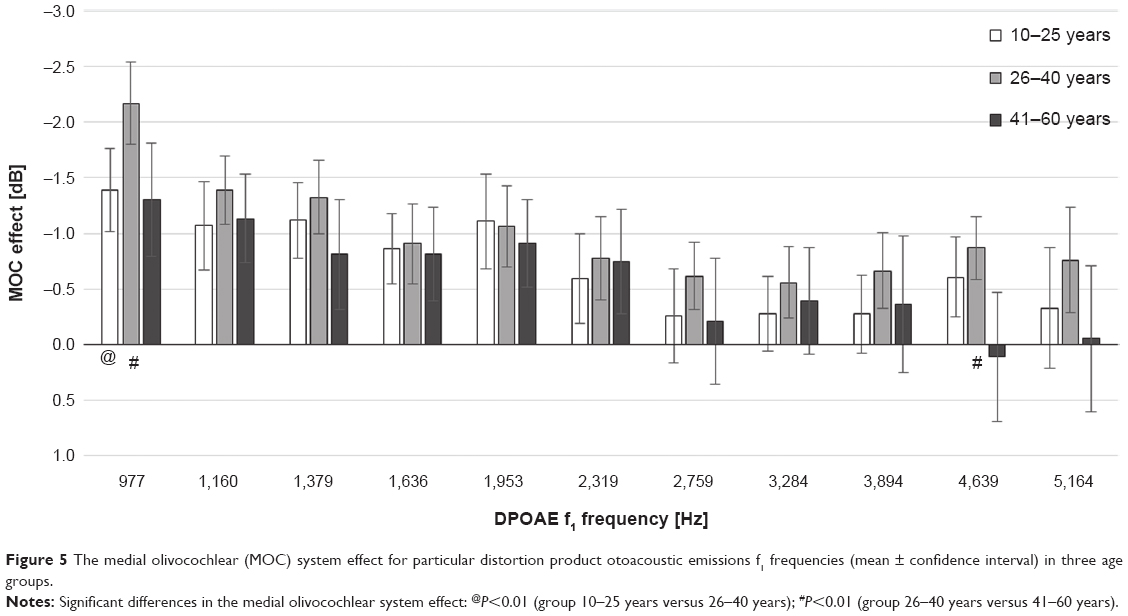 | Figure 5 The medial olivocochlear (MOC) system effect for particular distortion product otoacoustic emissions f1 frequencies (mean ± confidence interval) in three age groups. |
Comparison of the MOC effect in the tested age groups (ANOVA with appropriate post hoc Tukey test) showed that the strongest MOC suppressive effect over the whole tested frequency range occurred in the 26–40 year subgroup and that the weakest suppressive effect occurred in the oldest group. However, significant differences were found only when comparing the subgroups, between 10–25 years and 41–60 years at 4,639 Hz (P=0.03) and between 26–40 years and 41–60 years at 977 (P=0.004), 4,639 (P=0.002), and 5,164 Hz (P=0.05). A significant difference was also found between the 10–25 year and 26–40 year subgroups at 977 Hz (P=0.004).
The number of DPOAE enhancements during CAS increased at higher frequencies in all the age subgroups, going from 14% at 977 Hz to 36% at 5,164 Hz (r=0.8 according to Spearman’s test; P=0.003) for 10–25 year old subjects, from 8% at 977 Hz to 30% at 5,164 Hz (r=0.48 according to Spearman’s test; P=0.13) for participants between 26 and 40 years of age, and from 17% at 977 Hz to 51% at 5,164 Hz (r=0.94 according to Spearman’s test; P=0.00001) for the oldest group. Comparison of DPOAE enhancements during CAS in particular age subgroups showed that the mean percentage of enhancements in the 10–25 year and 26–40 year subgroups was similar, at 25% and 23%, respectively. The oldest group showed the highest number of enhancements (33% on average), with a particularly high percentage at higher frequencies (at 4,639 Hz, 50% of enhancements; at 5,164 Hz, 51% of enhancements).
Pearson’s analysis of correlation between the baseline DPOAE level and MOC effect revealed significant, albeit very weak, associations at most of the studied frequencies (f1): 1,160 Hz (r=−0.24; P=0.00), 1,379 Hz (r=−0.19; P=0.00), 1,636 Hz (r=−0.15; P=0.03), 1,953 Hz (r=−0.18; P=0.00), 2,319 Hz (r=−0.24; P=0.00), and 2,759 Hz (r=−0.21; P=0.00). No significant correlations were documented at the remaining analyzed frequencies: 977 Hz (r=−0.08; P=0.21), 3,284 Hz (r=−0.03; P=0.65), 3,894 Hz (r=0.08; P=0.23), 4,639 Hz (r=−0.04; P=0.53), and 5,165 Hz (r=−0.03; P=0.64). Therefore, similar to CEOAE, we confirmed a weak influence of emission level on the level of contralateral effect (the higher the CEOAE level, the stronger the MOC suppression).
Discussion
The results of our study confirm that MOC-induced suppressive activity decreases in aged people with normal hearing thresholds in the tonal audiometry range of 0.25–4 kHz. The results showed the suppressive MOC effect for both CEOAEs and DPOAEs to be the weakest in the oldest group. In addition, it was found that in comparison with other age subgroups, the MOC suppression was significantly weaker in the oldest subgroup for DPOAEs at high and low frequencies (997 Hz and 4,639 Hz) and for the CEOAE at 2 kHz. The fact that bilaterally present OAEs 6 dB above BBN and CART 75 dB SPL or higher were among the inclusion criteria of our study undoubtedly increased the accuracy of the MOC effect determination.
Decline in the MOC suppression with age has been observed by other researchers who tested the influence of age on the activity of the MOC system.7,16,18,19,25,31 The pioneering tests carried out by Castor et al16 showed that the contralateral suppressive effect for CEOAEs is significantly weaker in older subjects (70–78 years) than in subjects aged 20–39 years. Unfortunately, these investigators did not exclude the possibility of the influence of perceptive hypoacusis on the size of the MOC effect, and the tested group showed significant differences in hearing threshold on tonal audiometry. Therefore, the results presented in the abovementioned paper may not necessarily depend entirely on age-related changes in the MOC system but may also result from coexistent hypoacusis.
Papers by Parthasarathy19 and Kim et al18 report a more precise assessment of the influence of age on the functioning of the medial efferent pathways; in that study, the tests included subjects of different ages with normal hearing thresholds on tonal audiometry. Therefore, the influence of perceptive hypoacusis on MOC system function was excluded. Testing the suppressive effect in different age subgroups, they showed (similar to our article) that significantly weaker suppression of OAE level with CAS occurs in older subjects than in younger ones (MOC suppression for CEOAEs: subgroup of 20–39 years, contralateral stimulation, −2.2 dB; subgroup of 60–79 years, contralateral stimulation, −0.5 dB;19 and for DPOAEs, whole band mean: subgroup of 16–30 years, contralateral stimulation, −0.79±0.6 dB; subgroup of 38–52 years, contralateral stimulation, −0.14±0.25 dB; and subgroup of 62–75 years, contralateral stimulation, −0.03±0.52 dB).18 Because all tested subjects had normal hearing in tonal audiometry, it is very probable that the weakening of MOC functioning in the older subjects in this study is a consequence of the influence of processes taking place in the course of presbyacusis on efferent medial pathways and/or on OHC, which may become less sensitive to stimulation by the MOC system with age.18 In addition, both the acetylcholine content of the cochlear efferent system and the number of OHCs are known to decrease with age, which may or may not have significance for the process of weakening of the inhibitory activity of the MOC in the course of presbyacusis.
Kim et al18 and Jacobson et al7 tried to explain the influence of disturbances that take place in the auditory system with age on the functioning of the MOC system. It is obvious that the level of otoacoustic emissions decreases with age, indicating the onset of degenerative changes in OHC that occur, especially in the base turn of the cochlea, as has been confirmed by numerous studies,16,18,32 as well as by the results presented here. Kim et al18 and Jacobson et al7 showed that weakening of MOC function occurs in subjects aged 38–52 years compared with younger subjects (16–30 years), whereas the two groups do not differ significantly in DPOAE level. The conclusions presented here suggest that weakening of the inhibitory activity of the MOC may precede the functional disturbances in OHC that occur with age. The results obtained by Kim et al18 remain in concordance with present knowledge relating to the aging process in the hearing system, which holds that presbyacusis begins in middle age and that central changes may take place independent of disturbances in the inner ear.33 However, our own results do not confirm the abovementioned observation that the inhibitory activity of the MOC can precede functional disturbances in OHC.
In addition, Hood et al26 reported similar findings as those presented by Kim el al18 that is, the lack of correlation between CEOAE level and MOC effect. These authors analyzed the association between the level of the suppressive effect and baseline CEOAE level. Although the study included a group of patients with normal hearing and normal status of the middle ear, it showed considerable differences in CEOAE levels; nonetheless, the level of CEOAE did not exert a significant effect on the level of contralateral suppression.26
In the current study, we conducted similar analyses for both CEOAE and DPOAE. The results for the overall CEAOE response were similar to those reported by Hood et al26 namely, we did not document significant correlation between the baseline OAE level and the size of MOC effect. However, a weak, albeit significant, effect of emission level on the degree of suppression was observed at individual frequency analysis, both for CEOAE and DPOAE (the higher the OAE level, the stronger the MOC suppression). This means we cannot completely exclude the influence of degenerative changes taking place with age in the organ of Corti on the size of the MOC effect. These discrepancies in the results obtained by us and by Kim et al18 may be a result of the differences in the ages of the tested subjects and by the use of slightly different contralateral stimulation. Kim et al18 used BBN CAS at 30 dB SL, whereas we employed BBN CAS at 50 dB SL. The apparently weaker suppressive effect obtained by Kim et al18 in patients with normal OHC functioning may result from using very weak contralateral stimulation, and therefore obtaining a weaker stimulation of the MOC fiber bundle, resulting in a weaker inhibitory response from OHC than when using a stimulation at higher level.20 We therefore suspect that the use of weaker CAS increases the sensitivity of the efferent cochlear test, allowing for identification of very subtle changes in the MOC system. In contrast, the use of weak CAS makes the analysis of the MOC effect more difficult because of the very small differences in the otoacoustic emissions level obtained in conditions with and without CAS.
Other crucial results of this article and of the research carried out by Kim et al18 and Jacobson et al7 indicate a suppression decline occurring with age at 1–3 kHz, the frequency range with the greatest relevance for understanding speech. One of the basic functions of the MOC system is to improve detection of signal in BBN and to improve speech understanding in noise condition.11–15,34,35 Loss or decrease in MOC system functioning in the speech frequency range may play a significant role in the process of poorer speech understanding in noise.18 Disturbances of speech understanding make up the essence of the presbyacusis process. Moreover, they often precede a decrease in the hearing threshold,5,36 as central changes in the auditory system that take place with age may be independent of OHC degenerative changes.33,37 In relation to this point, many authors emphasize the significance of the efferent cochlear test in the early diagnosis of presbyacusis.7,16,18,19
As a criterion for division into particular groups, this and other studies used the age of the tested subjects. However, taking into account the literature,38,39 one should consider whether this criterion is justifiable in the assessment of the processes that take place in presbyacusis. There are often large differences in the functioning of the auditory system in subjects of similar age. This is related to the fact that the aging process is not age-dependent in a linear manner. For example, in the group of middle-aged subjects with normal hearing at tonal audiometry, one can find subjects with either normal or abnormal results on dichotic word recognition tests.39 Therefore, division into subgroups on the basis only of age or of hearing threshold at tonal audiometry clearly does not necessarily lead to creation of a homogeneous group for the advanced assessment of the presbyacusis process.38 It seems that to assess the influence of aging on the functioning of the hearing organ, it may be best to divide tested subjects into subgroups based on not only age or hearing threshold but also on the results of their speech discrimination tests. Those tests can be used for assessment of changes taking place at the central levels of the auditory pathway; therefore, they are a sensitive measure of processes related to presbyacusis. It is highly probable that taking into account the abovementioned qualification criteria for the assessment of presbyacusis influence on auditory organ functioning, including MOC functioning, we can obtain even greater differences among subgroups than when using only the age criterion. This is an interesting problem that demands further investigation.
The presence of the phenomenon opposite contralateral suppression (ie, the enhancement of otoacoustic emission level) is another intriguing issue associated with CAS.22,23,31,40,41 To the best of our knowledge, this study is the first one in which the prevalence of the enhancements, both for CEOAEs and DPOAEs, was analyzed in such a large material (a total of 292 ears), including various age groups. We revealed that the number of OAE enhancements during CAS increases with age for both CEOAEs and DPOAEs. Moreover, we observed more enhancements at higher frequency ranges.
Abdala et al31 showed that the enhancements are more frequent in preterm infants (43%) than in full-term neonates (24%) and adults (15%). This suggests that the activation of MOC plays a stimulatory role in preterm babies, rather than being the typical suppression response. The authors suggest that MOC bundle fibers may exert a stimulatory effect on OHCs at the early stages of olivocochlear pathway maturation, and their specific suppressive effect is observed at further stages of development. Therefore, higher prevalence of the paradoxical contralateral effect (ie, an increase in OAE level during CAS) in older persons can be associated with a number of degenerative and involution processes taking place in the auditory system during presbyacusis. Demyelination of MOC bundle fibers, weaker inhibitory effect of acetylcholine in the MOC system, and resultant disorders of neurotransmission would constitute potential factors involved in the evolution of the suppressive effect of the MOC system into the stimulation of OHC.31
In turn, Nieschalk et al40 analyzed the role of the cochlear enhancer in the presence of low-level CAS. They suggested that low levels of CAS may exert a stimulatory, rather than suppressive, effect on the cochlear enhancer; this hypothesis is supported by an increase in the suppressive effect observed at higher levels of CAS. The abovementioned findings may, to some degree, explain the age-related increase in the number of enhancements, as degenerative changes of afferent and efferent fibers observed during presbyacusis can be reflected by a decrease in contralateral stimulation.40 Finally, Quaranta et al41 explained the phenomenon of enhancement as a result of otherwise undetermined adaptive processes associated with neurotransmission within the MOC fibers. When activated, these fibers would not cause OHCs but, rather, their stimulation and the enhancement of the response.41
Our study revealed that the number of enhancements increases not only with age but also with frequency. Perhaps this results from the fact that apart from the age-related changes in the MOC system, degenerative processes taking place within OHC and a decreased number of the latter, especially at the basal turn, also contribute to a paradoxical response to CAS in this region.
Conclusion
On the basis of our study, we have found a decrease in the strength of the MOC system with increasing age in normally hearing subjects, as reflected by a decrease of the OAE suppression effects in older individuals and by an increase of the number of CEOAE and DPOAE enhancements during CAS found in the elderly, especially in the high-frequency range.
Acknowledgments
Professor Jacek Smurzynski, from the Department of Audiology and Speech-Language Pathology, East Tennessee State University, Johnson City, provided helpful and insightful comments on this article.
Disclosure
The authors report no conflicts of interest in this work.
References
Schmiedt RA. Effects of aging on potassium homeostasis and the endocochlear potential in the gerbil cochlea. Hear Res. 1996; 102(1–2):125–132. | ||
Schulte BA, Schmiedt RA. Lateral wall Na,K-ATPase and endocochlear potentials decline with age in quiet-reared gerbils. Hear Res. 1992;61(1–2):35–46. | ||
Spongr VP, Flood DG, Frisina RD, Salvi RJ. Quantitative measures of hair cell loss in CBA and C57BL/6 mice throughout their life spans. J Acoust Soc Am. 1997;101(6):3546–3553. | ||
Walton JP, Simon H, Frisina RD. Age-related alterations in the neural coding of envelope periodicities. J Neurophysiol. 2002;88(2): 565–578. | ||
Willott J. Aging and the Auditory System: Anatomy, Physiology and Psychophysics. San Diego, CA: Singular Publishing Group; 1991. | ||
O’Neill WE, Zettel ML, Whittemore KR, Frisina RD. Calbindin D-28k immunoreactivity in the medial nucleus of the trapezoid body declines with age in C57BL/6, but not CBA/CaJ, mice. Hear Res. 1997; 112(1–2):158–166. | ||
Jacobson M, Kim S, Romney J, Zhu X, Frisina RD. Contralateral suppression of distortion-product otoacoustic emissions declines with age: a comparison of findings in CBA mice with human listeners. Laryngoscope. 2003;113(10):1707–1713. | ||
Raza A, Milbrandt JC, Arneric SP, Caspary DM. Age-related changes in brainstem auditory neurotransmitters: measures of GABA and acetylcholine function. Hear Res. 1994;77(1–2):221–230. | ||
Lynch-Erhardt M, Frisina R. Presence of acetylcholinesterase labeling in the auditory brainstem of young adult and old CBA mice. ARO Annual Meeting. 2001:282. | ||
Guinan JJ Jr. Olivocochlear efferents: anatomy, physiology, function, and the measurement of efferent effects in humans. Ear Hear. 2006; 27(6):589–607. | ||
Guinan JJ Jr. Cochlear efferent innervation and function. Curr Opin Otolaryngol Head Neck Surg. 2010;18(5):447–453. | ||
Mishra SK, Lutman ME. Top-down influences of the medial olivocochlear efferent system in speech perception in noise. PLoS One. 2014; 9(1):e85756. | ||
de Boer J, Thornton AR, Krumbholz K. What is the role of the medial olivocochlear system in speech-in-noise processing? J Neurophysiol. 2012;107(5):1301–1312. | ||
Mukari SZ, Mamat WH. Medial olivocochlear functioning and speech perception in noise in older adults. Audiol Neurootol. 2008; 13(5):328–334. | ||
Yilmaz ST, Sennaroğlu G, Sennaroğlu L, Köse SK. Effect of age on speech recognition in noise and on contralateral transient evoked otoacoustic emission suppression. J Laryngol Otol. 2007;121(11): 1029–1034. | ||
Castor X, Veuillet E, Morgon A, Collet L. Influence of aging on active cochlear micromechanical properties and on the medial olivocochlear system in humans. Hear Res. 1994;77(1–2):1–8. | ||
Keppler H, Dhooge I, Corthals P, et al. The effects of aging on evoked otoacoustic emissions and efferent suppression of transient evoked otoacoustic emissions. Clin Neurophysiol. 2010;121(3):359–365. | ||
Kim S, Frisina DR, Frisina RD. Effects of age on contralateral suppression of distortion product otoacoustic emissions in human listeners with normal hearing. Audiol Neurootol. 2002;7(6):348–357. | ||
Parthasarathy TK. Aging and contralateral suppression effects on transient evoked otoacoustic emissions. J Am Acad Audiol. 2001; 12(2):80–85. | ||
Quaranta N, Debole S, Di Girolamo S. Effect of ageing on otoacoustic emissions and efferent suppression in humans. Audiology. 2001;40(6):308–312. | ||
Berlin CI, Hood LJ, Wen H, et al. Contralateral suppression of non-linear click-evoked otoacoustic emissions. Hear Res. 1993;71(1–2):1–11. | ||
Lisowska G, Smurzynski J, Morawski K, Namyslowski G, Probst R. Influence of contralateral stimulation by two-tone complexes, narrow-band and broad-band noise signals on the 2f1–f2 distortion product otoacoustic emission levels in humans. Acta Otolaryngol. 2002;122(6):613–619. | ||
Maison S, Micheyl C, Andéol G, Gallégo S, Collet L. Activation of medial olivocochlear efferent system in humans: influence of stimulus bandwidth. Hear Res. 2000;140(1–2):111–125. | ||
Velenovsky DS, Glattke TJ. The effect of noise bandwidth on the contralateral suppression of transient evoked otoacoustic emissions. Hear Res. 2002;164(1–2):39–48. | ||
Berlin CI, Hood LJ, Hurley AE, Wen H, Kemp DT. Binaural noise suppresses linear click-evoked otoacoustic emissions more than ipsilateral or contralateral noise. Hear Res. 1995;87(1–2):96–103. | ||
Hood LJ, Berlin CI, Hurley A, Cecola RP, Bell B. Contralateral suppression of transient-evoked otoacoustic emissions in humans: intensity effects. Hear Res. 1996;101(1–2):113–118. | ||
Guinan JJ Jr, Backus BC, Lilaonitkul W, Aharonson V. Medial olivocochlear efferent reflex in humans: otoacoustic emission (OAE) measurement issues and the advantages of stimulus frequency OAEs. J Assoc Res Otolaryngol. 2003;4(4):521–540. | ||
Kummer P, Janssen T, Hulin P, Arnold W. Optimal L(1)–L(2) primary tone level separation remains independent of test frequency in humans. Hear Res. 2000;146(1–2):47–56. | ||
Neely ST, Johnson TA, Gorga MP. Distortion-product otoacoustic emission measured with continuously varying stimulus level. J Acoust Soc Am. 2005;117(3 Pt 1):1248–1259. | ||
Whitehead ML, McCoy MJ, Lonsbury-Martin BL, Martin GK. Dependence of distortion-product otoacoustic emissions on primary levels in normal and impaired ears. I. Effects of decreasing L2 below L1. J Acoust Soc Am. 1995;97(4):2346–2358. | ||
Abdala C, Ma E, Sininger YS. Maturation of medial efferent system function in humans. J Acoust Soc Am. 1999;105(4):2392–2402. | ||
Avan P, Elbez M, Bonfils P. Click-evoked otoacoustic emissions and the influence of high-frequency hearing losses in humans. J Acoust Soc Am. 1997;101(5 Pt 1):2771–2777. | ||
Snell KB, Frisina DR. Relationships among age-related differences in gap detection and word recognition. J Acoust Soc Am. 2000; 107(3):1615–1626. | ||
Micheyl C, Collet L. Involvement of the olivocochlear bundle in the detection of tones in noise. J Acoust Soc Am. 1996;99(3):1604–1610. | ||
Winslow RL, Sachs MB. Single-tone intensity discrimination based on auditory-nerve rate responses in backgrounds of quiet, noise, and with stimulation of the crossed olivocochlear bundle. Hear Res. 1988; 35(2–3):165–189. | ||
Frisina DR, Frisina RD. Speech recognition in noise and presbycusis: relations to possible neural mechanisms. Hear Res. 1997;106(1–2): 95–104. | ||
Fitzgibbons PJ, Gordon-Salant S. Auditory temporal processing in elderly listeners. J Am Acad Audiol. 1996;7(3):183–189. | ||
Jerger J. The complexities of research in aging. J Am Acad Audiol. 2006;17(4):2. | ||
Roup CM, Wiley TL, Wilson RH. Dichotic word recognition in young and older adults. J Am Acad Audiol. 2006;17(4):230–240. | ||
Nieschalk M, Beneking R, Stoll W. Human distortion product otoacoustic emissions altered by contralateral sound stimulation – an investigation of an increase in amplitude. HNO. 1997;45(5):378–384. | ||
Quaranta A, Gandolfi A, Fava G, Quaranta N, Zini C. Paradoxical effects of contralateral white noise on evoked otoacoustic emissions in ears with acoustic neuroma. Acta Otolaryngol. 2000;120(2):227–230. |
 © 2014 The Author(s). This work is published and licensed by Dove Medical Press Limited. The full terms of this license are available at https://www.dovepress.com/terms.php and incorporate the Creative Commons Attribution - Non Commercial (unported, v3.0) License.
By accessing the work you hereby accept the Terms. Non-commercial uses of the work are permitted without any further permission from Dove Medical Press Limited, provided the work is properly attributed. For permission for commercial use of this work, please see paragraphs 4.2 and 5 of our Terms.
© 2014 The Author(s). This work is published and licensed by Dove Medical Press Limited. The full terms of this license are available at https://www.dovepress.com/terms.php and incorporate the Creative Commons Attribution - Non Commercial (unported, v3.0) License.
By accessing the work you hereby accept the Terms. Non-commercial uses of the work are permitted without any further permission from Dove Medical Press Limited, provided the work is properly attributed. For permission for commercial use of this work, please see paragraphs 4.2 and 5 of our Terms.