")
Back to Journals » International Journal of Nanomedicine » Volume 14
Induction of antigen-specific immune tolerance using biodegradable nanoparticles containing antigen and dexamethasone
Authors Kim SH, Moon JH, Jeong SU , Jung HH , Park CS, Hwang BY , Lee CK
Received 2 April 2019
Accepted for publication 4 June 2019
Published 12 July 2019 Volume 2019:14 Pages 5229—5242
DOI https://doi.org/10.2147/IJN.S210546
Checked for plagiarism Yes
Review by Single anonymous peer review
Peer reviewer comments 2
Editor who approved publication: Prof. Dr. Anderson Oliveira Lobo
Sang-Hyun Kim, Jun-Hyeok Moon, Seong-Un Jeong, Ho-Hyun Jung, Chan-Su Park, Bang Yeon Hwang, Chong-Kil Lee
College of Pharmacy, Chungbuk National University, Cheongju, Korea
Purpose: Dexamethasone (Dex) has long been used as a potent immunosuppressive agent in the treatment of inflammatory and autoimmune diseases, despite serious side effects. In the present study, Dex and model antigen ovalbumin (OVA) were encapsulated with poly(lactic-co-glycolic acid) to deliver Dex and OVA preferentially to phagocytic cells, reducing systemic side effects of Dex. The OVA-specific immune tolerance-inducing activity of the nanoparticles (NPs) was examined.
Methods: Polymeric NPs containing OVA and Dex (NP[OVA+Dex]) were prepared by the water-in-oil-in-water double emulsion solvent evaporation method. The effects of NP[OVA+Dex] on the maturation and function of immature dendritic cells (DCs) were examined in vitro. Furthermore, the OVA-specific immune tolerizing effects of NP[OVA+Dex] were confirmed in mice that were intravenously injected or orally fed with the NPs.
Results: Immature DCs treated in vitro with NP[OVA+Dex] did not mature into immunogenic DCs but instead were converted into tolerogenic DCs. Furthermore, profoundly suppressed generation of OVA-specific cytotoxic T cells and production of OVA-specific IgG were observed in mice injected with NP[OVA+Dex], whereas regulatory T cells were concomitantly increased. Feeding of mice with NP[OVA+Dex] also induced OVA-specific immune tolerance.
Conclusion: The present study demonstrates that oral feeding as well as intravenous injection of poly(lactic-co-glycolic acid) NPs encapsulating both antigen and Dex is a useful means of inducing antigen-specific immune tolerance, which is crucial for the treatment of autoimmune diseases.
Keywords: polymeric nanoparticle, dexamethasone, ovalbumin, tolerogenic dendritic cell, antigen-specific immune tolerance
Introduction
Dendritic cells (DCs) are the most efficient antigen presenting cells (APCs) that can prime naïve T cells.1–3 Broadly, DCs can be classified into two functionally different populations, immunogenic DCs and tolerogenic DCs.4 Immunogenic DCs express high levels of co-stimulatory molecules, such as CD80 or CD86, and produce pro-inflammatory cytokines, such as interleukin (IL)-1, IL-6, IL-12, and tumor necrosis factor (TNF)-α, enabling them to induce antigen-specific T cell priming and activation.5,6 In contrast, tolerogenic DCs express low levels of co-stimulatory molecules and are deficient in pro-inflammatory cytokine production and T cell stimulatory activity. Tolerogenic DCs produce immunosuppressive cytokines such as IL-10 and transforming growth factor (TGF)-β, and express higher levels of co-inhibitory molecules such as programmed death-ligand 1 (PD-L1) and inducible co-stimulator ligand (ICOSL), consequently promoting the differentiation of naïve T cells into regulatory T (Treg) cells.6–12 The therapeutic efficacy of ex vivo-generated tolerogenic DCs has been demonstrated in animal models of autoimmune diseases and graft rejection.12–16 Based on the successes in small animal models, several clinical trials have been completed or are on-going in patients with autoimmune diseases such as rheumatoid arthritis, type 1 diabetes, multiple sclerosis, and Crohn’s disease.17–20
Dexamethasone (Dex), a synthetic glucocorticoid, has 30-fold more potent immunosuppressive activity than cortisol.21 Dex affects the differentiation, maturation, and function of many immune cells, such as T cells, macrophages, monocytes and DCs.22–25 In particular, DCs generated with Dex have the properties of tolerogenic DCs.26,27 Dex is used as a potent immunosuppressive and anti-inflammatory drugs to treat chronic inflammatory diseases, autoimmune diseases, and organ-graft rejection.28–30 However, systemic administration of Dex has numerous serious side effects such as suppression of many immune cells, increased risk of infection, high blood pressure, and development of diabetes.31,32
Poly (D, L-lactic-co-glycolic acid) (PLGA) is a biodegradable and biocompatible polymer that is eventually hydrolyzed to lactic acids and glycolic acids in the body and removed from the body via the citric acid cycle; it is used for the generation of polymeric nanoparticles (NPs) for pharmacological uses.33 PLGA-NPs can encapsulate biologically active compounds including hormones, antibiotics or anti-cancer drugs, or antigens such as proteins, peptides, DNA or RNA.34 A major advantage of encapsulating pharmacological drugs with PLGA is suspended release of the drug. From an immunological point of view, PLGA-NPs containing both antigens and drugs have remarkable advantages, as they can specifically deliver the antigens and the drugs to phagocytes, such as DCs and macrophages, thus reducing the potential systemic side effects of the drugs.34,35
In this study, we investigated the therapeutic potential of PLGA-NPs containing both antigen and Dex. Our results show that DCs treated with PLGA-NPs containing both antigen and Dex have tolerogenic DC properties that can induce to antigen-specific as well as antigen-nonspecific immune suppression. In addition, we demonstrate that intragastric (i.g.) feeding, as well as intravenous (i.v.) injection, of PLGA-NPs containing both antigen and Dex induces antigen-specific immune tolerance in mice.
Materials and methods
Animals
Female C57BL/6 and BALB/c mice (8–12 weeks old) were purchased from Kosa Bio Inc. (Seongnam, South Korea). OT-II mice were provided by Dr. Seong Kug Eo (College of Veterinary Medicine, Chonbuk National University, Iksan, South Korea). All experimental procedures involving animals were approved by the Institutional Animal Care and Use Committee (IACUC) of Chungbuk National University, Cheongju, South Korea and performed in accordance with the IACUC guidelines and regulations.
Generation of DCs from bone marrow cells
DCs were generated as previously described.27 Briefly, bone marrow cells obtained from mouse femurs were cultured in 6-well plates (5×10⁶ cells/well) in culture medium supplemented with 40 ng/mL granulocyte macrophage-colony stimulating factor and 40 ng/mL IL-4 (both from CreaGene, Seongnam, South Korea). After 3 days, the non-adherent cells were removed by gently shaking the dish and then replacing the medium. On day 4, the non-adherent cells were again removed by the same method. On day 6, half the culture medium was replaced with fresh medium. To induce maturation, DCs were exposed to 50 ng/mL interferon (IFN)-γ and 50 ng/mL tumor necrosis factor (TNF)-α (both from PeproTech Inc., Rocky Hill, NJ, USA), or treated with the indicated NPs for 48 h. The DCs were harvested by gentle pipetting on day 8.
Preparation of PLGA-NPs
PLGA-NPs containing ovalbumin (OVA; Sigma-Aldrich, St. Louis, MO, USA) and Dex (Sigma-Aldrich) (NP[OVA+Dex]) were prepared using a solvent evaporation method, as previously described.27 Briefly, 800 μL of 100 mg/mL OVA in water were mixed with 4 mL of 100 mg/mL PLGA (lactide:glycolide 50:50, Mw 24,000–38,000, acid terminated; Evonik Industries, Essen, Germany) and 2 mg Dex in ethyl acetate (Sigma-Aldrich). The mixture was then homogenized at 20,000 rpm (T10 basic Homogenizer, IKA, Staufen, Germany) to form water-in-oil (w/o) emulsion. After 3 min of emulsification, 11 mL of a 5% polyvinyl alcohol aqueous solution (PVA, Sigma-Aldrich) were added to the w/o emulsion to form a water-in-oil-in-water (w/o/w) double emulsion, which was homogenized for 5 min. To solidify the nanoparticles, the organic solvent was evaporated by stirring the double emulsion with 200 mL of a 0.1% PVA aqueous solution at 500 rpm for 2 h. The resulting NPs were centrifuged at 3,000 rpm for 20 min and washed twice with phosphate-buffered saline (PBS). NPs containing only OVA (NP[OVA]) were prepared by the same method without adding Dex to the PLGA solution. The NPs were prepared just before use, or frozen in aliquots at −20°C for later use.
Characterization of PLGA-NPs
The mean size and zeta-potential of NP[OVA+Dex] and NP[OVA] were measured using a particle size analyzer (ELS-Z, Otsuka, Japan). The OVA content was determined using a microbicinchoninic acid assay kit (Pierce, Rockford, IL, USA) after lysing the NP[OVA+Dex] in a lysis buffer containing 0.1% SDS and 0.1 N NaOH, as previously described.27 For quantitation of Dex, high performance liquid chromatography (HPLC) analysis was performed using a Waters HPLC system (Waters Corp., Milford, MA, USA) equipped with Waters 515 pumps, Waters 2996 photodiode array detector, and Waters Empower software using a YMC J’sphere ODS-H80 column (YMC America Inc., Allentown, PA, USA; 4 μm, 150 mm ×4.6 mm) after lysing the NP[OVA+Dex] in a 1:2 mixture of DMSO and methanol. Chromatographic separation was accomplished using a gradient solvent system of acetonitrile-water (ratio range, 20:80 to 100:0) for 30 min at a flow rate of 1.0 mL/min. Dex was detected by UV absorbance at 240 nm.
Phenotype analysis
Cells were stained with monoclonal antibodies against mouse cell surface markers, CD11c, H-2Kb, I-Ab, CD80, CD86, CD4, TCR Vα2, CD25 and Foxp3, and an isotype-matched control antibody (BD Biosciences, San Jose, CA, USA), as described previously.27 For intracellular Foxp3 staining, cells were permeabilized using the BD Cytofix/Cytoperm Plus kit (BD Biosciences), according to the manufacturer’s instructions. Subsequent analyses were performed using the FlowJo software (TreeStar, Ashland, OR, USA).
Cytokine production analysis
Immature DCs, harvested by gentle pipetting on day 6 and seeded in 24-well plates (1×10⁶ cells/well), were stimulated with 50 ng/mL IFN-γ plus 50 ng/mL TNF-α, or treated with NP[OVA] or NP[OVA+Dex] (10 μg/mL as OVA) for 48 h, except in the experiments that induced TNF-α production from DCs. For TNF-α production, DCs were stimulated with 50 ng/mL IFN-γ and 100 ng/mL lipopolysaccharide (LPS) for 48 h. The amounts of TNF-α, IL-1β, IL-6, IL-12p40, and IL-10 in the culture supernatants were measured using commercial ELISA kits (BD Biosciences). The amount of TGF-β1 was measured using an ELISA kit from R&D systems (Minneapolis, MN, USA) after treating the culture supernatant with the Sample Activation Kit 1 (R&D systems), as previously described.27
MHC class II-restricted OVA presentation assay
DCs (1×10⁵ cells/well) were incubated with the indicated NPs (50 μg/mL as OVA) for 2 h, washed with pre-warmed PBS, fixed with 1% paraformaldehyde, and washed with PBS. The OVA-specific CD4 T cell stimulatory capacity of the DCs was measured using OVA-specific CD4+ T cell hybridoma DOBW cells, which recognize OVA323–339-I-Ad complexes and secrete IL-2 in response, as previously described.27
Isolation of T cells
Total T cells were purified from the spleens of BALB/c or OT-II mice by adding the spleen cells to a nylon wool column and incubating for 1 h to remove adherent cells. CD4+CD25− T cells were isolated from the adherent cell-depleted spleen cells of BALB/c or OT-II mice using a CD4+CD25− T cell isolation kit (Miltenyi Biotec Inc., Auburn, CA, USA).
Allogeneic T cell stimulatory activity
C57BL/6 bone marrow-derived DCs (1.25×10⁴ cells/well, 2.5×10⁴ cells/well, or 5×10⁴ cells/well) were stimulated with 50 ng/mL IFN-γ plus 50 ng/mL TNF-α, or treated with NP[OVA] or NP[OVA+Dex] (10 μg/mL as OVA) for 48 h, added with total T cells (5×10⁵ cells/well) isolated from the spleens of BALB/c mice, and cultured for 96 h. DNA synthesis was measured by incorporating [3H]-thymidine, which was added before the final 18 h of culture.
In vitro generation of Foxp3+ Treg cells from naïve CD4+CD25− T cells
DCs (2×10⁴ cells/well), stimulated with 50 ng/mL IFN-γ plus 50 ng/mL TNF-α, or treated with NP[OVA] or NP[OVA+Dex] (10 μg/mL as OVA) for 48 h, were co-cultured with purified CD4+CD25− T cells (2×10⁵ cells/well) for 4 days in a medium containing 100 U/mL of recombinant human IL-2 (PeproTech Inc.). The cells were stained with monoclonal antibodies specific for mouse CD4, CD25 and Foxp3, and the proportion of CD25+Foxp3+ T cells in the CD4+ T cell population was analyzed by flow cytometry.
In vivo OVA-specific cytotoxic T lymphocyte (CTL) assay
C57BL/6 mice were i.v. immunized with PBS, NP[OVA], or NP[OVA+Dex] (100 μg/mouse as OVA). Seven days later, OVA-specific CTL activity was assessed using an in vivo CTL assay, as previously described.36 Briefly, splenocytes from naïve syngeneic mice were pulsed with 1 μM OVA257–264 peptide for 1 h at 37 °C and then labeled with a high concentration of carboxyfluorescein succinimidyl ester (CFSE, 25 μM). The other control target population was syngeneic splenocytes labeled with a low concentration of CFSE (5 μM) without pulsing with the OVA peptide. A 1:1 mixture of each target cell population was injected via the tail vein into the immunized mice (1×10⁷ cells/mouse). After 18 h, specific killing of OVA peptide-pulsed target cells was determined using spleen cells isolated from each mouse by flow cytometry.
OVA-specific IgG production analysis
C57BL/6 mice were i.v. immunized with PBS, NP[OVA], or NP[OVA+Dex] (100 μg/mouse as OVA). After 7 days, sera were collected, and the amounts of OVA-specific IgG were measured by an ELISA, as previously described.37 Briefly, 96-well immunoplates were coated overnight with OVA (2 mg/mL in PBS), blocked with 10% fetal bovine serum in PBS, and loaded with 1:20,000 dilutions of serum. After 2 h incubation, the plates were washed and then horseradish peroxidase-conjugated goat anti-mouse IgG antibodies (Sigma-Aldrich; 1:5,000) were then added for specific binding, followed by 3,30,5,50-tetramethybenzidine (BD Biosciences) substrate solution and 1 M H2SO4 stop solution. Absorbance was read at a wavelength of 450 nm and 570 nm with an ELISA plate reader.
Induction and assessment of OVA-specific oral tolerance
PBS, NP[OVA], or NP[OVA+Dex] (200 μg/mouse as OVA) was i.g. administered into C57BL/6 mice on day 0 and 2. On day 9, mice were i.v. immunized with NP[OVA] (80 μg/mouse as OVA). OVA-specific CTL activity and OVA-specific IgG production were assessed 7 days after i.v. immunization with NP[OVA].
Statistical analysis
One-way ANOVA analysis and Tukey post-hoc tests were performed to compare the significance of multiple groups; p≤0.05 was considered statistically significant.
Results
Fabrication and characterization of NPs containing OVA and Dex
NP[OVA+Dex] and NP[OVA] were fabricated with PLGA using the w/o/w double emulsion solvent evaporation method, and the physicochemical properties of the NPs were evaluated (Table 1). The mean size (diameter) of NP[OVA+Dex] and NP[OVA] was 864.8±20.5 and 863.2±62.9 nm, respectively. Based on our previous experiences, we decided to prepare polymeric NPs in this range, as they are large enough to contain sufficient amounts of antigen and drug, and are the optimal size for phagocytosis by the antigen presenting cells.38,39 As shown in the scanning electron microphotograph, NP[OVA+Dex] had a spherical shape with a relatively homogeneous particle size distribution (Figure S1). The average OVA and Dex content in NP[OVA+Dex] was 148.4 μg and 0.978 μg per mg NP, respectively. These amounts of OVA and Dex correspond to 3.475 nmol OVA and 2.492 nmol Dex per mg NP; hence the OVA:Dex molar ratio in NP[OVA+Dex] is 1.394:1. The average polydispersity index and zeta-potential of the NP[OVA+Dex] were 0.269 and −1.79 mV, respectively. The in vitro release kinetics of OVA and Dex were examined after incubating NP[OVA+Dex] in buffers with pH 3.0 and pH 7.0 at 37°C (Figure S2). The release kinetics of OVA and Dex from NP[OVA+Dex] was almost the same at both pH 3.0 and pH 7.0. The amounts of OVA and Dex remaining inside the NPs after 2 h incubation at pH 3.0 were approximately 77% and 83%, respectively.
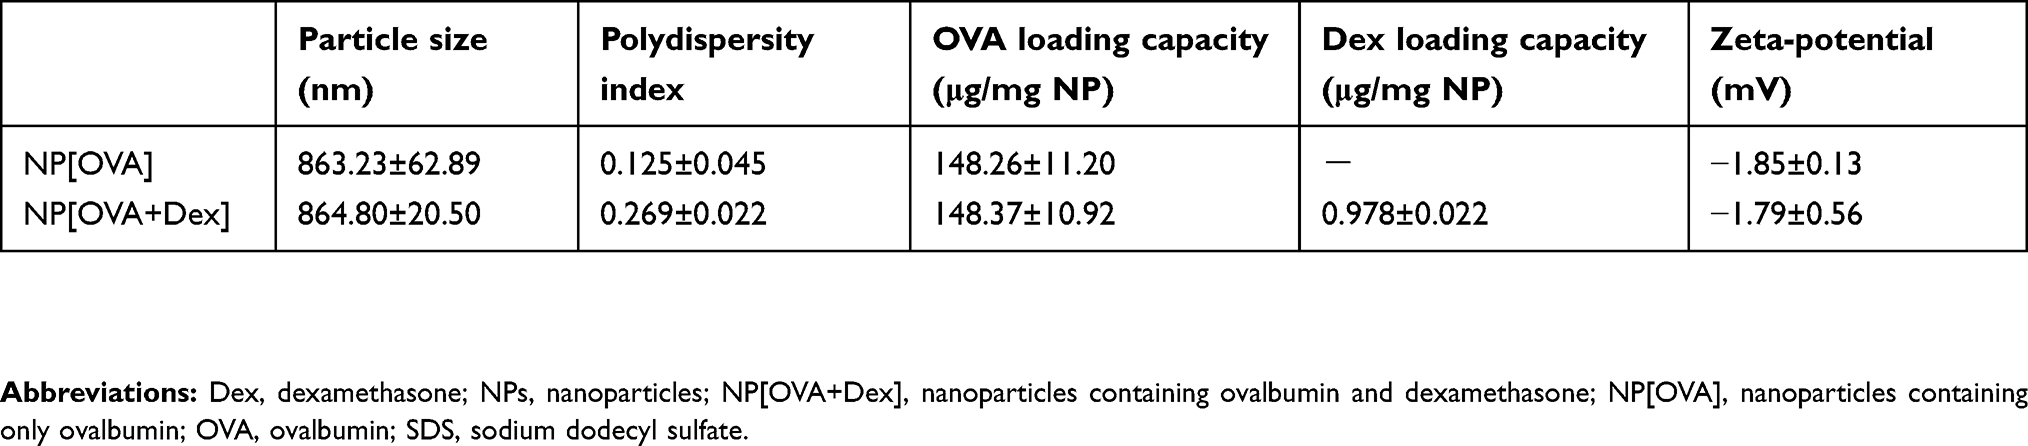 |
Table 1 Characterization of PLGA-NPs |
DCs phagocytosed of NPs containing Dex exert properties of tolerogenic DCs
To examine the effects of NP[OVA+Dex] on the maturation and function of DCs, immature DCs generated from mouse bone marrow cells were treated with NP[OVA+Dex] for 2 days. Control DCs were treated with NP[OVA] or matured with IFN-γ plus TNF-α. Phenotypic analysis of the DCs showed that NP[OVA+Dex]-treated DCs expressed much lower levels of major histocompatibility complex (MHC) class II (I-Ab), CD80, and CD86 molecules, all of which are essential in antigen-specific T cell priming, compared to the control DCs (Figure 1A and B). The expression of PD-L1, known as an co-inhibitory molecule, was slightly reduced in DCs treated with NP[OVA+Dex]. However, the proportion of the CD86loPD-L1hi cell population was significantly higher in NP[OVA+Dex]-treated DCs (76.0%) than in immature DCs (62.4%), cytokine-matured DCs (45.3%), or NP[OVA]-treated DCs (51.3%) (Figure 1C and D).
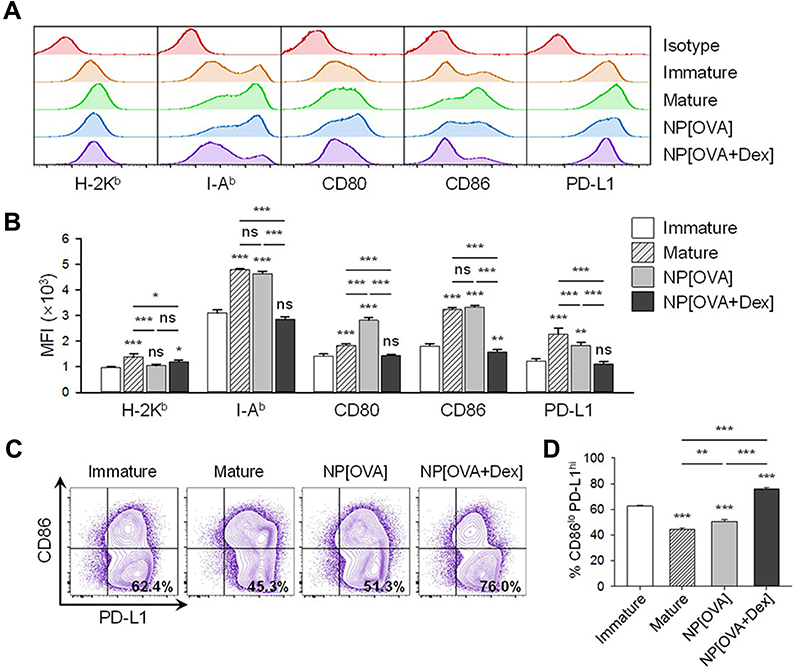 |
Figure 1 Effects of NP[OVA+Dex] on the expression of cell surface molecules in DCs. Notes: (A) DCs generated from the bone marrow cells of C57BL/6 mice were stimulated with IFN-γ (50 ng/mL) plus TNF-α (50 ng/mL), or treated with NP[OVA] or NP[OVA+Dex] (10 μg/mL as OVA) for 48 h. DCs were stained for CD11c, H-2Kb, I-Ab, CD80, CD86, and PD-L1. CD11c+ cells were gated and analyzed for the expression of cell surface molecules. The data shown are representative histograms of four independent experiments. (B) Mean fluorescence intensities of NP-treated, or untreated DCs. The data are presented as the mean ± SD of four independent experiments. (C) Expression of CD86 and PD-L1 in NP-treated, or untreated DCs. The data shown are representative histograms of four independent experiments. (D) The proportion of CD86loPD-L1hi cells in each experimental group is shown. The data are presented as the mean ± SD of four independent experiments. The significance of the data was evaluated using a Tukey test of one-way ANOVA test. *P<0.05, **P<0.01, ***P<0.001. “ns” indicates no significant difference. Abbreviations: DCs, dendritic cells; Dex, dexamethasone; IFN-γ, interferon-γ; NP, nanoparticle; NP[OVA+Dex], nanoparticles containing ovalbumin and dexamethasone; NP[OVA], nanoparticles containing only ovalbumin; OVA, ovalbumin; PD-L1, programmed death-ligand 1; SD, standard deviation; TNF-α, tumor necrosis factor-α. |
Phagocytosis of NPs on their own activates DC maturation and cytokine production. As shown in Figure 2, DCs treated with NP[OVA] produce much higher amounts of pro-inflammatory cytokines, IL-1β, IL-6, IL-12 and TNF-α, than the DCs matured with cytokines. However, the production of these inflammatory cytokines was profoundly suppressed in NP[OVA+Dex]-treated DCs (Figure 2). In contrast, NP[OVA+Dex]-treated DCs produced significantly high amount of IL-10, compared to DCs treated with NP[OVA], or matured with cytokines. There was no significant differences in TGF-β1 production.
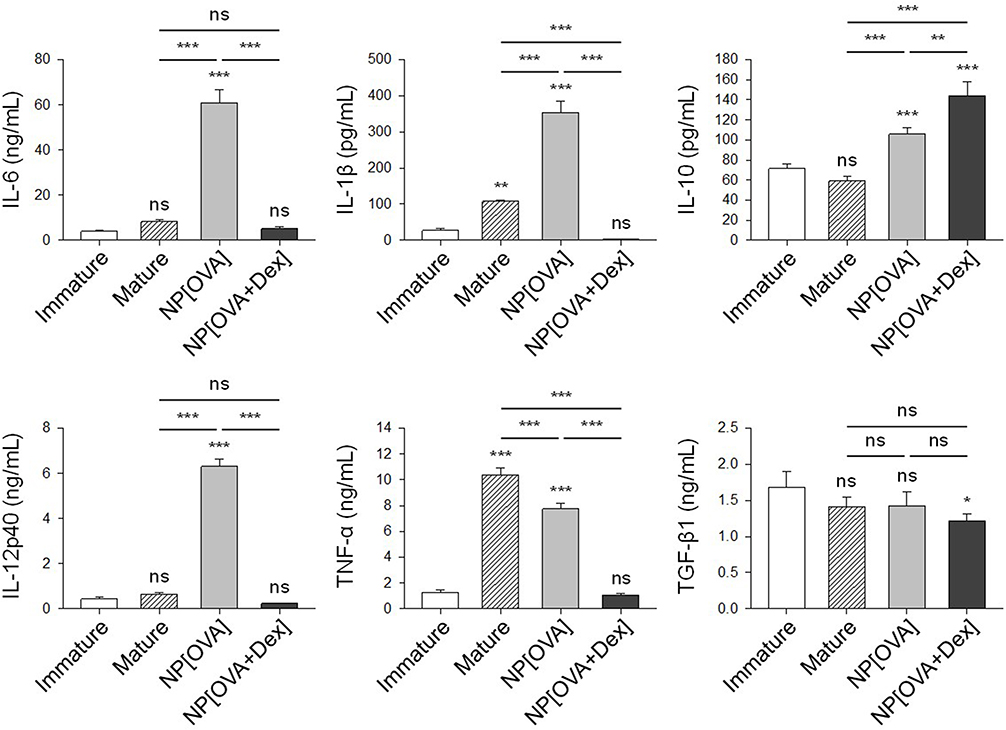 |
Figure 2 Effects of NP[OVA+Dex] on cytokine production in DCs.Notes: DCs generated from bone marrow cells of C57BL/6 mice were stimulated with IFN-γ (50 ng/mL) plus TNF-α (50 ng/mL), or treated with NP[OVA] or NP[OVA+Dex] (10 μg/mL as OVA) for 48 h. For TNF-α production, DCs were stimulated with IFN-γ (50 ng/mL) plus LPS (100 ng/mL). Cytokine secretion to culture supernatant was determined by ELISA. The data are presented as the mean ± SD of three independent experiments. *P<0.05, **P<0.01, ***P<0.001. “ns” indicates no significant difference.Abbreviations: DCs, dendritic cells; Dex, dexamethasone; ELISA, enzyme-linked immunosorbent assay; IFN-γ, interferon-γ; LPS, lipopolysaccharide; NP[OVA+Dex], nanoparticles containing ovalbumin and dexamethasone; NP[OVA], nanoparticles containing only ovalbumin; OVA, ovalbumin; SD, standard deviation; TNF-α, tumor necrosis factor-α. |
The T cell stimulatory capacity of NP-treated DCs was also investigated using an MHC class II-restricted exogenous antigen presentation assay and allogeneic mixed lymphocyte reaction (MLR). In exogenous antigen presentation assays, DCs were incubated with the NPs for 2 h, washed and fixed, and then co-cultured with OVA-specific CD4+ T cell hybridoma, DOBW cells, which recognize OVA323-339-I-Ad complexes and secrete IL-2. The MHC class II-restricted OVA peptide presentation capacity of NP[OVA+Dex]-treated DCs was profoundly suppressed compared with that of NP[OVA]-treated DCs (Figure 3A). In addition, NP[OVA+Dex]-treated DCs were significantly deficient in allogeneic T cell stimulation, compared with NP[OVA]-treated DCs (Figure 3B).
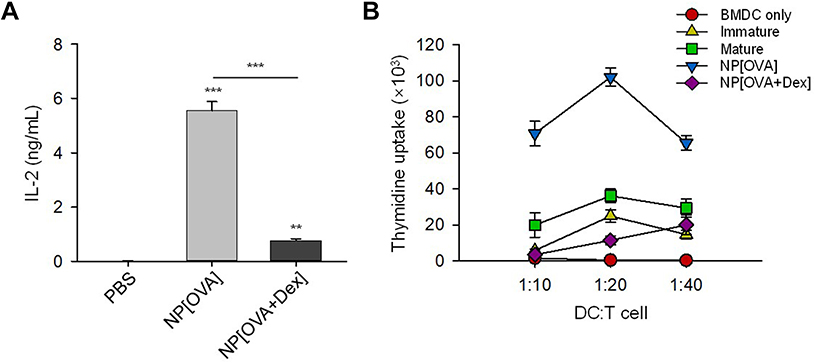 |
Figure 3 DCs treated with NP[OVA+Dex] are impaired in both MHC class II-restricted exogenous antigen presentation and allogeneic T cell stimulatory capacity.Notes: (A) DCs generated from bone marrow cells of BALB/c mice were treated with PBS, NP[OVA], or NP[OVA+Dex] (50 μg/mL as OVA) for 2 h. After washing and fixing, DCs were co-cultured with OVA323-339-specific DOBW cells. The supernatants were harvested and IL-2 production was measured by ELISA. The data are presented as mean ± SD of three independent experiments. (B) DCs generated from C57BL/6 mouse bone marrow cells were stimulated with IFN-γ (50 ng/mL) plus TNF-α (50 ng/mL), or treated with NP[OVA] or NP[OVA+Dex] (10 μg/mL as OVA) for 48 h. DCs were then co-cultured with T cells isolated from the spleens of BALB/c mice at the indicated ratios for 96 h. T cell proliferation was measured by the incorporation3H-thymidine added for the final 18 h of culture. **P<0.01, ***P<0.001. Abbreviations: DCs, dendritic cells; Dex, dexamethasone; ELISA, enzyme-linked immunosorbent assay; IFN-γ, interferon-γ; IL-2, interleukin-2; MHC, major histocompatibility complex; NP[OVA+Dex], nanoparticles containing ovalbumin and dexamethasone; NP[OVA], nanoparticles containing only ovalbumin; OVA, ovalbumin; PBS, phosphate-buffered saline; SD, standard deviation; TNF-α, tumor necrosis factor-α. |
NP[OVA+Dex]-treated DCs induce Foxp3+ Treg cells
The ability of NP[OVA+Dex]-treated DCs to induce the conversion of naïve CD4+ CD25− T cells into Foxp3+ Treg cells was determined in vitro. To analyze the ability of NP[OVA+Dex]-treated DCs to induce OVA-specific Treg cells, immature DCs generated from C57BL/6 mouse bone marrow cells were stimulated with IFN-γ plus TNF-α, or treated with NP[OVA] or NP[OVA+Dex] for 48 h. DCs were then co-cultured with CD4+CD25− T cells isolated from the spleens of OT-II mice in the presence of recombinant human IL-2 (100 U/mL) for 4 days and CD25 and Foxp3 expression in the T cells was analyzed (Figure 4A). The proportion of CD25+Foxp3+ Treg cells in the CD4+TCR Vα2+ cell population was significantly higher in co-cultures with NP[OVA+Dex]-treated DCs (6.84%) than co-cultures with immature DCs (2.98%), cytokine-matured DCs (2.20%), or NP[OVA]-treated DCs (2.21%) (Figure 4B). In allogeneic MLR, immature DCs generated from C57BL/6 mouse bone marrow cells were stimulated with IFN-γ plus TNF-α, or treated with NP[OVA] or NP[OVA+Dex] for 48 h. DCs were then co-cultured with CD4+CD25− T cells isolated from the spleens of BALB/c mice in the presence of recombinant human IL-2 (100 U/mL) for 4 days (Figure 4C). The proportion of CD25+Foxp3+ Treg cells in the CD4+ cell population was significantly higher in co-cultures with NP[OVA+Dex]-treated DCs (8.86%) than co-cultures with immature DCs (6.74%), cytokine-matured DCs (4.58%), or NP[OVA]-treated DCs (4.11%) (Figure 4D).
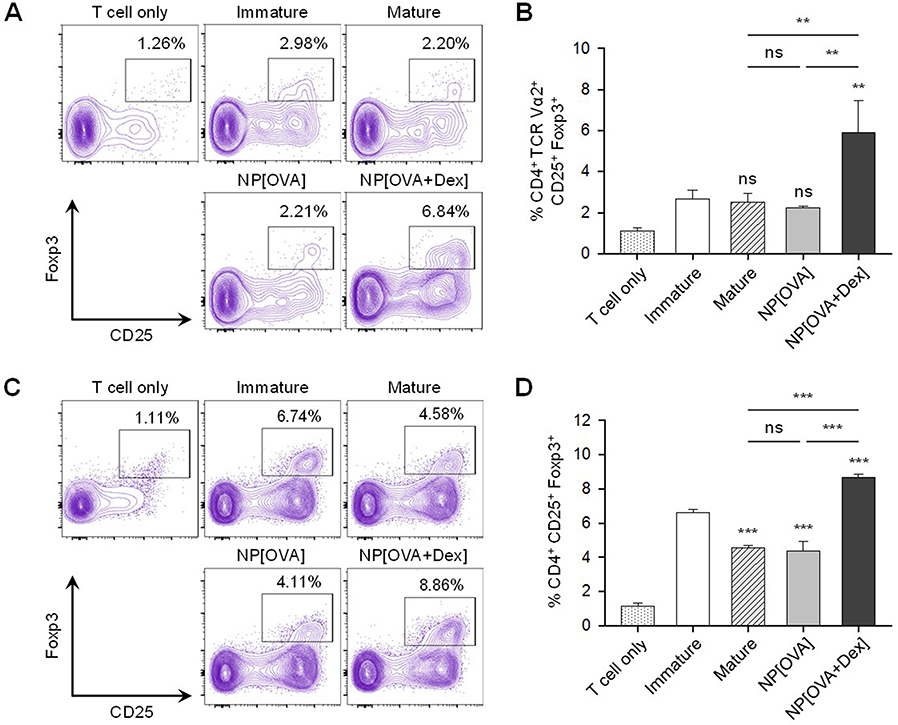 |
Figure 4 DCs treated with NP[OVA+Dex] induce Foxp3+ Treg cells from naïve CD4+CD25− T cells. Notes: (A) Induction of Foxp3+ Treg cells from OVA-specific CD4+CD25− T cells. DCs generated from C57BL/6 mouse bone marrow cells were stimulated with IFN-γ (50 ng/mL) plus TNF-α (50 ng/mL), or treated with NP[OVA] or NP[OVA+Dex] (10 μg/mL as OVA) for 48 h. DCs were co-cultured with CD4+CD25− T cells isolated from the spleens of OT-II mice at a ratio of 1:10 in a medium containing recombinant human IL-2 (100 U/mL) for 4 days. Cells were gated on CD4+TCR Vα2+ cells and the expression of CD25 and Foxp3 was analyzed. The data show representative histograms of three independent experiments. (B) The proportion of CD25+Foxp3+ Treg cells in the CD4+TCR Vα2+ cell population of each experimental group is shown. (C) Induction of Foxp3+ Treg cells in allogeneic MLR. DCs were then co-cultured with CD4+CD25− T cells isolated from the spleens of BALB/c mice at a ratio of 1:10 in a medium containing recombinant human IL-2 (100 U/mL) for 4 days. Cells were gated on CD4+ cells and the expression of CD25 and Foxp3 was analyzed. The data show representative histograms of three independent experiments. (D) The proportion of CD25+FoxP3+ Treg cells in the CD4+ cell population of each experimental group is shown. The data are presented as mean ± SD of three independent experiments. The data are presented as the mean ± SD of three independent experiments. **P<0.01, ***P<0.001. “ns” indicates no significant difference. Abbreviations: DCs, dendritic cells; Dex, dexamethasone; Foxp3, forkhead box P3; IFN-γ, interferon-γ; IL-2, interleukin-2; NP[OVA+Dex], nanoparticles containing ovalbumin and dexamethasone; MLR, Mixed lymphocyte reaction; NP[OVA], nanoparticles containing only ovalbumin; OVA, ovalbumin; SD, standard deviation; TCR, T cell receptor; TNF-α, tumor necrosis factor-α; Treg cells, regulatory T cells. |
OVA-specific immune responses are profoundly suppressed by inclusion of Dex into OVA-containing NPs
Mice were i.v. injected with PBS, NP[OVA], or NP[OVA+Dex]. After 7 days, OVA-specific CTL activity was assessed using CFSE–labeled syngeneic target cells. Representative histograms are shown in Figure 5A. Injection of NP[OVA] potently induced an OVA-specific CTL response (specific killing of 86.8%). However, injection of NP[OVA+Dex] induced a barely detectable level of the OVA-specific CTL response (specific killing of 3.41%; Figure 5B). The inability of NP[OVA+Dex] to induce OVA-specific CTL responses was not due to systemic effects caused by Dex release from NPs, because injection of NP[OVA] together with soluble Dex (10 μg/mouse), which is nearly equivalent to the amount of Dex injected with the NP[OVA+Dex], induced nearly the same level of OVA-specific CTL responses (Figure 5A and B). OVA-specific IgG production was also examined using the sera collected from the mice described in Figure 5A. The level of OVA-specific IgG in the serum was notably decreased in mice injected with NP[OVA+Dex], compared to that of NP[OVA]-injected mice (Figure 5C).
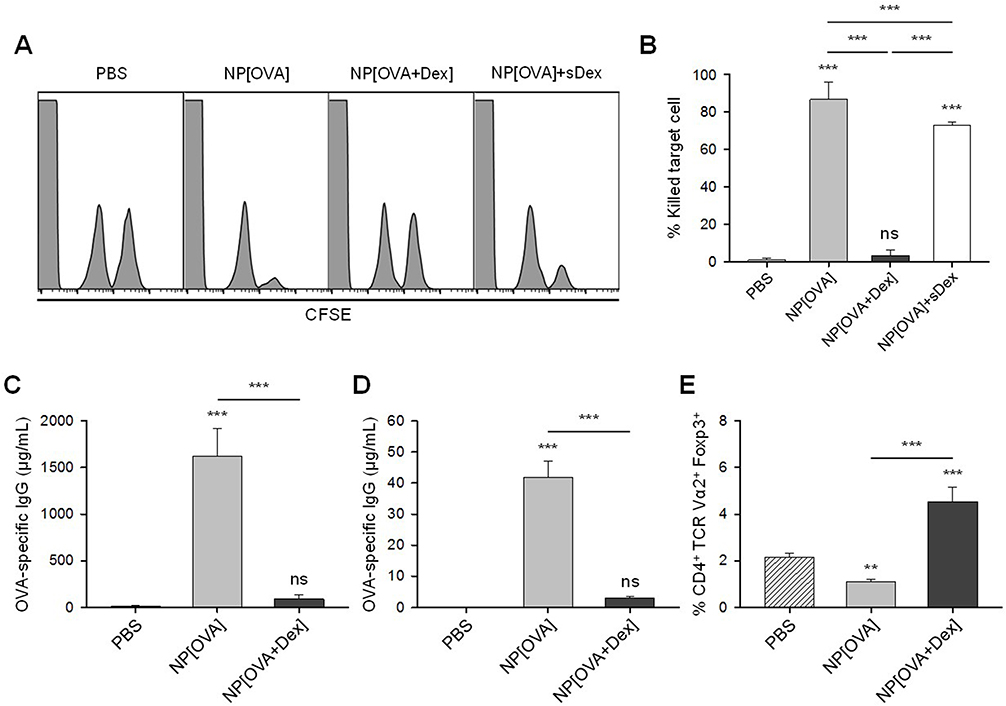 |
Figure 5 Effect of i.v. treatment of NP[OVA+Dex] on OVA-specific responses in vivo. Notes: (A) Induction of OVA-specific CTLs. PBS, NP[OVA], or NP[OVA+Dex] (100 μg/mouse as OVA) was i.v. injected into C57BL/6 mice. After 7 days, OVA-specific cytotoxic activity was assessed using an in vivo CTL assay. The target cells were a 1:1 mixture of syngeneic cells pulsed with the OVA257-264 peptide and then labeled with a high concentration of CFSE and syngeneic cells non-pulsed and labeled with a low concentration of CFSE. The target cells were i.v. injected into recipient mice and the specific cytotoxicity was determined 18 h later. (B) The proportion of killed target cells in each experimental group is shown. The data are presented as the mean ± SD of three independent experiments. (C-D) Production of OVA-specific IgG. PBS, NP[OVA], or NP[OVA+Dex] (100 μg/mouse as OVA) was i.v. injected into C57BL/6 (C) or OT-II mice (D). After 7 days, the sera were collected from the mice, and OVA-specific IgG levels were measured by ELISA. (E) The proportion of Foxp3+ Treg cells in the CD4+TCR Vα2+ cell population of each experimental group is shown. The data are presented as the mean ± SD of three independent experiments. **P<0.01, ***P<0.001. “ns” indicates no significant difference. Abbreviations: CFSE, carboxyfluorescein succinimidyl ester; CTL, cytotoxic T lymphocyte; Dex, dexamethasone; ELISA, enzyme-linked immunosorbent assay; Foxp3, forkhead box P3; IgG, immunoglobulin G; i.v., intravenous; NP[OVA+Dex], nanoparticles containing ovalbumin and dexamethasone; NP[OVA], nanoparticles containing only ovalbumin; OVA, ovalbumin; PBS, phosphate-buffered saline; SD, standard deviation; TCR, T cell receptor; Treg cells, regulatory T cells. |
OVA-specific immune responses were also compared in OT-II mice that were i.v. injected with PBS, NP[OVA], or NP[OVA+Dex]. After 7 days, OVA-specific IgG production was examined using the sera collected from the mice. Consistent with the results of normal mice (Figure 5C), the level of OVA-specific IgG in the serum was remarkably decreased in mice injected with NP[OVA+Dex], compared to that of NP[OVA]-injected mice (Figure 5D). The ability of NP[OVA+Dex] to induce Foxp3+ Treg cells was also examined in OT-II mice. The proportion of Foxp3+ Treg cells in the CD4+TCR Vα2+ cell population from the spleens of OT-II mice was significantly higher in NP[OVA+Dex]-treated mice (4.54%) than in PBS (2.14%), or NP[OVA]-treated mice (1.10%; Figure 5E).
Oral feeding of NP[OVA+Dex] induce OVA-specific immune tolerance
To investigate whether OVA-specific oral tolerance could be induced by feeding of NP[OVA+Dex], mice were i.g. injected with PBS, NP[OVA], or NP[OVA+Dex] on day 0 and 2. On day 9, mice were i.v. immunized with PBS, or NP[OVA]. After 7 days, OVA-specific CTL activity was assessed using CFSE–labeled syngeneic target cells. Representative histograms are shown in Figure 6A. Feeding of mice with NP[OVA] did not induce OVA-specific T cell tolerance, as demonstrated by the similar level of target cell killing in PBS-fed mice following i.v. re-challenge with NP[OVA]. However, feeding of mice with NP[OVA+Dex] significantly induced OVA-specific T cell tolerance, as demonstrated by the reduced level of target cell killing compared to NP[OVA]-fed mice following i.v. re-challenge with NP[OVA] (Figure 6A and B). OVA-specific IgG production was also examined using the sera collected from the mice described in Figure 6A. The level of OVA-specific IgG in the serum was notably decreased in mice fed with NP[OVA+Dex], compared to that in NP[OVA]-fed mice (Figure 6C).
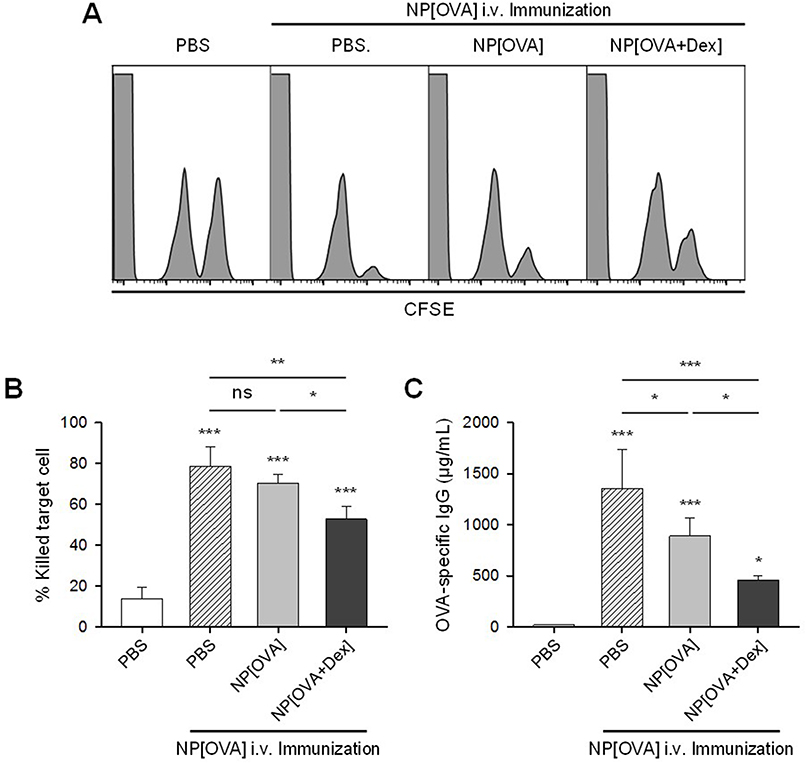 |
Figure 6 Effect of oral treatment of NP[OVA+Dex] on OVA-specific responses in vivo. Notes: (A) Induction of OVA-specific CTLs. PBS, NP[OVA], or NP[OVA+Dex] (200 μg/mouse as OVA) was i.g. injected into C57BL/6 mice on day 0 and 2. On day 9, mice were i.v. injected with NP[OVA] (80 μg/mouse as OVA) or PBS. After 7 days, OVA-specific cytotoxic activity was assessed using an in vivo CTL assay, as described in Figure 5A. (B) The proportion of killed target cells in each experimental group is shown. The data are presented as the mean ± SD of three independent experiments. (C) Production of OVA-specific IgG. PBS, NP[OVA], or NP[OVA+Dex] (200 μg/mouse as OVA) was i.g. injected into C57BL/6 mice on day 0 and 2. On day 9, mice were i.v. injected with NP[OVA] (80 μg/mouse as OVA), or PBS. After 7 days, the sera were collected from the mice, and OVA-specific IgG levels were measured by ELISA. The data are presented as the mean ± SD of three independent experiments. *P<0.05, **P<0.01, ***P<0.001. “ns” indicates no significant difference. Abbreviations: CTL, cytotoxic T lymphocyte; Dex, dexamethasone; ELISA, enzyme-linked immunosorbent assay; i.g., Intragastric; IgG, immunoglobulin G; i.v., intravenous; NP[OVA+Dex], nanoparticles containing ovalbumin and dexamethasone; NP[OVA], nanoparticles containing only ovalbumin; OVA, ovalbumin; PBS, phosphate-buffered saline; SD, standard deviation. |
Discussion
Polymeric NPs prepared with PLGA have been intensely studied because of their clinically proven biocompatibility and safety. They are biodegradable and are completely hydrolyzed and removed from the body.33 Polymeric NPs have been studied as a vehicle for delivering encapsulated antigens to phagocytes.40–42 One of the major advantages of encapsulation is the prevention of degradation of the encapsulated antigen or drug in plasma.43 Recent studies have also shown that PLGA-encapsulated antigen delivery to DCs enhances and prolongs the MHC-restricted presentation of the exogenous antigens.42,44 In the present study, PLGA-NPs containing both antigen and an immunosuppressive drug were produced and the induction of antigen-specific immune tolerance by the NPs was studied in mice as well as in vitro.
Our results show that NP[OVA+Dex]-treated DCs were defective in antigen-specific T cell stimulation, expression of MHC class II and co-stimulatory molecules (CD80 and CD86), and secretion of pro-inflammatory cytokines (IL-1β, IL-6, IL-12, and TNF-α). However, the production of immunosuppressive cytokine (IL-10) was increased in NP[OVA+Dex]-treated DCs. In addition, DCs expressing high levels of co-inhibitory molecule (PL-L1) with low expression of co-stimulatory molecule (CD86) were increased following NP[OVA+Dex]-treatment. Furthermore, NP[OVA+Dex]-treated DCs induced Foxp3+ Treg cells from naïve CD4 T cells. These results demonstrate that the immature DCs treated with NP[OVA+Dex] are converted into tolerogenic DCs. In fact, Dex has been shown to induce the generation of tolerogenic DCs.9 DCs generated from mouse bone marrow cells in the presence of Dex express low levels of co-stimulatory molecules and MHC class II molecules, produce elevated levels of IL-10 and lower levels of IL-12, and induce the generation of Treg cells.11,23–26,45 The tolerogenic properties of NP[OVA+Dex]-treated DCs were nearly the same as that of tolerogenic DCs generated with soluble Dex.27 Of note, immature DCs treated with NP[OVA+Dex] for 2 days were converted into tolerogenic DCs. In contrast, soluble Dex is not able to induce tolerogenic DC differentiation from immature DCs. Soluble Dex has to be added to cultures of bone marrow cells at an early stage of DC differentiation in order to convert them into tolerogenic DCs.25,45
The average size of the NP[OVA+Dex] fabricated in the present study was 864.8 nm, a size that can be readily phagocytosed by professional APCs and large enough to contain sufficient amounts of antigen and drug. Previous studies have shown that polymeric NPs ranging in size from 300 nm to 2 micron are efficiently taken up by phagocytosis by professional APCs, although the maximum cellular uptake of NPs is dependent upon various factors such as particle size and surface charge.38,39,46–48 Polymeric NPs with a size range <200 nm are not suitable for the preferential delivery of encapsulated antigen or drug to APCs, as they can escape phagocytic recognition with minimal uptake by endocytosis.49,50
One of the major findings of the present study is that NP[OVA+Dex] can induce OVA-specific immune tolerance in mice when the NPs were i.g. fed, as well as when i.v. injected. Mice i.v. injected with NP[OVA+Dex] exhibited suppressed induction of OVA-specific cytotoxic T cells and production of OVA-specific IgG, but increased generation of OVA-specific Foxp3+ Treg cells. Furthermore, mice that were orally administered with NP[OVA+Dex] exhibited profoundly suppressed generation of OVA-specific cytotoxic T cells and OVA-specific IgG upon i.v. re-challenge with NP[OVA]. Hence, we demonstrated that OVA-specific oral tolerance could be induced with NP[OVA+Dex]. Of note, feeding of mice with NP[OVA+Dex] induced OVA-specific oral tolerance much more prominently in the OVA-specific humoral response than in the OVA-specific T cell response (Figure 6).
Conclusion
The present study showed that DCs treated with NP[OVA+Dex] exhibited tolerogenic DC properties and OVA-specific as well as antigen-nonspecific immune suppression. Tolerogenic DCs generated by NP[OVA+Dex] efficiently induced the differentiation of naïve T cells into regulatory T cells. This study also demonstrated that intragastric feeding as well as intravenous injection of NP[OVA+Dex] induced OVA-specific immune tolerance in mice. The current findings indicate that polymeric NPs encapsulating both antigen and Dex can serve as a means of targeted delivery to phagocytes, thus reducing the potential side effects of Dex and enabling the generation of antigen-specific immune tolerance, which is crucial for the treatment of autoimmune diseases.
Acknowledgments
This work was supported by the National Research Foundation of Korea (NRF) grant funded by the Korea government (NRF-2017R1A2B4006828, MRC-2017R1A5A2015541).
Disclosure
The authors report no conflicts of interest in this work.
References
1. Mellman I. Dendritic cells: master regulators of the immune response. Cancer Immunol Res. 2013;1(3):145–149. doi:10.1158/2326-6066.CIR-13-0102
2. Gerner MY, Casey KA, Kastenmuller W, Germain RN. Dendritic cell and antigen dispersal landscapes regulate T cell immunity. J Exp Med. 2017;214(10):3105–3122. doi:10.1084/jem.20170335
3. Kim JU, Kim M, Kim S, et al. Dendritic cell dysfunction in patients with end-stage renal disease. Immune Netw. 2017;17(3):152–162. doi:10.4110/in.2017.17.3.152
4. Audiger C, Rahman MJ, Yun TJ, Tarbell KV, Lesage S. The importance of dendritic cells in maintaining immune tolerance. J Immunol. 2017;198(6):2223–2231. doi:10.4049/jimmunol.1601629
5. Hubo M, Trinschek B, Kryczanowsky F, Tuettenberg A, Steinbrink K, Jonuleit H. Costimulatory molecules on immunogenic versus tolerogenic human dendritic cells. Front Immunol. 2013;4:82. doi:10.3389/fimmu.2013.00082
6. Vander Lugt B, Riddell J, Khan AA, et al. Transcriptional determinants of tolerogenic and immunogenic states during dendritic cell maturation. J Cell Biol. 2017;216(3):779–792. doi:10.1083/jcb.201512012
7. Hwang WB, Kim DJ, Oh GS, Park JH. Aryl hydrocarbon receptor ligands indoxyl 3-sulfate and indole-3-carbinol inhibit FMS-like tyrosine kinase 3 ligand-induced bone marrow-derived plasmacytoid dendritic cell differentiation. Immune Netw. 2018;18(5):e35. doi:10.4110/in.2018.18.e35
8. Kalantari T, Kamali-Sarvestani E, Ciric B, et al. Generation of immunogenic and tolerogenic clinical-grade dendritic cells. Immunol Res. 2011;51(2–3):153–160. doi:10.1007/s12026-011-8255-5
9. Kim SH, Jung HH, Lee CK. Generation, Characteristics and clinical trials of ex vivo generated tolerogenic dendritic cells. Yonsei Med J. 2018;59(7):807–815. doi:10.3349/ymj.2018.59.7.807
10. Domogalla MP, Rostan PV, Raker VK, Steinbrink K. Tolerance through education: how tolerogenic dendritic cells shape immunity. Front Immunol. 2017;8:1764. doi:10.3389/fimmu.2017.01764
11. Unger WW, Laban S, Kleijwegt FS, van der Slik AR, Roep BO. Induction of Treg by monocyte-derived DC modulated by vitamin D3 or dexamethasone: differential role for PD-L1. Eur J Immunol. 2009;39(11):3147–3159. doi:10.1002/eji.200839103
12. Tuettenberg A, Huter E, Hubo M, et al. The role of ICOS in directing T cell responses: ICOS-dependent induction of T cell anergy by tolerogenic dendritic cells. J Immunol. 2009;182(6):3349–3356. doi:10.4049/jimmunol.0802733
13. Ahmed MS, Bae YS. Dendritic cell-based immunotherapy for rheumatoid arthritis: from bench to bedside. Immune Netw. 2016;16(1):44–51. doi:10.4110/in.2016.16.1.44
14. Tai N, Yasuda H, Xiang Y, et al. IL-10-conditioned dendritic cells prevent autoimmune diabetes in NOD and humanized HLA-DQ8/RIP-B7.1 mice. Clin Immunol. 2011;139(3):336–349. doi:10.1016/j.clim.2011.03.003
15. Chorny A, Gonzalez-Rey E, Fernandez-Martin A, Pozo D, Ganea D, Delgado M. Vasoactive intestinal peptide induces regulatory dendritic cells with therapeutic effects on autoimmune disorders. Proc Natl Acad Sci U S A. 2005;102(38):13562–13567. doi:10.1073/pnas.0504484102
16. Horibe EK, Sacks J, Unadkat J, et al. Rapamycin-conditioned, alloantigen-pulsed dendritic cells promote indefinite survival of vascularized skin allografts in association with T regulatory cell expansion. Transpl Immunol. 2008;18(4):307–318. doi:10.1016/j.trim.2007.10.007
17. Benham H, Nel HJ, Law SC, et al. Citrullinated peptide dendritic cell immunotherapy in HLA risk genotype-positive rheumatoid arthritis patients. Sci Transl Med. 2015;7(290):290ra287. doi:10.1126/scitranslmed.aad3106
18. Giannoukakis N, Phillips B, Finegold D, Harnaha J, Trucco M. Phase I (safety) study of autologous tolerogenic dendritic cells in type 1 diabetic patients. Diabetes Care. 2011;34(9):2026–2032. doi:10.2337/dc11-0472
19. Nafarrate IZ, Florez G, Vila G, et al. Phase 1b clinical trial with antigen-specific tolerogenic dendritic in multiple sclerosis and neuromyelitis optica: safety and immunological effects (P2.330). Neurology. 2017;88(Suppl 16):
20. Jauregui-Amezaga A, Cabezon R, Ramirez-Morros A, et al. Intraperitoneal administration of autologous tolerogenic dendritic cells for refractory Crohn’s disease: a phase I study. J Crohns Colitis. 2015;9(12):1071–1078. doi:10.1093/ecco-jcc/jjv144
21. Paragliola RM, Papi G, Pontecorvi A, Corsello SM. Treatment with synthetic glucocorticoids and the hypothalamus-pituitary-adrenal axis. Int J Mol Sci. 2017;18(10):2201. doi:10.3390/ijms18102201
22. Gustafson MP, Lin Y, New KC, et al. Systemic immune suppression in glioblastoma: the interplay between CD14+HLA-DRlo/neg monocytes, tumor factors, and dexamethasone. Neuro Oncol. 2010;12(7):631–644. doi:10.1093/neuonc/noq001
23. Baschant U, Tuckermann J. The role of the glucocorticoid receptor in inflammation and immunity. J Steroid Biochem Mol Biol. 2010;120(2–3):69–75. doi:10.1016/j.jsbmb.2010.03.058
24. Rozkova D, Horvath R, Bartunkova J, Spisek R. Glucocorticoids severely impair differentiation and antigen presenting function of dendritic cells despite upregulation of Toll-like receptors. Clin Immunol. 2006;120(3):260–271. doi:10.1016/j.clim.2006.04.567
25. Piemonti L, Monti P, Allavena P, et al. Glucocorticoids affect human dendritic cell differentiation and maturation. J Immunol. 1999;162(11):6473–6481.
26. Matyszak MK, Citterio S, Rescigno M, Ricciardi-Castagnoli P. Differential effects of corticosteroids during different stages of dendritic cell maturation. Eur J Immunol. 2000;30(4):1233–1242. doi:10.1002/(SICI)1521-4141(200004)30:4<1233::AID-IMMU1233>3.0.CO;2-F
27. Lee JH, Park CS, Jang S, et al. Tolerogenic dendritic cells are efficiently generated using minocycline and dexamethasone. Sci Rep. 2017;7(1):15087. doi:10.1038/s41598-017-15569-1
28. Boumpas DT, Paliogianni F, Anastassiou ED, Balow JE. Glucocorticosteroid action on the immune system: molecular and cellular aspects. Clin Exp Rheumatol. 1991;9(4):413–423.
29. Marx J. How the glucocorticoids suppress immunity. Science. 1995;270(5234):232–233.
30. Coutinho AE, Chapman KE. The anti-inflammatory and immunosuppressive effects of glucocorticoids, recent developments and mechanistic insights. Mol Cell Endocrinol. 2011;335(1):2–13. doi:10.1016/j.mce.2010.04.005
31. Liu D, Ahmet A, Ward L, et al. A practical guide to the monitoring and management of the complications of systemic corticosteroid therapy. Allergy Asthma Clin Immunol. 2013;9(1):30. doi:10.1186/1710-1492-9-30
32. Vardy J, Chiew KS, Galica J, Pond GR, Tannock IF. Side effects associated with the use of dexamethasone for prophylaxis of delayed emesis after moderately emetogenic chemotherapy. Br J Cancer. 2006;94(7):1011–1015. doi:10.1038/sj.bjc.6603048
33. Moni SS, Safhi MM, Barik BB. Nanoparticles for triggering and regulation of immune response of vaccines: perspective and prospective. Curr Pharm Biotechnol. 2013;14(15):1242–1249.
34. Hamdy S, Haddadi A, Hung RW, Lavasanifar A. Targeting dendritic cells with nano-particulate PLGA cancer vaccine formulations. Adv Drug Deliv Rev. 2011;63(10–11):943–955. doi:10.1016/j.addr.2011.05.021
35. Elamanchili P, Diwan M, Cao M, Samuel J. Characterization of poly(D,L-lactic-co-glycolic acid) based nanoparticulate system for enhanced delivery of antigens to dendritic cells. Vaccine. 2004;22(19):2406–2412. doi:10.1016/j.vaccine.2003.12.032
36. Lee YH, Lee YR, Kim KH, et al. Baccatin III, a synthetic precursor of taxol, enhances MHC-restricted antigen presentation in dendritic cells. Int Immunopharmacol. 2011;11(8):985–991. doi:10.1016/j.intimp.2011.02.013
37. Lee Y, Im SA, Kim J, et al. Modified aloe polysaccharide restores chronic stress-induced immunosuppression in mice. Int J Mol Sci. 2016;17(10). doi:10.3390/ijms17101660
38. Lee YR, Lee YH, Im SA, et al. Biodegradable nanoparticles containing TLR3 or TLR9 agonists together with antigen enhance MHC-restricted presentation of the antigen. Arch Pharm Res. 2010;33(11):1859–1866. doi:10.1007/s12272-010-1119-z
39. Lee YR, Lee YH, Im SA, Kim K, Lee CK. Formulation and characterization of antigen-loaded PLGA nanoparticles for efficient cross-priming of the antigen. Immune Netw. 2011;11(3):163–168. doi:10.4110/in.2011.11.3.163
40. Jiang W, Gupta RK, Deshpande MC, Schwendeman SP. Biodegradable poly(lactic-co-glycolic acid) microparticles for injectable delivery of vaccine antigens. Adv Drug Deliv Rev. 2005;57(3):391–410. doi:10.1016/j.addr.2004.09.003
41. Waeckerle-Men Y, Groettrup M. PLGA microspheres for improved antigen delivery to dendritic cells as cellular vaccines. Adv Drug Deliv Rev. 2005;57(3):475–482. doi:10.1016/j.addr.2004.09.007
42. Shen H, Ackerman AL, Cody V, et al. Enhanced and prolonged cross-presentation following endosomal escape of exogenous antigens encapsulated in biodegradable nanoparticles. Immunology. 2006;117(1):78–88. doi:10.1111/j.1365-2567.2005.02268.x
43. Allahyari M, Mohit E. Peptide/protein vaccine delivery system based on PLGA particles. Hum Vaccin Immunother. 2016;12(3):806–828. doi:10.1080/21645515.2015.1102804
44. Gerelchuluun T, Lee YH, Lee YR, et al. Dendritic cells process antigens encapsulated in a biodegradable polymer, poly(D,L-lactide-co-glycolide), via an alternate class I MHC processing pathway. Arch Pharm Res. 2007;30(11):1440–1446.
45. Xia CQ, Peng R, Beato F, Clare-Salzler MJ. Dexamethasone induces IL-10-producing monocyte-derived dendritic cells with durable immaturity. Scand J Immunol. 2005;62(1):45–54. doi:10.1111/j.1365-3083.2005.01640.x
46. Xiang SD, Scholzen A, Minigo G, et al. Pathogen recognition and development of particulate vaccines: does size matter? Methods. 2006;40(1):1–9. doi:10.1016/j.ymeth.2006.05.016
47. Mottram PL, Leong D, Crimeen-Irwin B, et al. Type 1 and 2 immunity following vaccination is influenced by nanoparticle size: formulation of a model vaccine for respiratory syncytial virus. Mol Pharm. 2007;4(1):73–84. doi:10.1021/mp060096p
48. Zhao F, Zhao Y, Liu Y, Chang X, Chen C, Zhao Y. Cellular uptake, intracellular trafficking, and cytotoxicity of nanomaterials. Small. 2011;7(10):1322–1337. doi:10.1002/smll.201100001
49. Sadat SMA, Jahan ST, Haddadi A. Effects of size and surface charge of polymeric nanoparticles on in vitro and in vivo applications. J Biomater Nanobiotechnol. 2016;7(2):91–108. doi:10.4236/jbnb.2016.72011
50. Jia J, Zhang Y, Xin Y, Jiang C, Yan B, Zhai S. Interactions between nanoparticles and dendritic cells: from the perspective of cancer immunotherapy. Front Oncol. 2018;8:404. doi:10.3389/fonc.2018.00404
Supplementary materials
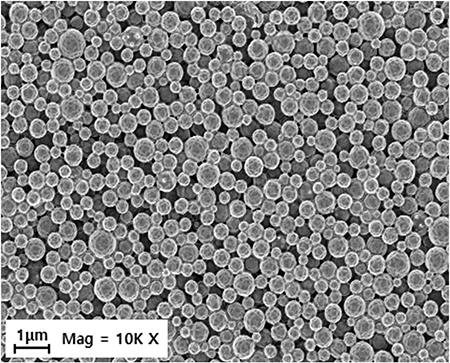 |
Figure S1 Scanning electron microscopy showing the surface morphology of NP[OVA+Dex] with a mean size of 865 nm. The morphology of the NP[OVA+Dex] was visualized by scanning electron microscopy (LEO-1530, Carl Zeiss, Germany). |
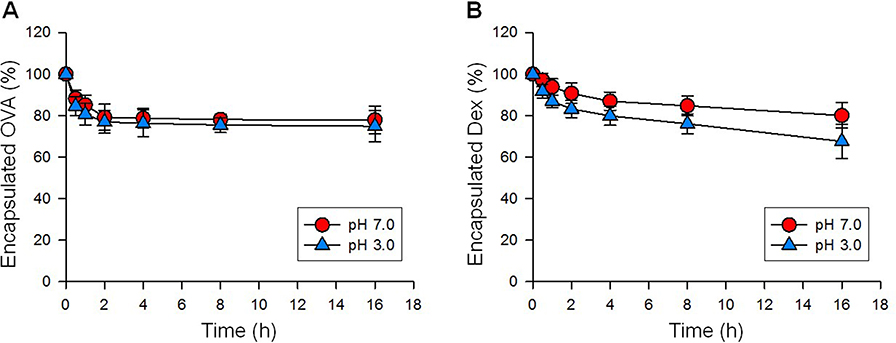 |
Figure S2 In vitro release kinetics. NP[OVA+Dex] was incubated in buffers with pH 3.0 and pH 7.0 at 37°C. At indicated time points, the NP[OVA+Dex] was collected by centrifuging at 3,000g for 10 min, and then lysed in a lysis buffer containing 0.5% SDS and 0.5 N NaOH for the determination of OVA content, or in a 1:1 mixture of DMSO and methanol for the determination of Dex. The OVA content was determined using a microbicinchoninic acid assay, and the Dex content was determined using HPLC, as described in detail in the methods section. |
 © 2019 The Author(s). This work is published and licensed by Dove Medical Press Limited. The full terms of this license are available at https://www.dovepress.com/terms.php and incorporate the Creative Commons Attribution - Non Commercial (unported, v3.0) License.
By accessing the work you hereby accept the Terms. Non-commercial uses of the work are permitted without any further permission from Dove Medical Press Limited, provided the work is properly attributed. For permission for commercial use of this work, please see paragraphs 4.2 and 5 of our Terms.
© 2019 The Author(s). This work is published and licensed by Dove Medical Press Limited. The full terms of this license are available at https://www.dovepress.com/terms.php and incorporate the Creative Commons Attribution - Non Commercial (unported, v3.0) License.
By accessing the work you hereby accept the Terms. Non-commercial uses of the work are permitted without any further permission from Dove Medical Press Limited, provided the work is properly attributed. For permission for commercial use of this work, please see paragraphs 4.2 and 5 of our Terms.