")
Back to Journals » Clinical Interventions in Aging » Volume 11
Inappropriate nutrients intake is associated with lower functional status and inferior quality of life in older adults with depression
Authors Guligowska A , Pigłowska M, Fife E, Kostka J, Sołtysik BK , Kroc Ł, Kostka T
Received 9 June 2016
Accepted for publication 9 September 2016
Published 21 October 2016 Volume 2016:11 Pages 1505—1517
DOI https://doi.org/10.2147/CIA.S114669
Checked for plagiarism Yes
Review by Single anonymous peer review
Peer reviewer comments 2
Editor who approved publication: Dr Richard Walker
Agnieszka Guligowska,1 Małgorzata Pigłowska,1 Elizaveta Fife,1 Joanna Kostka,2 Bartłomiej K Sołtysik,1 Łukasz Kroc,1 Tomasz Kostka1
1Department of Geriatrics, Healthy Ageing Research Centre, Medical University of Lodz, Lodz, Poland; 2Department of Physical Medicine, Medical University of Lodz, Lodz, Poland
Objectives: The study is a case-control analysis of whether depression impairs physical and cognitive functioning and quality of life, and whether there is a relationship between nutrient deficiencies and these adverse changes.
Patients and methods: A total of 130 older subjects participated in the study: 65 with diagnosed depression (16 men and 49 women) and 65 age- and sex-matched controls without depression. All patients underwent comprehensive geriatric assessment. Nutritional state was assessed with the Mini Nutritional Assessment, cognitive performance was evaluated by the Mini-Mental State Examination and physical functioning by the Timed “Up & Go” test and handgrip strength. The pattern of consumption of various nutrients was analyzed in detail.
Results: The differences in cognitive functioning observed between the groups were related to specific nutrient intake, as was handgrip strength to some extent. The differences in nutritional status, several functional tests and muscle strength were related to both the presence of depression and inappropriate consumption of certain nutrients.
Conclusion: The incidence of falls and poor quality of life may be partially associated with the presence of depression. The inappropriate intake of selected nutrients may impair the functioning and quality of life of older adults with depression, such as the excess consumption of sucrose and insufficient consumption of protein, fiber, eicosapentaenoic acid, niacin and vitamin B6. Particular nutrients should be translated into dietary patterns which allow the individual patient to address these nutrient deficiencies.
Keywords: aging, cognitive function, depression, nutrition, sucrose, quality of life
Introduction
Depression is one of the most challenging problems faced by an aging population, with around 350 million sufferers worldwide, according to World Health Organization (WHO) estimates.1,2 Moreover, by 2020, depression will have become the most common mental disorder, and the second most serious disease in the world after cardiovascular diseases.3 This problem is particularly exacerbated in postcommunist countries like Poland. The PolSenior study found that the prevalence of depression increased with age, with every fifth person in the 55–59 year old group being affected, rising to one in four in the 65–79 year old group and one in three in those aged 80 or over. In addition, depression was more common in women than in men in all age groups.4 Depression affects the functioning of the individual in society and, above all, determines the state of health and the quality of life (QoL).5,6 Bearing in mind the changes that occur in the body and the mind with age, the incidence of depression may further accelerate and exacerbate them, making it difficult to function independently and increasing the risk of morbidity and mortality.1,7,8
Proper nutrition is a cornerstone of preventive gerontology and curative geriatrics, especially in the case of multiple concomitant diseases.9 Poor nutrition is associated with a greater chance of the occurrence of many diseases and adverse health outcomes, such as sarcopenia, frailty syndrome and disability. Nutritional health is an essential component of QoL among older adults.10 A great deal of attention has recently been paid to studying the influence of nutrition on QoL for older people.11 It has been suggested that existing healthy eating policies will generate additional benefits for health and well-being, and that correct diet should be considered as a potential target for the prevention of depressive disorders.12
Many studies have examined the association between the prevalence of depression and the consumption of particular ingredients and dietary pattern. Although no firm conclusions can be drawn regarding the influence of dietary patterns on the onset of depression and the course of the disease, there are indications that this may be the case.13–15 As there are few detailed assessments of the nutrients that may contribute to the development of depression and its functional consequences in an older population, the aim of this study was to investigate, using a case-control design, if the presence of depression impairs physical and cognitive functioning and QoL, and determine whether a relationship exists between nutrient deficiencies and these adverse changes. Better knowledge of potential nutritional deficiencies may determine directions for further research, and contribute to the formulation of dietary guidelines for older people suffering from depression.
Subjects/study population
The study was conducted from May 2013 to April 2015 with the participation of patients treated in the Outpatient Geriatric Clinic of the Medical University of Lodz, Poland, who volunteered to undergo comprehensive geriatric assessments and detailed dietary analyses. The inclusion criteria were as follows: oral feeding, ability to communicate verbally and consent to participate in the study. Patients with severe dementia, those receiving enteral nutrition or those using any dietary supplements of vitamins and minerals were excluded from the study. Furthermore, patients with acute or severe somatic conditions, such as infections, acute or severe chronic inflammatory diseases, progressive malignant diseases, severe renal disorders, recent myocardial infarction or stroke, or any important disability hampering participation in functional testing, were excluded from the study.
Of the group of 350 patients with diagnosed depression, 102 met the inclusion criteria and 65 (16 men and 49 women) volunteered to participate in more detailed analysis. All the patients were aged ≥60 years, with unipolar depression diagnosis based on the International Classification of Diseases 10th revision criteria. A case-control model was used for the study. An age- and sex-matched subject without depression who also met the inclusion criteria was consecutively recruited to match each patient with depression. The 65 patients without depression who comprised the control group volunteered to participate in the detailed assessment. All controls were receiving treatment in the Outpatient Department of Geriatrics when they were recruited.
Methods
All subjects underwent a comprehensive geriatric assessment lasting approximately 3 hours, evaluating physical and cognitive functioning, nutritional status and QoL. The assessment also addressed demographic and social variables, smoking habits and sleep duration, expressed as number of hours per week. Falls were retrospectively registered for 1 year before the examination and were coded as “no fall” vs “at least one fall” during the previous year. Height, body mass, waist and hip circumferences were measured. Body mass index (BMI) was calculated as weight in kilograms divided by the height in meters squared. Waist to hip ratio was calculated as waist measurement divided by hip measurement. Percentage of body fatty tissue was analyzed using the four-skinfolds method.16 Physical disability was evaluated by the Activities of Daily Living (ADL)17 and the Instrumental Activities of Daily Living (IADL) scales.18 Mental functions were assessed by the Mini-Mental State Examination (MMSE)19 and the 15-item Geriatric Depression Scale (GDS).20 Nutritional state was assessed using the MNA questionnaire (Mini Nutritional Assessment).21 Physical functioning was evaluated using the Timed “Up & Go” (TUG) test 22,23 and handgrip strength.24
Physical function measures
The TUG test is a simple test used to assess mobility which requires both static and dynamic balance. The time that the patients needed to rise from a chair, walk three meters, turn around, walk back to the chair and sit down were measured. During the test, the subjects wore regular footwear and used any mobility aids that they normally require.
Handgrip strength was tested using a Jamar hydraulic hand dynamometer (Sammons Preston Rolyan, Bolingbrook, Canada), which measures isometric force to 90 kg. Previous studies have indicated that the measurements are influenced by the position of the subject, ie, lying, sitting or standing. As better results have been found with the test subject in a standing position, all subjects carried out the handgrip strength test while standing with shoulder adducted and neutrally rotated, and with the elbow in 90° flexion with no radioulnar deviation. One-minute rest periods were given between each attempt, and hands were alternated to minimize fatigue effects. Handgrip strength was measured twice on both sides with pauses between measurements. The best results of each hand were summarized and average strength was calculated. Results were recorded as kilogram force (kgf).
Cognitive function and emotional status assessment
Cognitive function was evaluated using the MMSE, which uses six groups of tasks to assess the level of functioning of basic psychological processes such as orientation in time and place, memory, attention and counting, recall, language function and constructional praxis. The MMSE scores range from 0 to 30, with higher scores indicating better cognitive functioning.
The emotional status of the participants was evaluated using the 15-item version of the GDS, characterizing the state of being of the subject in the previous two weeks. The GDS contains 15 “yes” or “no” questions characterizing the depressive status of the respondent. The raw scores range from 0 to 15, where a higher score indicates deeper depression.
QoL measures
QoL was assessed with the Euro 5D questionnaire (http://www.euroqol.org). It is a widely used and validated generic instrument with five dimensions: mobility, self-care, usual activities, pain/discomfort and anxiety/depression.25 Each dimension has three levels: no problems (no limitations), some problems and severe problems. In addition, each subject was asked to describe his or her overall actual health state using the Euroqol visual analog scale (VAS), where zero denotes the worst imaginable health state and 100 indicates the best imaginable health state.
Malnutrition assessment
The nutritional status was assessed by the MNA questionnaire, which contains 18 questions relating to essential elements of nutritional status, such as food intake, loss of body weight, the ability to move around independently and the occurrence of acute disease or stress, as well as neurological problems, BMI, number of medications and arm and calf circumferences. The total number of points in the MNA questionnaire is 30. A result >23.5 is treated as a satisfactory nutritional status, while a score ≤23.5 suggests malnutrition.
Dietary assessment
Twenty-four hour recall questionnaires were used to register the intake of food and beverages during the preceding day. The questionnaires were administered by qualified investigators. The energy and nutrients intake was calculated using Dieta 5.0 software (The National Food and Nutrition Institute, Warsaw, Poland) which analyzes the energy intake coming from protein, fats and carbohydrates as well as the consumption levels of 84 nutrients.26,27
To minimize the error resulting from recall bias and misreporting, respondents were asked to draw up a preliminary list of foods consumed on a given day at home. Then, during an interview, trained personnel carried out a detailed analysis of consumption, clarifying the time of consumption, form of the product, used additives and portion sizes (based on photo album provided by the Polish Institute of Food and Nutrition). The interviewers were instructed not to judge the respondent’s diet verbally or non-verbally. Attention was paid to specify the size of portion consumed, not the portion served on a plate. In case of any doubt, the caregiver or family member of the respondent was consulted.
In order to identify the nutrients and sources of energy which may be related to the status and functioning of people with depression, the levels of consumption of various nutrients were compared. In addition, the components whose consumption significantly differed between the two groups were identified and their nutritional density per 1,000 kcal calculated. The relationship between the individual test results and the level of consumption of selected nutrients, as well as the presence of depression was then analyzed.
Statistical analysis
The results were verified for normality of distribution and equality of variance. The one-way analysis of variance (ANOVA), Mann-Whitney test or chi-square test were used to compare the groups. Euroqol 5D dimension data were dichotomized (“no problems” vs “any problem”) for statistical analyses. Effect sizes based on Cohen’s d were calculated for nutrients that were significantly different between the two groups. An effect size of 0.2 to 0.5 was suggested to represent a small effect, 0.5 to 0.8 for a medium effect and >0.8 for a large effect. Nutrients and functional measures that were significantly different between the two groups in bivariate associations were further used for multivariate comparisons. As nutrient data were not normally distributed even after transformation, the data were divided into groups above or below the median value for multivariate comparisons. The two-way ANOVA was used to assess both the effects of group affiliation and selected nutrient levels on dependent functional variables. TUG was log transformed to obtain a normal distribution. Because IADL and MMSE were not normally distributed even after transformation, they were categorized as above or below the median, and logistic regression was used instead of two-way ANOVA.
Statistical analysis was performed using Statistica 12 CSS software. The results of the quantitative variables are presented as mean ± standard deviation or median. The limit of statistical significance was set at a P-value of less than 0.05 for all analyses.
Ethical considerations
The study was approved by the Ethics Committee of the Medical University of Lodz (RNN/863/11/KB dated December 13, 2011) and written informed consent was obtained from all subjects.
Results
Groups characteristics
The general characteristics of the two groups, and their physical and cognitive status, are presented in Table 1. Patients with depression were found to have a lower educational level. There were no significant differences in anthropometric assessments between the depression and control groups. The prevalence of diseases was comparable in both groups, although a higher prevalence of ischemic heart disease was found in the depression group. The depression group was also characterized with lower IADL, MMSE, MNA and handgrip strength and higher (worse) GDS and TUG tests. Falls during the previous year were also more common in the depression group (Table 1).
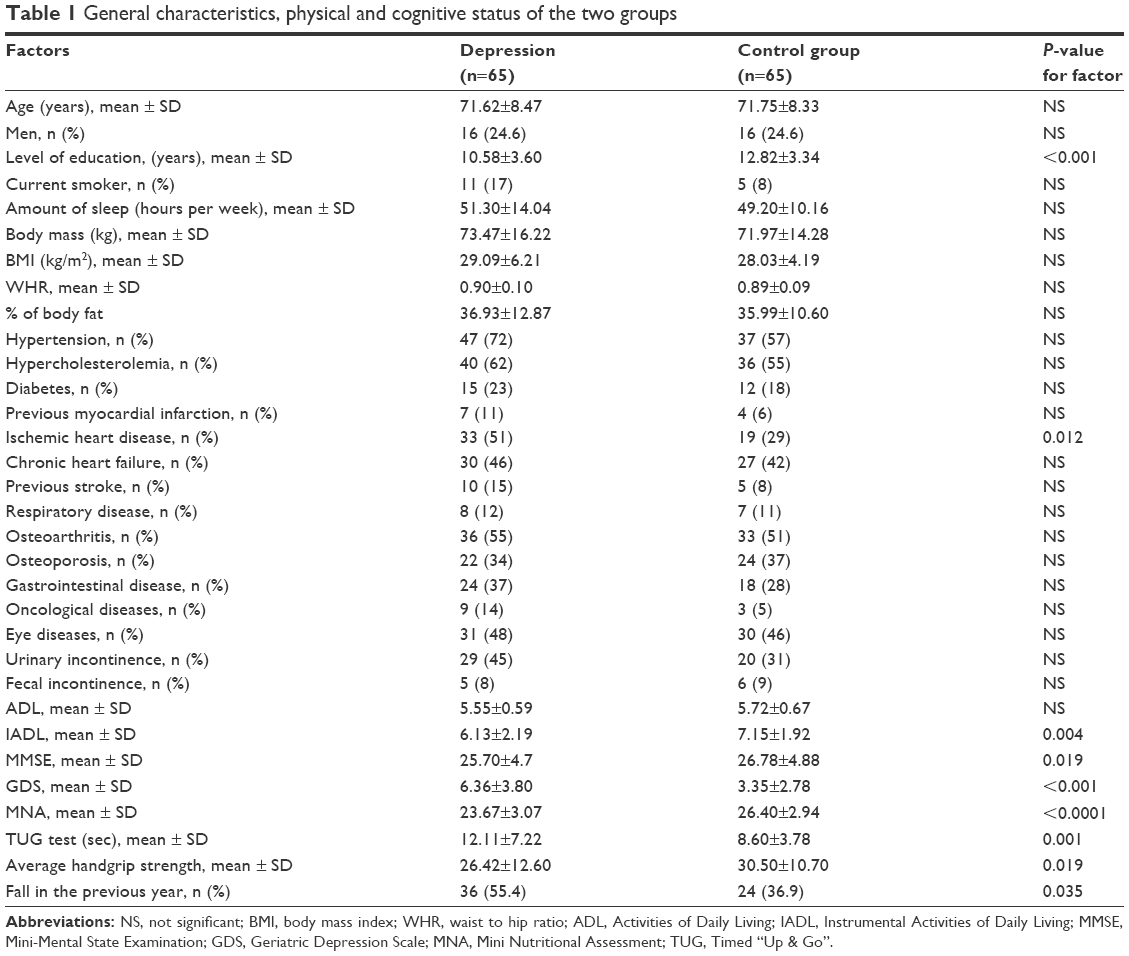 | Table 1 General characteristics, physical and cognitive status of the two groups |
The analysis of the dimensions of the QoL revealed that subjects with depression more commonly reported mobility (P=0.003), self-care (P=0.017) and anxiety/depression problems (P=0.0008). Reported usual activity and pain/discomfort problems were comparable between both groups. As expected, older adults with depression had significantly lower scores on the VAS (P=0.013): 59.51±21.2 than those without depression: 69.03±20.3 (Table S1).
Nutrient intake
The level of energy intake did not differ between the groups but the energy itself was obtained from different sources (Table 2). The members of the depression group consumed less energy from protein and more energy from sucrose. Several differences were also found in the amounts of macronutrients and micronutrients, with the depression group consuming less alanine aspartic acid, fatty acid 20:5 (eicosapentaenoic acid [EPA]), fiber, niacin and vitamin B6. In contrast, they also demonstrated a higher intake of fatty acid 12:0, sucrose and retinol. The calorie to dietary fiber ratio was also higher. Effect sizes for changes ranged from small to large according to standard criteria.28 Detailed information is presented in Table S2.
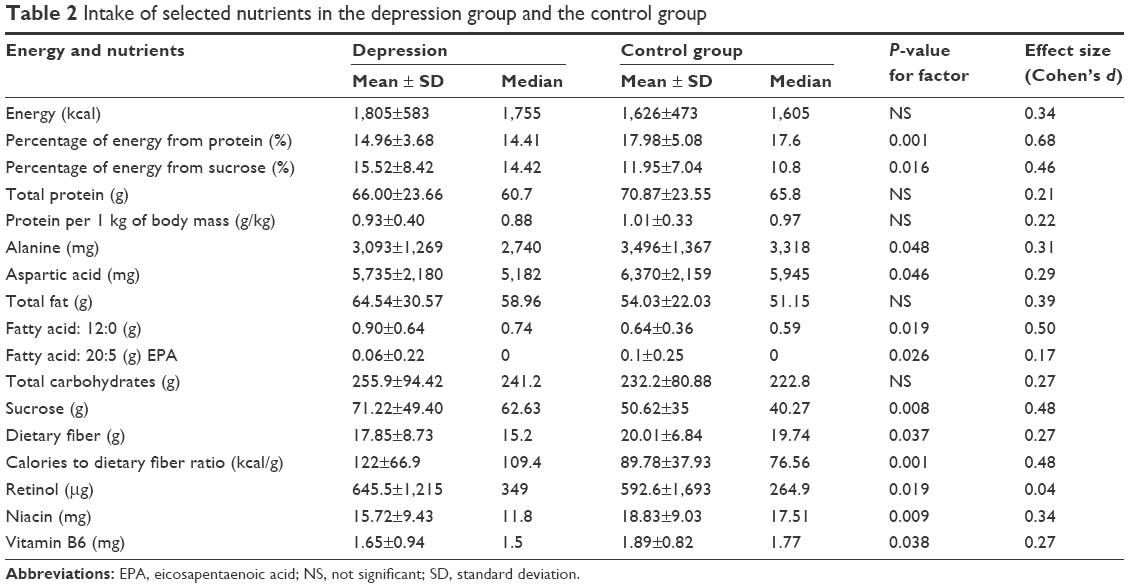 | Table 2 Intake of selected nutrients in the depression group and the control group |
In order to determine whether the differences in the absolute intake are equally relevant to nutrient density, the content of nutrients that was significantly different between the two groups was recalculated per 1,000 kcal. Subjects with depression presented lower nutrient density for alanine, aspartic acid, EPA, dietary fiber, niacin and vitamin B6, while a higher nutrient density was observed for sucrose. No significant difference was observed for fatty acid 12:0 or retinol (Table S3).
Simultaneous assessment of group affiliation effect and selected nutrient intake on physical and cognitive functioning of investigated groups
Table 3 presents the relationships obtained between functional measures as dependent variables, and group affiliation and selected nutrient levels as independent variables. Only those nutrients and functional measures that were significantly different between the two groups in bivariate associations are presented. GDS, falls and the three dimensions of the Euroqol 5D questionnaire (mobility, self-care and anxiety/depression problems) were related only to the depression group affiliation in multivariate analyses and are not shown in Table 3.
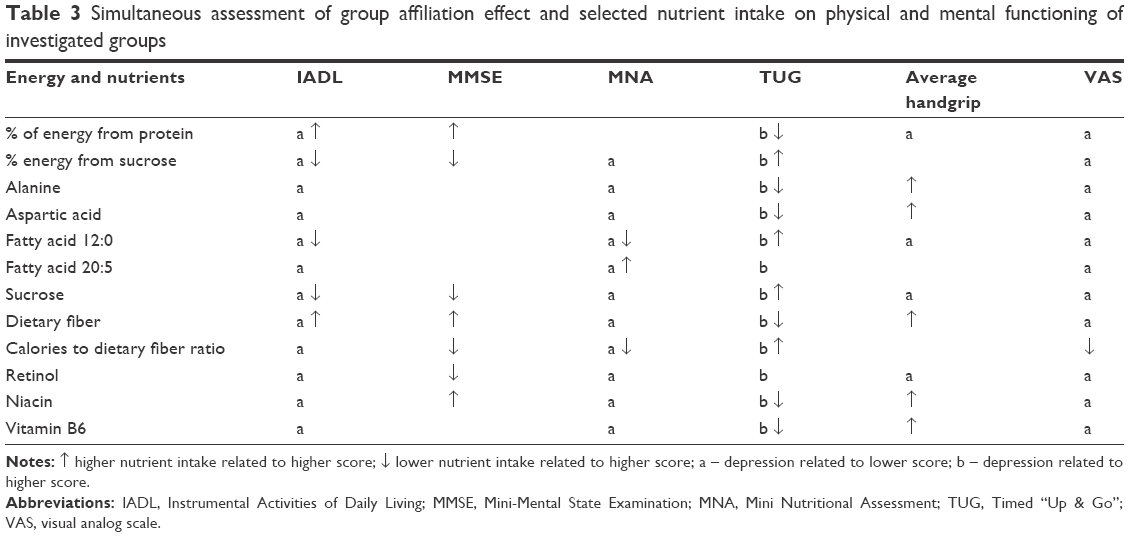 | Table 3 Simultaneous assessment of group affiliation effect and selected nutrient intake on physical and mental functioning of investigated groups |
A higher percentage of energy obtained from protein, a lower percentage from sucrose and a lower absolute intake of sucrose were associated with better indicators of MMSE, IADL and TUG (Table 3). A higher intake of the amino acids alanine and aspartic acid was linked to better (lower) TUG results and higher average handgrip strength. Higher fatty acid 12:0 intake was associated with the poorer IADL, MNA and TUG results, while higher EPA intake was related to a better MNA score. A higher intake of dietary fiber and lower calories-to-dietary fiber ratio were associated with better functional state and higher VAS. Higher retinol intake was associated with a worse MMSE score. Higher intakes of niacin and vitamin B6 were associated with better (lower) TUG results and greater average handgrip strength. In addition, niacin was associated with higher MMSE (Table 3). No significant interactions were noted between group affiliation and selected nutrient intake.
Three types of relationship were observed between nutrients, the presence of depression and dependent variables: either only the level of nutrient intake was significant and depression was not associated with functional/mental status (Figure 1), or depression differentiated the results but the level of nutrient intake was not significant (Figure 2) or the results were related to both group affiliation and the level of nutrient intake (Figure 3).
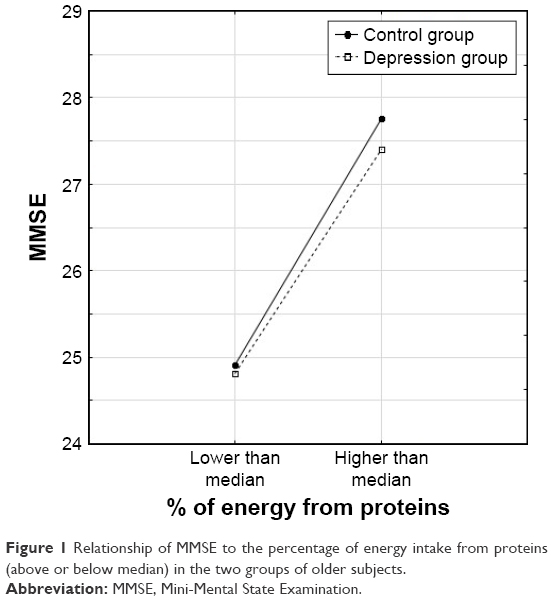 | Figure 1 Relationship of MMSE to the percentage of energy intake from proteins (above or below median) in the two groups of older subjects. |
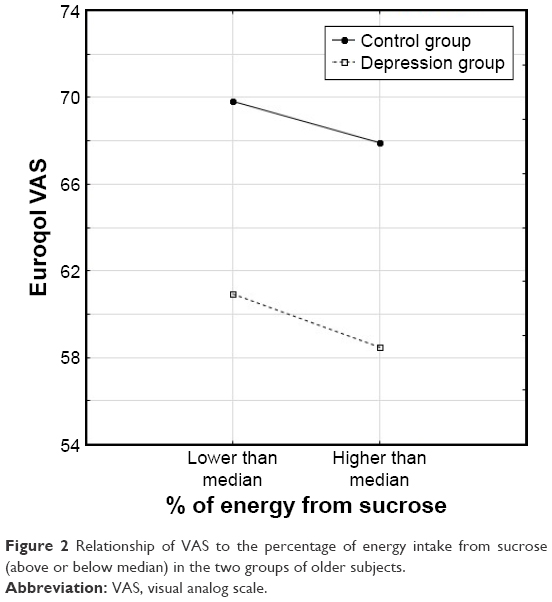 | Figure 2 Relationship of VAS to the percentage of energy intake from sucrose (above or below median) in the two groups of older subjects. |
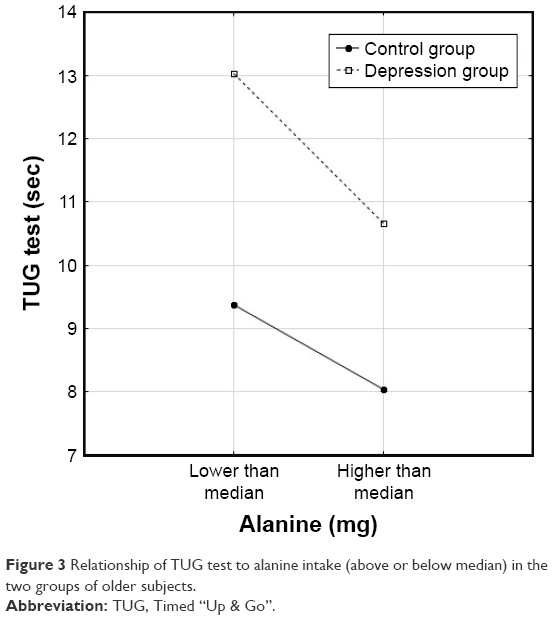 | Figure 3 Relationship of TUG test to alanine intake (above or below median) in the two groups of older subjects. |
Discussion
A key novel aspect of this study is that it analyzes in detail how observed differences in nutrition may be related to physical and cognitive functioning, nutritional status and the QoL of older people with depression as compared to their non-depressed peers. Our results indicate that differences in cognitive functioning (MMSE) between the groups, and handgrip strength to some extent, may be qualified as purely dependent on specific nutrient intake, as inter-group disparities disappeared after adjusting for nutrient intake. Therefore, increasing the intake of specific nutrients may improve cognitive functioning and muscle strength to a similar extent in both groups, regardless of the presence of depression. The differences in functional and nutritional status noted by IADL, MNA, TUG and the muscle strength tests may be ascribed to both presence of depression and inappropriate consumption of given nutrients. Therefore, by improving nutrient intake, the depressed subjects may move toward better nutritional status and the functioning level of non-depressed individuals. Finally, several aspects of functioning may be attributed only to the presence of depression: GDS, fall incidence and QoL (with the exception of “calories to dietary fiber ratio – VAS relationship”) were worse in the depression group with no apparent relationship with nutrition.
The dietary components associated with worse functioning of people with depression are a low percentage of energy from protein and a lower intake of amino acids. Protein is an important part of the diet of older people and the ESPEN (The European Society for Clinical Nutrition and Metabolism) Expert Group recommend an optimal intake of at least 1–1.5 g protein/kg body mass per day,29 with protein as 15%–20% of total energy intake for healthy older adults.30 Only 28 (43%) of our patients with depression and 44 (68%) of the control group obtained more than 15% of their energy from protein sources. A consequence of inadequate protein intake is a negative nitrogen balance and the decline of protein levels, especially that of skeletal muscle proteins.31 In our study, a higher percentage protein intake was associated with better functional and cognitive status. Consumption of alanine and aspartic acid was also lower in depressed subjects, and this had a clear effect on TUG results and handgrip strength. A review by Cawood et al indicated improved handgrip strength as an effect of high-protein multinutrient oral supplements32 and another study found older subjects performed better in the TUG test after protein-energy supplementation.33 Interestingly, in the present study, both the percentage of calories obtained from protein and total alanine and aspartic acid consumption were found to influence functional status (IADL and TUG) independent of the presence of depression, with depressed subjects presenting both lower protein consumption and lower function. Therefore, increasing the consumption of alanine and aspartic acid and the percentage of energy obtained from protein may similarly improve functioning, but in the depression group these associations are shifted toward lower functional levels. A better MMSE score was associated with higher protein intake in both groups, which may be related to the fact that the intake of the two amino acids, as well as protein in general, can affect brain functioning and mental health. Many of the neurotransmitters in the brain are made from amino acids.34
Another dietary pattern associated with depressive symptoms that is becoming increasingly common among the elderly, is the consumption of diets with higher levels of sucrose, and of diets with a higher proportion of energy obtained from sucrose.35,36 In the present study, only 16 (25%) patients with depression and 31 (48 %) in the control group consumed less than the recommended 10% of sucrose. Such high sucrose intake was inversely associated with physical (IADL and TUG test) and cognitive function. Our findings are concordant with those of Ye at al, who observed sugar intake to be inversely associated with MMSE score in a group of middle-aged and older subjects with a mean sucrose intake of 46.7 g per day and MMSE of 23.7.37 This association may probably be attributed to reduced memory function. In the longer term, high sucrose intake is a risk factor for obesity, metabolic syndrome and type 2 diabetes. Those disorders are risk factors for cognitive impairment. Similarly, Cao at al found that long-term consumption of sucrose-sweetened water induced insulin resistance and exacerbated memory deficits in transgenic mice.38 In our study, as for protein intake, sucrose affects IADL and TUG in a comparable manner in both groups, with the depression group being at lower functional levels.
Our findings demonstrate that a low fiber intake and high calorie to dietary fiber ratio is associated with a significant negative impact on health. These are typical determinants of an unhealthy Western dietary pattern which indicate the consumption of highly processed foods, and a diet low in fruit and vegetables. Dietary fiber consumption is an important factor that influences microbial composition in the gut, promoting a shift toward different types of “beneficial” bacteria and inhibiting the proliferation of pathogenic bacteria.39 Dietary fiber also lowers the glycemic index, provides a moderate but lasting effect on brain chemistry, energy level, mood and memory.40,41 Our data indicate that insufficient fiber consumption may contribute to lower functioning, worse nutritional status and even poorer QoL. Depression may aggravate those conditions by moving functional status – nutrient intake associations toward lower level of functioning. It should be pointed out that the recommended minimum daily amount of 20 g of fiber42 was consumed by only 22 (34%) subjects with depression and 31 (48%) controls, and the relevant calories to fiber ratio of less than 108 kcal/1 g43 was achieved by 32 (49%) depressed and 49 (75%) control subjects. In light of our research, fiber seems to be one of the key factors potentially able to improve the functioning of older people with depression. A high calorie to dietary fiber ratio indicates a low quality diet. This index was also adversely associated with MNA, QoL expressed as VAS and MMSE.
In the present study, EPA intake was lower in the depression group and was positively related to MNA in both groups. The protective effect of fatty acid EPA on the incidence of depression has been a frequent topic of research.44–47 While supplementation attempts have generally not been successful,48 a diet rich in EPA, a primary source of which is fish, is known to have a favorable impact on depression. However, in the present study, more than half of the depression group had not consumed EPA at all during the previous 24 hours.
The inverse relationship between lauric acid 12:0 intake and the results of the IADL and TUG tests may be related to the fact that it is a cholesterol-elevating (cholesterogenic) saturated fat. Lauric acid raises both high-density lipoprotein and low-density lipoprotein levels. A study conducted in Sydney showed that intake of saturated fat reduces the anti-inflammatory potential of high-density lipoprotein and impairs arterial endothelial function.49 A poor quality, unvaried diet characterized by higher lauric acid intake may also lead to a lower MNA score. Similarly, a negative association was found between retinol intake and MMSE, which has been associated with high consumption of saturated fats of animal origin, known to be responsible for lower cognitive function.50
A low niacin intake was associated with lower cognitive status, with only 27 people in the depression group consuming the recommended dietary allowance level.42 A similar association was presented by Morris et al,51 who report that dietary niacin may protect against Alzheimer’s disease and age-related cognitive decline. This is probably a result of the fact that niacin plays important roles in DNA synthesis and repairs, myelination and dendritic growth, cellular calcium signaling, and may act as a potent antioxidant in mitochondria in brain tissue.51,52 Some better physical test results were associated with higher intakes of niacin and vitamin B6, which take part in carbohydrate, fat and protein metabolism, play a role in the synthesis of sex and stress-related hormones and enable the proper functioning of the nervous system. Additionally, dietary vitamin B6 status is probably a determinant of the concentration of carnosine, a dipeptide associated with skeletal muscle performance.53
Strengths and limitations
The key strengths of the present study are its careful recruitment procedure and the homogeneity of the study groups. However, some limitations should be acknowledged. First, it is a cross-sectional study with a relatively small sample of participants. Effective verbal communication was an inclusion criterion and patients with severe dementia or terminal illness were excluded. Although several procedures have been implemented to minimize the risk of errors, the 24-hour recall questionnaire has its own limitations, such as misreporting and recall bias. The present analysis did not apply any additional statistical or biomarker methods, such as the use of double-labeled water or nitrogen in the urine analysis to verify the declared energy and nutrient consumption. Finally, although the obtained results may apply to Polish or Central-European populations, they may differ from those of other populations and cultures in and beyond Europe, and so caution should be exercised in data interpretation, and our findings should be confirmed by further prospective studies. Future controlled trials should focus on the nutrients associated with worse tests results.
Conclusion
We conclude that inappropriate intake of selected nutrients may contribute to lower functioning and worse QoL in older adults with depression. Identified nutrients include insufficient consumption of protein, fiber, EPA, niacin and vitamin B6, and excess intake of sucrose. These findings should be translated into designing dietary plans for individual patients to address these nutrient deficiencies. Therefore, nutritional recommendations should emphasize the consumption of less processed products, and limit the intake of sugar, saturated animal fats and palm oil, as well as including products that are a good source of vitamin B6, niacin and EPA.
Acknowledgments
We appreciate the statistical assistance of Janusz Śmigielski, PhD. This study was supported by grant 503/6-077-01/503-01 from the Medical University of Lodz. The authors were partially supported by the Healthy Ageing Research Centre project (REGPOT-2012-2013-1, 7FP).
Author contributions
Each author certifies that he or she has participated sufficiently in the intellectual content, analysis of data, if applicable, and the writing of the manuscript to take public responsibility for it. Each author has reviewed the final version of the manuscript, believes it represents valid work, and approves it for publication.
Disclosure
Joanna Kostka is the wife of Tomasz Kostka. The authors report no conflicts of interest in this work.
References
Blazer DG. Depression in late life: review and commentary. J Gerontol A Biol Sci Med Sci. 2003;58(3):249–265. | ||
World Health Organization. Depression. A global Public health Concern. WHO Department of Mental Health and Substance Abuse: World Health Organization; 2012. Available from: http://www.who.int/mental_health/management/depression/en/. Accessed September 19, 2016. | ||
Murray CJ, Lopez AD, Jamison DT. The global burden of disease in 1990: summary results, sensitivity analysis and future directions. Bull World Health Organ. 1994;72(3):495–509. | ||
PolSenior [homepage on the Internet]. Medical, psychological, sociological and economic aspects of ageing in Poland; 2012. Available from: http://polsenior.iimcb.gov.pl/monografia. Accessed September 19, 2016. | ||
Moussavi S, Chatterji S, Verdes E, Tandon A, Patel V, Ustun B. Depression, chronic diseases, and decrements in health: results from the World Health Surveys. Lancet. 2007;370(9590):851–858. | ||
Hajek A, Brettschneider C, Posselt T, et al. Predictors of frailty in old age–results of a longitudinal study. J Nutr Health Aging. 2015:1–6. | ||
Hamer M, Bates CJ, Mishra GD. Depression, physical function, and risk of mortality: National Diet and Nutrition Survey in adults older than 65 years. Am J Geriatr Psychiatry. 2011;19(1):72–78. | ||
Péquignot R, Dufouil C, Prugger C, et al. High level of depressive symptoms at repeated study visits and risk of coronary heart disease and stroke over 10 years in older adults: The Three-City Study. J Am Geriatr Soc. 2016;64(1):118–125. | ||
Guligowska AR, Piglowska M, Smigielski J, Kostka T. Inappropriate pattern of nutrient consumption and coexistent cardiometabolic disorders in elderly people from Poland. Pol Arch Med Wewn. 2015;125(7–8):521–531. | ||
Bailly N, Maitre I, Van Wymelbeke V. Relationships between nutritional status, depression and pleasure of eating in aging men and women. Arch Gerontol Geriatr. 2015;61(3):330–336. | ||
Suominen MH, Jyvakorpi SK, Pitkala KH, et al. Nutritional guidelines for older people in Finland. J Nutr Health Aging. 2014;18(10):861–867. | ||
Akbaraly TN, Brunner EJ, Ferrie JE, Marmot MG, Kivimaki M, Singh-Manoux A. Dietary pattern and depressive symptoms in middle age. Br J Psychiatry. 2009;195(5):408–413. | ||
Rahe C, Unrath M, Berger K. Dietary patterns and the risk of depression in adults: a systematic review of observational studies. Eur J Nutr. 2014;53(4):997–1013. | ||
Quirk SE, Williams LJ, O’Neil A, et al. The association between diet quality, dietary patterns and depression in adults: a systematic review. BMC Psychiatry. 2013;13:175. | ||
Kohatsu W. Nutrition and depression. Explore (NY). 2005;1(6):474–476. | ||
Durnin JV, Womersley J. Body fat assessed from total body density and its estimation from skinfold thickness: measurements on 481 men and women aged from 16 to 72 years. Br J Nutr. 1974;32(1):77–97. | ||
Katz S, Ford AB, Moskowitz RW, Jackson BA, Jaffe MW. Studies of illness in the aged. The index of ADL: a standardized measure of biological and psychosocial function. JAMA. 1963;185:914–919. | ||
No authors listed. Instrumental Activities of Daily Living (IADL) Scale. Self-rated version. Incorporated in the Philadelphia Geriatric Center. Multilevel Assessment Instrument (MAI). Psychopharmacol Bull. 1988;24(4):789–791. | ||
Folstein MF, Folstein SE, McHugh PR. “Mini-mental state”. A practical method for grading the cognitive state of patients for the clinician. J Psychiatr Res. 1975;12(3):189–198. | ||
Yesavage JA, Brink TL, Rose TL, et al. Development and validation of a geriatric depression screening scale: a preliminary report. J Psychiatr Res. 1982;17(1):37–49. | ||
Guigoz Y, Vellas B, Garry PJ. Assessing the nutritional status of the elderly: The Mini Nutritional Assessment as part of the geriatric evaluation. Nutr Rev. 1996;54(1 Pt 2):S59–S65. | ||
Mathias S, Nayak US, Isaacs B. Balance in elderly patients: the “get-up and go” test. Arch Phys Med Rehabil. 1986;67(6):387–389. | ||
Podsiadlo D, Richardson S. The timed “Up & Go”: a test of basic functional mobility for frail elderly persons. J Am Geriatr Soc. 1991;39(2):142–148. | ||
Rantanen T, Guralnik JM, Foley D, et al. Midlife hand grip strength as a predictor of old age disability. JAMA. 1999;281(6):558–560. | ||
Kind P, Dolan P, Gudex C, Williams A. Variations in population health status: results from a United Kingdom national questionnaire survey. BMJ. 1998;316(7133):736–741. | ||
Kunachowicz H, Nadolna I, Przygoda B, Iwanow K. Tabele Składu i Wartości Odżywczej Żywności [Food Composition Tables]. Warszawa: PZWL; 2005. Polish. | ||
Kostecka M. The role of healthy diet in the prevention of osteoporosis in perimenopausal period. Pak J Med Sci. 2014;30(4):763–768. | ||
Cohen J. Statistical power analysis for the behavioral sciences. 2nd ed. New Jersey: Lawrence Erlbaum Associates; 1988. | ||
Deutz NE, Bauer JM, Barazzoni R, et al. Protein intake and exercise for optimal muscle function with aging: recommendations from the ESPEN Expert Group. Clin Nutr. 2014;33(6):929–936. | ||
Ulla-Kaisa Hursti, Becker W. Nordic Nutrition Recommendations 2012: Nordic Council of Ministers; 2012. Available from: https://www.norden.org/en/theme/nordic-nutrition-recommendation/nordic-nutrition-recommendations-2012. Accessed April 25, 2016. | ||
Muscariello E, Nasti G, Siervo M, et al. Dietary protein intake in sarcopenic obese older women. Clin Interv Aging. 2016;11:133–140. | ||
Cawood AL, Elia M, Stratton RJ. Systematic review and meta-analysis of the effects of high protein oral nutritional supplements. Ageing Res Rev. 2012;11(2):278–296. | ||
Kim CO, Lee KR. Preventive effect of protein-energy supplementation on the functional decline of frail older adults with low socioeconomic status: a community-based randomized controlled study. J Gerontol A Biol Sci Med Sci. 2013;68(3):309–316. | ||
Rao TS, Asha MR, Ramesh BN, Rao KS. Understanding nutrition, depression and mental illnesses. Indian J Psychiatry. 2008;50(2):77–82. | ||
Jeffery RW, Linde JA, Simon GE, et al. Reported food choices in older women in relation to body mass index and depressive symptoms. Appetite. 2009;52(1):238–240. | ||
Bleich SN, Wang YC, Wang Y, Gortmaker SL. Increasing consumption of sugar-sweetened beverages among US adults: 1988–1994 to 1999–2004. Am J Clin Nutr. 2009;89(1):372–381. | ||
Ye X, Gao X, Scott T, Tucker KL. Habitual sugar intake and cognitive function among middle-aged and older Puerto Ricans without diabetes. Br J Nutr. 2011;106(9):1423–1432. | ||
Cao D, Lu H, Lewis TL, Li L. Intake of sucrose-sweetened water induces insulin resistance and exacerbates memory deficits and amyloidosis in a transgenic mouse model of Alzheimer disease. J Biol Chem. 2007;282(50):36275–36282. | ||
Scheppach W, Luehrs H, Menzel T. Beneficial health effects of low-digestible carbohydrate consumption. Br J Nutr. 2001;85 Suppl 1:S23–S30. | ||
Kaczmarczyk MM, Miller MJ, Freund GG. The health benefits of dietary fiber: beyond the usual suspects of type 2 diabetes mellitus, cardiovascular disease and colon cancer. Metabolism. 2012;61(8):1058–1066. | ||
Gangwisch JE, Hale L, Garcia L, et al. High glycemic index diet as a risk factor for depression: Analyses from the Women’s Health Initiative. Am J Clin Nutr. 2015;102(2):454–463. | ||
Jarosz M. Nutrition Standards for the Polish population – amendment. Warszawa: Instytut Żywności i Żywienia; 2012. Available from: http://www.izz.waw.pl/attachments/article/33/NormyZywieniaNowelizacjaIZZ2012.pdf. Accessed April 26, 2016. | ||
European Heart Network [homepage on the Internet]. Diet, Physical Activity and Cardiovascular Disease Prevention in Europe. Brussels: EHN; 2011. Available from: http://www.ehnheart.org/publications/publications/publication/521-diet-physical-activity-and-cardiovascular-disease-prevention.html. Accessed September 19, 2016. | ||
Grosso G, Pajak A, Marventano S, et al. Role of omega-3 fatty acids in the treatment of depressive disorders: A comprehensive meta-analysis of randomized clinical trials. PLoS One. 2014;9(5):e96905. | ||
Sublette ME, Ellis SP, Geant AL, Mann JJ. Meta-analysis of the effects of eicosapentaenoic acid (EPA) in clinical trials in depression. J Clin Psychiatry. 2011;72(12):1577–1584. | ||
Bloch MH, Hannestad J. Omega-3 fatty acids for the treatment of depression: systematic review and meta-analysis. Mol Psychiatry. 2012;17(12):1272–1282. | ||
Sinn N, Milte CM, Street SJ, et al. Effects of n-3 fatty acids, EPA v. DHA, on depressive symptoms, quality of life, memory and executive function in older adults with mild cognitive impairment: a 6-month randomised controlled trial. Br J Nutr. 2012;107(11):1682–1693. | ||
Jackson P, Forster J, Bell J, Dick J, Younger I, Kennedy D. DHA supplementation alone or in combination with other nutrients does not modulate cerebral hemodynamics or cognitive function in healthy older adults. Nutrients. 2016;8(2):86. | ||
Nicholls SJ, Lundman P, Harmer JA, et al. Consumption of saturated fat impairs the anti-inflammatory properties of high-density lipoproteins and endothelial function. J Am Coll Cardiol. 2006;48(4):715–720. | ||
Okereke OI, Rosner BA, Kim DH, et al. Dietary fat types and 4-year cognitive change in community-dwelling older women. Ann Neurol. 2012;72(1):124–134. | ||
Morris MC, Evans DA, Bienias JL, et al. Dietary niacin and the risk of incident Alzheimer’s disease and of cognitive decline. J Neurol Neurosurg Psychiatry. 2004;75(8):1093–1099. | ||
Vonder Haar C, Peterson TC, Martens KM, Hoane MR. Vitamins and nutrients as primary treatments in experimental brain injury: Clinical implications for nutraceutical therapies. Brain Res. 2016;1640(Pt A):114–129. | ||
Suidasari S, Stautemas J, Uragami S, Yanaka N, Derave W, Kato N. Carnosine content in skeletal muscle is dependent on vitamin B6 status in rats. Front Nutr. 2016;2:39. |
Supplementary materials
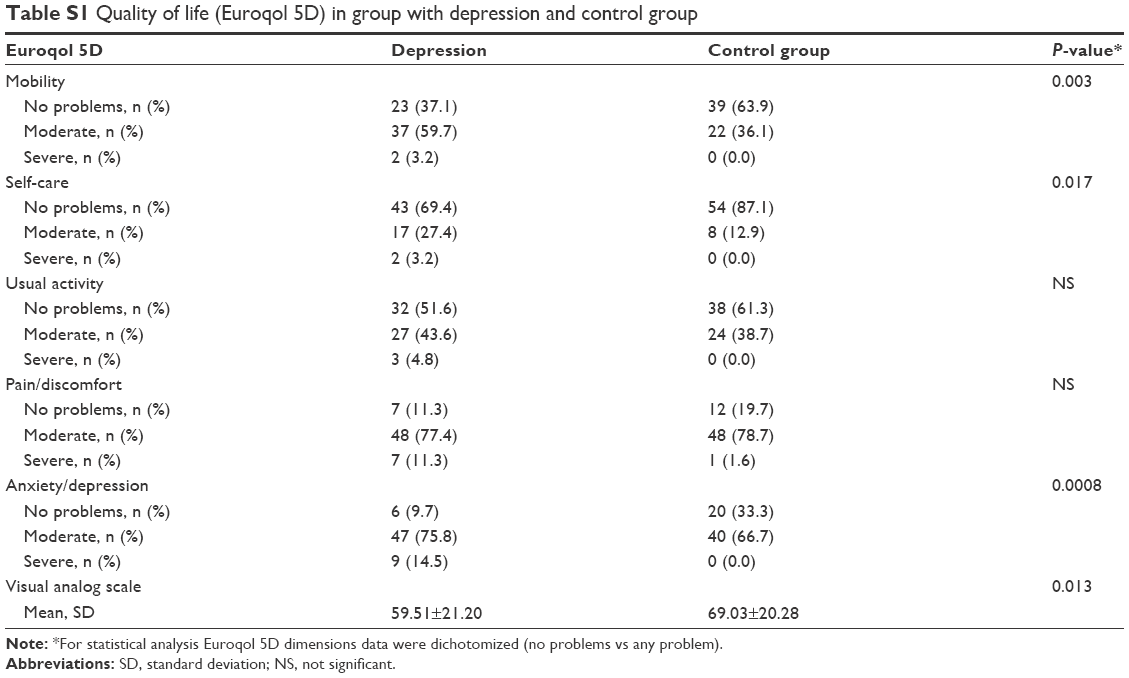 | Table S1 Quality of life (Euroqol 5D) in group with depression and control group |
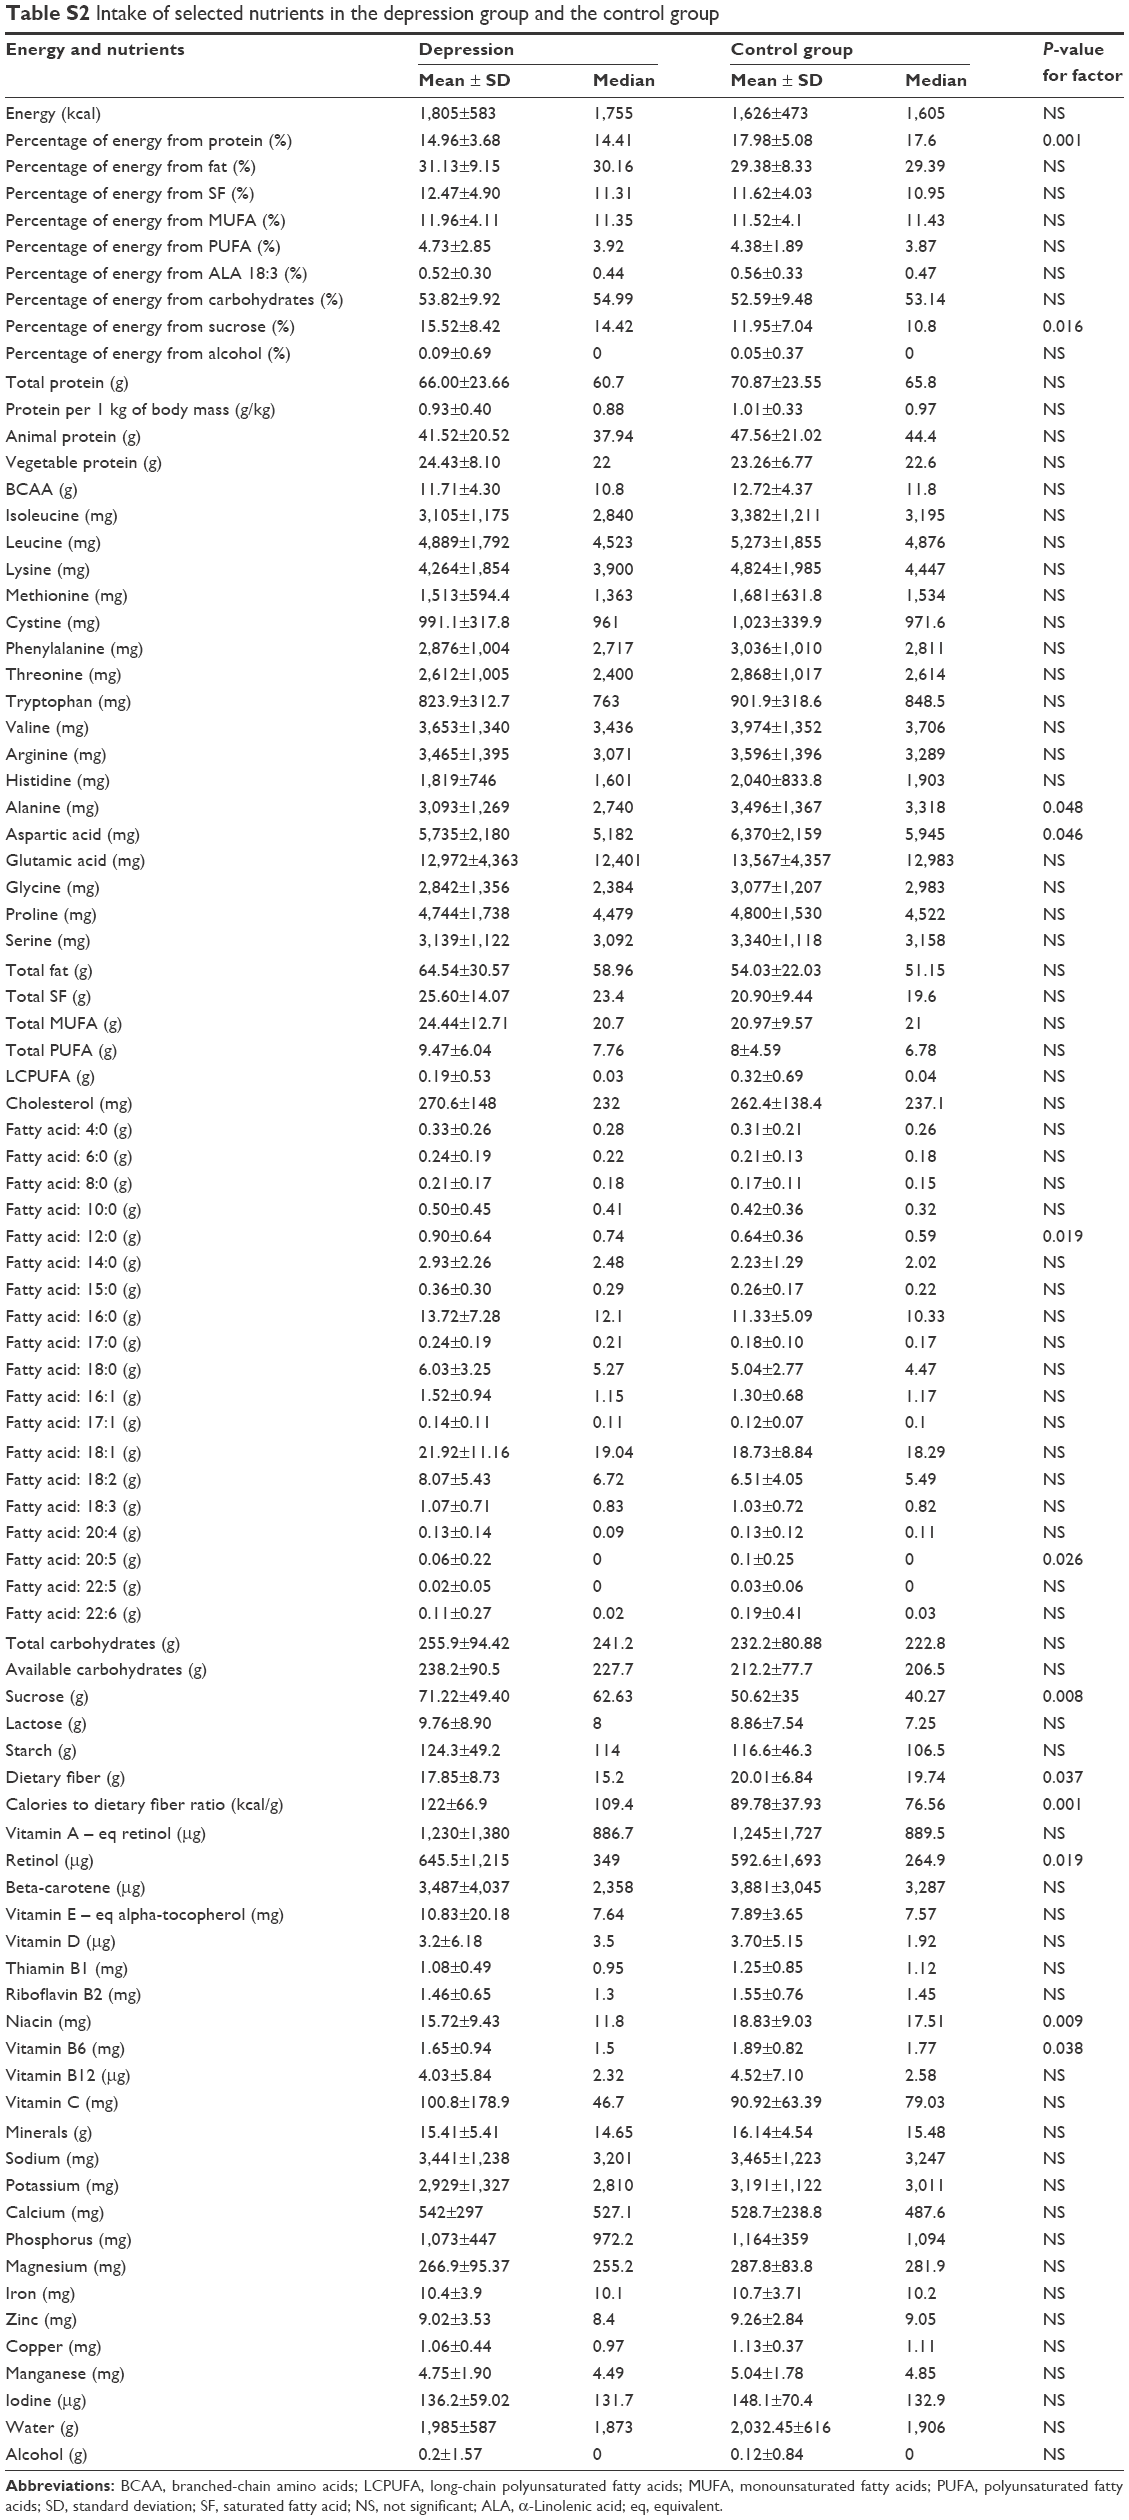 | Table S2 Intake of selected nutrients in the depression group and the control group |
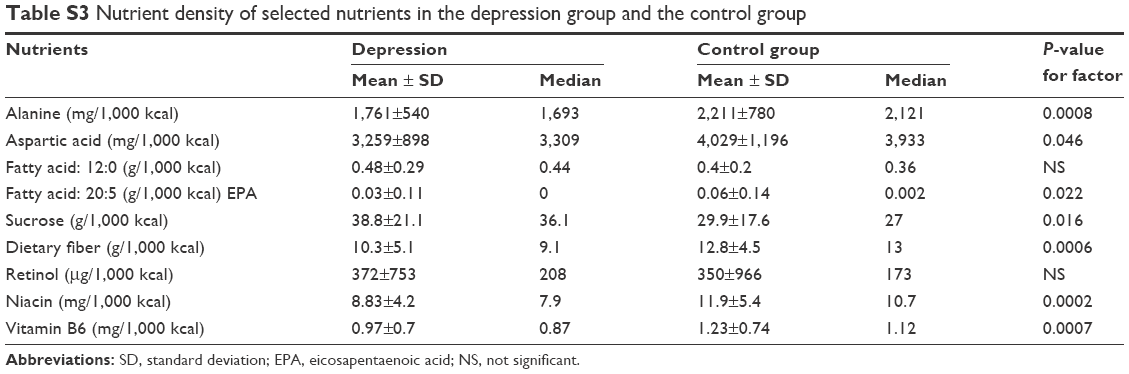 | Table S3 Nutrient density of selected nutrients in the depression group and the control group |
 © 2016 The Author(s). This work is published and licensed by Dove Medical Press Limited. The full terms of this license are available at https://www.dovepress.com/terms.php and incorporate the Creative Commons Attribution - Non Commercial (unported, v3.0) License.
By accessing the work you hereby accept the Terms. Non-commercial uses of the work are permitted without any further permission from Dove Medical Press Limited, provided the work is properly attributed. For permission for commercial use of this work, please see paragraphs 4.2 and 5 of our Terms.
© 2016 The Author(s). This work is published and licensed by Dove Medical Press Limited. The full terms of this license are available at https://www.dovepress.com/terms.php and incorporate the Creative Commons Attribution - Non Commercial (unported, v3.0) License.
By accessing the work you hereby accept the Terms. Non-commercial uses of the work are permitted without any further permission from Dove Medical Press Limited, provided the work is properly attributed. For permission for commercial use of this work, please see paragraphs 4.2 and 5 of our Terms.