")
Back to Journals » Drug Design, Development and Therapy » Volume 11
In silico-based identification of human α-enolase inhibitors to block cancer cell growth metabolically
Authors Lung J , Chen KL, Hung CH, Chen CC, Hung MS, Lin YC , Wu CY, Lee KD , Shih NY, Tsai YH
Received 18 August 2017
Accepted for publication 27 September 2017
Published 16 November 2017 Volume 2017:11 Pages 3281—3290
DOI https://doi.org/10.2147/DDDT.S149214
Checked for plagiarism Yes
Review by Single anonymous peer review
Peer reviewer comments 2
Editor who approved publication: Professor Anastasios Lymperopoulos
Jrhau Lung,1 Kuan-Liang Chen,2 Chien-Hui Hung,3 Chih-Cheng Chen,4,5 Ming-Szu Hung,5–7 Yu-Ching Lin,5–7 Ching-Yuan Wu,8 Kuan-Der Lee,9 Neng-Yao Shih,10 Ying Huang Tsai11,12
1Department of Medical Research and Development, Chang Gung Memorial Hospital, Chiayi, 2Department of Endodontics, ChiMei Medical Center, Tainan, 3Graduate Institute of Clinical Medical Sciences, Chang Gung University, Taoyuan, 4Division of Hematology and Oncology, Chang Gung Memorial Hospital, Chiayi, 5Department of Medicine, Chang Gung University, Taoyuan, 6Department of Respiratory Care, Chang Gung University of Science and Technology, Chiayi, 7Division of Thoracic Oncology, Department of Pulmonary and Critical Care Medicine, 8Department of Chinese Medicine; Chang Gung Memorial Hospital, Chiayi, 9Department of Hematology and Oncology, Taipei Medical University Hospital, Taipei, 10National Institute of Cancer Research, National Health Research Institutes, Tainan, 11Department of Respiratory Care, College of Medicine, Chang Gung University, Taoyuan, 12Division of Pulmonary and Critical Care Medicine, Department of Internal Medicine, Chang Gung Memorial Hospital-Kaohsiung Medical Center, Kaohsiung, Taiwan
Abstract: Unlimited growth of cancer cells requires an extensive nutrient supply. To meet this demand, cancer cells drastically upregulate glucose uptake and metabolism compared to normal cells. This difference has made the blocking of glycolysis a fascinating strategy to treat this malignant disease. α-enolase is not only one of the most upregulated glycolytic enzymes in cancer cells, but also associates with many cellular processes or conditions important to cancer cell survival, such as cell migration, invasion, and hypoxia. Targeting α-enolase could simultaneously disturb cancer cells in multiple ways and, therefore, is a good target for anticancer drug development. In the current study, more than 22 million chemical structures meeting the criteria of Lipinski’s rule of five from the ZINC database were docked to α-enolase by virtual screening. Twenty-four chemical structures with docking scores better than that of the enolase substrate, 2-phosphoglycerate, were further screened by the absorption, distribution, metabolism, excretion, and toxicity (ADMET) properties prediction. Four of them were classified as non-mutagenic, non-carcinogenic, and capable of oral administration where they showed steady interactions to α-enolase that were comparable, even superior, to the currently available inhibitors in molecular dynamics (MD) simulation. These compounds may be considered promising leads for further development of the α-enolase inhibitors and could help fight cancer metabolically.
Keywords: α-enolase inhibitor, virtual screening, molecular dynamics simulation, glycolysis, metabolism
Introduction
A hallmark of cancer cells is their ability for unlimited growth and proliferation. To maintain this exceptional competence in cell mass expansion, cancer cells out-compete normal cells in nutrient uptake by upregulating molecules in nutrient absorption and utilization to support their needs.1 The drastic difference in nutrient demand between cancer cells and normal cells has made blocking the nutrient supply a fascinating and important strategy in cancer treatment and has led to the development and application of antiangiogenesis agents to treat different types of cancer.2 Nonetheless, cancer cells escape the cytotoxicity of anti-vascular agents by disintegration of tumor mass into small pieces to avoid dependence on the nutrient supply from the vascular system.3 For this reason, instead of preventing nutrient entry from the outside of the cells, restriction of nutrient uptake and utilization from within the cells would be a better alternative and the ultimate strategy to deprive cancer cells of nutrients.
To accomplish rapid growth and proliferation, cancer cells preferentially grasp and use large quantities of glucose from the surrounding extracellular space. After glucose enters the cells, it is metabolized through glycolysis to provide energy, reducing power and various building blocks for downstream anabolic processes. To support the heaviest loading metabolic pathway in cancer cells, the expression of many glycolytic enzymes is constantly upregulated. α-Enolase is one of the most upregulated glycolytic enzymes in cancer cells,4 and has been found to overexpress in types of cancer, including nasopharyngeal carcinoma,5 lung,6 breast,7 colon,8 prostate,9 and so on. It not only serves as the penultimate step in glycolysis, which catalyzes the conversion of 2-phosphoglycerate (2-PGA) to phosphoenopyruvate (PEP), but is also involved in many important cellular processes in tumorigenesis, such as gene transcription,10 and cell migration and invasion.11 Due to its pivotal roles in the metabolism and tumorigenesis of cancer cells, targeting α-enolase could strike cancer cells at multiple points simultaneously and is of great interest in anticancer drug development. Until today, several α-enolase inhibitors with various potencies designed on the basis of substrate or intermediate analogs have been reported, such as the D-tartronate semialdehyde phosphate (TSP) with a Ki value in the micromolar range, 3-aminoenolpyruvate phosphate (AEP) with a Ki value in the submicromolar range,12 and the most potent one, phosphonoacetohydroxamate (PhAH), with a Ki value in the picomolar range.13 Very recently, an antibiotic, SF-2312, produced by Micromonospora s. was identified through a similarity search to the structure of PhAH as a potent α-enolase inhibitor with a Ki value in the nanomolar range.14 However, these inhibitors show either poor stability or undesirable pharmacological properties in vivo, and none are favorable for further clinical development.12,15 More effort is required to identify a useful α-enolase inhibitor for therapeutic use.
To identify a useful inhibitor for α-enolase, in silico-based virtual screening is adopted to identify the lead compounds for the α-enolase inhibitors from the ZINC database – a comprehensive public accessible chemical database. Several different methodologies, including contact fingerprint analysis, ADMET properties prediction, and MD simulation, were used to refine the dock screening results. Through this work, comprehensive molecular structure information on compounds fitting the catalytic pocket of human α-enolase was obtained. The entire workflow combined with the results of contact fingerprint, ADMET, and MD simulation give not only a direction to further optimization of the α-enolase inhibitor but also a template to develop other metabolic enzyme blockers to help fight cancer.
Materials and methods
α-Enolase structure preparation
The X-ray crystallographic structure of human α-enolase (2PSN) was retrieved from the RCSB Protein Data Bank. As the substrate does not co-crystalize with the protein, the chain A structure of 2PSN was modeled against chain A of three γ-enolase structures – 3UCC, 3UCD, and 3UFA – harboring 2-PGA and magnesium in the active site and in closed conformation to rebuild the α-enolase structure using comparative structure modeling by Modeller.16 The model with the lowest Discrete Optimized Protein Energy score (DOPE) was chosen for subsequent virtual screening.
Ligand data set selection
The chemical structure library was constructed by selecting compounds meeting the modified Lipinski’s rule of five17,18 (molecular weight range: 55~500 Dalton; hydrogen bond donor: <5, hydrogen bond acceptor: <10, octanol–water partition coefficient logP: −1~6; polar surface area: <140 Å; net charge:-2~2) from the ZINC database (http://zinc.docking.org/zinc/). All Clean subset 2012-04-26, 2013-01-10, and 2013-12-18 versions, and combined with a non-redundant approved drug dataset (a kind gift by Dr Hongjiang Li, Chinese University of Hong Kong) constructed from the US (FDA), UK (NHS), EU (EMA), Japanese (NHI), and Canadian (HC) authorities to a total number of 3,167.
Molecular docking, virtual screening, and contact fingerprint clustering analysis
Molecular docking and screening were undertaken using the CUDA supported multithreading screening program, idock, in a server hosted by the Chinese University of Hong Kong (http://istar.cse.cuhk.edu.hk/idock/).19,20 A grid box encompassing the amino acid side chains involved in catalytic process, including Glu167, Glu210, Lys343, and Lys394, and stabilized substrate and metal cofactors around the catalytic pocket, including Ala39, Ser40, His158, Gln166, Arg372, and Ser373, were used in the screening. The grid box parameters were set to values of 102.724 Å, 97.855 Å, and 23.498 Å for the grid box center and 10.000 Å ×13.248 Å ×10.764 Å for the box dimensions. For each chemical structure, nine docking conformations are generated, and the best docking score was used to generate its ranking. Chemical structures with a good docking score were further analyzed and classified according to their contact modes and strengths with amino acids of α-enolase using the AuPosSOM 2.1 web interface (https://www.biomedicale.univ-paris5.fr/aupossom/).21,22 The clustering began with an initial raw training phase, in which α began at 0.2 and ended at 0, radius began at 6 Å and ended with 1 Å for 1,000 iterations. It was followed by a second phase of a more accurate clustering, in which α began at 0.02 and ended at 0, and radius began at 3 Å and ended with 1 Å for 10,000 iterations. The weak contact population was filtered at 0.02. The equally populated contact was filtered at α equal to 0.1 and β equaling 3.2.
In silico analysis of ADMET properties
The absorption, distribution, metabolism, excretion, and toxicity (ADMET) properties of the potential inhibitors were predicted in silico using the admetSAR server (http://metlmmd.ecust.edu.cn:8000/predict/).23
Molecular dynamics simulation
Binding stabilities of these potential α-enolase inhibitors are further evaluated by molecular dynamics simulation using NAMD and QwikMD.24,25 The structure of the ligand–enzyme complex with ligand in the best docking pose was simulated with CHARMM general force field for protein (https://www.charmm.org/charmm/)26 and the SwissParam-generated ligand force field (http://www.swissparam.ch/).27 The simulation was done at a salt concentration of 0.15 M and under an implicit solvent model. The simulation is started with an equilibration simulation from 60 K to 300 K for 1.242 ns, and continued with a production simulation for 50 ns at constant temperature of 300 K. The simulation results were saved at a frequency of 2 fs. The MD trajectory generated in the production simulation was used to calculate the root mean-square deviation (RMSD) of the protein backbone, and the nonbond interaction energy between the ligand and protein using the VMD1.9.3 toolkit.28 In RMSD analysis, frame 0 is set as the reference frame, and the structure of each frame is aligned to that of frame 0 to measure actual structural fluctuations during simulation.
Results
Construction of an α-enolase structure model for virtual screening
The only human α-enolase structure (PDB ID: 2PSN) in the RCSB protein data bank is an apoenzyme, without being substrate soaked. To check the difference between the catalytic pocket of 2PSN and an enolase structure co-crystallized with substrate, the chain A structure of the 2PSN was compared with the structure of the human neuron-specific enolase (γ-enolase), which contains 2-PGA and magnesium in the structure, using the UCSF Chimera implanted Matchmaker program.29 Although the two human enolases only share 84% identity and 92% similarity, the RMSD of the superimposed polypeptide backbones, and the five catalytic amino acids between the α-enolase and three γ-enolase structures ranged from 0.415 to 0.448 Å and from 0.242 to 0.538 Å, respectively. This result indicates the two human enolases not only share a high level of conservation in protein structure, but also have a rigid architecture of catalytic pocket even in the substrate-vacant state. To make the catalytic pocket of 2PSN better resemble the conformation in the catalytic process, the chain A structure of the 2PSN was fine-tuned against the three γ-enolase structures by the homology-based comparative modeling program, Modeller.30 The normalized DOPE scores (zDOPE) of the generated models ranged from −1.75 to −1.93. The model with the lowest zDOPE score, which has the lowest free energy and is in the most native-like state, was chosen for the subsequent virtual screening. Compared to the original 2PSN structure, the structure with the lowest zDOPE score has smaller RMSD value to the three γ-enolase structures, ranging from 0.204 to 0.243 Å for the polypeptide backbone and 0.183 to 0.494 Å for the five catalytic amino acids. The structure superposition of the original and the Modeller-rebuilt α-enolase structure as well as the γ-enolase structure (3UCC) are illustrated in Figure 1.
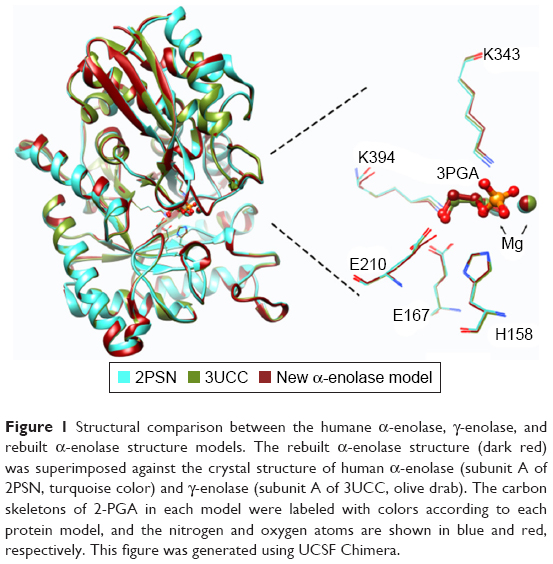 | Figure 1 Structural comparison between the humane α-enolase, γ-enolase, and rebuilt α-enolase structure models. The rebuilt α-enolase structure (dark red) was superimposed against the crystal structure of human α-enolase (subunit A of 2PSN, turquoise color) and γ-enolase (subunit A of 3UCC, olive drab). The carbon skeletons of 2-PGA in each model were labeled with colors according to each protein model, and the nitrogen and oxygen atoms are shown in blue and red, respectively. This figure was generated using UCSF Chimera. |
Virtual screening using molecular docking
A total of 22,326,149 chemical structures meet the criteria of modified Lipinsiki’s rule of five from the All Clean subset of the ZINC database, and the approved drug data set were used in the virtual screening. Due to the upper limit of the input number for each run (1 million/run) and to search the molecular-weight hot zone of high score hits, a crude and rapid screening was undertaken within each 100-Da interval, using chemical structures randomly selected by the program until the number reached 1 million. Following the rapid survey, it was found that the molecular weight of the hits with the idock score less than −5 kcal/mol were less than 300 Da. Based on this observation, a complete and comprehensive docking screening was carried out within the range between 55 and 300 Da. At the end of screening, 87 chemical structures were found having idock scores less than −6.5 kcal/mol, including 24 with scores less than −7 kcal/mol. Among the 87 chemical structures, four pairs are in different tautomric or ionization states of the same compounds. ZINC12428227/ZINC06523895, ZINC12428226/ZINC05567035, and ZINC32599190/ZINC05282317 are three pairs that belong to this category among the top 24 hits with scores less than −7 kcal/mol. The structures of many compounds with idock scores less than −7 kcal/mol contain five-member ring structures, such as oxadiazole, trizaole, and isoxazole (Figure 2). Glycerol 3-phosphate and malic acid are the only two compounds from the approved drug data set and their idock scores are −6.63 and −6.59 kcal/mol, respectively. The idock scores for the α-enolase substrate, 2-PGA and PEP, are −7.09 and −6.63 kcal/mol respectively, and that of the four known α-enolase inhibitors, AEP, TSP, PhAH, and SF-2312, are −8.01, −7.01, −7.06, and −8.63 kcal/mol, respectively. Although, the idock scores for the four known enolase inhibitors do not correlate well with the previously reported inhibitory potency, the Ki value, their high ranking orders and a low RMSD value (1.246 Å) between the 2-PGA conformations in the modeled crystal structure and the docking pose indicate the screening results are reliable and promising for further evaluation.
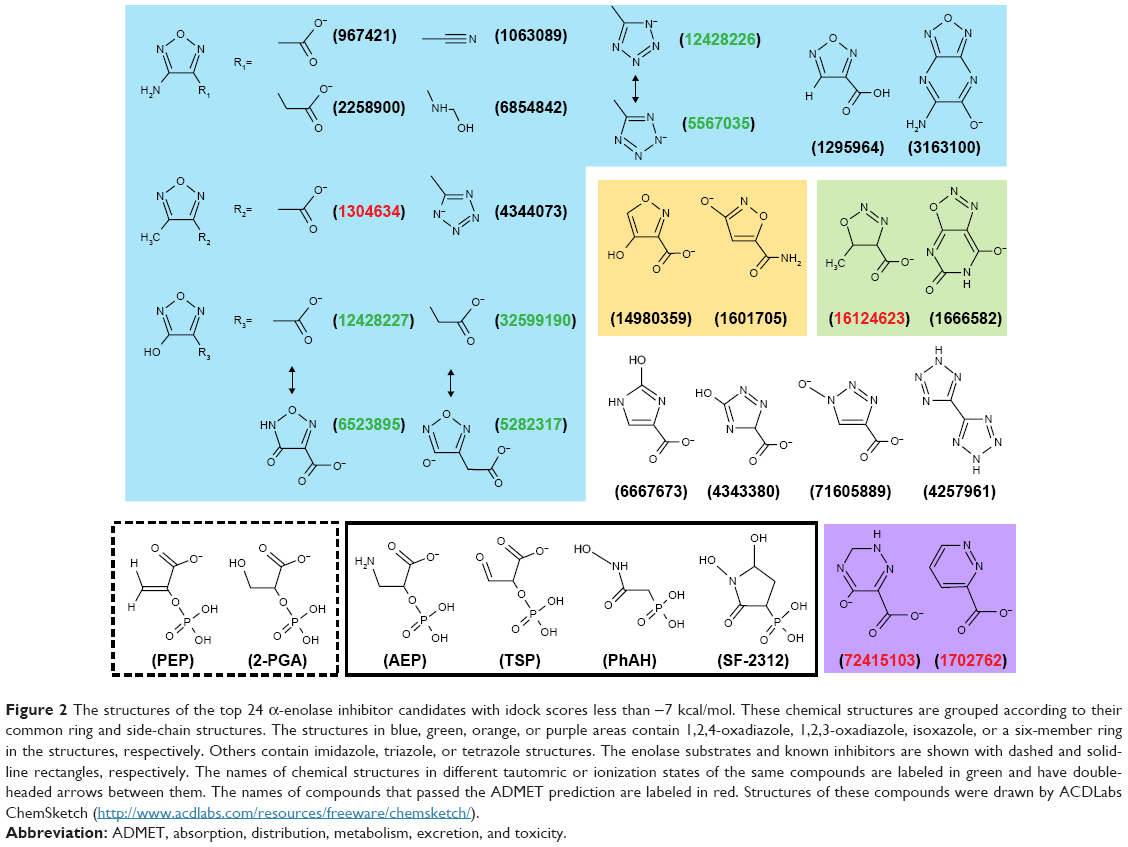 | Figure 2 The structures of the top 24 α-enolase inhibitor candidates with idock scores less than −7 kcal/mol. These chemical structures are grouped according to their common ring and side-chain structures. The structures in blue, green, orange, or purple areas contain 1,2,4-oxadiazole, 1,2,3-oxadiazole, isoxazole, or a six-member ring in the structures, respectively. Others contain imidazole, triazole, or tetrazole structures. The enolase substrates and known inhibitors are shown with dashed and solid-line rectangles, respectively. The names of chemical structures in different tautomric or ionization states of the same compounds are labeled in green and have double-headed arrows between them. The names of compounds that passed the ADMET prediction are labeled in red. Structures of these compounds were drawn by ACDLabs ChemSketch (http://www.acdlabs.com/resources/freeware/chemsketch/). |
Enzyme/inhibitor contact fingerprint analysis
To further analyze these candidates, the 87 selected chemical structures are further classified according to their contact fingerprints to α-enolase using the AuPosSOM 2.1, which calculates the strengths and interaction modes of the contact – functional moieties between the ligand and protein (Figure 3). Two enolase substrates, 2-PGA and PEP, and four known α-enolase inhibitors, AEP, TSP, PhAH, and SF-2312, were included in the analysis as the internal control of contact references to differentiate the contact modes. It can be found that all the candidates share similar binding modes with α-enolase, but with different extents of interactions to the amino acids involved in the catalytic process. Group 0, which includes 2-PGA and known α-enolase inhibitors, has the most intense and strongest interactions. More detail about contact modes between 2-PGA, AEP, PhAH, SF-2312, and chemical structures with the lowest docking scores of each contact group and α-enolase are illustrated in Figure S1. Since these chemical structures show strong interactions with amino acid residues involved in the α-enolase catalytic process, chemical structures with idock scores approximately equal to or less than that of 2-PGA are retained for downstream evaluation.
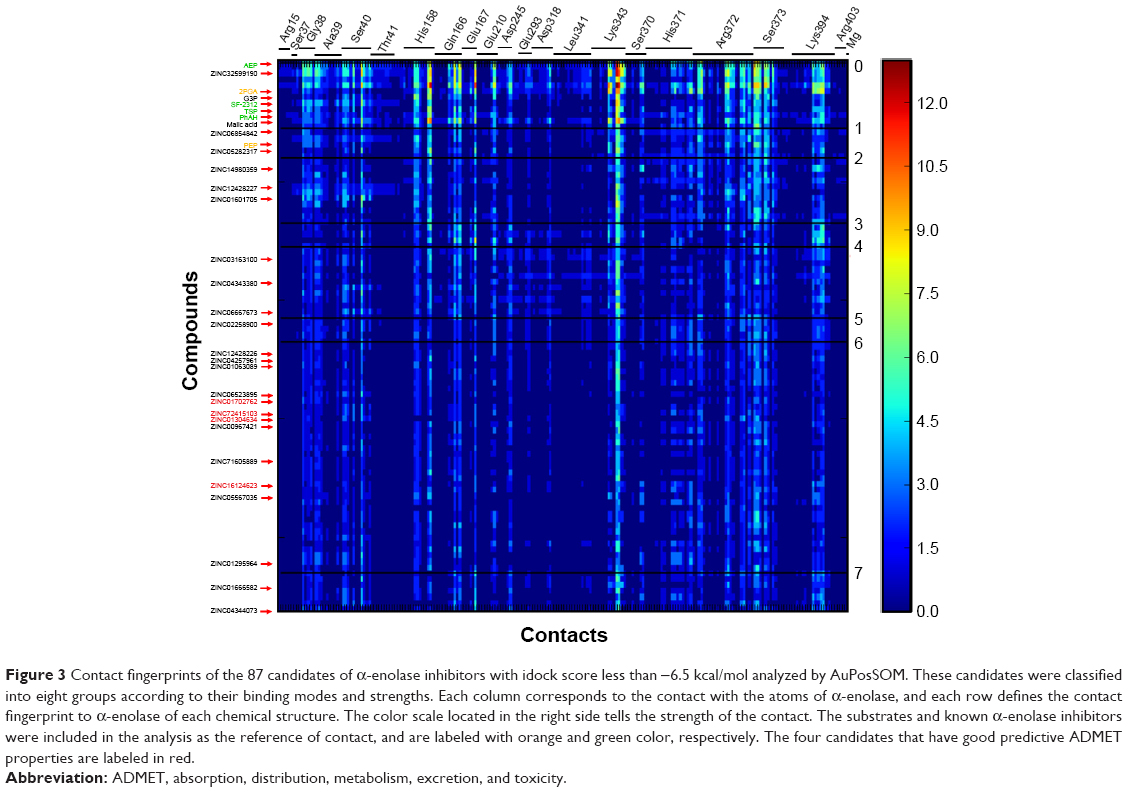 | Figure 3 Contact fingerprints of the 87 candidates of α-enolase inhibitors with idock score less than −6.5 kcal/mol analyzed by AuPosSOM. These candidates were classified into eight groups according to their binding modes and strengths. Each column corresponds to the contact with the atoms of α-enolase, and each row defines the contact fingerprint to α-enolase of each chemical structure. The color scale located in the right side tells the strength of the contact. The substrates and known α-enolase inhibitors were included in the analysis as the reference of contact, and are labeled with orange and green color, respectively. The four candidates that have good predictive ADMET properties are labeled in red. |
Prediction of ADMET properties
To eliminate compounds with unfavorable properties, which could potentially make experimental animals suffer in downstream preclinical tests or lead to early termination of clinical trial, the top 24 hits with idock score less than −7 kcal/mol were further evaluated for their ADMET properties, predicted by the admetSAR web server. (Table S1). In the absorption property analysis, all 24 hits are predicted to have good absorption by the intestine (HIA+, if HIA ≥30%), but only 10 of them are Caco-2+ (Papp ≥8×10⁻⁶ cm/s), which suggests that compounds with good absorption by the gastrointestinal tract after oral uptake are retained for downstream analysis. After entering the circulation, distribution should occur uniformly to every tissue and organ to ensure better treatment efficiency. In the distribution property analysis, the 10 chemical structures are predicted to have good ability to penetrate the blood–brain barrier (BBB+), which is important when the lesion is within the brain. Moreover, their good distribution is supported as they are predicted as non-substrates or non-inhibitors of P-glycoprotein (ABCB1) and renal organic cationic transporter (OCT2/SLC22A2), which facilitate efflux of xenobiotics from the cells. After entering the cells, keeping a drug at a sustainable level would ensure better target inhibition. Xenobiotic compounds entering cells are generally metabolized by cytochrome P450 enzymes (CYP450), which determine the concentration of the drug within cells. The analysis shows that the 10 chosen chemical structures are either non-substrates or non-inhibitors of CYP2D6, CYP2C9, CYP2C19, and CYP3A4, and seven of these are even predicted as CYP1A2 inhibitors. These results indicate that these candidates could be metabolized slowly and are able to stay within cells long enough to inhibit α-enolase activity. To ensure the safety and avoid potential adverse effects after intake, the toxicity profiles of the 10 candidates are calculated from five different models. All of these chemical structures are predicted to be noncarcinogenic (Carc_I model),31 without cardiotoxicity (hERG model I and II),32,33 and with low acute oral toxicity (class III, LD50 value between 500 and 5,000 mg/kg). Unfortunately, three of them are classified as dangerous (TD50 ≤10 mg/kg/day) and one falls within the warning category (TD50 >10 mg/kg/day) based on the Carcinogenicity test model (Carc3_I model). Six of them are predicted to be mutagens based on the AMES test model.34 These unfavorable candidates are eliminated from the candidate list. At the end of the entire ADMET evaluation screening, four compounds, ZINC1304634, ZINC16124623, ZINC1702762, and ZINC72415103, passed the test and were elected for subsequent evaluation.
Molecular dynamics simulation
To evaluate the stabilities of α-enolase–ligand complexes under dynamic conditions, we conducted a molecular dynamics simulation using a protocol described in material and methods. The stability of the complex was determined by the RMSD of protein backbone using the 50 ns trajectory data and compared with the four known α-enolase inhibitors. All of these compounds finished the 50 ns simulation, except TSP, which was dislodged from the docked site of the α-enolase catalytic pocket at 7 ns (data not shown). This result probably echoes the inhibitory potency of the weak α-enolase inhibitor. Values of the protein backbone RMSD of AEP, PhAH, SF-2312, and the four candidates of the α-enolase inhibitors enzyme complex are shown in Figure 4A together with the average backbone RMSD values range from 2.24 Å to 2.96 Å, in which ZINC1304634- and AEP- enzyme complex delineate the lower and upper limits, respectively. This result indicates the four candidates of the α-enolase inhibitor bind to the α-enolase and induce structural fluctuations comparable to that of three known enolase inhibitors. To better compare the binding stabilities of these compounds to α-enolase, the nonbond interaction energies composed of electrostatics and Van der Waals forces between each inhibitor and α-enolase were calculated. Interaction energies between these compounds and α-enolase are contributed mostly by electrostatics interactions (data not shown), and the average nonbond energies between α-enolase and AEP, PhAH, and SF-2312 are −126.84, −183.62, and −73.90 kcal/mol, respectively. The four candidates, ZINC1304634, ZINC16124623, ZINC1702762, and ZINC72415103, have comparable nonbond energies to that of the AEP, PhAH, and SF-2312, and have values of −118.22, −168.36, −112.10, and −264.83 kcal/mol, respectively (Figure 4B). This result indicates the four compounds are promising candidates for downstream in vitro testing.
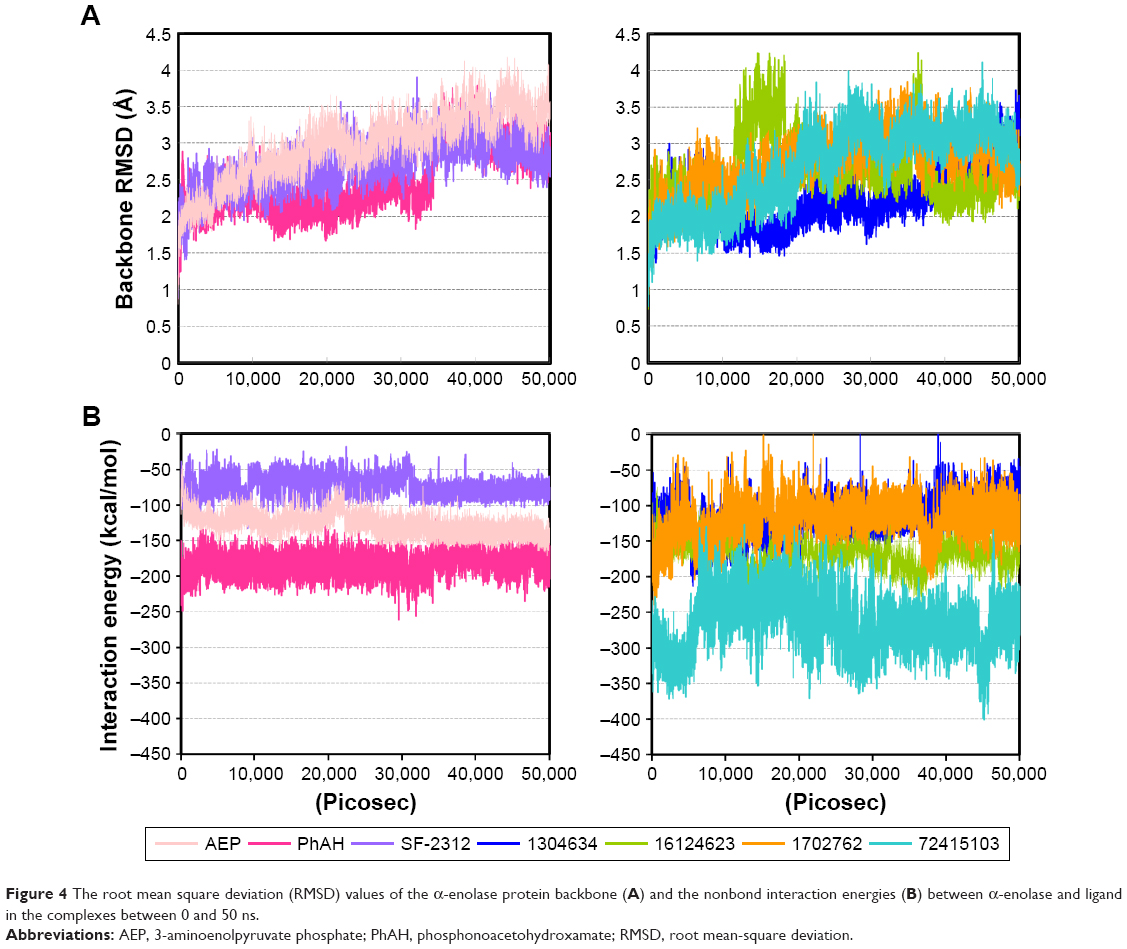 | Figure 4 The root mean square deviation (RMSD) values of the α-enolase protein backbone (A) and the nonbond interaction energies (B) between α-enolase and ligand in the complexes between 0 and 50 ns. |
Cross-inhibition prediction
Reducing the occurrence of off-target interactions is important to manipulate the target enzyme activity precisely and reduce side effects. To evaluate the specificity of the four candidates of the α-enolase inhibitor, they are docked to the catalytic pockets of the other two enolase isoforms, β-enolase (PDB ID:2XSX, subunit A) and γ-enolase (PDB ID:3UCC, subunit A), using idock. The grid boxes for the β-enolase and γ-enolase structures were cloned from the α-enolase docking work by superimposing the protein structures and transforming the grid box center and dimensions of the α-enolase structure into those of β-enolase and γ-enolase, respectively. The docking results are shown in Table 1. It can be found that the idock values for the 2-PGA are smaller than PEP for each of the three enolase isoforms. This result may partially reflect the preferential favoring of the forward reaction for all enolase isoforms. Despite the fact that catalytic pockets of the enolase isoforms are almost identical, they seem to respond differently to the known enolase inhibitors due to β-enolase having the highest idock scores for two known α-enolase inhibitors. This result would imply that finding an isoform-specific enolase inhibitor is possible, because the score of PhAH for β-enolase is comparably higher than that of α- and γ-enolase. On the other hand, the possibility of a pan-enolase inhibitor can also be envisaged from the result of the recently discovered enolase inhibitory antibiotic, SF-2312, which has the lowest idock scores for the three enolase isoforms. The four candidates of α-enolase inhibitors show some degree of selectivity as the idock scores of these candidates for α- and γ-enolase are comparably lower than β-enolase, but the cross-inhibition to other enolase isoforms is expected.
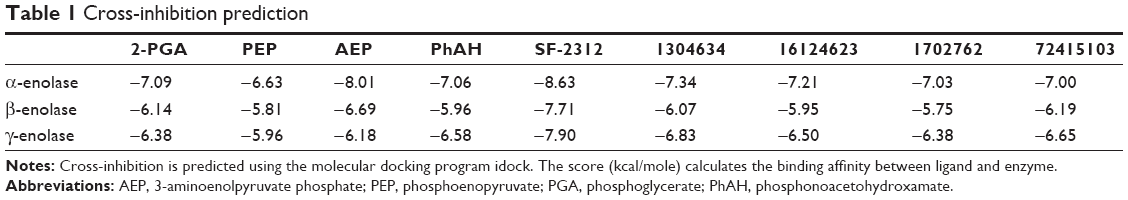 | Table 1 Cross-inhibition prediction |
Conclusion
In silico drug screening from the commercially available molecular entities provides a feasible and promising route for researchers to solve health problems by ameliorating reliance on structure creation by synthesis. The current study harnesses computer-based virtual screening to identify inhibitors of human α-enolase, which are needed for cancer treatment. From more than 22 million chemical structures, and through a series of rational refinement steps, including contact fingerprint, ADMET properties and MD simulation, we identified four compounds, ZINC1304634, ZINC16124623, ZINC1702762, and ZINC72415103, as good candidates for further testing. It is hoped further optimizations of these compounds would eventually lead to an effective α-enolase inhibitor for clinical use. The entire workflow to identify the human α-enolase inhibitors in this work could also become a template for other researchers to discover inhibitors of their targets.
Acknowledgments
This study was supported under grant no: MOST 104-2314-B-182A-150 from the National Science Council of Republic of China, and CORPG6F0021 and CMRPG6F0471 from the Chang Gung Memorial Hospital, Chiayi. We would also like to thank MS Yuan Yuan, Jiang and MS Shao-Lan, Huang for editing and formatting of the manuscript.
Disclosure
The authors report no conflicts of interest in this work.
References
Vander Heiden MG, Cantley LC, Thompson CB. Understanding the Warburg effect: the metabolic requirements of cell proliferation. Science. 2009;324(5930):1029–1033. | ||
Chen CT, Hung MC. Beyond anti-VEGF: dual-targeting antiangiogenic and antiproliferative therapy. Am J Transl Res. 2013;5(4):393–403. | ||
Ribatti D. Tumor refractoriness to anti-VEGF therapy. Oncotarget. 2016;7(29):46668–46677. | ||
Altenberg B, Greulich KO. Genes of glycolysis are ubiquitously overexpressed in 24 cancer classes. Genomics. 2004;84(6):1014–1020. | ||
Chen ZT, Liang ZG, Zhu XD. A Review: proteomics in nasopharyngeal carcinoma. Int J Mol Sci. 2015;16(7):15497–15530. | ||
Chang GC, Liu KJ, Hsieh CL, et al. Identification of alpha-enolase as an autoantigen in lung cancer: its overexpression is associated with clinical outcomes. Clin Cancer Res. 2006;12(19):5746–5754. | ||
Hennipman A, van Oirschot BA, Smits J, Rijksen G, Staal GE. Glycolytic enzyme activities in breast cancer metastases. Tumour Biol. 1988;9(5):241–248. | ||
Jiang W, Li X, Rao S, et al. Constructing disease-specific gene networks using pair-wise relevance metric: application to colon cancer identifies interleukin 8, desmin and enolase 1 as the central elements. BMC Syst Biol. 2008;2:72. | ||
Gerbitz KD, Summer J, Schumacher I, Arnold H, Kraft A, Mross K. Enolase isoenzymes as tumour markers. J Clin Chem Clin Biochem. 1986;24(12):1009–1016. | ||
Lung J, Liu KJ, Chang JY, Leu SJ, Shih NY. MBP-1 is efficiently encoded by an alternative transcript of the ENO1 gene but post-translationally regulated by proteasome-dependent protein turnover. FEBS J. 2010;277(20):4308–4321. | ||
Díaz-Ramos A, Roig-Borrellas A, García-Melero A, Lopez-Alemany R. α-Enolase, a multifunctional protein: its role on pathophysiological situations. J Biomed Biotechnol. 2012;2012:156795. | ||
Spring TG, Wold F. Two high-affinity enolase inhibitors. Reaction with enolases. Biochemistry. 1971;10(25):4655–4660. | ||
Anderson VE, Weiss PM, Cleland WW. Reaction intermediate analogs for enolase. Biochemistry. 1984;23(12):2779–2786. | ||
Leonard PG, Satani N, Maxwell D, et al. SF2312 is a natural phosphonate inhibitor of enolase. Nat Chem Biol. 2016;12(12):1053–1058. | ||
Satani N, Lin YH, Hammoudi N, Raghavan S, Georgiou DK, Muller FL. ENOblock does not inhibit the activity of the glycolytic enzyme enolase. PLoS One. 2016;11(12):e0168739. | ||
Eswar N, Eramian D, Webb B, Shen MY, Sali A. Protein structure modeling with MODELLER. Methods Mol Biol. 2008;426:145–159. | ||
Ghose AK, Viswanadhan VN, Wendoloski JJ. A knowledge-based approach in designing combinatorial or medicinal chemistry libraries for drug discovery. 1. A qualitative and quantitative characterization of known drug databases. J Comb Chem. 1999;1(1):55–68. | ||
Lipinski CA. Lead- and drug-like compounds: the rule-of-five revolution. Drug Discov Today Technol. 2004;1(4):337–341. | ||
Li H, Leung KS, Wong MH. idock: A multithreaded virtual screening tool for flexible ligand docking. Paper presented at: 2012 IEEE Symposium on Computational Intelligence in Bioinformatics and Computational Biology (CIBCB); Accessed May 9–12, 2012. | ||
Trott O, Olson AJ. AutoDock Vina: improving the speed and accuracy of docking with a new scoring function, efficient optimization, and multithreading. J Comput Chem. 2010;31(2):455–461. | ||
Bouvier G, Evrard-Todeschi N, Girault JP, Bertho G. Automatic clustering of docking poses in virtual screening process using self-organizing map. Bioinformatics. 2010;26(1):53–60. | ||
Mantsyzov AB, Bouvier G, Evrard-Todeschi N, Bertho G. Contact-based ligand-clustering approach for the identification of active compounds in virtual screening. Adv Appl Bioinform Chem. 2012;5:61–79. | ||
Cheng F, Li W, Zhou Y, et al. admetSAR: a comprehensive source and free tool for assessment of chemical ADMET properties. J Chem Inf Model. 2012;52(11):3099–3105. | ||
Phillips JC, Braun R, Wang W, et al. Scalable molecular dynamics with NAMD. J Comput Chem. 2005;26(16):1781–1802. | ||
Ribeiro JV, Bernardi RC, Rudack T, et al. QwikMD – integrative molecular dynamics toolkit for novices and experts. Sci Rep. 2016;6:26536. | ||
Soteras Gutiérrez I, Lin FY, Vanommeslaeghe K, et al. Parametrization of halogen bonds in the CHARMM general force field: improved treatment of ligand-protein interactions. Bioorg Med Chem. 2016;24(20):4812–4825. | ||
Zoete V, Cuendet MA, Grosdidier A, Michielin O. SwissParam: a fast force field generation tool for small organic molecules. J Comput Chem. 2011;32(11):2359–2368. | ||
Humphrey W, Dalke A, Schulten K. VMD: visual molecular dynamics. J Mol Graph. 1996;14(1):33–38, 27–38. | ||
Pettersen EF, Goddard TD, Huang CC, et al. UCSF Chimera – a visualization system for exploratory research and analysis. J Comput Chem. 2004;25(13):1605–1612. | ||
Sánchez R, Sali A. Comparative protein structure modeling. Introduction and practical examples with modeller. Methods Mol Biol. 2000;143:97–129. | ||
Lagunin A, Filimonov D, Zakharov A, et al. Computer-aided prediction of rodent carcinogenicity by PASS and CISOC-PSCT. QSAR Comb Sci. 2009;28(8):806–810. | ||
Marchese Robinson RL, Glen RC, Mitchell JB. Development and comparison of hERG blocker classifiers: assessment on different datasets yields markedly different results. Mol Inform. 2011;30(5):443–458. | ||
Wang S, Li Y, Wang J, et al. ADMET evaluation in drug discovery. 12. Development of binary classification models for prediction of hERG potassium channel blockage. Mol Pharm. 2012;9(4):996–1010. | ||
Hansen K, Mika S, Schroeter T, et al. Benchmark data set for in silico prediction of Ames mutagenicity. J Chem Inf Model. 2009;49(9):2077–2081. |
Supplementary materials
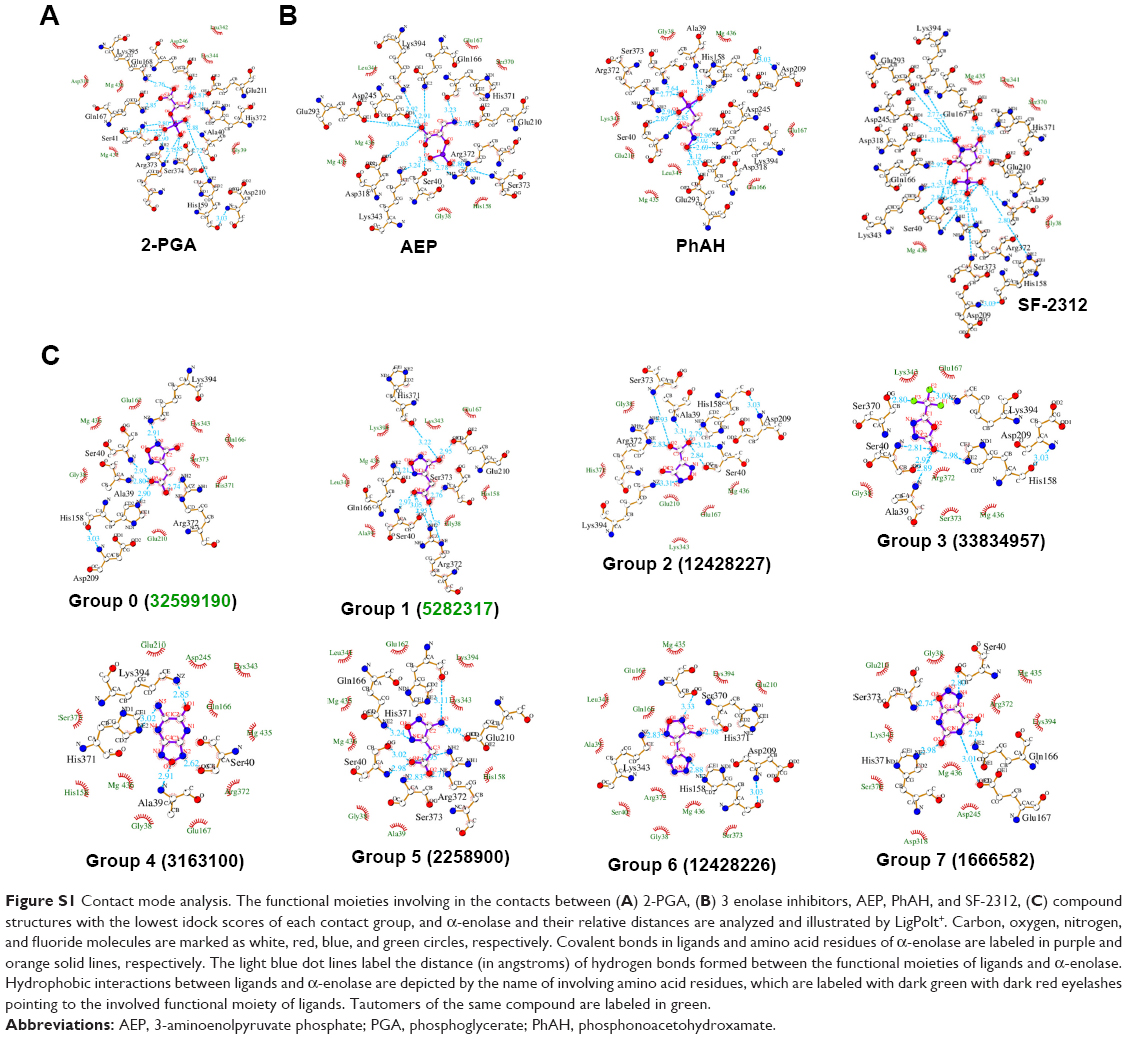 | Figure S1 Contact mode analysis. The functional moieties involving in the contacts between (A) 2-PGA, (B) 3 enolase inhibitors, AEP, PhAH, and SF-2312, (C) compound structures with the lowest idock scores of each contact group, and α-enolase and their relative distances are analyzed and illustrated by LigPolt+. Carbon, oxygen, nitrogen, and fluoride molecules are marked as white, red, blue, and green circles, respectively. Covalent bonds in ligands and amino acid residues of α-enolase are labeled in purple and orange solid lines, respectively. The light blue dot lines label the distance (in angstroms) of hydrogen bonds formed between the functional moieties of ligands and α-enolase. Hydrophobic interactions between ligands and α-enolase are depicted by the name of involving amino acid residues, which are labeled with dark green with dark red eyelashes pointing to the involved functional moiety of ligands. Tautomers of the same compound are labeled in green. |
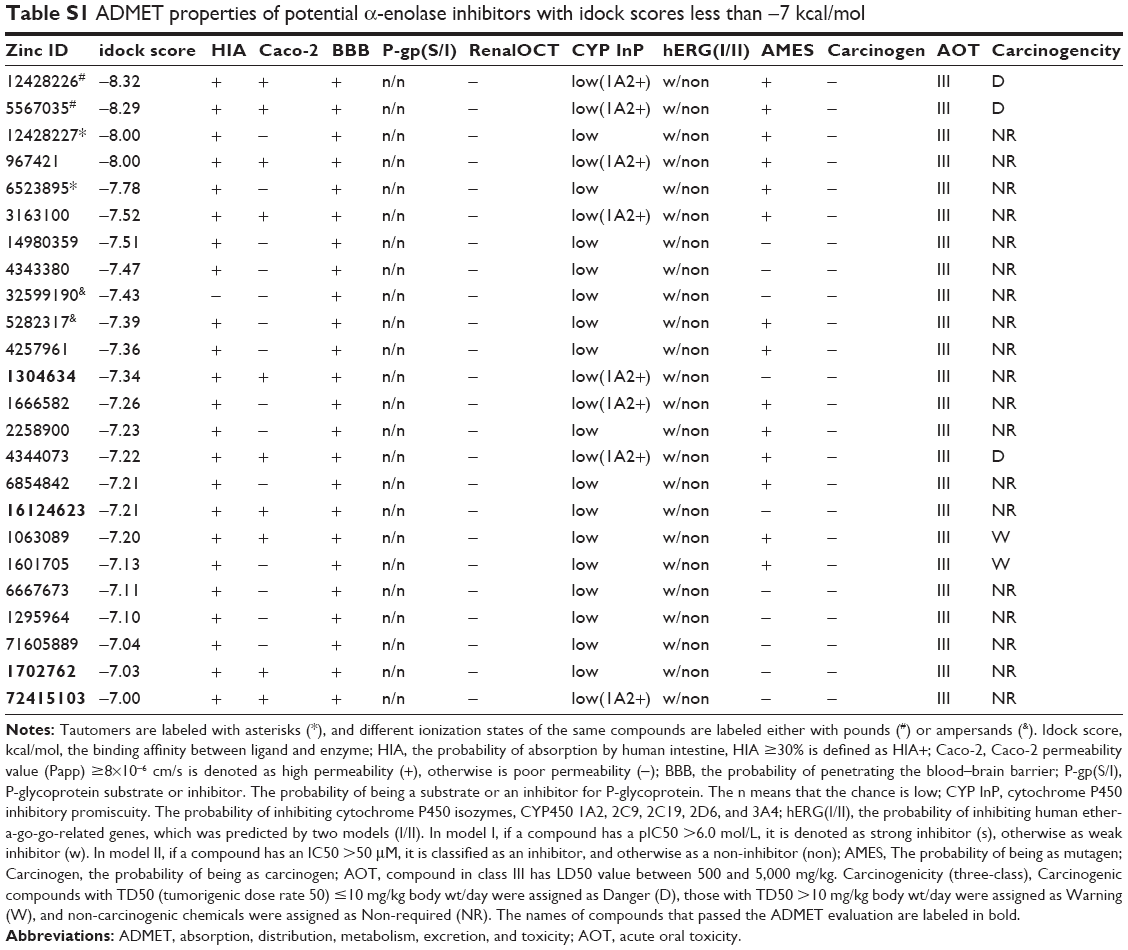 | Table S1 ADMET properties of potential α-enolase inhibitors with idock scores less than −7 kcal/mol |
 © 2017 The Author(s). This work is published and licensed by Dove Medical Press Limited. The full terms of this license are available at https://www.dovepress.com/terms.php and incorporate the Creative Commons Attribution - Non Commercial (unported, v3.0) License.
By accessing the work you hereby accept the Terms. Non-commercial uses of the work are permitted without any further permission from Dove Medical Press Limited, provided the work is properly attributed. For permission for commercial use of this work, please see paragraphs 4.2 and 5 of our Terms.
© 2017 The Author(s). This work is published and licensed by Dove Medical Press Limited. The full terms of this license are available at https://www.dovepress.com/terms.php and incorporate the Creative Commons Attribution - Non Commercial (unported, v3.0) License.
By accessing the work you hereby accept the Terms. Non-commercial uses of the work are permitted without any further permission from Dove Medical Press Limited, provided the work is properly attributed. For permission for commercial use of this work, please see paragraphs 4.2 and 5 of our Terms.