")
Back to Journals » Drug Design, Development and Therapy » Volume 12
Immediate release tablet formulation of varenicline salicylate and comparative pharmacokinetic study in human volunteers
Authors Kwak SS, Lee ES, Yoon HY , Kim CH, Goo YT, Kang MJ, Lee S, Lee BS, Jeon HR, Oh CH, Choi YW
Received 27 June 2018
Accepted for publication 22 August 2018
Published 9 October 2018 Volume 2018:12 Pages 3377—3392
DOI https://doi.org/10.2147/DDDT.S178456
Checked for plagiarism Yes
Review by Single anonymous peer review
Peer reviewer comments 2
Editor who approved publication: Dr Sukesh Voruganti
Seong Shin Kwak,1,* Eun Seok Lee,1,* Ho Yub Yoon,1 Chang Hyun Kim,1 Yoon Tae Goo,1 Myung Joo Kang,2 Sangkil Lee,3 Bong Sang Lee,4 Hong Ryeol Jeon,4 Chang Hyun Oh,5 Young Wook Choi1
1College of Pharmacy, Chung-Ang University, Heuksuk-ro, Dongjak-gu, Seoul 06974, Republic of Korea; 2College of Pharmacy, Dankook University, Dandae-ro, Dongnam-gu, CheonanChungnam 31116, Republic of Korea; 3College of Pharmacy, Keimyung University, Dalgubeol-daero, Daegu 42601, Republic of Korea; 4CTCBIO INC., Hyundaikia-ro, Paltan, Hwaseong, Gyeonggi 18576, Republic of Korea; 5Center for Biomaterials, Korea Institute of Science & Technology (KIST), Hwarang-ro, Seongbuk-gu, Seoul 02792, Republic of Korea
*These authors contributed equally to this work
Purpose: To develop an immediate release-type tablet containing varenicline salicylate (VRC-S), a smoking cessation agent, formulation and stability studies were performed. The in vitro dissolution and in vivo pharmacokinetic (PK) behavior of the tablets were compared with those of the commercial product (Champix) as a reference.
Materials and methods: The characteristics of the powder were investigated by particle morphology, size distribution, solubility, hygroscopicity, differential scanning calorimetry, and powder X-ray diffraction. Based on the drug–excipient compatibility test, different VRC-S tablets were prepared with the selected excipients through direct compression or wet granulation method and subjected to a dissolution test. The stability of the most promising VRC-S tablet (F4) was evaluated under accelerated conditions (40°C and 75% relative humidity). Further, the dissolution and human pharmacokinetic profiles of the F4 tablet and Champix were compared.
Results: VRC-S showed a positively skewed unimodal size distribution with a specific surface area of 2.02 m2/g, single endothermic peak of 225.2°C in differential scanning calorimetry, crystalline internal structure in powder X-ray diffraction, aqueous solubility of 244.7 mg/mL, and hygroscopicity of 0.256 mg/g. The wet granulation method was preferred for tablet preparation and employed the following excipients: microcrystalline cellulose and anhydrous dibasic calcium phosphate as diluents, croscarmellose sodium as a disintegrant, and colloidal silicon dioxide and magnesium stearate as lubricants. The F4 tablet was stable for 6 months under accelerated conditions. The dissolution of VRC was pH independent, revealing f2 values of 76.49 and 68.38 at pH 1.2 and pH 6.8, respectively. After the oral administration of F4 tablet and Champix to healthy human volunteers, pharmacokinetic parameters, including time to reach the maximum plasma concentration (Tmax), maximum plasma concentration (Cmax), and area under the curve from 0 to infinity (AUCinf), were compared. The values of 90% CI were 0.972–1.035 for Cmax and 0.982–1.075 for AUCinf, which was indicative of the bioequivalence of both products.
Conclusion: VRC-S–containing F4 tablet might be a good candidate for smoking cessation treatment.
Keywords: varenicline salicylate, smoking cessation, formulation, stability, dissolution, bioavailability
Introduction
Varenicline (VRC), a potent and selective partial agonist for α4β2 nicotinic acetylcholine receptors, has been used for smoking cessation treatment.1 It was shown to modify the dependence-related behavioral effects of nicotine.2 As nicotine is readily available in the form of cigarettes, most smokers repeatedly fail to quit despite the serious health consequences of tobacco-related illnesses such as cancer, respiratory and cardiovascular diseases.3–5 As tobacco dependence is a chronic disorder that is difficult to treat, novel pharmacotherapies, such as nicotine replacement therapy and bupropion sustained release treatment, have been introduced to improve long-term abstinence outcomes.2,6 In 2006, as an aid to smoking cessation, Pfizer introduced a commercial product under the brand name of Champix (or Chantix), which contains VRC tartrate 1.71 mg (equivalent to 1 mg VRC).
Salt formation offers a means of altering the physicochemical and resultant biological characteristics of a drug molecule without changing the structure of the pharmacologically active moiety. However, the selection of a proper salt form that exhibits the desired properties, such as solubility, dissolution rate, supersaturation, drug absorption, and bioavailability, plays a major role in drug design and development. Numerous salt forms of VRC have been invented by the addition of diverse organic acids. Succinate salts are only slightly hygroscopic and have high aqueous solubility; specifically, anhydrous succinate salts exhibit excellent solid state stability to light, elevated temperatures, and high humidity.7 Citrate salts exist as either Form A (hydrate), with a water content of between 1% and 5% by weight in the crystal, or Form B (anhydrous), with no water or <1% water content.8 Tartrate salts include L-tartrate, D-tartrate, D,L-tartrate, and meso-tartrate salts; specifically, L-tartrate salts exist in three possible forms, that is, Form A is the anhydrous kinetic polymorph, which is converted under the appropriate conditions to the thermodynamically favored Form B, and Form C is a monohydrate and relatively stable under ambient conditions.9 The thermodynamic stability of the VRC tartrate crystals was extensively studied by utilizing the eutectic-melting method, which provided a better understanding of the stability of the crystal form as it was directly related to the manufacturing and storage conditions of the drug product.10 Unfortunately, the majority of these acid addition salts of VRC still have the problem of hygroscopicity and/or inherent instability. VRC salicylate (VRC-S) was recently patented; the patent describes the improved properties of VRC-S compared with those of VRC tartrate (VRC-T) with respect to hygroscopicity and stability of storage in temperature and humidity.11 However, in our preliminary study, VRC-S exhibited poor flow, which should be overcome for a solid dosage formulation.
In the process of tablet development, the characteristics of bulk powders, including crystal morphology and flowability, are of great importance. Crystal morphology or habit can influence the flowability of the powder mass; powder flow properties, compaction, and stability are all reported to be dependent on crystal morphology.12 The compaction and flow properties of powders deteriorate as the shape of particles becomes more irregular; in addition, the porosity of the powder bed decreases as the sphericity increases.13 The compression property of needle-shaped paracetamol crystals was more similar to an elastic body with poorer compressibility, which resulted in a greater incidence of capping and lamination than that of plate- or cube-shaped crystals.14 Crystal habits of needles and flakes are notoriously difficult to handle in powder form or formulate, and the particle size distribution may determine the rate of drug absorption when the process is limited by the dissolution rate.15
In this study, immediate release-type tablet preparations containing VRC-S as an active pharmaceutical ingredient were formulated. The powder characteristics of VRC, VRC-T, and VRC-S were investigated through the analysis of particle morphology, size distribution, solubility, hygroscopicity, differential scanning calorimetry (DSC), and powder X-ray diffraction (PXRD). Based on the drug–excipient compatibility test, different VRC-S tablets were prepared with the selected excipients via direct compression or wet granulation methods and subjected to a dissolution test. The stability of the most promising VRC-S tablet was evaluated under accelerated conditions. Further, in vitro dissolution and in vivo human pharmacokinetic (PK) profiles were compared between the selected tablet formulation and Champix, a reference commercial product.
Materials and methods
Materials
VRC and VRC-T were kindly supplied by Korea Institute of Science and Technology (Seoul, Korea). VRC-S was purchased from Hanseo Chem (Pyeongtaek-si, Korea). Microcrystalline cellulose (MCC) and croscarmellose sodium were purchased from JRS Pharma (Weissenbern, Germany). Anhydrous dibasic calcium phosphate was purchased from Innophos (Chicago, IL, USA). Colloidal silicon dioxide was purchased from Evonik (Rheinfelden, Germany). Magnesium stearate was purchased from FACI (Jurong Island, Singapore). All other excipients used in the manufacture of tablets were of standard pharmaceutical grade and all other reagents used were of analytical grade. Commercially available Champix tablets (Lot No 00003058; Pfizer) were used as the reference product.
Powder characterization
Shape and particle size distribution examination
The shape and surface morphology of the VRC, VRC-T, and VRC-S powders were examined using scanning electron microscope (SEM; Sigma 300; Carl Zeiss Meditec AG, Jena, Germany). The powders were fixed on to a brass specimen club using double-sided adhesive tape and made electrically conductive by coating in a vacuum (6 Pa) with platinum (6 nm/min) using a Hitachi ion sputter (E-1030) for 100 seconds at 4 mA. The crystal form of the VRC-S was observed. The particle size distribution of each sample was measured using a laser diffraction particle size analyzer (Mastersizer 2000; Malvern Instruments, Malvern, UK) equipped with a dry sampling system (Scirocco 2000; Malvern Instruments). The analysis was conducted at a feed rate of 20% and an air pressure of 4 bars and measured in triplicate.
Solubility and hygroscopicity measurements
The solubility of VRC and its salts in water was determined using the equilibrium method.16 Briefly, an excess amount of sample was added to 1 mL of water. Test tubes containing the mixtures were sealed and kept in ambient conditions with intermittent shaking (Cute Mixer CM-1000; Eyela, Tokyo, Japan) for 24 hours to achieve equilibrium. The mixtures were centrifuged (Micro-12; Hanil Science, Gimpo, Korea) at 15,000× g for 10 minutes, and the supernatant was passed through a 0.45 μm polyvinylidene difluoride syringe filter (Millex-HV; EMD Millipore, Billerica, MA, USA). The filtrate was diluted appropriately with water, and the concentration of VRC was measured using HPLC. Hygroscopicity tests were conducted according to a previously reported method.17 Briefly, an exact amount (1.0 g) of samples in an open container was stored in a humidity chamber (TPAV-120-20, 25°C±2°C/80%±5% relative humidity [RH]; Isuzu Seisakusho, Sanjo, Japan). After 24 hours, the increase in weight of the sample was recorded and expressed as hygroscopicity per unit of weight ratio.
DSC and PXRD measurements
DSC analysis of VRC, VRC-T, and VRC-S was conducted by using a differential scanning calorimeter (DSC823; Mettler Toledo, Columbus, OH, USA). The weighed samples (2–3 mg) were placed in an aluminum pan, with an empty pan of the same type used as a reference. The heating process for each sample was increased from 25°C to 400°C at 10°C/min, with nitrogen used as the purge gas (20 mL/min). The PXRD patterns of samples were obtained using an X-ray diffractometer (New D8-Advance; Bruker-AXS, Billerica, MA, USA) with Ni-filtered Cu Kα radiation. The 2θ scan range was 10°–50° with a step size of 0.02° and a scanning speed of 6°/min.
Drug–excipient compatibility test
The drug–excipient compatibility test was performed as previously reported.18 The raw materials for VRC-S and various excipients were mixed thoroughly and passed through a 35-mesh sieve. The sieved mixture was placed in an aluminum bag and sealed by compression for 2.5 seconds using a bag sealer (SK-310; Sambo Tech, Daejeon, Korea), and then stored at a low temperature in the humidity test chamber (TPAV-120-20; Isuzu Seisakusho) at 60°C±2°C and 75%±5% RH. After 2 weeks, the samples were dissolved in an acetonitrile–phosphate buffer mixture (95:5 v/v) and then passed through a 0.45 μm polyvinylidene difluoride syringe filter (Millex-HV; EMD Millipore) for HPLC analysis.
HPLC determination of drug content and degradation products
The compositions of VRC and the degradation products were determined by HPLC assay using a pump (1260 Infinity; Agilent Technologies, Santa Clara, CA, USA), ultraviolet (UV) detector (1260 Infinity; Agilent Technologies), and a data station (EZchrom Elite; Scientific Software Inc., Pleasanton, CA, USA). Chromatographic separation was performed using a C18 column (Capcell Pak, 4.6×150 mm, 5 μm; Shiseido, Tokyo, Japan) and monitored at a wavelength of 237 nm and a flow rate of 1.0 mL/min. For drug content analysis, the tablets were weighed individually, crushed into a powder, and a sample of the weight corresponding to the average weight of the tablets was taken. The isocratic mobile phase was composed of acetonitrile and buffer solution at a ratio of 88:12 (v/v). The buffer solution was prepared by dissolution of 1.361 g of potassium phosphate monobasic in 1,000 mL of distilled water (DW). VRC calibration solution was prepared at VRC concentrations of 0.05, 0.3, 0.5, 0.8, and 1.0 μg/mL. The linearity of least-square linear regression was 0.05–1.0 μg/mL, with a coefficient of determination (r2) value of greater than 0.99. Separately, the degradation products were calculated by the area percentage method.19 A gradient elution was performed to change the mobile phase from mobile phase A to mobile phase B. Mobile phase A was composed of acetonitrile and 0.1% phosphate buffer solution at 95:5 (v/v) ratio, and mobile phase B comprised methanol. The mobile phase composition followed the gradient: 100% A for 6 minutes, linear decrease to 80% A over 12 minutes and to 35% over 43 minutes, and then return to 100% mobile phase A for 9 minutes.
Preparation of granules and tablets
The compositions of the various VRC-S tablets are shown in Table 1. Excipients with acceptable compatibility were selected, and tablets were fabricated via direct compression (F1–F3) or wet granulation (F4–F6) process. For direct compression, the dry powder blends were primarily prepared from a homogenous mixture of the active ingredient with selected excipients, such as MCC or mannitol, dibasic calcium phosphate, croscarmellose sodium, and the lubricant (a combination of colloidal silica and magnesium stearate) and then directly compressed into a tablet by a rotary tablet machine (TP-L200; Shinwha Pharma Tech., Siheung, Korea) at compression force of 17–20 kPa using oval-type punches. In the wet granulation method, the active ingredient dissolved in an adequate amount of water was blended with MCC, dibasic calcium phosphate, and different amounts of croscarmellose sodium. After kneading, the wet mass was granulated using a wet granulator (SM-5; Shinwha Pharma Tech.) with agitation (100 rpm) and chopping (1,500 rpm) for 5 minutes. The wet granules were dried at 60°C for 24 hours in an oven (OF-22GW; Jeio Tech., Seoul, Korea), screened through a 35-mesh sieve, mixed with the lubricant, and then compressed into a tablet under the same conditions as above.
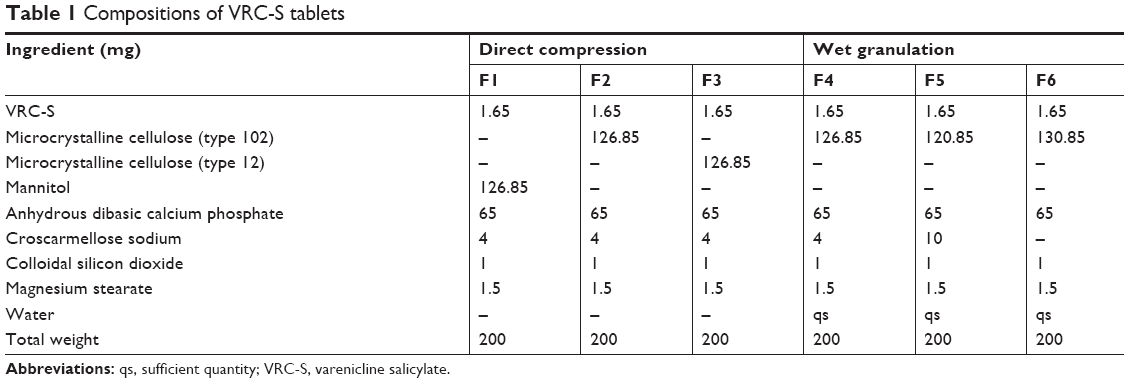 | Table 1 Compositions of VRC-S tablets |
Physical property observations
Flow property of the powder blends and granules
To evaluate the flow property of the powder blends and granules, the bulk density and angle of repose were measured as previously reported.20 Briefly, accurately weighed samples (50 g) were poured into a graduated cylinder, the volume was measured to obtain the apparent bulk density, and the cylinder was tapped 200 times using a tap device (Tap Density 50-1200; Varian Inc., Palo Alto, CA, USA) to obtain the tapped bulk density. Separately, the angle of repose was measured using a device (PTG-S3; Pharma test, Frankfurt, Germany).
Physical properties of the VRC-S tablets
The physical properties of the VRC-S tablets were measured as previously reported.21 The weight of 20 individual tablets was measured using an electronic balance (XT220A; Precisa Instruments Ltd, Dietikon, Switzerland) and averaged. The thickness was measured individually for ten tablets using Vernier calipers (CD-20CPX; Mitutoyo Corp., Kanagawa, Japan) and averaged. The crushing strength was measured individually for ten tablets using a hardness tester (VK200; Varian Inc.) and averaged. The friability was calculated as a percentage of the reduced weight after 100 rotations at 25±1 rpm for 20 tablets using a friabilator (45-1200; Varian Inc.). The disintegration was tested for six tablets in water at 37°C±2°C using a disintegration tester (DIT-200; Labfine Inc., Anyang, Korea) with an amplitude of 55 mm for the up and down movements.
VRC dissolution test
The release of VRC from various VRC-S tablets was studied using United States Pharmacopeia (USP) dissolution Apparatus 2 (VK7000; Varian Inc.) and an auto sampling system (VK8000; Varian Inc.). The dissolution media (900 mL) tested were formulated to pH 1.2 (NaCl 2.0 g and HCl 7.0 mL in DW to 1,000 mL), pH 6.8 (KH2PO4 6.8 g and NaOH 0.94 g in DW to 1,000 mL), and water was maintained at 37°C±0.5°C. The rotation speed was 50 rpm. After the vessel was filled with each test tablet containing 1.0 mg of VRC equivalent, aliquots (5 mL) were withdrawn after 5, 10, 15, and 30 minutes and replenished with fresh medium (5 mL). The samples were analyzed by the HPLC assay as described above.
Accelerated stability test
The F4 tablet was selected for stability testing in accordance with the International Council for Harmonisation guidelines.22 Twenty tablets were placed in an aluminum bag and sealed by compression for 2.5 seconds using a bag sealer (SK-310; Sambo Tech) and stored in the low temperature and humidity test chamber under accelerated storage conditions (40°C±2°C and 75%±5% RH). The drug content, dissolution, and degradation products were determined over a 6-month period using the HPLC assay described above.
In vivo PK study
This clinical study was conducted in accordance with the protocol (DAUHIRB-17-070) approved by the Institutional Review Board of Clinical Trial Research Center, Dong-A University Hospital (Busan, Korea) and the Declaration of Helsinki for biomedical research involving human subjects (Fortaleza, Brazil, 2013). A detailed explanation of the study was provided to each participant and written informed consent was obtained prior to screening. Volunteers agreed to abstain from strenuous physical activity and consumption of alcohol from 2 to 4 days prior to initiating the study until the final PK sampling.
Human subjects
Male smokers aged 19–45 years, who weighed over 50 kg with a body mass index of 18.0–30.0 kg/m2, were eligible for the study. Female subjects were excluded from this study because of pregnancy-related concerns before or during the trial, based on the instruction guideline of the commercial product, although there were no currently available data to provide a signal that VRC is a major human teratogen.23 All subjects were Korean and were assessed as healthy based on a detailed medical examination, which included medical history, blood pressure (BP) and pulse rate (PR) measurements, a 12-lead electrocardiogram (ECG) test, and clinical laboratory evaluations. Exclusion criteria were as follows: recent history of drug abuse, high levels of alcohol consumption, psychiatric disorders (such as tristimania), gastrointestinal disorders, hypersensitivity, drug allergies (such as allergies to VRC, fibrate, ketoprofen, aspirin, or antibiotics), and cardiovascular, congenital, or chronic disease; taking medication for the induction and inhibition of drug metabolizing enzymes, such as barbiturate drugs within 30 days of beginning study medication; clinical laboratory test results on ECG (corrected QT interval >450 msec, PR interval >200 msec, and QRS duration >120 msec), BP (SBP ≥150 or ≤90 mmHg, DBP ≥100 or ≤60 mmHg), and PR (pulse ≤40/min or ≥100/min); or renal dysfunction (serum creatinine level >1.2 mg/dL or estimated glomerular filtration rate calculated by the Modification of Diet in Renal Disease Study equation <60 mL/min/1.73 m2). The total number of subjects enrolled was 32, but only 31 subjects completed the final clinical trial; 1 subject withdrew consent after screening.
Safety assessments
Throughout the study, safety observations comprised an assessment of adverse events (AEs), concomitant medications, physical examination, vital signs, clinical laboratory tests, and 12-lead ECG. The incidence of AEs was summarized by treatment group for the number of incidences, number of subjects, severity, seriousness, and causality with the administered medications. The severity of AEs was graded according to the three-step classification as follows: mild (event not requiring treatment and does not limit daily activities); moderate (event is sufficiently discomforting so as to interfere with daily activities and may require interventional treatment); and severe (event results in significant symptoms that prevent normal daily activities and may require hospitalization).24 Also, the causality was categorized according to the WHO-UMC (Uppsala Monitoring Centre) system: for example, Certain (cannot be explained by disease or other drugs); Possible (could also be explained by disease or other drugs); Unclassifiable (cannot be judged because information is insufficient or contradictory).25 The results were compared by applying parametric or nonparametric methods, as required. The concomitant medications were scheduled to be listed by the subject. After finishing the clinical trial, the subject was advised to return to the study center for a final safety checkup within 1 week.
Drug administration and plasma sampling
A sequence-randomized, open-label, single-dose, two-way crossover clinical trial was performed to compare the PK profiles of VRC after the oral administration of the selected VRC-S tablet (F4) or the reference tablet (Champix). All subjects were randomly assigned to one of two sequences of the two formulations. The subjects were admitted on the day prior to dosing, hospitalized for two nights and 3 days in the study center, and fasted for 10 hours prior to receiving the drugs, except for limited consumption of water. No subjects received concomitant medications in this trial. The total duration of the clinical trial was 15 days, including the wash-out period of 7 days. The drugs were administered at a dose of 1.0 mg equivalent as VRC with 240 mL water. Blood samples (8 mL) were collected into a heparinized tube at predetermined time points (0, 1, 2, 2.5, 3, 3.5, 4, 5, 6, 8, 12, 24, 36, 48, and 72 hours). An aliquot of saline (1 mL) was injected into the catheter to prevent blood clotting. The collected blood samples were centrifuged immediately at 16,000× g for 10 minutes and the obtained plasma samples were stored in a light-protected container at −70°C until analysis.
VRC determination in plasma samples by liquid chromatography with tandem mass spectrometry (LC-MS/MS)
The concentrations of VRC in human plasma were determined by LC-MS/MS. A liquid chromatography system (1290 Infinity II; Agilent Technologies) was used for analysis. Data analyses were computed using MassHunter software (ver. B.07.01 SP2/Build 7.1.524.2; Agilent Technologies). Chromatographic separation was performed on a Luna HILIC column (2×100 mm, 3 μm; Phenomenex Inc., Torrance, CA, USA), with a mobile phase of 5 mM ammonium formate and acetonitrile (30:70, v/v) at a flow rate of 0.3 mL/min. The LC system was coupled with an electrospray ionization-triple quadrupole mass spectrometer (Agilent 6470 Triple Quad LC/MS; Agilent Technologies) for detection. Multiple-reaction monitoring mode with positive ion was used for quantification: VRC m/z 212.1>169.0 and VRC-d4 (internal standard) m/z 216.1>169.0. Liquid–liquid extraction method was used for sample pretreatment.26 An aliquot of each plasma sample (100 μL) was transferred into an Eppendorf tube, after which an internal standard solution (VRC-d450 ng/mL in 50% acetonitrile; 10 μL), 50 mM sodium carbonate solution (50 μL), and methyl tert-butyl ether (2.5 mL) were sequentially added to the tube. The resultant mixture was vortexed vigorously for 10 minutes and centrifuged at 3,400× g for 5 minutes. The organic layers were frozen at −50°C for 15 minutes, transferred to a test tube, and evaporated to dryness at 50°C under a nitrogen stream. The residue was reconstituted in 400 μL of 70% acetonitrile and vortexed for 1 minute. The final solution was centrifuged at 1,400× g for 5 minutes and the supernatant (5 μL) was injected into the LC-MS/MS system.
Quantitative procedures of the assay method were validated for selectivity, matrix effect, carry-over, lower limit of quantitation (LLOQ), calibration curve, precision, accuracy, recovery, reinjection reproducibility, and stability. Inter-day accuracy and precision for the assay were characterized by the performance of four levels of quality controls (QCs) run on three separate days in three replicates each day. The LLOQ was set at 200 pg/mL with a signal-to-noise ratio of at least 10 on the chromatogram and a precision of <20% and an accuracy of 80%–120%. The QC with low concentration (QCL) was 0.6 ng/mL (equivalent to three times the LLOQ), and the QCs with medium concentration (QCM) and high concentration (QCH) were 6 and 16 ng/mL, respectively. The values of inter-day coefficient of variation (%) were 6.62 at LLOQ, 2.06 at QCL, 0.69 at QCM, and 1.33 at QCH. The values of accuracy (%) were 108.69 at LLOQ, 99.38 at QCL, 99.04 at QCM, and 99.16 at QCH. All these data fulfilled the acceptance criteria. Plasma concentrations were determined only when individual values were above the LLOQ in >50% of the subjects receiving a given dose. For concentration values below the LLOQ, a value of zero was used in the calculation of PK parameters.
PK evaluation and bioequivalence
The maximum plasma concentration (Cmax) and time to reach the maximum plasma concentration (Tmax) were determined directly from the obtained concentration–time data. The areas under the plasma drug concentration–time curves from 0 to 24 hours (AUC24h) and infinity (AUCinf) were calculated using the trapezoidal rule. The terminal plasma elimination half-life (t1/2), apparent clearance (CL/F), and apparent volume of distribution (Vd/F) were processed using the Phoenix WinNonlin program (ver. 6.3; Pharsight Corporation, Apex, NC, USA) using a non-compartmental approach. For plasma concentrations and PK parameters, the values were reported as arithmetic means±SDs. Bioequivalence was evaluated for log-transformed values of Cmax, AUC24h, and AUCinf using ANOVA with a mixed-effects model. The ratio of geometric least squares means and the corresponding 90% confidence interval (CI) for the difference in the geometric means of the log-transformed values were calculated to determine the bioequivalence of the two products. The sample size of a bioequivalence trial was estimated as 23 subjects to provide 90% power and type I error rate of 5% under the assumption of the special case where the true mean ratio is expected to be unity and the intra-coefficient of variation to be within 10%, based on the earlier report that within-subject variances of VRC were 6.9% and 8.9% for AUCinf (6.2±1.1 ng/mL) and Cmax (102±14 ng·h/mL), respectively.27,28 Finally, in consideration of unexpected dropout rate during the trial, the sample size was adjusted to over 30 subjects.
Statistical analysis
One-way ANOVA was conducted to test the difference among the samples tested, and a P-value <0.05 indicated a significant result. With a significant F ratio, Scheffé post hoc tests were further performed. Scheffé’s procedure is known to be the most conservative of different types of the post hoc analyses. The PK and safety data were summarized through appropriate data tabulations, descriptive statistics, and graphical presentations.
Results and discussion
Characterization of active pharmaceutical ingredients
SEM images and particle size distribution of VRC, VRC-T, and VRC-S are shown in Figure 1A. Although there was a particle aggregation in VRC-T, the samples represented different crystal morphologies: irregularly platy or blade-shaped (VRC), massive or orthorhombic (VRC-T), and tabular or acicular (VRC-S). Murphy et al10 reported the crystallographic properties of VRC L-tartrate: Form A and Form B belong to the orthorhombic crystal system, whereas Form C belongs to the monoclinic crystal system. The particle size distribution of all samples was peculiar with a positively skewed pattern. VRC-S showed a unimodal distribution, whereas VRC and VRC-T showed multimodality; specifically, VRC-T revealed a split pattern and heterogeneity, which might be attributable to particle aggregation. The median diameter (D50), was observed as 15.985, 84.461, and 6.156 μm for VRC, VRC-T, and VRC-S, respectively. The span value was calculated from the equation: (D90−D10)/D50, where D90 and D10 were the sizes when the cumulative volume was 90% and 10%, respectively. The values of VRC (6.867) and VRC-T (6.430) were greater than that of VRC-S (3.092), which indicated a narrower size distribution of VRC-S than a wider distribution of VRC and VRC-T. Subsequently, the specific surface area of VRC-S (2.02 m2/g) was greater than those of VRC (1.27 m2/g) and VRC-T (1.69 m2/g). In addition, as shown in the SEM images in Figure 1B, differences in morphology and the surface texture of the granules were found. Powder blends were relatively irregular in shape and non-homogeneous owing to the presence of physically mixed drug crystals, whereas wet granules were round, uniform, and smooth surfaced, in which the recrystallized drug was homogeneously dispersed throughout the granular matrix.
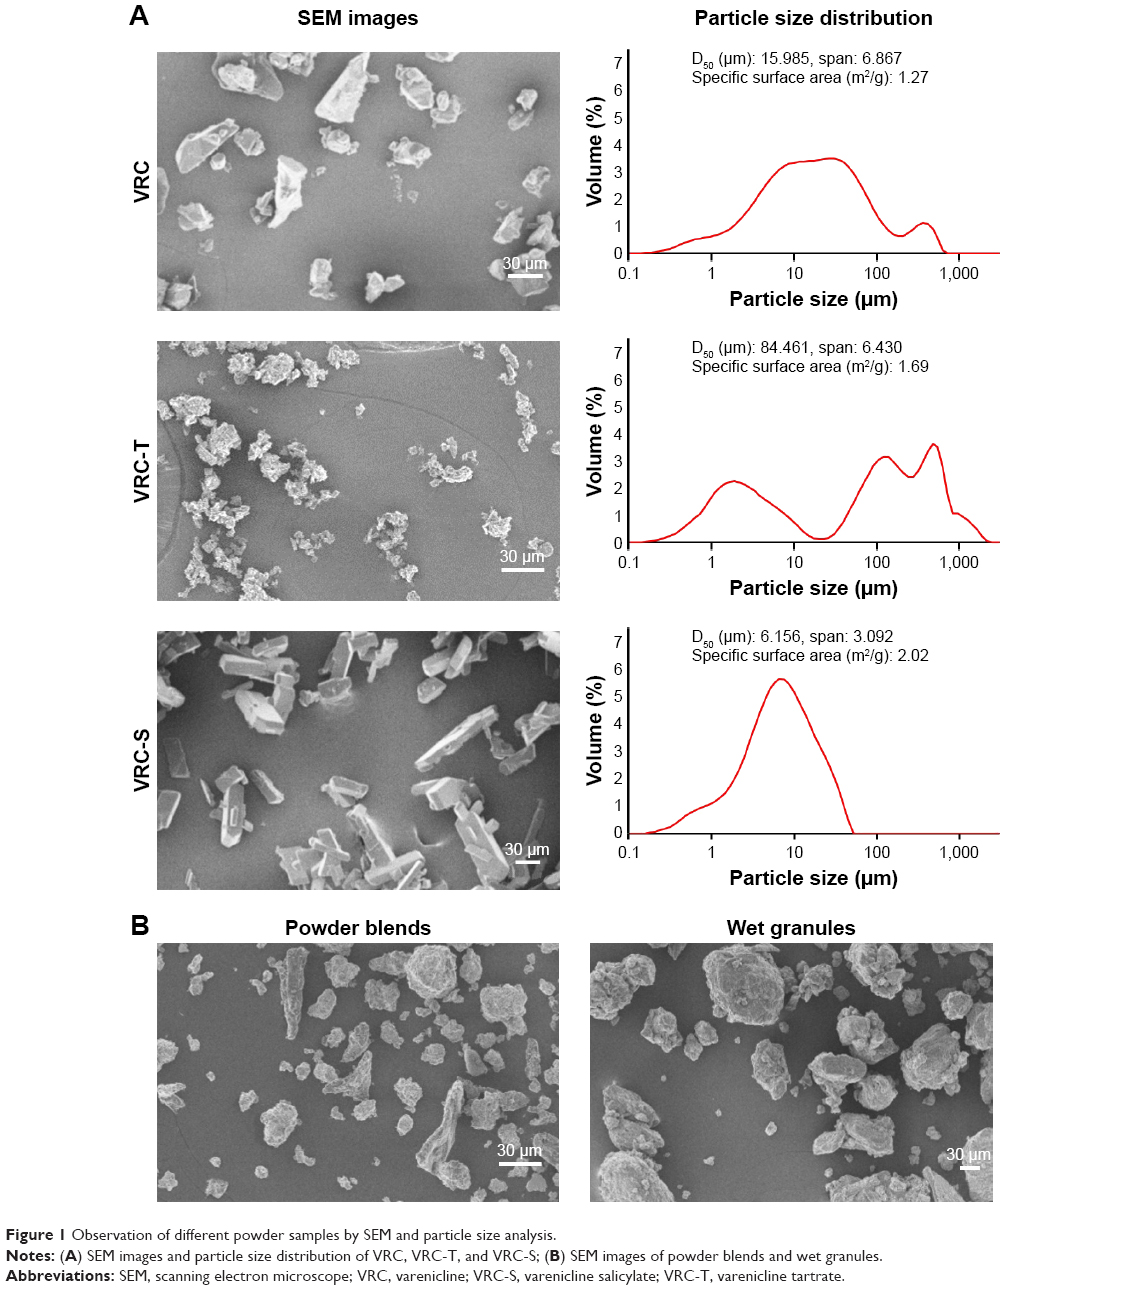 | Figure 1 Observation of different powder samples by SEM and particle size analysis. |
Meanwhile, the thermal properties of VRC, VRC-T, and VRC-S were evaluated by DSC (Figure 2A). DSC thermograms demonstrated a single endothermic peak with onset temperatures of 145.7°C, 232.0°C, and 225.2°C for VRC, VRC-T, and VRC-S, respectively, whereas a broad and mild endotherm was observed in VRC-S. Each of these endotherms representing a solid to liquid phase change were close to the melting point reported.9 In addition, PXRD patterns revealed that VRC and its salt forms were crystalline in their internal structures (Figure 2B). The solubility and hygroscopicity of VRC, VRC-T, and VRC-S were further evaluated. Salt formation was the most common and effective method for the increase in the solubility and dissolution rate of weakly acidic or basic drugs.29 The solubility of VRC was dependent on the vehicle used: 50.45–180.50 mg/mL in water and 5.12–18.07 mg/mL in dimethyl sulfoxide.30 In this experiment, the ANOVA was found to be significant (F(2,6)=238.80, P<0.001), which indicated significant differences among the samples regarding solubility. It also yielded a significant effect of VRC, VRC-T, and VRC-S on hygroscopicity (F(2,6)=9.17, P<0.05). Scheffé post hoc tests showed that the aqueous solubility of VRC-S (244.7 mg/mL) was significantly greater than that of VRC-T (209.8 mg/mL), which was greater than that of VRC (54.4 mg/mL), as shown in Figure 2C. However, when the hygroscopicity was compared, the value of VRC-S (165 μg/g) was significantly lower than those of VRC (371 μg/g) and VRC-T (397 μg/g), which did not differ significantly from each other (Figure 2D). Thus, we concluded that VRC-S might be useful for the development of a stable solid dosage form and, in terms of hygroscopic resistance, VRC-S–containing preparation would be superior to a commercial product of VRC-T.
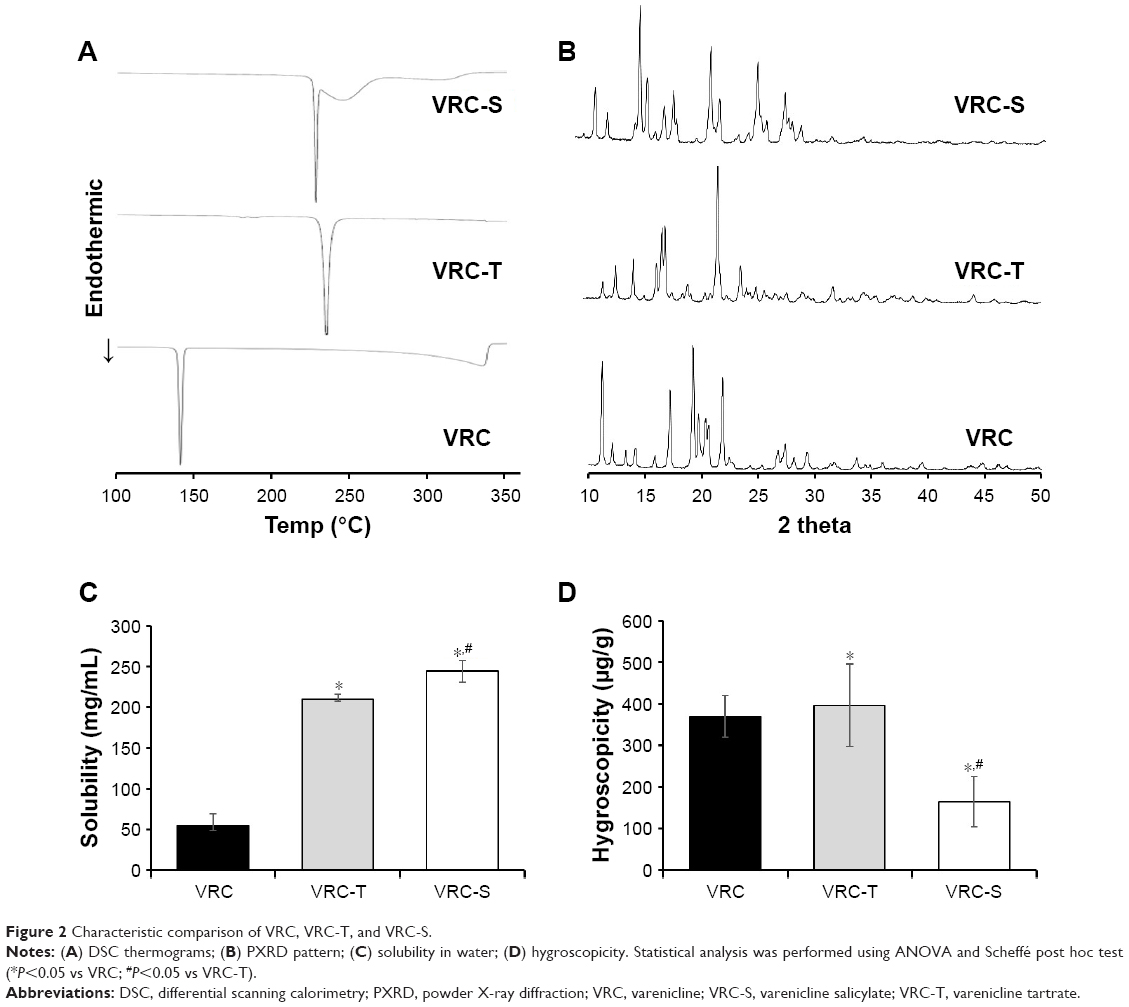 | Figure 2 Characteristic comparison of VRC, VRC-T, and VRC-S. |
Screening of excipients
For the development of a tablet formulation, the compatibility of selected excipients with VRC-S was screened by HPLC assay of the degradation product. A representative chromatogram and the integration results are shown in Figure 3. A sample tablet prepared by the wet granulation method was stored for 2 weeks under severe stress conditions (60°C and 75% RH). The integration showed that VRC accounted for 74% of the total area, with a retention time of 18.7 minutes, and that salicylic acid accounted for 26% of the total area, with a retention time of 28.7 minutes. Three unknown peaks were found with a retention time of 14.18, 20.14, and 47.02 minutes, and were named as #1, #2, and #3, respectively. Among these unknown peaks, #3 was designated as a major degradation product because it had the greatest area. The other two unknown peaks had relatively minor percentage areas and were even undetectable in some cases.
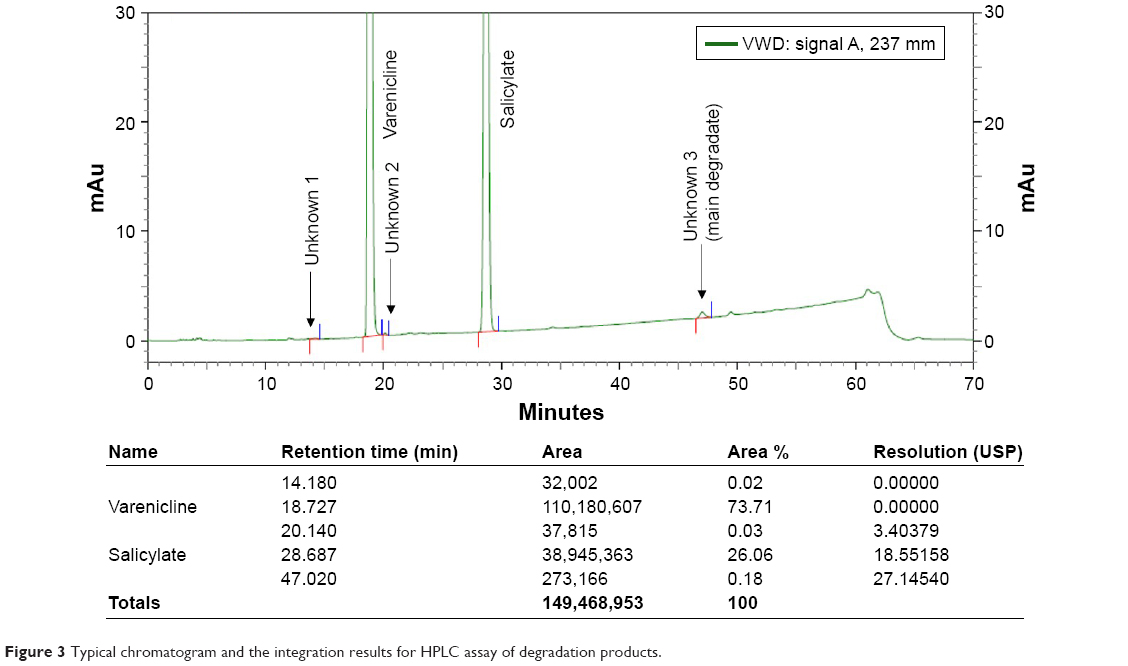 | Figure 3 Typical chromatogram and the integration results for HPLC assay of degradation products. |
The results of the drug–excipient compatibility test are presented in Table 2. Based on the relative percentage of the peak area of the degradation products, the acceptance criteria were set to the maximum allowance limits as 0.5% for major peak, 2.0% for total peaks, and 0.2% for changes in major peak. Except for povidone, all excipients tested initially showed no or inappreciable impurity peaks. After 2 weeks of storage under severe stress conditions, the percentage area of the unknown peaks increased. Specifically, lactose showed large changes in the peak area for the major degradation product (0.86%) and the total degradation products (1.04%), indicating their unacceptability for use. For starch, the change in major degradation product (0.25%) exceeded the allowance limit. Thus, these diluents (starch, lactose, and povidone) were screened out. All other excipients selected as disintegrants and lubricants showed changes within the allowance limit, indicating their acceptability for use. Therefore, the excipients for the tablet formulation were finally selected as follows: mannitol, MCC, and anhydrous dibasic calcium phosphate as diluents; croscarmellose sodium as a disintegrant; colloidal silicon dioxide and magnesium stearate as lubricants.
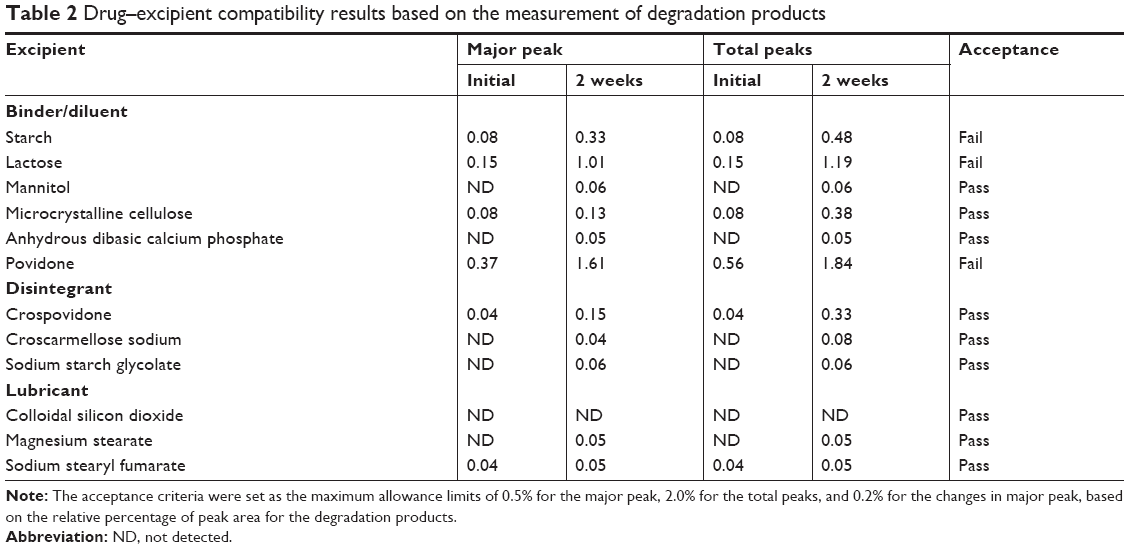 | Table 2 Drug–excipient compatibility results based on the measurement of degradation products |
Granulation and tablet preparation
By employing selected diluents and disintegrants, VRC-S–containing granules were successfully prepared by either direct compression or wet granulation method. As shown in Table 1, different diluents were used for direct compression (F1–F3), whereas the amount of diluent was fixed. In comparison, the amount of MCC and croscarmellose sodium was varied for wet granulation (F4–F6). The flow property of the prepared granules was evaluated in accordance with USP guidelines. The angle of repose was measured, and Hausner ratio and Carr’s compressibility index were calculated as follows:
|
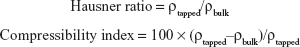
where ρtapped and ρbulk are the tapped and apparent bulk densities (g/mL), respectively. The results are listed in Table 3, with the resultant tablet properties. The Hausner ratio value of wet granules (F4–F6) was 1.13 or 1.14, which was judged as a good indicator of free-flowing property, but those of powder blends (F1–F3) were between 1.34 and 1.40, which indicated a passable to poor flow property. The comparison of the compressibility index values also showed similar results. In the case of the angle of repose, wet granules were the same grade, whereas powder blends were a fair to passable grade. Overall, wet granules were superior to powder blends in terms of flow property. This behavior might be attributable to the solubilization and recrystallization of the active ingredient through the wet granulation process.
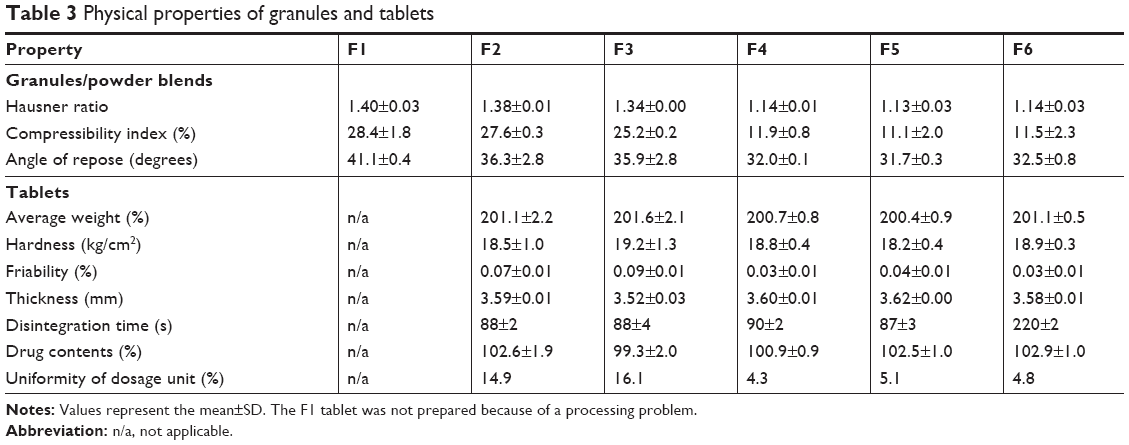 | Table 3 Physical properties of granules and tablets |
Tableting of granules was successfully conducted using colloidal silica and magnesium stearate as a lubricant, except for the F1 formulation, which contained mannitol and experienced a processing problem of capping due to poor feeding (ratholing in the hopper). The thickness and average weight of tablets were within 3% deviation. Hardness and friability data were found to be between 18 and 20 kp and <1.0%, respectively, which were acceptable. Tablet disintegration was rapid, occurring within a few minutes, although the F6 tablet disintegrated relatively slowly owing to the absence of a disintegrating agent. The drug content of all tested tablets was between 95% and 105%, which fulfilled the acceptance criteria. However, deviations in the content uniformity were observed. The uniformity results of the F2 and F3 tablets were marginally outside of the acceptance criteria; however, those of the F4–F6 tablets were satisfactory. These differences were closely related to the flowability of the powder beds. Thus, the wet granulation method was recommended for tablet preparation and the relevant F4–F6 tablets were selected for further studies.
Dissolution behavior
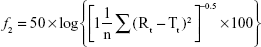
The drug release profiles of the VRC-S tablets (F4–F6) and the reference tablet (Champix) were compared in the dissolution medium of DW. Overall, rapid dissolution was observed without lag time because of the high solubility of VRC salts in water. For further comparison in accordance with the guidelines for the judgment of dissolution similarity,31 a limit in the dissolution of ±15% of the reference was established, as depicted by the dashed lines in Figure 4. The dissolution of the reference tablet was 64%, 81%, 89%, and 96% after 5, 10, 15, and 30 minutes, respectively. The dissolution of all tablets tested was within this limit, which indicated the similarity of dissolution between formulations. However, at several time points, the dissolution of some test tablets was significantly different to that of the reference: at 5 minutes, F5 and F6 were different; at 10 and 15 minutes, only F6 was different. The similarity factor (f2) was calculated as follows:32
|
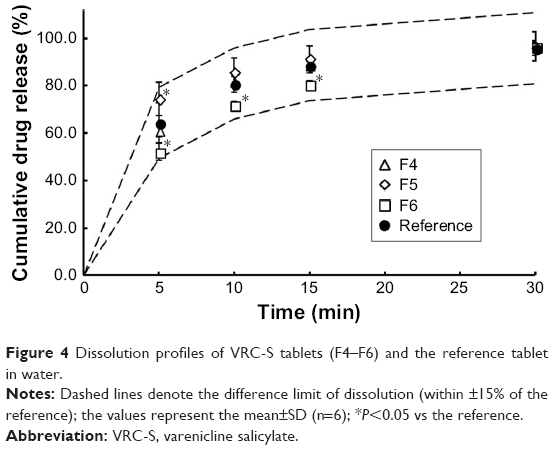 | Figure 4 Dissolution profiles of VRC-S tablets (F4–F6) and the reference tablet in water. |
where n is the number of time points and Rt and Tt are the percentages of the reference and test tablets released at time point (t), respectively. The value of f2 in the range of 50–100 represents a similar correlation between two products. As shown in Table 4, the value of F4 (84.83) was greater than those of F5 (61.43) and F6 (53.05), although all values were within the above range. Thus, the F4 tablet was selected as a representative formulation.
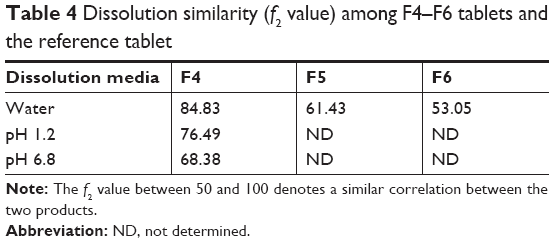 | Table 4 Dissolution similarity (f2 value) among F4–F6 tablets and the reference tablet |
Separately, to observe the influence of dissolution media on drug release, dissolution behavior of the selected tablet (F4) and the reference tablet was further investigated in pH 1.2 and pH 6.8 media. As shown in Figure 5, dissolution profiles were practically similar in all cases: the dissolution was rapid and reached a plateau within 15 minutes, with complete release achieved within 30 minutes. No significant differences were found between two tablets, regardless of the type of media. This implied that VRC dissolution from the tablets was pH independent. For the similarity factor, the f2 values of F4 were 76.49 and 68.38 for pH 1.2 and pH 6.8, respectively (Table 4). As these values were sufficiently large, it was possible to conclude that the reference and test tablets possessed similar dissolution behavior. We also found that the type of salt was not a critical factor for VRC release, but the high aqueous solubility of VRC salts governed the drug release, especially for an immediate release tablet formulation.
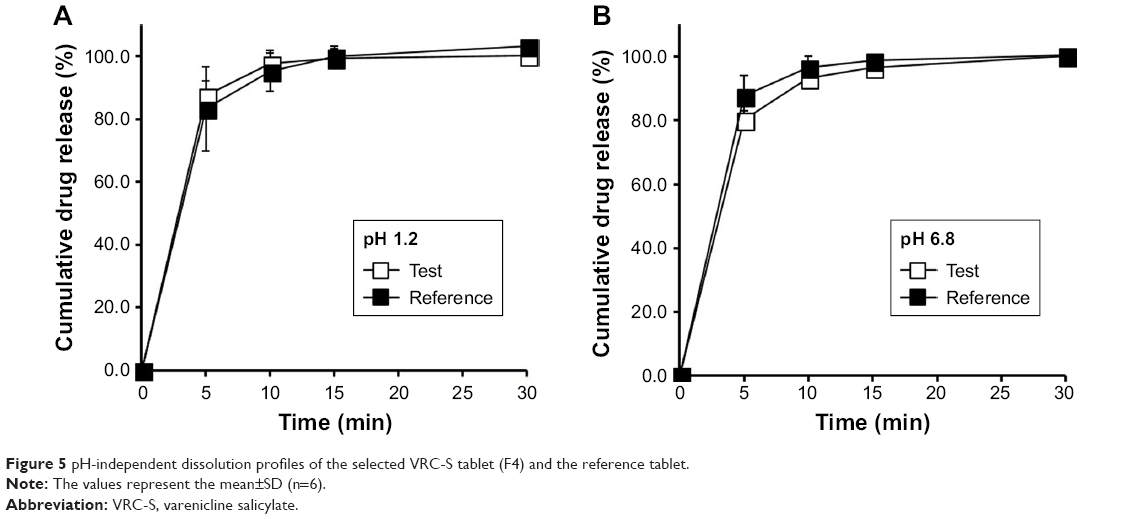 | Figure 5 pH-independent dissolution profiles of the selected VRC-S tablet (F4) and the reference tablet. |
Accelerated stability assessment of the selected tablet
An accelerated stability test of the selected F4 tablet was conducted in accordance with the International Council for Harmonisation guidelines after storage for 6 months at 40°C and 75% RH. Changes in the drug content, dissolution rate, and occurrence of a degradation product were observed (Table 5). No significant changes in drug content and dissolution rate were found, with greater than 99% content and 93%–94% dissolution throughout the entire period. In comparison, there was a slight increase in the number of degradation peaks at the end of storage period. However, the level of major and total unknown degradation products was still within acceptable limits. A stability-indicating assay method for VRC in solid or solution state has been reported.33,34 A forced degradation study on VRC solution reported complete degradation of VRC under the presence of hydrogen peroxide (30%, w/v) by heating in a water bath at 90°C for 4 hours, whereas relatively mild degradation of VRC was observed in strong alkaline and acidic conditions; that is, 10% and 14% of VRC was degraded by 5 N NaOH and 5 N HCl at 90°C for 9 hours, respectively, and in comparison, the degradation was found to be 0.29% and 0.31% after alkaline hydrolysis (0.1 N NaOH for 2 hours in a boiling water bath) and acid hydrolysis (0.1 N HCl for 2 hours in a boiling water bath), respectively.33 However, VRC was stable to boiling (solution refluxed for 2 hours in a boiling water bath), UV irradiation (powder exposed to UV light for 72 hours), and oxidation (solution with 30% hydrogen peroxide at 25°C for 2 hours), as no degradation products were observed in the HPLC chromatograms.34 These results confirmed that VRC-S in tablet formulations could be sufficiently stable in the accelerated condition.
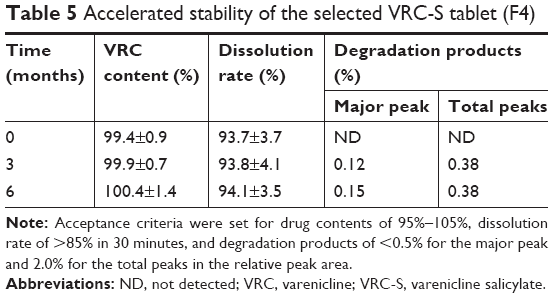 | Table 5 Accelerated stability of the selected VRC-S tablet (F4) |
Comparative PK evaluation in human subjects
The age, height, body weight, and body mass index (mean±SD) of the enrolled subjects were 26.75±6.13 years, 173.44±4.44 cm, 72.74±9.27 kg, and 24.17±2.73 kg/m2, respectively. Subjects had a normal ECG and their BP in rest was within the normal range. No clinically significant findings were observed in physical examinations. All observed treatment-emergent AEs are summarized in Table 6. No serious AEs (moderate to severe grade) were found in this trial, but a total of nine AEs (mild grade) were reported in six subjects (9.7% of total tested subjects). All mild AEs recovered without any treatment before the end of study. Eight incidences out of nine AEs were assessed as “possibly related”, and they primarily affected the gastrointestinal tract (five incidences of nausea) and the nervous system (two incidences of headache and one incidence of dizziness). Similarly, it was reported that the most frequent dose-related AEs of VRC were nausea and vomiting; however, subjects who were smokers appeared to demonstrate improved tolerance relative to nonsmokers, as the frequency of these events appeared to increase at a dose of 3.0 mg VRC in fasted nonsmokers and at a dose of 10.0 mg in fasted smokers.28 Given that a dose of 1.0 mg VRC equivalent was administered to smokers in this study, both the test (F4) and the reference should be tolerable and safe.
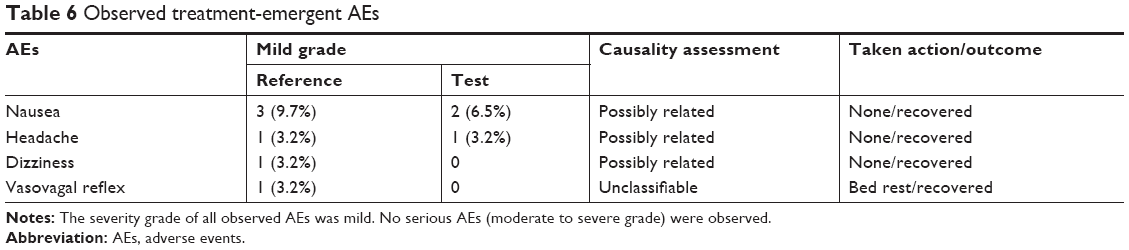 | Table 6 Observed treatment-emergent AEs |
Based on earlier reports that the values of Tmax and t1/2 were ~3 and 13.6 hours, respectively, in a single oral administration study of VRC 1 mg to healthy adults,28 blood samples were taken for 72 hours after dosing with frequent time intervals near the peak time point. The plasma concentration of VRC was measured and plotted against time (Figure 6). The profiles were similar in both F4 and the reference, which indicated the rapid absorption of VRC. Most data points overlapped at all time points, but the data points around the peak were slightly deviated, as shown in the inset graph. After the peaks, plasma VRC concentrations declined exponentially in both cases, showing a linear decrease on a semi-logarithmic plot (data not shown), which indicated the first-order elimination of the drug. Numerous studies reported that VRC exhibited linear kinetics after oral administration in humans. The value of Cmax was proportionally increased in the dose ranges of 0.03–1.0 mg in nonsmokers and 0.03–3.0 mg in smokers.28 An open, two-compartment model with first-order absorption and elimination adequately described individual concentration–time data following single and multiple dosing.35 The PK characteristics of VRC were linear and consistent, regardless of smoking, food intake, time of dosing, age, sex, or ethnic background, which showed that the plasma concentration of VRC declined in a biphasic manner after the peak concentration was reached.36
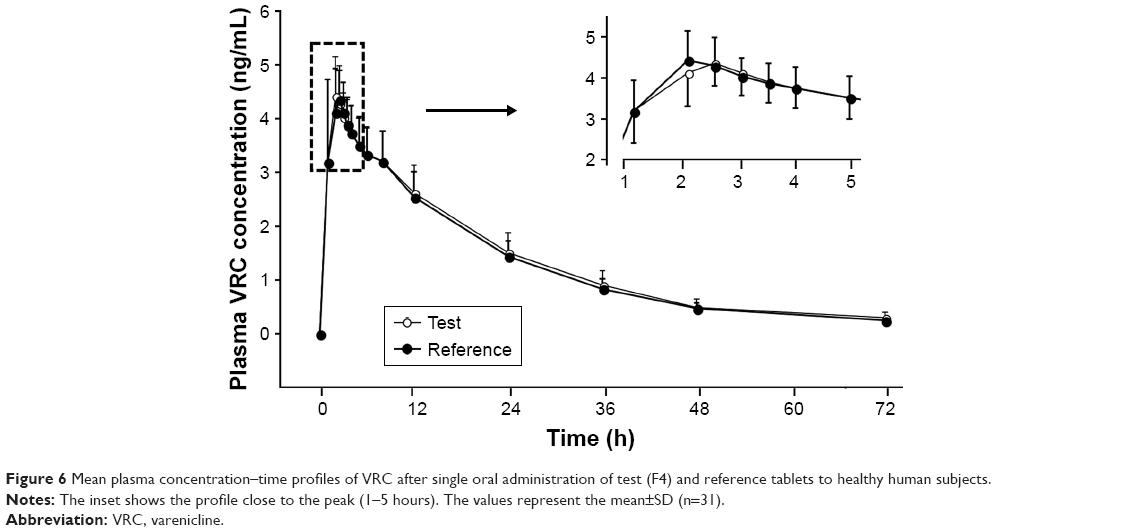 | Figure 6 Mean plasma concentration–time profiles of VRC after single oral administration of test (F4) and reference tablets to healthy human subjects. |
The PK parameters, comprising Tmax, t1/2, Cmax, AUCinf, AUC24h, Vd/F, and CL/F, are listed in Table 7. The values of Tmax were between 1.0 and 4.0 hours (overall mean, 1.968 hours) for the F4 tablet and between 1.0 and 3.5 hours (overall mean, 2.016 hours) for the reference, which were somewhat faster than the previously reported Tmax of 3 hours.28 The t1/2 values of F4 tablet and the reference were 16.14 and 15.97 hours on average, respectively, with no significant difference between them. The apparent volume of distribution (Vd/F, L) was determined as 247.5 for the reference and 242.1 for the F4 tablet. The apparent clearance (CL/F, L/h) was 10.9 for the reference and 10.6 for the F4 tablet. These values of Vd/F and CL/F showed no significant difference between two tablets and were close to the reported values of 215 L and 10.4 L/h, respectively.37 The Cmax values of F4 tablet and the reference were identical (~4.9 ng/mL). The AUCinf values were found to be 87.71±1.70 ng·h/mL for the reference and 90.36±2.03 ng·h/mL for the F4 tablet, with no significant differences between them. Moreover, no specific trend or systematic deviation was found in the comparison of the individual Cmax, AUC24h, and AUCinf values (Figure 7). Thus, the bioavailability of the F4 tablet might be comparable with that of the commercial reference. Bioequivalence was further evaluated through a comparison of the geometric mean ratio, defined as a relative ratio of the geometric least squares means of the test (F4) and reference tablets and the 90% CI values. As shown in Table 8, the geometric mean ratio values were calculated as 1.003, 1.015, and 1.028 for Cmax, AUC24h, and AUCinf, respectively, which were indicative of bioequivalence. The values of 90% CI were 0.972–1.035 for Cmax, 0.989–1.041 for AUC24h, and 0.982–1.075 for AUCinf, which were within the acceptable interval (0.80–1.25 for logarithmic transformed data). This implies that the bodily exposure to VRC was equal in this clinical study. Therefore, the present F4 tablet containing VRC-S can be a suitable replacement for the commercial tablet (Champix) containing VRC-T for smoking cessation treatment.
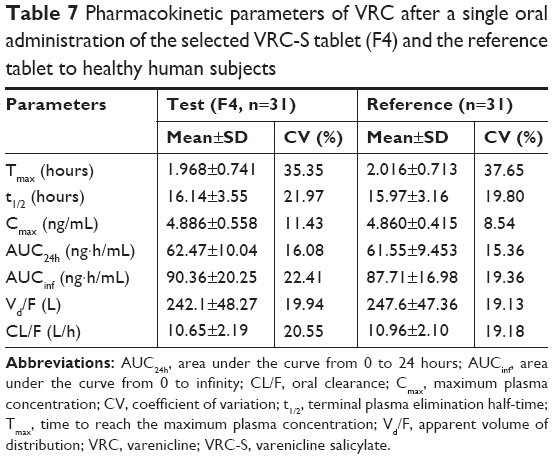 | Table 7 Pharmacokinetic parameters of VRC after a single oral administration of the selected VRC-S tablet (F4) and the reference tablet to healthy human subjects |
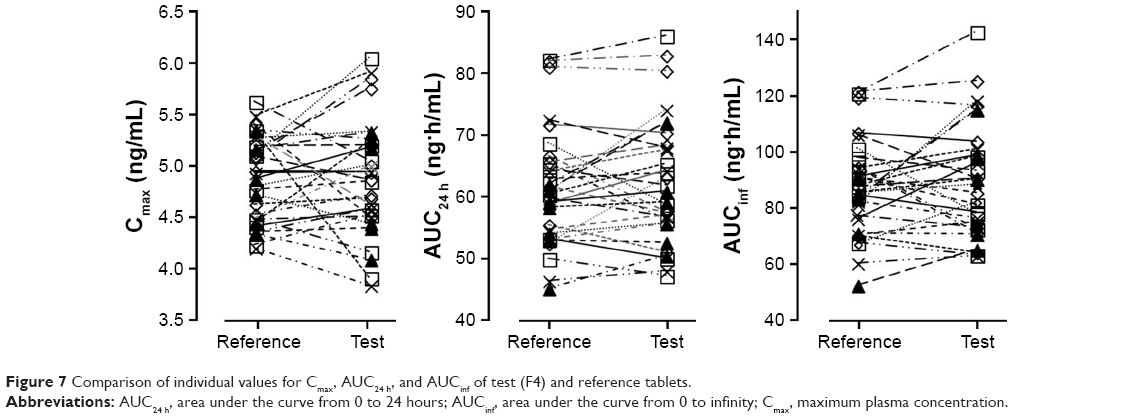 | Figure 7 Comparison of individual values for Cmax, AUC24 h, and AUCinf of test (F4) and reference tablets. |
 | Table 8 Bioequivalence of F4 tablet and the reference tablet based on relevant PK data |
Conclusion
Immediate release-type tablets containing VRC-S as an active ingredient were successfully prepared by the wet granulation method. The selected tablet (F4) was sufficiently stable in accelerated stability conditions (40°C and 75% RH) for 6 months, in terms of drug content, dissolution, and the occurrence of degradation products. The dissolution behavior of the F4 tablet was pH independent, similar to that of the commercial reference product (Champix). In human PK studies, the bioavailability of the F4 tablet was comparable with that of the reference. Therefore, we concluded that VRC-S–containing F4 tablet might be a promising candidate to replace the currently used commercial product for the treatment of smoking cessation.
Acknowledgments
This research was supported by the National Research Foundation of Korea (NRF) grant funded by the Korean government (MSIP) (No 2016R1A2B4011449). This work was also supported in part by the Korea Health Industry Development Institute (KHIDI) funded by the Ministry of Health & Welfare, Republic of Korea (HI17C0710), and the Advanced Technology Center program (10051950) funded by the Ministry of Trade, Industry & Energy (MI, Korea).
Disclosure
The authors report no conflicts of interest in this work.
References
Hays JT, Ebbert JO, Sood A. Efficacy and safety of varenicline for smoking cessation. Am J Med. 2008;121(4 Suppl 1):S32–S42. | ||
Rollema H, Chambers LK, Coe JW, et al. Pharmacological profile of the α4β2 nicotinic acetylcholine receptor partial agonist varenicline, an effective smoking cessation aid. Neuropharmacology. 2007;52(3):985–994. | ||
Xu H, Sun Q, Lu L, et al. MicroRNA-218 acts by repressing TNFR1-mediated activation of NF-κB, which is involved in MUC5AC hyper-production and inflammation in smoking-induced bronchiolitis of COPD. Toxicol Lett. 2017;280:171–180. | ||
Hackshaw AK, Law MR, Wald NJ. The accumulated evidence on lung cancer and environmental tobacco smoke. BMJ. 1997;315(7114):980–988. | ||
Lloyd-Jones D. Heart disease and stroke statistics – 2010 update. Circulation. 2010;121(7):46–215. | ||
Coe JW, Brooks PR, Vetelino MG, et al. Varenicline: an alpha4beta2 nicotinic receptor partial agonist for smoking cessation. J Med Chem. 2005;48(10):3474–3477. | ||
Quallich GJ, Wint LT. Succinic acid salts of 5,8,14-triazatetracyclo[10.3.1.02,11.04,9]-hexadeca-2(11),3,5,7,9-pentaene and pharmaceutical compositions thereof. Pfizer products Inc. 2004;WO03/045394 A1. | ||
Johnson PJ, Rose PR, Wint LT, Williams GR. The Citrate salt of 5,8,14-triazatetracyclo[10.3.1.02,11.04,9]-hexadeca-2(11),3,5,7,9-pentaene and pharmaceutical compositions thereof. Pfizer products Inc. 2004;WO02/092597 A1. | ||
Bogle DE, Rose PR, Williams GR. Tartrate salts of 5,8,14-triazatetracyclo[10.3.1.02,11.04,9]-hexadeca-2(11),3,5,7,9-pentaene and pharmaceutical compositions thereof. Pfizer products Inc. 2005;WO02/092089 A1. | ||
Murphy BJ, Huang J, Casteel MJ, Cobani A, Krzyzaniak JF. Varenicline L-tartrate crystal forms: characterization through crystallography, spectroscopy, and thermodynamics. J Pharm Sci. 2010;99(6):2766–2776. | ||
Kim KN. Hanseo Chem Co., Ltd, Korea Patent KR-10-2016-0155770. 2017. | ||
Mark G. Pharmaceutical Preformulation and Formulation: a Practical Guide from Candidate Drug Selection to Commercial Dosage Form. 2nd ed. New York: Informa Healthcare; 2004. | ||
Danjo K, Kinoshita K, Kitagawa K, Iida K, Sunada H, Otsuka A. Effect of particle shape on the compaction and flow properties of powders. Chem Pharm Bull. 1989;37(11):3070–3073. | ||
Hong-Guang W, Ru-Hua Z. Compaction behavior of paracetamol powders of different crystal shapes. Drug Dev Ind Pharm. 1995;21(7):863–868. | ||
Variankaval N, Cote AS, Doherty MF. From form to function: crystallization of active pharmaceutical ingredients. AIChE J. 2008;54(7):1682–1688. | ||
Yeom DW, Chae BR, Son HY, et al. Enhanced oral bioavailability of valsartan using a polymer-based supersaturable self-microemulsifying drug delivery system. Int J Nanomedicine. 2017;12:3533–3545. | ||
Newman AW, Reutzel-Edens SM, Zografi G. Characterization of the “hygroscopic” properties of active pharmaceutical ingredients. J Pharm Sci. 2008;97(3):1047–1059. | ||
Qiu Y, Chen Y, Zhang GG, Yu L, Mantri RV. Developing Solid Oral Dosage Forms: Pharmaceutical Theory and Practice. 2nd ed. New York: Academic Press; 2016:151–179. | ||
Peeters E, Tavares da Silva AF, Toiviainen M, et al. Assessment and prediction of tablet properties using transmission and backscattering Raman spectroscopy and transmission NIR spectroscopy. Asian J Pharm Sci. 2016;11(4):547–558. | ||
Yeom DW, Chae BR, Kim JH, et al. Solid formulation of a supersaturable self-microemulsifying drug delivery system for valsartan with improved dissolution and bioavailability. Oncotarget. 2017;8(55):94297. | ||
Feng X, du G, Hou T, Liu X, Chao R. Characterization of degradation products of midazolam maleate by UHPLC-HR-IT-MSn and NMR. Pharmazie. 2017;72(2):73–80. | ||
Jeong KH, Woo HS, Kim CJ, et al. Formulation of a modified-release pregabalin tablet using hot-melt coating with glyceryl behenate. Int J Pharm. 2015;495(1):1–8. | ||
Richardson JL, Stephens S, Yates LM, et al. Pregnancy outcomes after maternal varenicline use; analysis of surveillance data collected by the European Network of Teratology Information Services. Reprod Toxicol. 2017;67:26–34. | ||
Spilker B, Revicki DA. Quality of Life and Pharmacoeconomics in Clinical Trials. 2nd ed. Philadelphia: Lippincott-Raven; 1996:25–31. | ||
World Health Organization. The Use of the WHO-UMC System for Standardized Case Causality Assessment. Uppsala: The Uppsala Monitoring Centre; 2005:2–7. | ||
Park JS, Cho HR, Kang MJ, Choi YS. A rapid and sensitive method to determine tacrolimus in rat whole blood using liquid-liquid extraction with mild temperature ultrasonication and LC-MS/MS. Arch Pharm Res. 2016;39(1):73–82. | ||
Julious SA. Sample sizes for clinical trials with normal data. Stat Med. 2004;23(12):1921–1986. | ||
Faessel HM, Smith BJ, Gibbs MA, Gobey JS, Clark DJ, Burstein AH. Single-dose pharmacokinetics of varenicline, a selective nicotinic receptor partial agonist, in healthy smokers and nonsmokers. J Clin Pharmacol. 2006;46(9):991–998. | ||
Serajuddin AT. Salt formation to improve drug solubility. Adv Drug Deliv Rev. 2007;59(7):603–616. | ||
Kassem MG, Hossaini AI. Varenicline. In: Brittain HG, editor. Profiles of drug substances, excipients and related methodology, New York: Academic Press. 2012;37:389–411. | ||
Korea Food and Drug Safety (KFDA). Guideline for management of bioequivalence test (KFDA Notification No. 2017-28-21). 2017. | ||
Lim HT, Balakrishnan P, Oh DH, et al. Development of novel sibutramine base-loaded solid dispersion with gelatin and HPMC: physicochemical characterization and pharmacokinetics in beagle dogs. Int J Pharm. 2010;397(1–2):225–230. | ||
El-Bagary RI, Abo-Talib NF, Mohamed MA. Novel liquid chromatographic methods for the determination of varenicline tartrate. Talanta. 2016;146:83–92. | ||
Kadi AA, Mohamed MS, Kassem MG, Darwish IA. A validated stability-indicating HPLC method for determination of varenicline in its bulk and tablets. Chem Cent J. 2011;5(1):30. | ||
Ravva P, Gastonguay MR, Tensfeldt TG, Faessel HM. Population pharmacokinetic analysis of varenicline in adult smokers. Br J Clin Pharmacol. 2009;68(5):669–681. | ||
Faessel HM, Obach RS, Rollema H, Ravva P, Williams KE, Burstein AH. A review of the clinical pharmacokinetics and pharmacodynamics of varenicline for smoking cessation. Clin Pharmacokinet. 2010;49(12):799–816. | ||
Faessel H, Ravva P, Williams K, Patanjali R, Kathryn W. Pharmacokinetics, safety, and tolerability of varenicline in healthy adolescent smokers: a multicenter, randomized, double-blind, placebo-controlled, parallel-group study. Clin Ther. 2009;31(1):177–189. |
 © 2018 The Author(s). This work is published and licensed by Dove Medical Press Limited. The full terms of this license are available at https://www.dovepress.com/terms.php and incorporate the Creative Commons Attribution - Non Commercial (unported, v3.0) License.
By accessing the work you hereby accept the Terms. Non-commercial uses of the work are permitted without any further permission from Dove Medical Press Limited, provided the work is properly attributed. For permission for commercial use of this work, please see paragraphs 4.2 and 5 of our Terms.
© 2018 The Author(s). This work is published and licensed by Dove Medical Press Limited. The full terms of this license are available at https://www.dovepress.com/terms.php and incorporate the Creative Commons Attribution - Non Commercial (unported, v3.0) License.
By accessing the work you hereby accept the Terms. Non-commercial uses of the work are permitted without any further permission from Dove Medical Press Limited, provided the work is properly attributed. For permission for commercial use of this work, please see paragraphs 4.2 and 5 of our Terms.