")
Back to Journals » International Journal of Nanomedicine » Volume 15
Green Synthesis of Zeolite/Fe2O3 Nanocomposites: Toxicity & Cell Proliferation Assays and Application as a Smart Iron Nanofertilizer
Authors Jahangirian H , Rafiee-Moghaddam R , Jahangirian N, Nikpey B, Jahangirian S, Bassous N, Saleh B , Kalantari K, Webster TJ
Received 19 September 2019
Accepted for publication 28 January 2020
Published 13 February 2020 Volume 2020:15 Pages 1005—1020
DOI https://doi.org/10.2147/IJN.S231679
Checked for plagiarism Yes
Review by Single anonymous peer review
Peer reviewer comments 2
Editor who approved publication: Prof. Dr. Anderson Oliveira Lobo
Hossein Jahangirian, 1 Roshanak Rafiee-Moghaddam, 1 Narges Jahangirian, 2 Bahareh Nikpey, 3 Siavash Jahangirian, 4 Nicole Bassous, 1 Bahram Saleh, 1 Katayoon Kalantari, 1 Thomas J Webster 1
1Department of Chemical Engineering, College of Engineering, Northeastern University, Boston, MA 02115, USA; 2Instrumentation and Control Department, Faculty of Electrical and Computer Engineering, IA University, Tehran North Branch (TNB), Tehran, Iran; 3Department of Agronomy and Plant Breeding, Faculty of Engineering and Agriculture, Science and Research Branch, IA University, Tehran, Iran; 4Department of Agronomy, Faculty of Agriculture, IA University, Tehran, Iran
Correspondence: Hossein Jahangirian
Department of Chemical Engineering, College of Engineering, Northeastern University, 360 Huntington Avenue, Boston, MA 02115, USA
Tel +1 617 860 8429
Email [email protected]
Purpose: The aim of this study was to prepare zeolite/iron (III) oxide nanocomposites (zeolite/Fe 2O 3–NCs) as a smart fertilizer to improve crop yield and soil productivity.
Methods: Zeolite/Fe 2O 3–NCs were successfully produced by loading of Fe 2O 3-NPs onto the zeolite surface using a quick green precipitation method. The production of zeolite/Fe 2O 3 nanocomposites was performed under a mild condition using environmentally friendly raw materials as a new green chemistry method. The product was characterized using several techniques such as near and far Fourier-transform infrared spectroscopy (FT-IR), powder X-ray diffraction (PXRD), energy-dispersive X-ray spectroscopy (EDX), scanning electron microscopy (SEM) and transmission electron microscopy (TEM).
Results: The results confirmed the formation of Fe 2O 3-NPs with mean particle sizes of 1.45, 2.19, and 2.20 nm on the surface of the zeolite per amount of 4, 7 and 12 wt% Fe 2O 3–NPs, respectively. Such results indicated that the size of the Fe 2O 3-NPs did not significantly change when Fe amounts increased from 7 to 12 wt% for the zeolite/Fe 2O 3–NCs. In terms of medical applications, in vitro cell studies demonstrated that zeolites and zeolite/Fe 2O 3–NCs were generally non-toxic to human fibroblast cells and significantly pernicious to human malignant melanoma cells. From MTS cytotoxicity assays, the concentration of Fe 2O 3 within the zeolite/Fe 2O 3–NCs that was effective at inhibiting the growth of malignant melanoma cells by 50% (the IC50 value) was ∼ 14.9 wt%. The three types of nanocomposites were further tested as an iron smart nanofertilizer for the slow-release of iron ions.
Conclusion: Advantages of this project include the production of non-toxic nanocomposites as a smart fertilizer to develop crops while the reaction involves the use of commercial and natural materials as low-cost raw materials with low energy usage due to a mild reaction condition, as well as the use of an environmentally friendly solvent (water) with no toxic residues.
Keywords: green chemistry, iron (III) oxide nanoparticles, zeolite, zeolite/iron (III) oxide nanocomposites, smart nanofertilizer, melanoma, cell proliferation assays
Introduction
In recent decades, nanocomposites have been attractive to numerous researchers due to their interesting tailorable properties (such as electrical, mechanical, chemical and biological properties) and wide applications across all of science and industry. Nanocomposites involve different aspects of science and technology and can play an important role in human life. They have been widely used as materials with photodegradation properties;1 gas sensors2,3 and biosensors for the detection of antimalarial drugs,4 glucose,5 DNA,6,7 anticancer agents8,9 as well as antibacterial and antifungal agents;10,11 efficient photocatalytic oxidation of arsenite,12 olefin epoxidation,13 and biodiesel;14 agents for drug delivery,15,16 waste water treatment,17 components in satellite and space science;18 and as materials in army science and associated industries.19 Due to their exceptional greater surface area, of all of the nanomaterials available, zeolites have attracted a large amount of interest. Zeolites are microporous, aluminosilicate compounds widely used in nanocomposites as homogeneous polymer–zeolite membranes,20 catalysts for oxidation,21 superconductors,22 water and wastewater treatment agents,23 and electrochemical biosensors for in vivo electrochemical measurements.24 For all of the above-mentioned nanocomposites, the large internal and external surface area of zeolites lead to unique properties of other materials when attached to zeolites to improve or more effectively change other exciting properties.
Iron (III) oxide nanoparticles have received a lot of attention as they are very stable metal oxides with attractive biological properties. Recently, iron (III) oxide nanoparticles have been added to other materials to make nanocomposites,25–28 with more effective properties compared with their free state. Iron (III) oxide is often synthesized and used as nanoparticles in nanocomposites. There are many methods for synthesizing and coating them in/on nanocomposites including sol-gel methods,29 thermal methods,30 electrochemical synthesis methods,31 dispersing γ-Fe2O3 in the oil phase and microemulsion polymerization methods,32 polymeric polyoxocarbosilane shells32 and the tunable and scalable metal-organic framework (MOF)-templated strategies.25
There are many other methods33–36 which have been used for the synthesis of various Fe (III) oxide nanocomposites, but expensive and hazardous raw materials or solvents are often involved, they involve difficult reaction conditions, or the waste of a high level of energy involved makes these methods undesirable. In order to realize the full potential of Fe-based nanoparticles, it is clear that new methods of synthesizing Fe-based nanoparticles are needed which are quick, inexpensive, and use environmentally friendly chemicals.
In this project, Fe2O3-NPs were synthesized on the surface of zeolites as a nano thin layer coating for producing zeolite/Fe2O3 nanocomposites. For this purpose, we performed a quick precipitation of Fe2O3-NPs on the zeolite surface. The reaction was performed in just one step under ambient conditions, using very inexpensive raw materials and non-hazardous, environmentally safe solvents. This new green chemistry method for the synthesis of zeolite/Fe2O3 nanocomposites should increase the utilization of Fe-based nanoparticles across numerous industries. For example, in the upcoming decades, there will be increasing demands to produce food for a growing world population and agriculture will face challenges to provide food without impacting the environment. Therefore, it will be necessary to use modern technologies to produce fertilizers with high performance and decrease the negative impacts on the environment.37 Nanofertilizers, as smart fertilizers, are designed to efficiently increase nutrient use and consequently reduce adverse effects to the environment compared to the application of conventional mineral fertilizers.37–39
Smart fertilizers based on slow-/controlled-release and/or carrier delivery systems have been shown to improve crop yields, soil productivity, and lower nutrient loss compared with conventional fertilizers. Several materials (such as clays, nanoclays, nondegradable and degradable polymers, and agricultural waste) are suitable for the development of smart fertilizers by acting as carrier matrices for nutrients and bacterial inoculants.37 According to a prior literature article,40 there are three main types of nanofertilizers: nanoscale fertilizers (synthesized with nanoparticles), nanoscale additives (bulk products with nanoscale additives), and nanoscale coatings or host materials (a product coated with nanopolymers or loaded with nanoparticles). Mineral nutrients required for plant nutrition can be encapsulated inside nano-materials (such as nanotubes or nanoporous materials), coated with a thin protective polymer film, or in nanoscale particles.41,42
Slow-release nanofertilizers and nanocomposites are suitable alternatives to soluble fertilizers. Nutrients are released at a slower rate, thereby reducing loss.43 A slow release of nutrients in the environment could be achieved by using zeolites (natural clays), which act as a reservoir for nutrients that are released slowly.42
In this study, we used our synthesized product (zeolite/Fe2O3 nanocomposites) as a smart fertilizer to release (slow-release) iron ions as an important nutrient for plants. Moreover, we demonstrate the biocompatibility, as well as the anticancer potential, of these compounds as-applied to in vitro cell culture systems at varying concentrations of the iron oxide constituent. Indeed, while fertilizers, such as those containing nitrogen, have been linked to the increasing accumulation of toxic elements in the environment, as well as with the occurrence of certain cancers in humans, the zeolite/Fe2O3 nanocomposites investigated herein were shown to in fact reduce the viability of human melanoma cells.44,45 Previous studies have provided a relationship between iron oxide nanoparticle surface chemistry and their use in cancer therapeutics or as diagnostic tools.46,47 For instance, Nagajyothi et al demonstrated that α-Fe2O3 nanoparticles produced by a green synthesis route were cytotoxic towards renal carcinoma Caki-2 cells without imposing apoptosis or growth inhibition in normal kidney epithelial cells.47 In the work of Shanmugasundaram et al, bio-synthesized superparamagnetic iron oxide nanoparticles potently impacted the growth of cervical cancer (HeLa) cells and possessed an IC50 value of 78.42 μg/mL per in vitro tests.48 Therefore, this present research could potentially influence the commercialization of a novel class of smart fertilizers that are environmentally friendly, inexpensive, and cancer or other disease preventatives.
Materials and Methods
Materials
Synthetic zeolites (96096, Potassium, 3A° type) were purchased from Sigma-Aldrich, USA. Commercial zeolites (Clinoptilolite type) were purchased from Helitropfen, Germany (origin was a Narvik mine in Norway). Further, another commercial zeolite (Desica AC130 type) was prepared from Hitech Silicate Co, IRAN. FeCl3·6H2O was purchased from Merck (Germany) and NaOH was obtained from Sigma-Aldrich, USA. Cells that were assayed for their in vitro compatibility with the test specimens, including Detroit 551 human dermal fibroblasts (HDF, CCL-110) and A375 human malignant melanoma cells (HMM, CRL-1619), were obtained from the American Type Culture Collection (ATCC: Manassas, VA, USA). Supplements and reagents for cell culture included Dulbecco’s Modified Eagle’s Medium (DMEM; ATCC: Manassas, VA, USA), fetal bovine serum (FBS; Gibco, Life Technologies, Gaithersburg, MD, USA), trypsin-EDTA (Gibco, Life Technologies: Gaithersburg, MD, USA), and MTS [3-(4,5-dimethylthiazol-2-yl)-5-(3-carboxymethoxyphenyl)-2-(4-sulfophenyl)-2H-tetrazolium, inner salt; Promega: Madison, WI, USA].
Synthesis of Zeolite/Fe2O3–Nanocomposites (NCs)
In this method, the synthesis of Fe2O3–NPs and their loading onto the zeolite surfaces was simultaneously carried out for producing the zeolite/Fe2O3–NCs (termed product). For this, 10.0 g of zeolites were added to a beaker with 100 mL of distilled water. The mixture was stirred for about 15 mins to wet the zeolite and obtain a homogenate suspension. After that, a defined volume with defined concentrations of FeCl3 solutions was added into the suspension and stirred for 40 mins. Then, about 50 mL of a 2.5 M NaOH solution was slowly added while the mixture was vigorously stirred for another 30 mins. The reaction mixture was then filtered to separate the product from the liquid phase. The synthesized product (zeolite/Fe2O3–NCs) was washed with distilled water and finally was air dried at room temperature. All steps of the experiments were completed at ambient conditions. The experiments were carried out using different amounts of FeCl3 solutions while the amounts of zeolites were constant as the Fe2O3–NP amount in the product was 1%, 4%, 7%, 12% and 17%. Finally, the products obtained from the mixture of five different synthesis processes for each Fe2O3–NP amount (1%, 4%, 7%, 12% and 17%) were used for the following characterization studies.
Characterization Methods
Fourier transform infrared (FT-IR) spectroscopy was used to characterize the chemistry of the nanocomposites and the FT-IR spectra were recorded in the range of 400–4000 cm−1 and 100–700 cm−1 utilizing a Perkin Elmer GX-FT-IR spectrophotometer. Transmission electron microscopy (TEM) was used to measure the particle size and morphology of the synthesized products (zeolite/Fe2O3–NCs). In this case, a drop of the suspended material in distilled water was dripped onto a covered copper grid and then TEM observations were performed using a Hitachi H‒7100 electron microscope. After that, nanoparticle size distributions were estimated using UTHSCSA Image Tool software, version 3.00. Scanning electron microscopy (SEM) was also used to observe, study and compare the zeolite and zeolite/Fe2O3–NCs morphology. SEM with energy dispersive X-ray fluorescence (EDXF) spectroscopy was carried out utilizing a JEOL, JSM‒7600F instrument. In addition for determining the crystallinity of the samples, powder X-ray diffraction (PXRD) with Cu Kα radiation was used.
In vitro Human Fibroblast and Melanoma Cell Proliferation Assays
In order to evaluate the influence of the zeolites and zeolite/Fe2O3–NCs on mammalian cells, in vitro cell proliferation assays were designed and implemented. Detroit 551 human dermal fibroblasts (HDF, CCL-110; American Type Culture Collection) and A375 human malignant melanoma (HMM, CRL-1619; America Type Culture Collection) cells, with passage numbers ranging from 4 to 10, were cultured under normal conditions (5% CO2 and 37°C) before being seeded into the wells of 96-well plates at a concentration of 5000 cells/well. HDF and HMM cells were maintained using filtered (bottle-top vacuum filter systems, 0.22 μm pore size; Corning Inc.) Dulbecco’s Modified Eagle’s Medium (DMEM; ATCC), supplemented with 10% of fetal bovine serum (FBS; Gibco, Life Technologies) and 1% of penicillin-streptomycin (10,000 U/mL; ThermoFisher Scientific). The cells were grown inside pre-treated 75 cm2 polystyrene tissue-culture flasks (Falcon, Corning Inc.), and the cell media were carefully replaced every 48–72 hrs under a sterile biological cabinet. Cell proliferation assays were initiated when cells achieved ~80% confluency. To detach cells from their culture flasks, a 0.05% solution of trypsin-EDTA (Gibco, Life Technologies) diluted in PBS was injected to completely cover the cell-layered surfaces and evacuated after 2 mins of cell flask incubation at 5% CO2 and 37°C. Cell counting was performed manually under an optical microscope using a standard thermal and shock-resistant glass hemocytometer (Bright-Line, Reichert, Inc.). HDF and HMM cells were diluted separately to final concentrations of 50,000 cells/mL in DMEM media. Cells were seeded at a concentration of 5000 cells per well inside 96-well plates, in triplicate, and were allowed to grow over a period of 24 hrs inside a 5% CO2 and 37°C incubator.
Following the 24 hr cellular attachment and proliferation period, adherent HDF and HMM cells were treated using test samples suspended in DMEM media. Treatments in media consisted of zeolites and zeolite/Fe2O3–NCs at concentrations of 1%, 4%, 7%, 12%, and 17% by weight, which were added to the cell-seeded surfaces in 100 μL aliquots per well. A 24 hr incubation period was selected to evaluate the proliferation of HDF and HMM cells, thus, treated with media containing the zeolite and Zeolite/Fe2O3–NCs supplements. At the completion of the incubation time point, the particle suspensions were aspirated, and cell surfaces were washed twice using PBS to remove the residual zeolite or zeolite/Fe2O3–NCs particles. A 16.7% v/v MTS [3-(4,5-dimethylthiazol-2-yl)-5-(3-carboxymethoxyphenyl)-2-(4-sulfophenyl)-2H-tetrazolium, inner salt; Promega] solution (1 mL MTS: 5 mL DMEM-F12) was prepared and injected (100 μL) into the test wells containing the pre-treated cells. The 96-well plates were left in a humidified incubator at 5% CO2 and 37°C for 3 hrs. After the reduction of the tetrazolium compound, absorbance readings were obtained at λ = 490 nm using a spectrophotometer (SpectraMax M Series; Molecular Devices). All procedures involving MTS were performed in the dark to avoid the discoloration of the reagent due to light-sensitivity. The MTS procedures were performed on three replicates of each sample type. A half maximal inhibitory concentration, IC50, of ~14.9 wt% of Fe2O3 within the composite structure was calculated for restricting malignant melanoma cell growth up to 50%. Optical density values obtained by microplate analysis were converted to cell numbers using unique standard cell curves.
The cell culture procedure and MTS assays were carried out based on the “CellTiter 96® Aqueous One Solution Cell Proliferation Assay Technical Bulletin #TB245, Promega Corporation.”
This experiment was also carried out with the zeolite/Fe2O3–NCs synthesized from a commercial zeolite (Clinoptilolite type) from Helitropfen, Germany (the origin was a Narvik mine in Norway).
MTS cell viability results were depicted as the mean ± the standard error of the mean, and all experiments were performed in triplicate to indicate significance values (N=3). A one-way analysis of variance was performed to evaluate the differences in the means between data points and to calculate P-values, with p<0.01 being statistically significant.
Slow-Release of Iron Ions from the Zeolite/Fe2O3–NCs
For this purpose, at a first step, 20 g of Zeolite/Fe2O3–NCs was mixed in 100 mL of distilled water and was gently stirred for 24 hrs. Then, the mixture was filtered, and the filtrate was used to determine the dissolved iron ions. In the next step, the separated Zeolite/Fe2O3–NCs from the first step were mixed again in 100 mL of distilled water and the experiment and procedure continued like the first step. Then, this experiment was carried out 20 times over 20 days. Finally, a curve of iron ion concentration in the filtrate over the 20-day period was drawn.
This experiment was carried out on the synthesized zeolite/Fe2O3–NCs from three types of zeolites including: 1 – Synthetic zeolite (96096, Potassium, 3A° type) from Sigma-Aldrich, USA; 2 – Commercial zeolite (Clinoptilolite type) from Helitropfen, Germany (origin was a Narvik mine in Norway); and 3 – Commercial zeolite (Desica AC130 type) from Hitech Silicate Co, IRAN. Also, the amount of Fe2O3–NPs was 12% for the three types of synthesized zeolite/Fe2O3–NCs. Measurements of iron ion concentrations were performed as the mean ± the standard error of the mean, and all experiments were performed in triplicate to indicate significance values (N=3). A one-way analysis of variance was performed to evaluate the differences in the means between data points and to calculate P-values, with p<0.01 being statistically significant then the average results were used in drawing the curve.
Results
Synthesis of Zeolite/Fe2O3–NCs
The formulation of the zeolite used in the reaction was 96096, Potassium, a 3A° type. The molecular structure includes silicon oxide, aluminium oxide, sodium oxide potassium oxide and water. The diameter of the zeolite pores was about 3Å (this is based on the company product label).
(Zeolite) (0.6) K2O: (4.0) Na2O: (1.0) Al2O3: (2.0 to 2.1) SiO2: (X) H2O
As described, in the first step, the zeolite was mixed with water to wet the zeolite surface (both the external zeolite surface and the internal surface of the zeolite pores). In this condition, the zeolite will be active as an ion exchanger due to the hydration of sodium and potassium ions on the zeolite surface. In the next step, iron (III) ions were replaced with K+ and Na+ on the zeolite surface due to mixing of the reaction mixture (hydrated zeolite) with the FeCl3 solution. In the final step, the NaOH solution was added to the reaction mixture to precipitate iron (III) oxide nanoparticles on the zeolite surface and finally obtaining zeolite/Fe2O3–NCs. Figure 1 shows a simplified mechanism of the zeolite/Fe2O3–NCs synthesis.
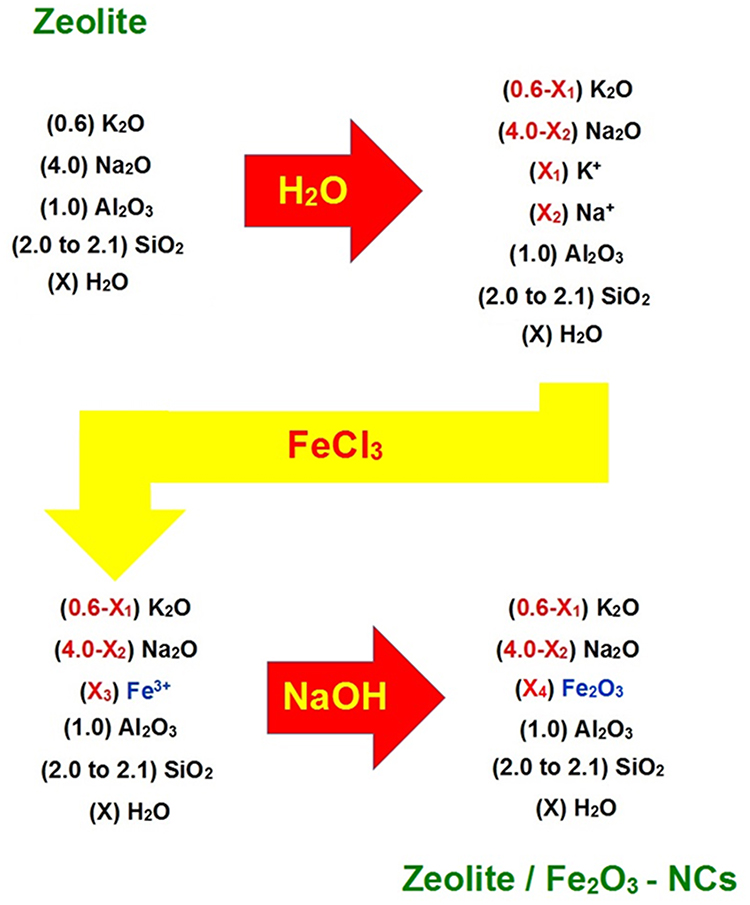 |
Figure 1 The simplified reaction mechanism of the zeolite/Fe2O3–NCs synthesis used in the present study. [X3 = 3(X1 + X2)/2] and [X4 = 3(X1 + X2)/4]. |
FT-IR Spectroscopy
Near FT-IR Spectroscopy
Figure 2 shows the near FT-IR spectra of the zeolites (A) and the zeolite/Fe2O3–NCs (B). By studying the near FT-IR spectra in the 700 to 4000 cm-1 region, it can be seen that there were not any significant differences between the zeolite/Fe2O3–NCs spectra (B) and the zeolite (A) spectra. Figure 2A indicates that the zeolite structure was not changed due to its stability and non-breakability under the reaction conditions.
The peak that appeared at 3628 cm−1 for both the zeolite spectra (A) and the zeolite/Fe2O3–NCs spectra (B) corresponded to the terminal silanol groups on the external surface of the zeolite crystals which overlapped with the O-H stretching peak in the 3100 to 3500 cm−1 spectral regions. The O-H bending vibration peak appeared in the 1674 cm−1 region. The stretching and bending peaks of Si-O and Al-O from the zeolite structure appeared in the 900 to 1200 cm−1 region. The peak in the 1122 cm−1 region corresponded to the asymmetric and symmetric stretching modes of the internal tetrahedral Si (-O)3 and Al (-O)3 structure while the peaks around 1017 cm−1 corresponded to the asymmetric and symmetric stretching modes of their external linkages. Figure 2 also shows 400 to 700 cm−1 spectral regions and that there are slight variations between the zeolite/Fe2O3–NCs spectra (B) and the zeolite spectra (A) due to the iron (III) nanoparticles.49–51
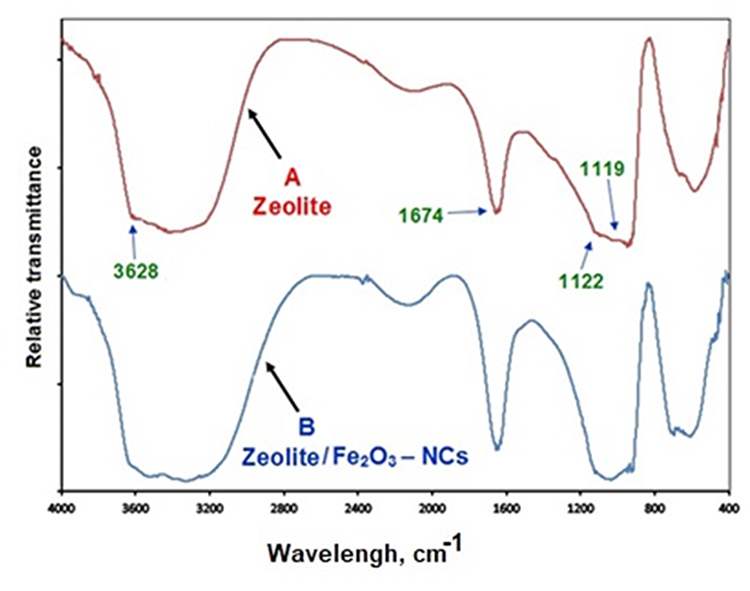 |
Figure 2 The near FT-IR spectra of zeolite (A) and zeolite/Fe2O3–NCs (B). |
Far FT-IR Spectroscopy
The FT-IT peaks of iron (III) oxide usually appear in the far infra-red spectra region. Thus, the far FT-IR spectroscopy technique was used for recognizing iron (III) oxide in the synthesized product (zeolite/Fe2O3–NCs).
Figure 3 shows the far FT-IR spectra of the zeolite (a) and zeolite/Fe2O3–NCs (b). Figure 3 also shows which peaks appeared in the zeolite/Fe2O3–NCs spectra (b) while they were not in the zeolite spectra (a) so they could be due to the presence of iron (III) oxide in the product.
The peaks for the zeolite/Fe2O3–NCs spectra (b) which appeared in the spectral regions 633 (A), 615 (B) and 585 (C), 543 (D), 530 (E), 518 (F), 480 (G) and 330 (H) cm−1 correspond to Fe3+-O and bonds from Fe2O3 as confirmed by other investigators.52–54 Also, the peaks in the spectral regions 358 (I), 205 (J) and 160 (K) cm−1 may belong to the iron (III) oxide bond because they did not appear in the zeolite spectra (a).
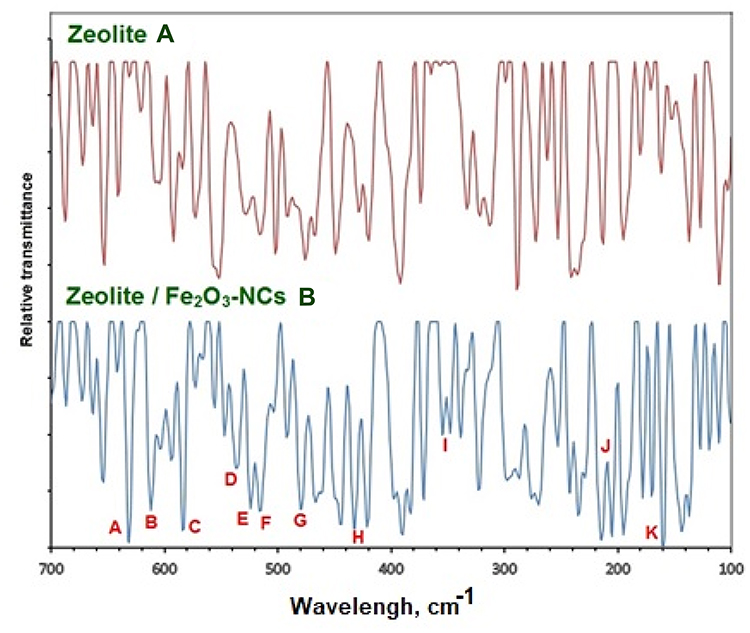 |
Figure 3 The far FT-IR spectra of zeolite (A) and zeolite/Fe2O3–NCs (B). |
Powder X-Ray Diffraction (PXRD)
Figure 4 shows the PXRD patterns for the zeolite (a) and zeolite/Fe2O3–NCs (b-f). They were obtained by scanning in the small-angle range of 2θ (15–25°).
The data from zeolite (a) and zeolite/Fe2O3–NCs (b-f) pattern peaks indicate that the zeolite crystalline structure did not changed under the iron (III) oxide synthesis conditions. The (b-f) pattern peaks also show that the intensity of the zeolite peaks decreased while the amount of iron (III) oxide-NPs increased due to a thorough covering of the zeolite surface by Fe2O3-NPs. The zeolite peaks appeared at 2θ of 30.92°, 32.66°, 34.16°, 41.66°, 42.98°, 43.64°, 44.26°, 47.44°, 47.96°, 49.82°, 52.26°, 54.36°, 56.56°, 57.68°, 58.74°, 66.82°, 71.14°, and 73.04°. This pattern is very similar to the report of Treacy and Higgins55 and Roland and Higgins56 results for the collection of simulated XRD powder patterns for zeolites.
The PXRD patterns of Fe2O3-NPs (b–f) shown in Figure 4 also demonstrated that the intensity of the iron (III) oxide peak increased while the amount of Fe2O3-NPs on the zeolite/Fe2O3–NCs increased as well due to coating of the Fe2O3-NPs on the zeolite surface. The Fe2O3-NPs crystalline peak appeared at 2θ° of 35.65° as related to the 110 crystallographic planes of the face-centered cubic (fcc) iron oxide nanocrystals (Ref. Code Fe2O3: 01-073-0603). Other research groups reported similar Fe2O3-NPs crystalline peak PXRD patterns for SiO2/TiO2 and SiO2/Fe2O3 nanocomposites (Ehrman et al 1999) and for the nano-crystalline Fe2O3–Cr2O3 solid solution.57 Finally, the results obtained for the PXRD patterns clearly indicated that the zeolite/Fe2O3–NCs were successfully synthesized here.
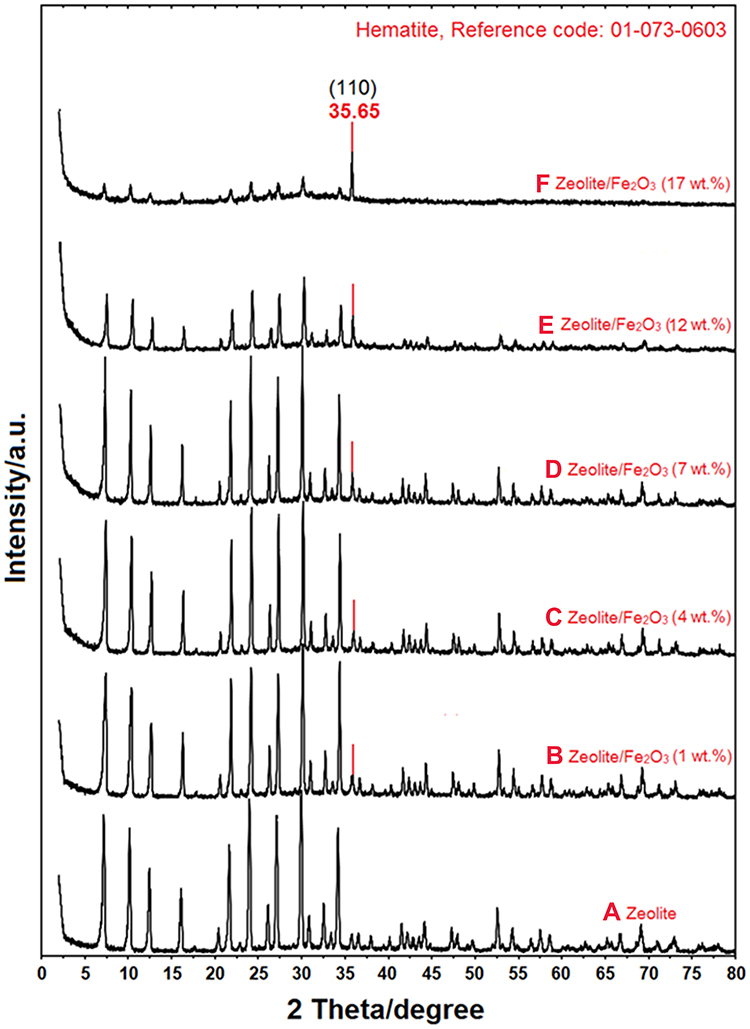 |
Figure 4 PXRD patterns of zeolite (A) and zeolite/Fe2O3–NCs with Fe2O3–NP amounts in the product of 1% (B), 4% (C), 7% (D), 12% (E) and 17% (F). |
Scanning Electron Microscopy (SEM)
The scanning electron microscopy (SEM) images of the zeolite (A) and zeolite/Fe2O3–NCs (B–F) are shown in Figure 5. The cubic shape of the particles due to the zeolite structure did not change and occurred simply as gradually particles aggregated when various amounts of iron (III) oxide coated the zeolite surface for the formation of zeolite/Fe2O3–NCs. This fact once again confirms the results obtained from FT-IR spectroscopy and PXRD analysis. Figure 5 clearly illustrates some nanoparticle aggregation occurred due to the synthesis of iron (III) oxide on the zeolite surface. Additionally, the SEM pictures of (B) to (F) showed that the thin layer of Fe2O3-NPs on the surface of cubic zeolite particles was thicker while the amount of iron (III) oxide increased in the product.
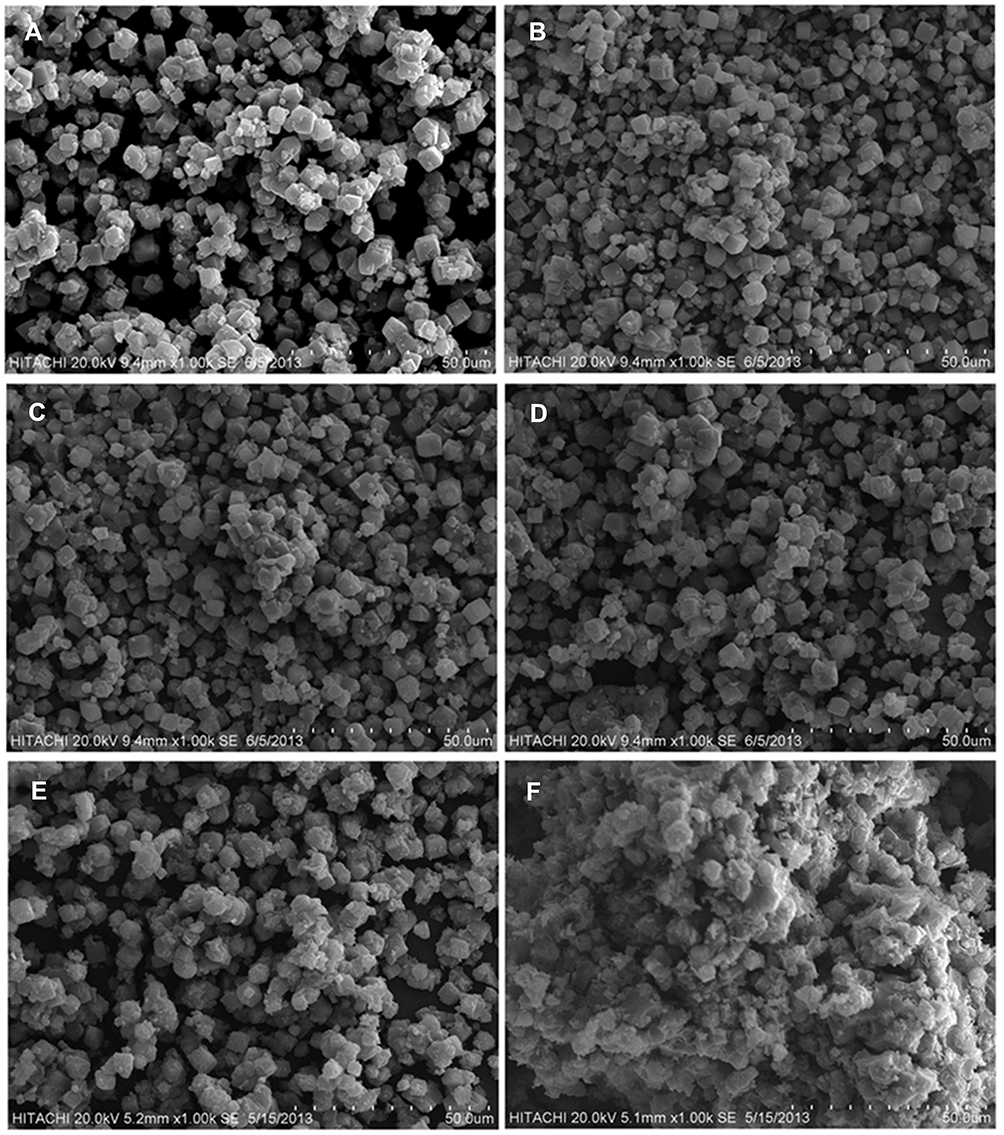 |
Figure 5 SEM of zeolite (A) and zeolite/Fe2O3–NCs with Fe2O3–NP amounts in the product of 1% (B), 4% (C), 7% (D), 12% (E) and 17% (F). |
Energy Dispersive X-Ray Spectroscopy (EDX)
The energy dispersive X-ray (EDX) analytical technique was used for determining the elemental analysis of the product (zeolite/Fe2O3–NCs). The data from the EDX spectra of the zeolite (A) in Figure 6 shows that the binding energy peaks for O, Na, Al and Si appear at 0.52, 1.03, 1.47 and 1.72 keV, respectively. On the other hand, these peaks appear for the zeolite/Fe2O3–NCs (B–F) spectra too; this fact indicates that all these relevant elements were present for all of the products (zeolite/Fe2O3–NCs with different amounts of iron (III) oxide).
The EDX spectra of the zeolite/Fe2O3–NCs (B–F) in Figure 6 also showed three peaks appeared at 0.72, 6.37 and 7.03 keV. These peaks clearly indicate the presence of iron (III) oxide in the zeolite/Fe2O3–NCs. In numerous papers, research such as58,59 reported similar EDX results for the Fe2O3- NP binding energies of iron (III) oxide.
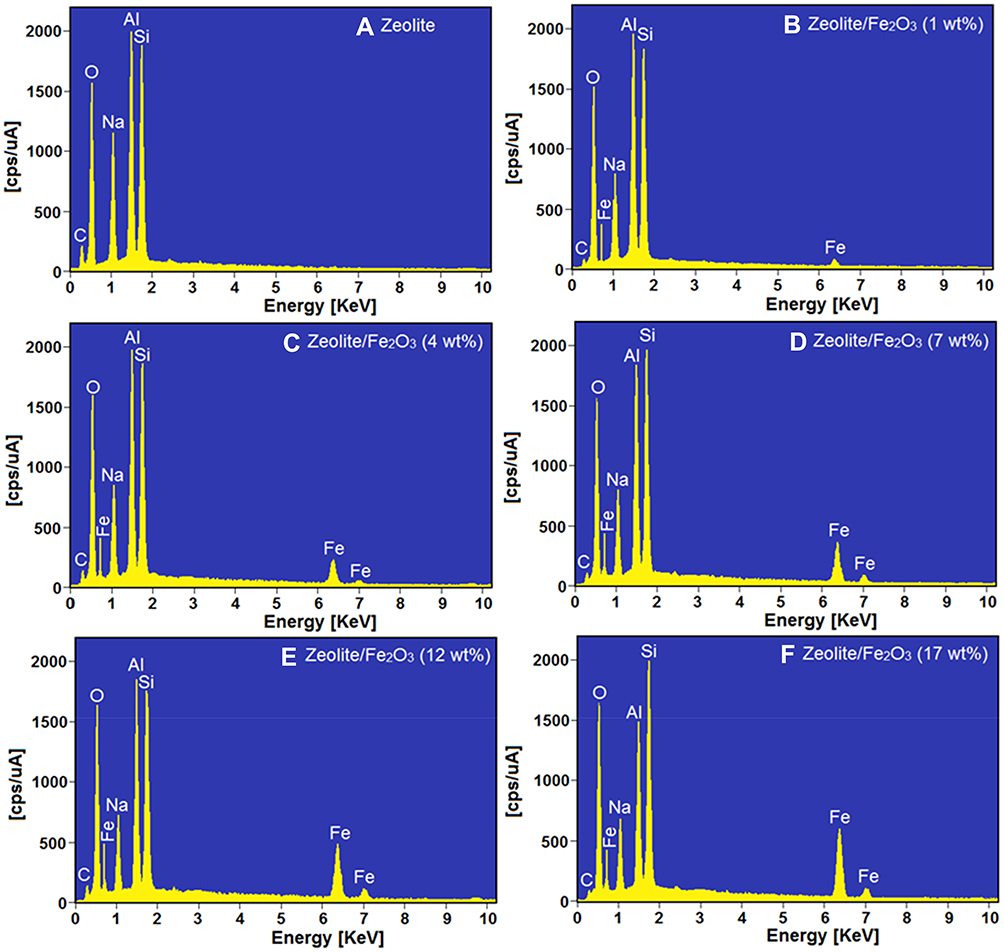 |
Figure 6 EDX spectra of zeolite (A) and zeolite/Fe2O3–NCs with Fe2O3–NP amounts in the product of 1% (B), 4% (C), 7% (D), 12% (E) and 17% (F). |
Transmission Electron Microscopy (TEM)
The TEM images and the distribution histogram of particle sizes of iron (III) oxide nanoparticles in the product (zeolite/Fe2O3–NCs) are shown in Figure 7(A–D). For this purpose, suspensions of the product in distilled water were prepared using a sonicator and, after that, a drop of the suspended product was placed onto a covered copper grid in which TEM observations were then carried out by taking pictures from the edges of the nanocomposite particles. The TEM images of the product with various amounts of iron (III) oxide indicated that the Fe2O3–NPs sizes increased as the amount of iron in the product increased. In addition, Fe2O3–NPs on the zeolites appeared as spherical particles. The TEM images also showed that the mean diameters of Fe2O3–NPs were 1.45 ± 0.243 nm (obtained from 41 particles in the image (A)), 2.19 ± 0.51 nm (obtained from 38 particles in the image (B)) and 2.20 ± 0.332 nm (obtained from 33 particles in the image (C)) while the concentration of Fe2O3–NPs in the product was 4, 7 and 12 wt%, respectively.
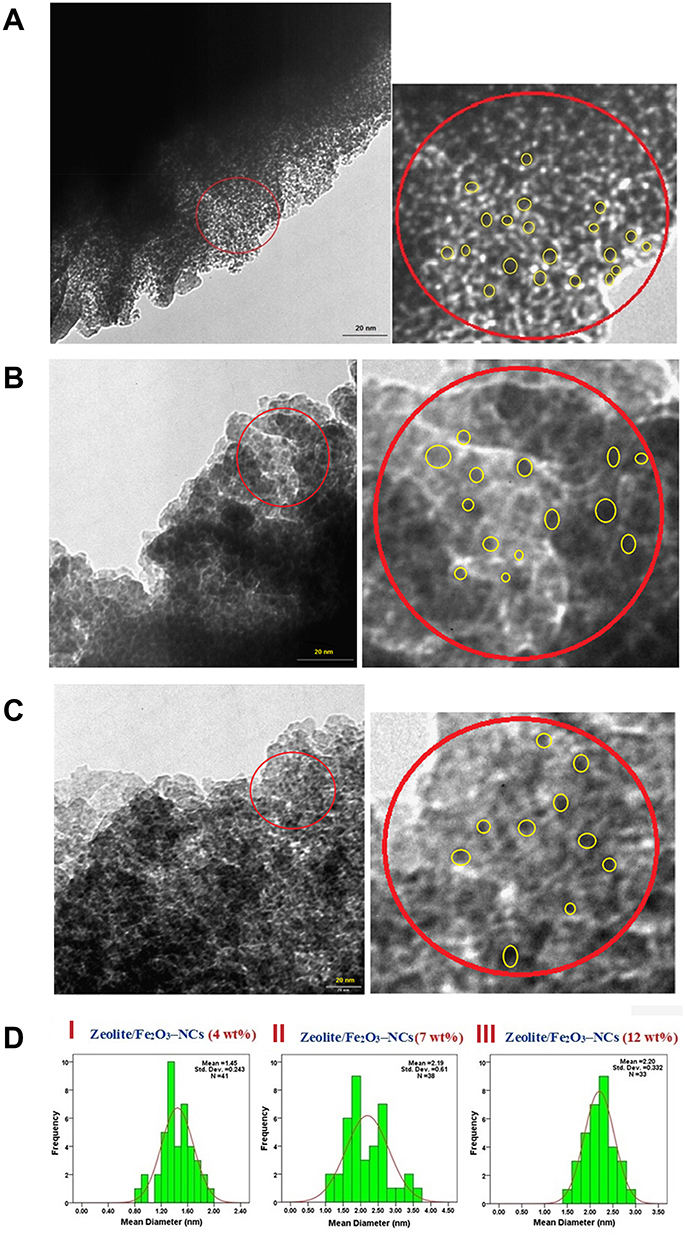 |
Figure 7 (A) TEM image of the zeolite/Fe2O3–NCs with Fe2O3–NP amount in the product of 4%. (B) TEM image of the zeolite/Fe2O3–NCs with the Fe2O3–NPs amount in the product of 7%. (C) TEM image of the zeolite/Fe2O3–NCs with the Fe2O3–NPs amount in the product of 12%. (D) Histograms of the zeolite/Fe2O3–NCs with Fe2O3–NP amounts in the product of 4% (I), 7% (II) and 12% (III). |
Toxicity Assays with Zeolite/Fe2O3–NCs to HDF and HMM Proliferation
In vitro cell studies demonstrated that zeolites and zeolite/Fe2O3–NCs were generally non-toxic to human fibroblast cells and significantly pernicious to human malignant melanoma cells. The results and the trends are displayed in Figure 8.
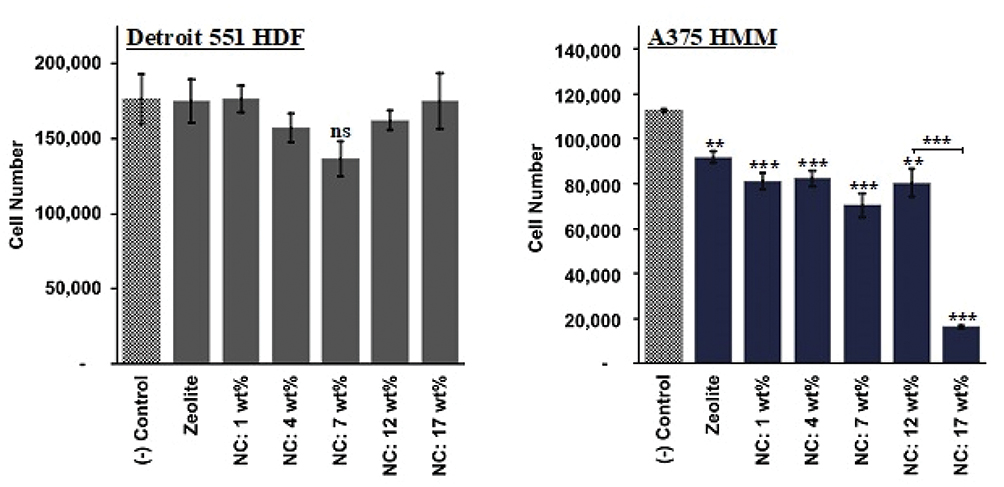 |
Figure 8 MTS assay results depicting HDF and HMM cell proliferation, following the exposure of cells to zeolite and zeolite/Fe2O3–NCs suspensions in cell culture media for 24 hrs. Data = mean ± SEM: N=3; ***p≤0.001 and **p≤0.01 compared to controls unless otherwise indicated and ns, p>0.05. |
In short, while HDF cells remained 80–100% viable across varying Fe2O3–NPs amounts, HMM cells were 82.7% viable when exposed to bare zeolites, and the viability ratio dropped significantly for HMM cells that were treated using zeolite/Fe2O3–NCs. At the highest Fe2O3–NPs amounts (17 wt%), HMM cells were only 19.4% viable. These data indicate that bare zeolites have the capacity to suppress melanoma cancer cell growth, without significantly influencing the proliferation of the non-cancerous fibroblast cell counterparts. In fact, it has been previously shown that synthetic zeolites subdue melanogenesis by supporting the degradation of the microphthalmia-associated transcription factor.60 This suppressive ability can be reinforced with the introduction of Fe2O3–NPs to the zeolite body, and it is inferred from the MTS data that zeolites and Fe2O3–NPs interact synergistically to inhibit melanoma cell growth, without significantly altering the metabolic rates of non-cancerous healthy HDF cells. The weakening of the melanoma cells, due to the zeolite-cell interactions, drives the cell-disruptive behavior of the Fe2O3–NPs.
Slow Release of Iron Ions from Zeolite/Fe2O3–NCs as a Smart Fertilizer
The curve of iron ions released from the three types of zeolite/Fe2O3–NCs against time is shown in Figure 9. As explained in the material section, three types of zeolite/Fe2O3–NCs were synthesized from the three types of zeolites as: 1 – Synthetic zeolite (96096, Potassium, 3A° type) from Sigma-Aldrich, USA; 2 – Commercial zeolite (Clinoptilolite type) from Helitropfen, Germany (origin was a Narvik mine in Norway); and 3 – Commercial zeolite (Desica AC130 type) from Hitech Silicate Co, IRAN.
The results obtained from the curve of iron ion release showed that the amounts of released iron ions against time were almost constant and is a linear curve with a gentle slope towards reducing iron ion concentrations. This behavior is due to the regulatory role of zeolite/Fe2O3–NCs for releasing iron ions which is due to the equilibrium of iron ions between zeolites and iron oxide nanoparticles which are zeolite/Fe2O3–NCs builders. In fact, the zeolites play a role as a chelating agent in the equilibrium of iron ion and iron oxide. It could be concluded that the produced Zeolite/Fe2O3–NCs can be recognized as a smart iron fertilizer. Also Figure 9 shows that the amounts of iron ion concentration released from three types of zeolite/Fe2O3–NCs are different due to difference between the ion iron-chelating power of the three types of zeolites that consequently can be due to difference in molecular structure, particle size and interaction of the active surface of the three types of zeolites. Iron ion concentration measurements were performed three times at all stages of the experiment and the average results were used in drawing the curves in Figure 9.
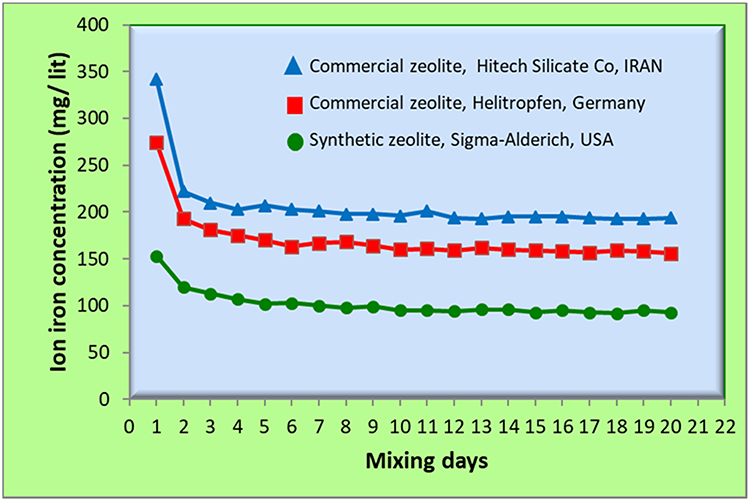 |
Figure 9 Slow-release of iron ions from the three types of zeolite/Fe2O3–NCs against mixing time. Three types of zeolite/Fe2O3–NCs were synthesized from three types of zeolites as: 1 – Synthetic zeolite (96096, Potassium, 3A° type) from Sigma-Aldrich, USA; 2 – Commercial zeolite (Clinoptilolite type) from Helitropfen, Germany (origin was a Narvik mine in Norway); and 3-Commercial zeolite (Desica AC130 type) from Hitech Silicate Co, IRAN. |
Discussion
In this research, a green chemistry method was developed here and used for the preparation of zeolite/iron (III) oxide nanocomposites (zeolite/Fe2O3–NCs) with iron (III) nanoparticles (Fe2O3–NPs) on the surface of zeolites. The reaction was carried out by the quick precipitation of Fe2O3–NPs from an aqueous suspension of zeolite and ferrous chloride aqueous solutions using a sodium hydroxide aqueous solution. The advantages of this reaction involved the use of low-cost raw materials, low energy usage due to a mild reaction condition, as well as the use of an environmentally friendly solvent (water) with no toxic residues.
The transmission electron microscopy (TEM) results successfully confirmed the formation of Fe2O3-NPs on the surface of the zeolite with mean particle sizes of 1.45 ± 0.243, 2.19 ± 0.51 and 2.20 ± 0.332 nm when the amounts of Fe2O3–NPs in the product were 4, 7 and 12 wt%, respectively. Fourier transform infrared spectroscopy (FT‒IR) confirmed the formation of zeolite/Fe2O3–NCs because the near FT-IR spectra in the 700 to 4000 cm−1 of the zeolite and product indicated that the zeolite structure was not changed due to stability and non-breakability of the zeolite structure under the reaction conditions used here. The spectra showed all bonding peaks of zeolites such as O-H, Si-O, Al-O, Si (-O)3 and Al (-O)3. Also, the spectra in the 400 to 700 cm−1 regions showed that there were slight variations between the zeolite/Fe2O3–NCs spectra and the zeolite spectra due to the iron (III) nanoparticles. Also, comparing of the far FT-IR spectroscopy of the zeolite and the product (zeolite/Fe2O3–NCs) showed that the peaks for the zeolite/Fe2O3–NCs spectra (which appeared in the spectral regions 633, 615, 585, 543, 530, 518, 480 and 330 cm−1) corresponded to Fe(II)-O and the bonds from Fe2O3. Also, the peaks in the spectral regions 358, 205 and 160 cm−1 may belong to the iron (III) oxide bond because they did not appear in the zeolite spectra. Powder X-ray diffraction (PXRD) confirmed the formation of zeolite/Fe2O3–NCs because all of the peaks in zeolite patterns appeared in the product (zeolite/Fe2O3–NCs) pattern. In addition, a peak appeared at 2θ° of 35.65° which is related to iron(III) oxide in the product and its intensity increased by increasing the amounts of iron(III) oxide in the product (zeolite/Fe2O3–NCs). The scanning electron microscopy (SEM) images confirmed the formation of zeolite/Fe2O3–NCs because it showed that the cubic shape of the zeolite structure and various aggregations of the various amounts of iron (III) oxide coated the zeolite surface for the formation of zeolite/Fe2O3–NCs. Energy-dispersive X-ray fluorescence (EDXF) confirmed the formation of zeolite/Fe2O3–NCs because it showed peaks for O, Na, Al and Si at 0.52, 1.03, 1.47 and 1.72 keV related to the zeolite structure and three peaks for Fe at 0.72, 6.37 and 7.03 keV related to the Fe2O3 nanoparticles. Also, the results showed that the peak intensity of Fe increased by increasing amounts of iron(III) oxide in the product (zeolite/Fe2O3–NCs).
Lastly, in vitro cell studies demonstrated that the zeolites and zeolite/Fe2O3–NCs were generally non-toxic to human fibroblast cells and significantly pernicious to human malignant melanoma cells, with ~14.9 wt% (IC50) of Fe2O3 integrated into the zeolite nanocomposite structure effective at driving melanoma cell viability down to 50% relative to untreated control cells. Also, the three types of products (zeolite/Fe2O3–NCs) were successfully used and recognized as an iron smart nanofertilizer for the slow-release of iron ions.
Conclusion
Zeolite/iron (III) oxide nanocomposites (Zeolite/Fe2O3–NCs) were successfully produced here as an iron smart nanofertilizer for agricultural applications. The production method was carried out by an environmentally friendly condition and raw materials to represent a green chemistry method. The product was characterized by FT-IR, PXRD, EDX, SEM and TEM. Also, the product was non-toxic to human fibroblast cells and significantly pernicious to human malignant melanoma cells. Since current fertilizers have been linked to cancer, the present nanocomposites may represent a non-cancerous alternative worthy of further investigation.
The present work established an easy scale-up process (industrial scale) for synthesizing zeolite/Fe2O3–NCs for numerous important applications including, but not limited to: a nanocatalyst for the synthesis of new biodiesel production, one of the components of animal feed production, an antibacterial agent, an anti-cancer agent, a coating for nanoscale anti-cancer drugs, a filler and new composite in plastic and polymer applications, a pigment in ceramic production and as a pigment, filler and UV absorbent in cosmetic production. Studies will soon be conducted to determine product feasibility and specific efficiency for such applications.
Acknowledgments
The authors would like to acknowledge Northeastern University (NEU), MA, USA and IA University, Tehran, Iran, for their earnest cooperation and funding of this research.
Disclosure
The authors declare that they have no conflicts of interest in this work.
References
1. Meng XF, Zhang ZW, Zhang Y, Xiao ZC, Wei QL Preparation of polyacrylic Acid/TiO2 nanocomposites and its application in photodegradation of methyl orange.
2. An KH, Jeong SY, Hwang HR, Lee YH. Enhanced sensitivity of a gas sensor incorporating single‐walled carbon nanotube–polypyrrole nanocomposites. Adv Mater. 2004;16(12):1005–1009. doi:10.1002/(ISSN)1521-4095
3. Ram MK, Yavuz Ö, Lahsangah V, Aldissi M. CO gas sensing from ultrathin nano-composite conducting polymer film. Sens Actuators B Chem. 2005;106(2):750–757.
4. Radhapyari K, Kotoky P, Das MR, Khan R. Graphene–polyaniline nanocomposite based biosensor for detection of antimalarial drug artesunate in pharmaceutical formulation and biological fluids. Talanta. 2013;111:47–53. doi:10.1016/j.talanta.2013.03.020
5. Wu H, Wang J, Kang X, et al. Glucose biosensor based on immobilization of glucose oxidase in platinum nanoparticles/graphene/chitosan nanocomposite film. Talanta. 2009;80(1):403–406. doi:10.1016/j.talanta.2009.06.054
6. Gan T, Hu S. Electrochemical sensors based on graphene materials. Microchimica Acta. 2011;175(1–2):1. doi:10.1007/s00604-011-0639-7
7. Tam PD, Van Hieu N, Chien ND, Le A-T, Tuan MA. DNA sensor development based on multi-wall carbon nanotubes for label-free influenza virus (type A) detection. J Immunol Methods. 2009;350(1–2):118–124. doi:10.1016/j.jim.2009.08.002
8. Gao J, Liang G, Cheung JS, et al. Multifunctional yolk− shell nanoparticles: a potential MRI contrast and anticancer agent. J Am Chem Soc. 2008;130(35):11828–11833. doi:10.1021/ja803920b
9. Kester M, Heakal Y, Fox T, et al. Calcium phosphate nanocomposite particles for in vitro imaging and encapsulated chemotherapeutic drug delivery to cancer cells. Nano Lett. 2008;8(12):4116–4121. doi:10.1021/nl802098g
10. Cioffi N, Torsi L, Ditaranto N, et al. Antifungal activity of polymer-based copper nanocomposite coatings. Appl Phys Lett. 2004;85(12):2417–2419. doi:10.1063/1.1794381
11. Monteiro DR, Gorup LF, Takamiya AS, Ruvollo-Filho AC, de Camargo ER, Barbosa DB. The growing importance of materials that prevent microbial adhesion: antimicrobial effect of medical devices containing silver. Int J Antimicrob Agents. 2009;34(2):103–110. doi:10.1016/j.ijantimicag.2009.01.017
12. Eslami H, Ehrampoush MH, Esmaeili A, et al. Efficient photocatalytic oxidation of arsenite from contaminated water by Fe2O3-Mn2O3 nanocomposite under UVA radiation and process optimization with experimental design. Chemosphere. 2018;207:303–312. doi:10.1016/j.chemosphere.2018.05.106
13. Shokouhimehr M. Magnetically separable and sustainable nanostructured catalysts for heterogeneous reduction of nitroaromatics. Catalysts. 2015;5(2):534–560. doi:10.3390/catal5020534
14. Lou W-Y, Zong M-H, Duan Z-Q. Efficient production of biodiesel from high free fatty acid-containing waste oils using various carbohydrate-derived solid acid catalysts. Bioresour Technol. 2008;99(18):8752–8758. doi:10.1016/j.biortech.2008.04.038
15. Morgan TT, Muddana HS, Altinoglu EI, et al. Encapsulation of organic molecules in calcium phosphate nanocomposite particles for intracellular imaging and drug delivery. Nano Lett. 2008;8(12):4108–4115. doi:10.1021/nl8019888
16. Wang X, Du Y, Luo J. Biopolymer/montmorillonite nanocomposite: preparation, drug-controlled release property and cytotoxicity. Nanotechnology. 2008;19(6):065707. doi:10.1088/0957-4484/19/6/065707
17. Eslami H, Ehrampoush MH, Esmaeili A, et al. Enhanced coagulation process by Fe-Mn bimetal nano-oxides in combination with inorganic polymer coagulants for improving As (V) removal from contaminated water. J Clean Prod. 2019;208:384–392. doi:10.1016/j.jclepro.2018.10.142
18. Voevodin AA, Zabinski J. Nanocomposite and nanostructured tribological materials for space applications. Compos Sci Technol. 2005;65(5):741–748.
19. Zeng H, Li J, Liu JP, Wang ZL, Sun S. Exchange-coupled nanocomposite magnets by nanoparticle self-assembly. Nature. 2002;420(6914):395. doi:10.1038/nature01208
20. Wang H, Holmberg BA, Yan Y. Homogeneous polymer–zeolite nanocomposite membranes by incorporating dispersible template-removed zeolite nanocrystals. J Mater Chem. 2002;12(12):3640–3643. doi:10.1039/B207394C
21. Zhan B-Z, White MA, Pincock JA, Robertson KN, Cameron TS, Sham T-K. Oxidation of cyclohexane using a novel RuO2 zeolite nanocomposite catalyst. Can J Chem. 2003;81(6):764–769. doi:10.1139/v03-060
22. Pokropivny V. Room-Tc superconductivity on whispering mode in quasi-1D composite of superconducting nanotubes: is it possible? J Supercond. 2000;13(4):607–612. doi:10.1023/A:1007833119616
23. Lee KP, Arnot TC, Mattia D. A review of reverse osmosis membrane materials for desalination—development to date and future potential. J Membr Sci. 2011;370(1–2):1–22. doi:10.1016/j.memsci.2010.12.036
24. Ma W, Jiang Q, Yu P, Yang L, Mao L. Zeolitic imidazolate framework-based electrochemical biosensor for in vivo electrochemical measurements. Anal Chem. 2013;85(15):7550–7557. doi:10.1021/ac401576u
25. Dekrafft KE, Wang C, Lin W. Metal-organic framework templated synthesis of Fe2O3/TiO2 nanocomposite for hydrogen production. Adv Mater. 2012;24(15):2014–2018. doi:10.1002/adma.201200330
26. Mori K, Kanai S, Hara T, et al. Development of ruthenium− hydroxyapatite-encapsulated superparamagnetic γ-Fe2O3 nanocrystallites as an efficient oxidation catalyst by molecular oxygen. Chem Mater. 2007;19(6):1249–1256. doi:10.1021/cm061388l
27. Lv G, He F, Wang X, et al. Novel nanocomposite of nano Fe3O4 and polylactide nanofibers for application in drug uptake and induction of cell death of leukemia cancer cells. Langmuir. 2008;24(5):2151–2156. doi:10.1021/la702845s
28. Neves M, Neto CP, Trindade T. Eco-friendly hybrid pigments made of cellulose and iron oxides. J Nanosci Nanotechnol. 2012;12(8):6817–6821. doi:10.1166/jnn.2012.4552
29. Niznansky D, Viart N, Rehspringer J. Nanocomposites Fe2O3/SiO2-preparation by sol-gel method and physical properties. J Sol-gel Sci Technol. 1997;8(1–3):615–618. doi:10.1007/BF02436910
30. Kang YS, Risbud S, Rabolt JF, Stroeve P. Synthesis and characterization of nanometer-size Fe3O4 and γ-Fe2O3 particles. Chem Mater. 1996;8(9):2209–2211. doi:10.1021/cm960157j
31. Pascal C, Pascal J, Favier F, Elidrissi Moubtassim M, Payen C. Electrochemical synthesis for the control of γ-Fe2O3 nanoparticle size. Morphology, microstructure, and magnetic behavior. Chem Mater. 1999;11(1):141–147. doi:10.1021/cm980742f
32. Xiaotun Y, Lingge X, Choon NS, Hardy CSO. Magnetic and electrical properties of polypyrrole-coated γ-Fe2O3 nanocomposite particles. Nanotechnology. 2003;14(6):624. doi:10.1088/0957-4484/14/6/311
33. Casas L, Roig A, Rodrıguez E, Molins E, Tejada J, Sort J. Silica aerogel–iron oxide nanocomposites: structural and magnetic properties. J Non Cryst Solids. 2001;285(1–3):37–43. doi:10.1016/S0022-3093(01)00429-X
34. Eslami H, Ehrampoush MH, Esmaeili A, et al. Synthesis of mesoporous Fe-Mn bimetal oxide nanocomposite by aeration co-precipitation method: physicochemical, structural, and optical properties. Mater Chem Phys. 2019;224:65–72. doi:10.1016/j.matchemphys.2018.11.067
35. Clapsaddle BJ, Zhao L, Gash AE, et al. Synthesis and characterization of mixed metal oxide nanocomposite energetic materials. MRS Online Proc Lib Arch. 2003;800.
36. Li S, Qin J, Fornara A, Toprak M, Muhammed M, Kim DK. Synthesis and magnetic properties of bulk transparent PMMA/Fe-oxide nanocomposites. Nanotechnology. 2009;20(18):185607. doi:10.1088/0957-4484/20/18/185607
37. Calabi-Floody M, Medina J, Rumpel C, Condron LM, Hernandez M, Dumont M, de la Luz Mora M Smart fertilizers as a strategy for sustainable agriculture. In Advances in Agronomy 2018 (Vol. 147,pp.119–157) Academic Press.
38. Sharpley AN, Meisinger JJ, Power JF, Suarez DL. Root extraction of nutrients associated with long-term soil management. In Limitations to Plant Root Growth 1992 (pp. 151–217). Springer, New York, NY.
39. Würth B. Emissions of Engineered and Unintentionally Produced Nanoparticles to the Soil: An Exposure Assessment for Switzerland. ETH Zurich Department of Environmental Sciences; 2007.
40. Mastronardi E, Tsae P, Zhang X, Monreal C, DeRosa MC. Strategic role of nanotechnology in fertilizers: potential and limitations. In Nanotechnologies in Food and Agriculture 2015 (pp. 25–67). Springer, Cham.
41. DeRosa MC, Monreal C, Schnitzer M, Walsh R, Sultan Y. Nanotechnology in fertilizers. Nat Nanotechnol. 2010;5(2):91. doi:10.1038/nnano.2010.2
42. Marchiol L. Nanotechnology in agriculture: new opportunities and perspectives. New Visions Plant Sci. 2018;9:121.
43. Xia X, Gao K, Xing X, et al. A recommended rate for application of Chaetomium globosum ND35 fungus fertilizer on poplar plantations in China. J for Res. 2018;29(4):933–941. doi:10.1007/s11676-017-0525-1
44. Bloem E, Albihn A, Elving J, et al. Contamination of organic nutrient sources with potentially toxic elements, antibiotics and pathogen microorganisms in relation to P fertilizer potential and treatment options for the production of sustainable fertilizers: a review. Sci Total Environ. 2017;607:225–242. doi:10.1016/j.scitotenv.2017.06.274
45. Ward MH. Too much of a good thing? Nitrate from nitrogen fertilizers and cancer. Rev Environ Health. 2009;24(4):357–363. doi:10.1515/REVEH.2009.24.4.357
46. Abayaweera GS. Diverse Use of Iron Oxide Nanoparticles for Anticancer Therapy. Kansas State University; 2014.
47. Nagajyothi P, Pandurangan M, Kim DH, Sreekanth T, Shim J. Green synthesis of iron oxide nanoparticles and their catalytic and in vitro anticancer activities. J Clust Sci. 2017;28(1):245–257. doi:10.1007/s10876-016-1082-z
48. Shanmugasundaram T, Radhakrishnan M, Poongodi A, Kadirvelu K, Balagurunathan R. Bio-inspired synthesis of superparamagnetic iron oxide nanoparticles for enhanced in vitro anticancer therapy. MRS Commun. 2018;8(2):604–609. doi:10.1557/mrc.2018.36
49. Flanigen EM, Khatami H, Szymanski H. Infrared structural studies of zeolite frameworks. Adv Chem Series. 1971;101:
50. Jentys A, Lercher JA. Techniques of zeolite characterization. In Studies in Surface Science and Catalysis 2001 (vol.137, pp. 345–386). Elsevier.
51. Orha C, Pop A, Lazau C, Grozescu I, Tiponut V, Manea F. Structural characterization and the sorption properties of the natural and synthetic zeolite. J Optoelectron Adv Mater. 2011;13(5–6):544–549.
52. Guo Z, Lei K, Li Y, Ng HW, Prikhodko S, Hahn HT. Fabrication and characterization of iron oxide nanoparticles reinforced vinyl-ester resin nanocomposites. Compos Sci Technol. 2008;68(6):1513–1520. doi:10.1016/j.compscitech.2007.10.018
53. Gupta AK, Wells S. Surface-modified superparamagnetic nanoparticles for drug delivery: preparation, characterization, and cytotoxicity studies. IEEE Trans Nanobiosci. 2004;3(1):66–73. doi:10.1109/TNB.2003.820277
54. Predoi D. A study on iron oxide nanoparticles coated with dextrin obtained by coprecipitation. Dig J Nanomater Biostruct. 2007;2(1):169–173.
55. Treacy MM, Higgins JB. Collection of Simulated XRD Powder Patterns for Zeolites Fifth (5th) Revised Edition. Elsevier; 2007.
56. Treacy MM, Higgins JB, von Ballmoos R. Collection of simulated XRD powder patterns for zeolites. Zeolites. 1996;5(16):330–802.
57. Bhattacharya A, Hartridge A, Mallick KK, Majumdar C, Das D, Chintalapudi S. An X-ray diffraction and Mossbauer study of nano-crystalline Fe2O3–Cr2O3 solid solutions. J Mater Sci. 1997;32(3):557–560. doi:10.1023/A:1018506912078
58. Dhiman P, Kumar A, Singh M. Solution combustion preparation of Fe2O3-nano-flakes: synthesis and characterization. Adv Mater Lett. 2012;3:330–333. doi:10.5185/amlett
59. Shakhapure J, Vijayanand H, Basavaraja S, Hiremath V, Venkataraman A. Uses of a-Fe2O3 and fly ash as solid adsorbents. Bull Mater Sci. 2005;28:713–718. doi:10.1007/BF02708542
60. Shin YJ, Han C-S, Lee CS, et al. Zeolite 4A, a synthetic silicate, suppresses melanogenesis through the degradation of microphthalmia-associated transcription factor by extracellular signal-regulated kinase activation in B16F10 melanoma cells. Biol Pharm Bull. 2010;33(1):72–76. doi:10.1248/bpb.33.72
 © 2020 The Author(s). This work is published and licensed by Dove Medical Press Limited. The full terms of this license are available at https://www.dovepress.com/terms.php and incorporate the Creative Commons Attribution - Non Commercial (unported, v3.0) License.
By accessing the work you hereby accept the Terms. Non-commercial uses of the work are permitted without any further permission from Dove Medical Press Limited, provided the work is properly attributed. For permission for commercial use of this work, please see paragraphs 4.2 and 5 of our Terms.
© 2020 The Author(s). This work is published and licensed by Dove Medical Press Limited. The full terms of this license are available at https://www.dovepress.com/terms.php and incorporate the Creative Commons Attribution - Non Commercial (unported, v3.0) License.
By accessing the work you hereby accept the Terms. Non-commercial uses of the work are permitted without any further permission from Dove Medical Press Limited, provided the work is properly attributed. For permission for commercial use of this work, please see paragraphs 4.2 and 5 of our Terms.