")
Back to Archived Journals » Advances in Genomics and Genetics » Volume 4
Genomic and epigenetic instability in chordoma: current insights
Authors Feng Y, Shen J, Hornicek F, Duan Z
Received 13 February 2014
Accepted for publication 8 April 2014
Published 30 May 2014 Volume 2014:4 Pages 67—78
DOI https://doi.org/10.2147/AGG.S50523
Checked for plagiarism Yes
Review by Single anonymous peer review
Peer reviewer comments 3
Video abstract presented by Jacson K Shen.
Views: 278
Yong Feng,1,2 Jacson K Shen,1,3 Francis J Hornicek,1,3 Zhenfeng Duan1,3
1Department of Orthopedic Surgery, Massachusetts General Hospital, Boston, MA, USA; 2Department of Orthopedic Surgery, Union Hospital, Tongji Medical College, Huazhong University of Science and Technology, Wuhan, People’s Republic of China; 3Sarcoma Biology Laboratory, Center for Sarcoma and Connective Tissue Oncology, Massachusetts General Hospital, Boston, MA, USA
Abstract: Chordoma is a malignant bone tumor, which currently can only be defined by histologic and immunohistochemical criteria. There are no prognostic biomarkers to predict the clinical outcome or response to treatment yet. Currently, chordoma pathogenesis is very poorly understood; however, recent large-scale genetic and epigenetic studies have identified some of the underlying mechanisms and pathways that may contribute to the disease. In this review, we summarize the most recent findings in the field of chordoma genomics and epigenomics, from comparative genomic hybridization to evaluate chromosomal alteration, large-scale deoxyribonucleic acid (DNA) sequencing to determine the gene mutation, microarray to access messenger ribonucleic acid (RNA) and microRNA gene expression, and DNA-methylation profiling. These studies may also hold valuable clinical potential in the management of chordoma.
Keywords: chordoma, chromosomal alterations, sequencing, miRNA, DNA methylation
Introduction
Chordoma is a very rare cancer that accounts for 1%–4% of primary malignant bone tumors and 20% of primary spine tumors.1,2 Epidemiological studies suggest that chordoma affects roughly one in a million individuals, and is more predominantly found in males (58.4%) than in females (41.6%) (Figure 1A).3 Unlike most malignant tumors, chordoma is generally a slow-growing, locally aggressive, and invasive tumor that is typically mostly resistant to conventional chemo- and radiotherapy. Chordomas most commonly arise in the sacrococcygeal area (50%), skull base (35%), and vertebral bodies (15%), while rare cases have been reported to originate in an extra-axial distribution or within soft tissues (Figure 1B).3–5 Information on chordoma development is very limited. Chordoma is believed to arise from embryonic remnants of the notochord. During normal development, the majority of fetal notochord cells regress, leaving only a few cell remnants within the adult vertebral disk. In some rare cases, small numbers of cells can be found within the vertebral body as benign notochordal cell tumors. Although chordomas have been studied histologically, very little is known about the molecular mechanisms that drive these tumors.
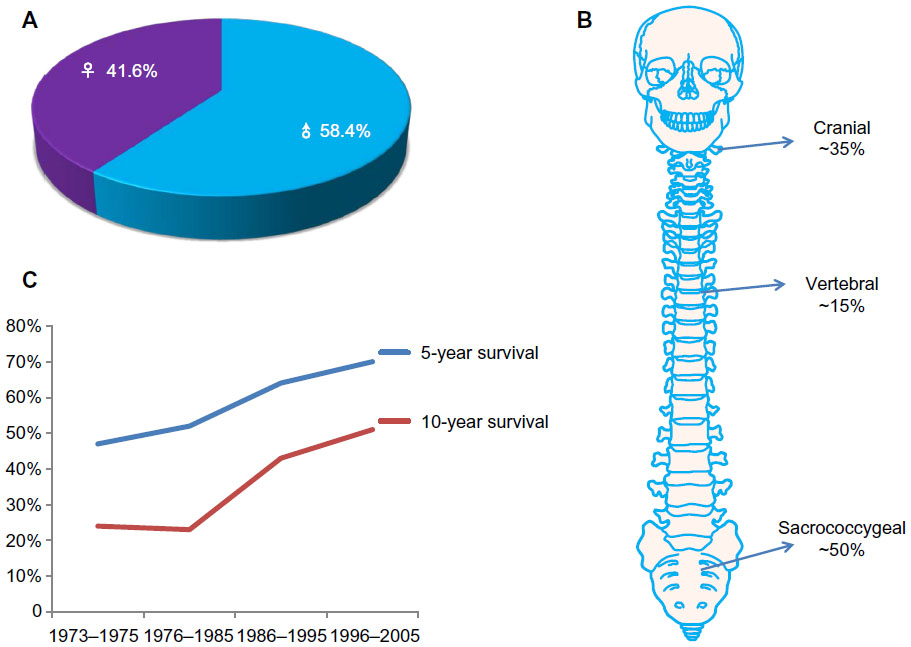 | Figure 1 (A–C) The epidemiology of chordoma. (A) Male patients comprise 58.4% and females account for 41.6% of chordomas. (B) Chordomas usually arise from remnants of the primitive notochord, most commonly in the sacrococcygeal area (~50%), skull base (~35%), and vertebral bodies (~15%). (C) Overall survival is 64% at 5 years, and 40% at 10 years. |
The gold-standard treatment for these tumors is en bloc resection; however, the critical anatomic location (spread along critical bony and neural structures) and the commonly large tumor size make clinical management of these patients difficult. As a result, the recurrence of chordoma is a common event, which has been reported to range from 30% to 85%, with a median survival of approximately 6 years.3,6 Therapeutic options for chordoma are limited, due to the lack of sensitivity to both chemo- and radiotherapy of tumors. The overall survival of chordoma is around 64% at 5 years, and 40% at 10 years (Figure 1C).7
Histologically, chordoma is composed of nests and cords of tumor cells with abundant eosinophilic or clear vacuolated cytoplasm, and enmeshed in abundant myxoid stroma. Recent studies based on biochemical and immunohistochemistry analyses have suggested that there may be a potential role for molecular therapy in the treatment of chordomas.4–6 Although the morphology and immunoprofile of chordoma is well recognized, the genetic mechanisms underlying the development of the tumor have not been fully characterized. Therefore, there are currently no predictive or prognostic biomarkers for chordoma. Over the past decade, comparative genomic hybridization (CGH), fluorescence in situ hybridization (FISH), methylation assays, whole-genome single-nucleotide polymorphism (SNP) microarrays, and gene-expression and micro-ribonucleic acid (RNA) (miR)-expression arrays have become powerful techniques to detect genomic and epigenomic alterations in chordoma.8–12 These robust technologies have led to significant understanding of the biological pathogenesis of chordoma.
Chromosome instability in chordoma
Traditionally, chromosome abnormalities are detected by generating a karyotype and analyzing the banding patterns therein. Under ideal conditions, alterations as small as approximately 5 megabases can be detected with banding analysis. In recent years, however, increasing focus has shifted to a newer cytogenetic technique. CGH is a popular technique that provides an alternative means of genome-wide screening for copy-number alterations. Instead of using metaphase chromosomes, CGH uses slides arrayed with small segments of deoxyribonucleic acid (DNA) as the targets for analysis.
First, DNA is extracted from a test sample, such as blood, skin, or fetal cells. The test DNA is then labeled with a specific color fluorescent dye, while DNA from a normal control (reference) sample is labeled with a different-color dye. Two genomic DNAs of sample and control are then mixed together and implemented onto a microarray. Since the DNAs have been denatured as single strands, they will hybridize with the arrayed single-strand probes. Digital imaging systems are then applied to capture and quantify the relative fluorescence intensities of the labeled DNA probes that have hybridized to each target. At different positions along the genome, the fluorescence ratio of the sample and reference-hybridization signals is determined, and it provides information on the relative copy number of sequences in the sample genome compared to the reference genome.13
Application of unbiased genome-wide approaches, such as CGH, provides the greatest potential to discover unstable loci and candidate genes associated with a variety of cancers, including chordoma.14 During the last decade, significant progress has been achieved in molecular cytogenetics by CGH.15 Alteration of distinctive chromosome regions in chordoma has uncovered new candidate oncogenes and tumor-suppressor genes (TSGs). Therefore, high-resolution screening of genetic instabilities may provide a more comprehensive landscape of the chordoma genome and chordoma genesis.
Frequently lost regions of chromosomes in chordoma
CGH studies reveal that deletions were found on all chromosomes of chordoma, except chromosome 5 (Table 1). Among these aberrations, the most frequent loss is the region on chromosome arm 1p36.16–21 It has been suggested primarily on the basis of loss-of-heterozygosity results that 1p36 may be a putative TSG locus of skull-base chordoma because of its association with poor prognosis in chordoma.19 Loss of 1p36 was also identified in another chordoma group; however, no correlation with survival was observed.17 Therefore, the loss of 1p36 may be an early event in chordoma genesis. Moreover, this region contains several genes, including RUNX3, a transcription factor that has often been demonstrated to be deleted or transcriptionally silenced in various cancers.22 RUNX3 has been shown to be involved in the maturation of chondrocytes, providing a putative biological connection to the development of chordoma. Moreover, several investigations have suggested, primarily on the basis of loss-of-heterozygosity results, that 1p36 may be a putative TSG locus of skull-base chordoma because of its association with poor prognosis in chordoma.16,17,19 The potential reasons for these discrepancies may reflect the different sites of tumor origin, differences in the ethnicities of the populations, or different methodologies used in these studies.
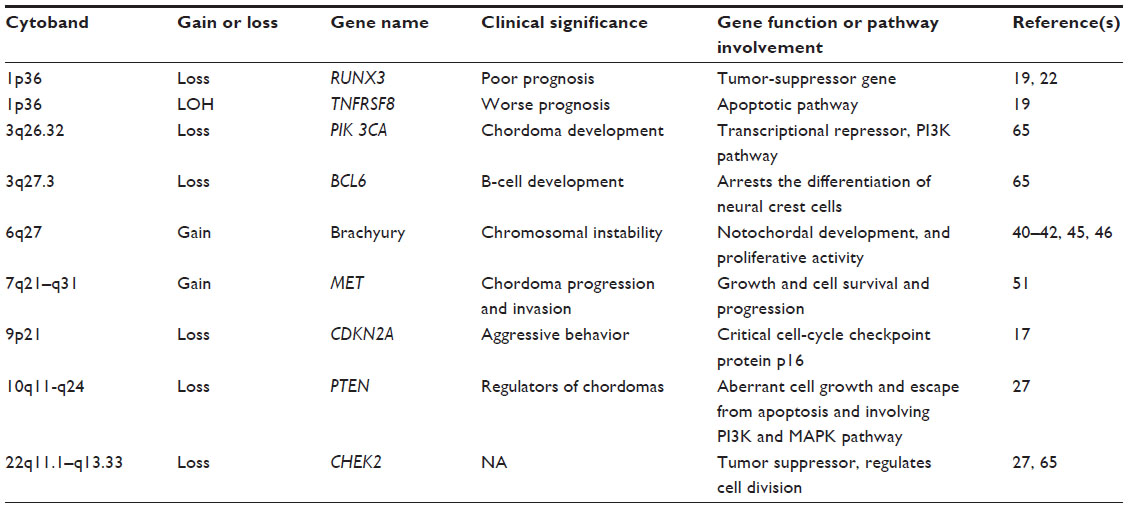 | Table 1 Most common aberrant chromosomes and genes in chordoma |
Deletion of chromosome arm 9p is the second-most frequently observed chromosomal alteration in chordoma.16,17,23–25 The chromosome 9p21 locus encodes CDKN2A. Specific deletions of CDKN2A on 9p21 have been detected in up to 70% of all chordomas.26,27 Functional studies have shown that CDKN2A blocks the function of CDK4 and CDK6–cyclin D complexes. CDK–cyclin complexes modify the retinoblastoma protein, thus controlling the G1/S-phase checkpoint of the cell cycle. Inactivation of CDKN2A thereby can result in cellular proliferation. A recent study demonstrated that immunohistochemical staining for the CDKN2A protein in chordoma tissues consistently yielded negative results.28 Therefore, CDKN2A inactivation is frequently an early and critical event during tumorigenesis. Furthermore, deletion of CDKN2A in normal cells is associated with centrosome dysfunction and genomic instability, ultimately leading to aneuploidy and malignant transformation.29 These studies collectively indicate that inactivation of the CDKN2A gene may play a crucial role in the development of chordoma. In addition to CDKN2A gene loss, MTAP, whose coding gene is adjacent to CDKN2A, is also lost in a significant percentage of chordomas. Cytoplasmic MTAP immunoreactivity was not detectable in 39% of chordomas.25 MTAP is frequently codeleted with CDKN2A in several different types of malignancies. Moreover, MTAP loss is a potential therapeutic target.30
Loss of the chromosome region 10q23 has also drawn interest in chordoma research, because another key TSG, PTEN, is located on 10q23 and is commonly inactivated in neoplasms by somatic mutations, deletions, and/or genetic inactivation.31,32 Genomic DNA analyses by CGH revealed deletion of chromosome region 10q23 in sporadic chordomas.26,33 Recently, a study found that widespread loss of PTEN expression is strongly associated with hyperactivation of AKT/mTORC1 signaling in sporadic sacral chordomas.34 PTEN has at least two major biochemical functions: one is lipid phosphatase activity, and the other is protein phosphatase activity.35,36 Lipid phosphatase downregulates AKT activity through negative regulation of the growth factor-induced PI3K pathway, and upregulates proapoptotic mechanisms, such as caspases. The protein phosphatase activity of PTEN is involved in the inhibition of focal adhesion and in cell spreading and migration, as well as in the inhibition of growth factor-stimulated MAPK signaling. The combined effects of the PTEN lipid and protein phosphatase activities may result in aberrant cell growth and escape from apoptosis, as well as abnormal cell spreading and migration.36 Thereby, loss of PTEN function results in PI3K/AKT/mTOR pathway activation, which promotes cellular proliferation and migration.37 PTEN may also act to promote overall genomic stability in chordoma. In contrast, the expression of PTEN has been evaluated in two chordoma cell lines – U-CH1 and U-CH2. Based on PTEN gene loss in U-CH1, no PTEN protein expression was observed.38 However, PTEN expression in U-CH2 was near the level of normal human fibroblasts. Heterogeneity of expression of PTEN has been described among chordoma tumors, and these observations are consistent with differences in phospho-Akt between these two cell lines.
Other chordoma candidate TSGs have also been reported. The deleted region of chromosome 11q22, where ATM is harbored, has been reported in chordoma cases.26 ATM is important for genome stability associated with checkpoint kinase 2, tumor protein 53, and other cell-cycle checkpoint proteins.39 Although a few studies have shown deletion of chromosomes 3, 4, 10, 13, and 18 in chordoma, no obvious known candidate TSGs were noticed in these lost regions.
Frequently gained regions of chromosomes in chordoma
In general, gains within chromosomes are less common than losses in chordoma. Common gains include regions of chromosomes 1, 5, 6, 7, 8, 12, 15, 16, 19, and 20. However, as shown in previous studies, gain of chromosome 6 is common in familial chordomas.40–44 High-resolution CGH profiling of four multiplex families of chordoma cases demonstrated duplication of the chromosome region 6q27.45 Since the duplicated chromosome region 6q27 contains only the brachyury gene, brachyury may be a major susceptibility gene in familial chordoma. As chordomas presumably originate from notochord, in which the brachyury gene drives development, there is increasing evidence demonstrating that brachyury also plays an important role in sporadic chordomas. At the functional level, one study showed that in vitro inhibition of brachyury halted cell proliferation in two different chordoma cell lines.46 In a cell line that did not express brachyury protein or messenger RNA (mRNA), overexpression of brachyury resulted in reinforced proliferation, motility, and invasiveness.46 This study suggests that brachyury acts as an oncogene and may play a role in the pathogenesis of chordoma.
However, unlike familial chordomas, some of the sporadic chordoma cases do not possess brachyury duplication or amplification. Only two of 16 analyzed cases showed an abnormal brachyury copy number (approximately three and four copies per cell).46 In the follow-up study, it was shown that duplication or amplification of the brachyury locus was present in less than 5% of investigated chordoma cases.46 Amplification of brachyury was only observed in approximately 7% of the sporadic form of chordoma.46 These findings were in accordance with two earlier studies that showed only 10% and 29% of chordoma cases exhibited chromosome region 6q27 gain.26,27 Furthermore, recent tissue-microarray immunohistochemical studies showed brachyury is not a prognostic indicator in chordoma44; 59 of 78 (75.64%) tumors showed nuclear staining for brachyury. Brachyury nuclear staining was detected more frequently in sacral chordomas than in chordomas of the mobile spine. However, there was no significant relationship between brachyury expression and other clinical variables. By Kaplan–Meier analysis, brachyury expression failed to produce any significant relationship with the overall survival rate. Therefore, these studies suggest that alteration of brachyury is not the primary event in the development of chordoma, and the potential role of brachyury in chordoma needs to be studied further.
Brachyury has been shown to be mutated in chordoma, and copy-number variants have been associated with familial risk for developing the tumor, as described earlier. However, the exact functional role of brachyury in chordoma remains unknown. In addition, due to brachyury’s nuclear localization and the “undruggable” characteristic of such molecules, current strategies to target brachyury are limited. Different sites of tumor origin and difference in the ethnicities of the populations may also be associated with inconsistencies between results and discrepancy of brachyury SNP studies. As only two studies with limited cases of chordoma on brachyury SNP study exist so far, further evaluation on larger patient numbers will be needed to validate this association of single-nucleotide variant in brachyury with chordoma.
Another common gain in chordoma is in the region of chromosome 7q. Gains within chromosome 7q have been reported in primary and recurrent chordomas. In a CGH and FISH study of six sacral chordomas, the most frequent gain (66%) was found on chromosome 7q.47 A similar report showed that gains on chromosome 7q were found in 69% of chordomas.33 In addition, it was found that the chromosome 7q gains appear more frequently in patients older than 26 years, and it is common in sacral tumors.48 These facts imply that the alteration of chromosomes is not only an early effect of chordoma genesis but also that it persists during tumor progression. Notably, chromosome 7 harbors the genes that encode the EGFR, MET, LMTK2, EPHA1, EPHB4, and EPHB6 proteins. It has been reported that the MET proto-oncogene plays important roles in many cellular processes, and during tumor progression and invasion of different types of cancers. In chordomas, expression of MET was seen in up to 94.5% of primary lesions and 88% of recurrent lesions.48–51 CGH studies provided evidence that polysomy of chromosome 7 could contribute to MET overexpression in some chordomas.48,52 Aberrant gain of chromosome 7q and MET expression in primary and all recurrent chordomas have been confirmed by FISH, which suggests the crucial role of MET in chordoma progression.
Chromosome number-variation profiling is considered to be a promising diagnostic and prognostic indicator for chordoma patients. Further studies are needed to demonstrate the significance of chromosome alteration, the expression and function of located genes, and their influence on chordoma progress.
Single-nucleotide variants in chordoma
Germ-line duplication of T has been reported to correlate with familial risk for developing chordoma.45 However, the genetic basis of brachyury expression in chordoma is largely unknown. A recent study combined traditional Sanger sequencing with whole-exome sequencing to examine germ-line DNA from 45 individuals in European populations with sporadic chordoma.53 The results demonstrated a recurring SNP – rs2305089 (Gly177Asp), which lies in exon 4 – that encodes part of the DNA-binding domain of brachyury.53 This mutation, therefore, alters the DNA-binding properties of brachyury, indicating that the dysregulation of some of the genes regulated by brachyury could be a mechanism implicit in the genesis of chordoma. However, a more recent study in a Chinese population of 65 skull-base chordoma cases showed that the brachyury Gly177Asp SNP was not associated with skull-base chordoma.54
Gene-expression profiling in chordoma
Gene expression (mRNA) profiling is a powerful technique applied in molecular biology for measurement of the expression of thousands of genes simultaneously, and creates a global map of cellular function. Profiling combines DNA microarray technology and sequence-based techniques, such as serial analysis of gene expression. DNA microarrays are an ordered series of microscopic spots of predefined DNA oligonucleotides, known as probes, which are covalently attached to form a gene chip. DNA labeled with fluorophores (target) is prepared from a sample and is hybridized to the complementary DNA sequences on the gene chip. The chip is then scanned for the fluorescent label’s presence and strength at each spot, which represent probe-target hybrids. The fluorescence level at a specific spot provides quantitative information about the expression of the particular gene.
An HG-U133A Affymetrix (Santa Clara, CA, USA) chip platform has been applied to determine the gene-expression signature in six chordoma and 14 chondrosarcoma tissues.55 This study showed that chordoma is grouped together in a genomic cluster distinct from that of chondrosarcoma. The result showed extracellular matrix genes, including aggrecan, types II and X collagen, fibronectin, matrillin 3, high-molecular-weight melanoma-associated antigen, MMP9, and MMP19. Particularly, brachyury and CD24 were selectively overexpressed in chordomas. In another study of chordoma cell lines (CCL4B, CM319, GB60, U-CH1, and U-CH2) and in comparison with three control groups (nonchordoma mesenchymal tumors, normal tissues, and including intervertebral disk), five genes – brachyury, CD24, COL2A1, CA3, and KRT19 – were significantly differentially expressed in chordoma tumor cell lines.38 Interestingly, in another xenograft gene-expression profiling of chordoma, a number of the genes were found to be expressed at high levels, including IL11, CXCL5, VEGFC, and CCL20.56 These results suggest that the NFκB-pathway genes are critical mediators of chordoma growth. Furthermore, a number of genes with established roles in tumorigenesis were also found overexpressed in chordoma, including ROS1, DLX1, CPA4, and VEGFC2.56
DNA methylation in chordoma
DNA methylation is an important regulator of gene transcription, and is a tightly regulated process during normal development, which becomes deregulated during neoplastic genesis and disease development.57 DNA methylation is involved in numerous mechanisms indispensable for genome stability and control of gene expression.58,59 Alterations in DNA-methylation patterns result in genetic instability or dysregulated gene expression, thus contributing to tumorigenesis and malignant transformation. The cancer epigenome is characterized by promoter CpG-island hypermethylation that leads to TSG silencing or hypomethylation, which contributes to proto-oncogene activation, affecting noncoding RNA expression.11,60 DNA methylation of cytosine at CpG islands can act as a transcription repressor, which subsequently contributes to the silencing of the correlated genes. Hypomethylation and/or hypermethylation of specific gene loci, including TSGs, are strongly associated with disease development.61
Methylation is relatively stable in such body fluids as serum or plasma, and can therefore be easily detected by sensitive polymerase chain reaction (PCR)-based assays, methylation-specific PCR, or by whole-genome bisulfate sequencing.62,63 DNA methylation plays a crucial role in the development of nearly all types of cancer.64 However, very few DNA-methylation epigenetic studies on chordomas are available thus far (Table 2). Using methylation-specific PCR, it was found that loss of CDKN2A and PTEN expression in the majority of cases was not attributed to promoter methylation in recurrent sporadic chordomas.27 However, tissue-microarray immunohistochemistry demonstrated absent or reduced fragile histidine triad (FHIT) protein expression in 98% of sacral chordomas and 67% of skull-base chordomas.23 The results suggest that chromosome 3 aberration and epigenetic regulation of FHIT contributes to loss of the FHIT tumor suppressor in chordoma. Both of these mechanisms may also play important roles in chordoma pathogenesis. Bisulfite sequencing of the 5′-CpG island at the FHIT locus in skull-base and sacral chordoma and concurrent evaluation of FHIT mRNA and protein expression will further define the extent to which epigenetic changes contribute to chordoma pathogenesis. The study implies that FHIT loss due to DNA hypermethylation in a majority of chordomas may provide new insight into chordoma pathogenesis, and points to a potential new therapeutic target for this challenging neoplasm.
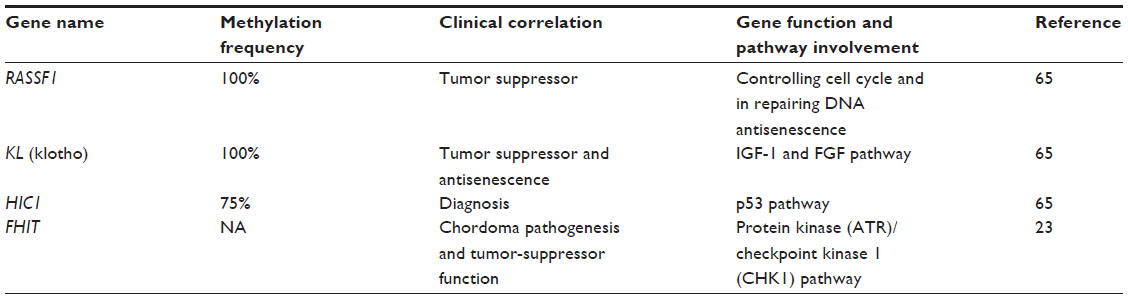 | Table 2 Genes methylated in chordoma proposed as diagnostic and prognostic biomarkers |
Using the AITCpG360 methylation assay, it has been demonstrated that 20 genes were hyper- or hypomethylated in chordoma.65 The most compelling candidates of hyper/hypomethylated genes are C3, XIST, TACSTD2, FMR1, HIC1, RARB, DLEC1, KL, and RASSF1. It is known that RASSF1, KL, and HIC1 are TSGs.
MicroRNA expression in chordoma
miRs are small, noncoding RNAs that posttranscriptionally regulate gene expression by interacting with 18–25 nucleotides of target genes. The genes that encode miRs are transcribed from DNA, but not translated into protein. miRs are processed from primary transcripts (pri-miRs) to form short stem-loop structures called precursor miRs (pre-miRs).66,67 Pre-miRs are subsequently converted to functional mature miRs in the cytoplasm; once in the cytoplasm, miRs are further cleaved by the Dicer enzyme, similar to the formation of miRs by the RNA-induced silencing complex that participates in RNA interference. It is believed that there are approximately 2,000 miRs in the human genome, and up to 30% of human genes are regulated by miRs, which are implicated in many crucial biological processes, such as development, differentiation, apoptosis, and proliferation.68 Moreover, miRs can act as either oncogenes or tumor suppressors, which may be involved in tumor formation or recurrence (Figure 2).69
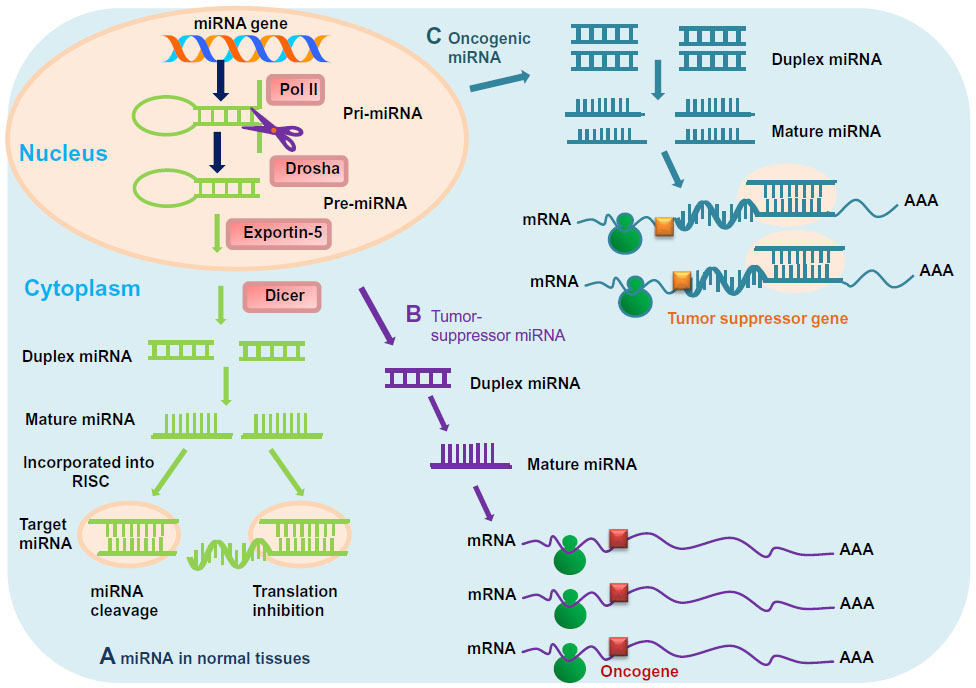 | Figure 2 (A–C) Mechanisms of micro-ribonucleic acid (miR) in chordoma. (A) In normal tissues, proper miR transcription, processing, and binding to complementary sequences on the target messenger ribonucleic acid (mRNA) results in the repression of target-gene expression through a block in protein translation or altered mRNA stability. The overall outcomes are normal rates of cellular growth, proliferation, differentiation, and cell death. (B) The reduction or deletion of a “tumor-suppressor miR” due to mutation, deletion, epigenetic modification, or irregularities in miR processing cause inappropriate elevation of miR-target oncoproteins. The overall result might involve increased proliferation, invasiveness, or angiogenesis, decreased levels of apoptosis, or undifferentiated or dedifferentiated tissue, ultimately leading to tumor formation. (C) Amplification or overexpression of an “oncogenic miR” inhibits miR targets of vital tumor-suppressor genes. The overall outcomes are increased cell proliferation, angiogenesis, and metastasis, or augmented chromosomal instability. |
Several studies have reported that miR profiles are useful in the refinement of diagnosis and prognosis of chordoma (Table 3).70–72 Chordoma tissues and cell lines revealed significant differences in miR expression in comparison with normal controls.71 Expression of miR-1, miR-206, and miR-133 was significantly reduced in chordoma.71 The role of miR-1 in the oncogenesis of chordoma is unknown, although miR-1 has been shown to contribute to the development of liver and lung cancer.69,71,73 Furthermore, the proto-oncogene MET, which harbors two conserved miR-1 cognate sites, is overexpressed in many human cancers.73 The MET proto-oncogene is expressed in almost all chordomas (94.4%), as well as many chondrosarcomas (54.2%) and osteosarcomas (23.3%).50 A more recent study suggests that the MET oncoprotein plays a leading role in the metastatic process in chordoma, and that a MET-HGF pair is involved in chordoma malignancy.74 It was also shown that endogenous MET levels were overexpressed in both chordoma cell lines and chordoma tissues, while reintroduction of miR-1 to the chordoma cells significantly decreased MET expression. Recent research showed that miR-1 was downregulated in 93.7% of chordoma tissues, and expression was inversely correlated with MET expression.75 MiR-1 expression levels also correlated with clinical prognosis. Therefore, miR-1 is suggested to have a functional effect on the pathogenesis of chordoma.
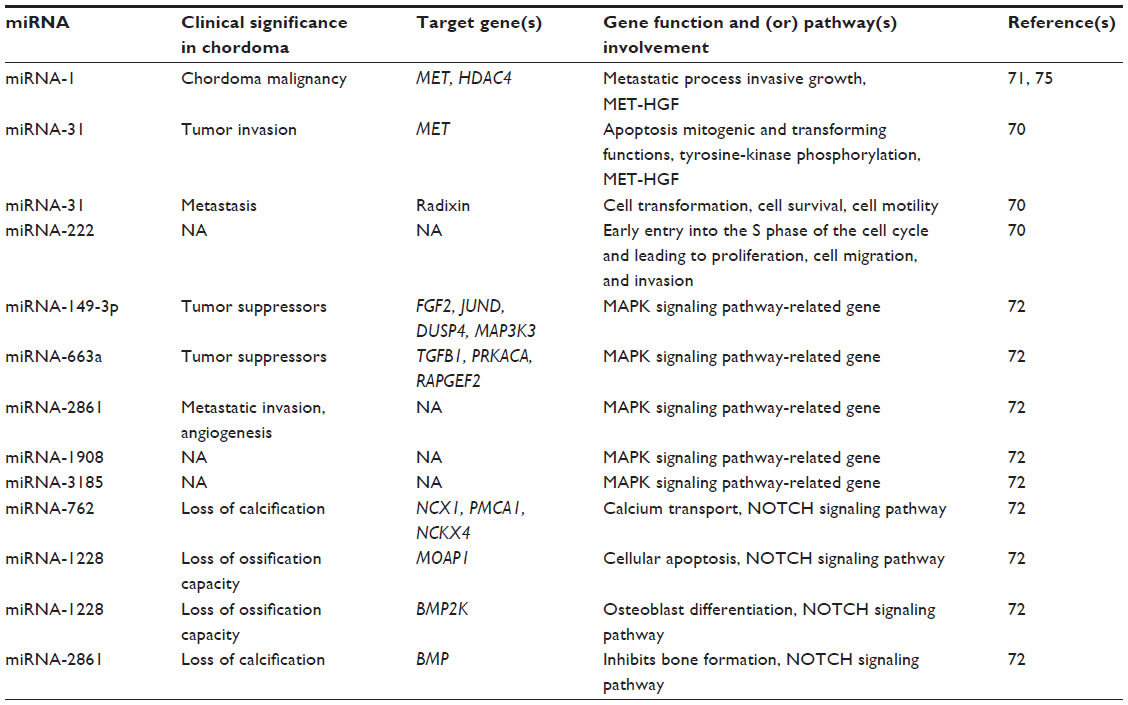 | Table 3 Dysregulated micro-ribonucleic acids (miRNAs) as putative prognostic and predictive biomarkers in chordoma |
Another study has shown that 53 miRs are dysregulated in chordoma, in which 30 miRs were upregulated and 23 were downregulated.70 Notably, miR-140-3p and miR-148a were upregulated in most chordomas, while miR-31 and miR-222 were downregulated. Functional analyses showed that miR-31 has an apoptotic effect on chordoma cells and downregulates the expression of MET and radixin. Tumors are dependent on continuous MET stimulation, as overexpression of MET is related to invasion, evasion from apoptotic signals, angiogenesis, and cell scattering.76 Additionally, overexpression of the closely related ezrin, radixin, and moesin genes is associated with cell transformation, cell survival, cell motility, and tumor invasion.77–79 Moreover, it was also reported that miR-222 is also downregulated in chordoma cells; miR-222 is known to induce early entry into the S phase of the cell cycle and lead to the proliferation of cancer cells, which may be an important mechanism in the slow growth of chordomas.80
Recently, miR and mRNA were examined to reveal the potential roles of miRs in chordoma.72 Microarray results indicated that 33 miRs and 2,791 mRNAs were significantly dysregulated. Among the 2,791 mRNAs, 911 overlapped with putative miR target genes. The pathway analysis demonstrated that the MAPK pathway was consistently enriched in the chordoma tissue, and that miR-149-3p, miR-663a, miR-1908, miR-2861, and miR-3185 probably play important roles in the regulation of MAPK pathways. These five significantly downregulated miRs have been proposed to target MAPK signaling pathway-related genes, which include FGF2, JUND, DUSP4, MAP3K3, TGFB1, PRKACA, and RAPGEF2 in an inverse manner. The MAPK signaling pathway was the most heavily overrepresented genetic pathway. Many normal eukaryotic cellular processes are controlled by the MAPK signaling pathway, such as proliferation, differentiation, and survival; however, constitutive activation of the MAPK signaling pathway is a remarkable occurrence in various human neoplasms.81,82 Recently, several studies revealed the critical role of MAPK signaling pathways in chordomas.83 Taken together, miR-149 and miR-663 have been regarded as tumor suppressors,84,85 and miR-1908 and miR-2861 have been proposed to have a significant role in the metastatic invasion, angiogenesis, and colonization of chordoma.86,87
Currently however, only chordoma cell lines and tissues have been used for miR-expression studies. Potential circulating biomarkers of chordoma may also exist in body fluids, including serum, plasma, and saliva. As many miRs identified in peripheral blood have been shown to be potential diagnostic and prognostic biomarkers for cancer,85,88 future studies on identifying dysregulated miRs in the body fluids of chordoma patients may also provide useful groundwork for diagnostic, prognostic, and predictive biomarker discovery.
Summary of strategies for studying genomic and epigenetic instability in chordoma
The genetic and epigenetic events involved in the development and progression of chordomas are not well understood, and biomarkers are still unknown. To gain further insight into the pathogenesis of this rare tumor entity, modern strategies for chordoma management require integrating and combining data at multiple dimensions from various genome-wide “-omics” approaches, such as chromosome-aberration research based on CGH and next-generation sequencing; mRNA and miR expression profiling; and DNA methylation profiling and functional studies of the identified genes and pathways (Figure 3).89 Furthermore, proteomic studies of chordoma tissues may also provide important information on this disease.90,91 The available genome-wide approaches and integration of data from multiple assay sources will bring deeper insight into the molecular mechanisms that regulate chordoma development and progression.
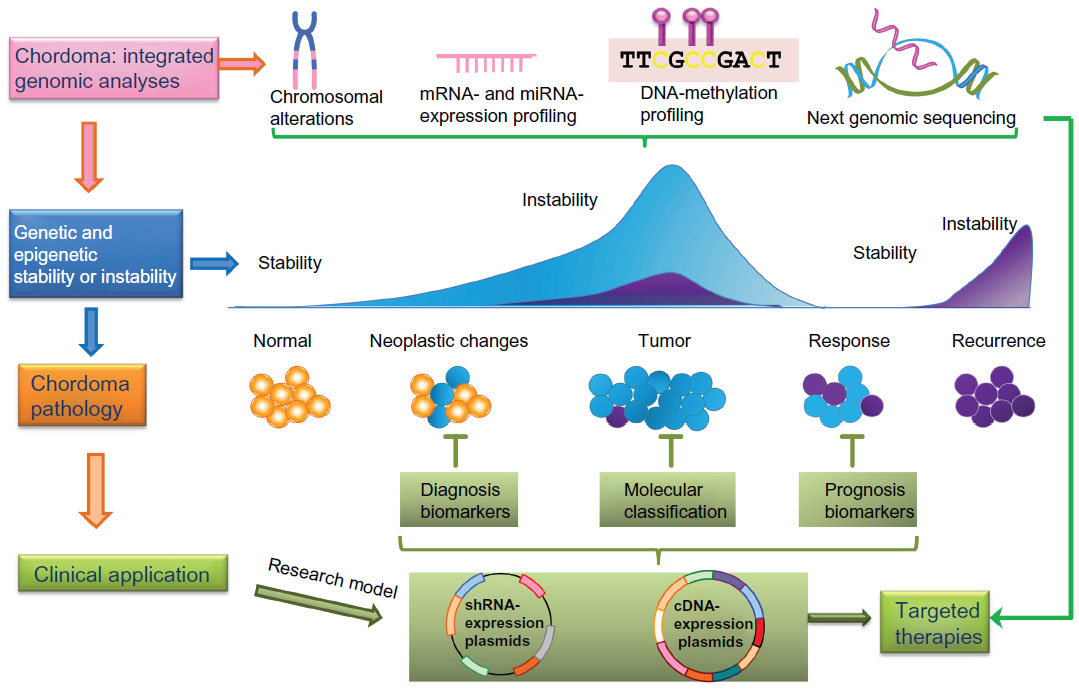 | Figure 3 The concept of integrative genomic approaches in the study of chordoma. Combinations of different genomic approaches, including chromosomal aberration analyses, messenger ribonucleic acid (mRNA)- and microRNA (miRNA)-expression profiling, deoxyribonucleic acid (DNA)-methylation analysis, and next-generation sequencing contribute to a better understanding of mechanisms underlying chordoma development and progression. The characterization of molecular changes of chordoma at multiple biological levels provides a deeper insight into tumor stratification (chordoma pathology), leading to improved chordoma diagnostics, treatment, and patient-outcome prediction. |
Potential diagnostic and therapeutic models of chordoma
The scarcity of preclinical diagnostic and therapeutic models hampers the development of new medical strategies in chordoma. Only a few chordoma cell lines and even fewer animal models are available for preclinical testing, and no druggable genetic drivers have been identified so far. A transplantable human chordoma-xenograft model for preclinical assessment of novel therapeutic strategies has been developed recently.92 In this study, eight samples taken from eight chordoma patients were implanted in nude mice. Four engrafted successfully, and gave rise to tumor masses. All four engraftments retained the histological, genetic, and biochemical features of the human chordomas from which they came. In one EGFR-positive xenograft, responsiveness to lapatinib was evaluated by comparing the pre- and posttreatment findings. This model was similar to human chordoma, and represents a new means of undertaking preclinical investigations and developing targeted therapies. A zebrafish model of chordoma initiated by notochord-driven expression of HRASV12 has been reported recently.93 The zebrafish tumors shared characteristics of human chordoma, as demonstrated by immunohistochemistry and electron microscopy. In another chordoma-xenograft model,56 the xenograft was serially transplantable, and was characterized by both gene-expression analysis and whole-genome SNP genotyping. Sensitivity to an inhibitor of IκB, as well as inhibition of an NFκB gene-expression signature demonstrated the importance of NFκB signaling for chordoma growth.
Conclusion and future prospects
In light of recent studies, significant advances in identifying the molecular signatures of chordoma enable us to decipher the underlying tumorigenesis mechanisms. It is clear that a link exists between genetic and epigenetic alterations (chromosomal rearrangements, DNA mutation/methylation, mRNA/miR expression) and chordoma development. These genomic and epigenetic instabilities can exhibit themselves at the nucleotide level as gross chromosomal alterations, as mutations/methylations/expression in the genes that encode crucial proteins are responsible for a variety of tumor cell-growth, proliferation, apoptosis, and drug-resistance mechanisms. In general, the current understanding of genomic and epigenetic instability in chordoma is very limited. Further work is needed to understand the causes (the molecular basis) and roles of these genomic and epigenetic instabilities in tumor cells. In recent years, interest in chordoma has grown dramatically, and important discoveries of chordoma biology have been revealed. These integrative approaches may also provide an opportunity to identify diagnostic and prognostic biomarkers that can be applied toward the personalization of cancer therapy and significantly improve chordoma clinical outcomes.
Disclosure
The authors report no conflicts of interest in this work.
References
Chugh R, Tawbi H, Lucas DR, Biermann JS, Schuetze SM, Baker LH. Chordoma: the nonsarcoma primary bone tumor. Oncologist. 2007;12(11):1344–1350. | |
Mindell ER. Chordoma. J Bone Joint Surg Am. 1981;63(3):501–505. | |
McMaster ML, Goldstein AM, Bromley CM, Ishibe N, Parry DM. Chordoma: incidence and survival patterns in the United States, 1973–1995. Cancer Causes Control. 2001;12(1):1–11. | |
Baratti D, Gronchi A, Pennacchioli E, et al. Chordoma: natural history and results in 28 patients treated at a single institution. Ann Surg Oncol. 2003;10(3):291–296. | |
O’Neill P, Bell BA, Miller JD, Jacobson I, Guthrie W. Fifty years of experience with chordomas in southeast Scotland. Neurosurgery. 1985;16(2):166–170. | |
Catton C, O’Sullivan B, Bell R, et al. Chordoma: long-term follow-up after radical photon irradiation. Radiother Oncol. 1996;41(1):67–72. | |
Jawad MU, Scully SP. Surgery significantly improves survival in patients with chordoma. Spine (Phila Pa 1976). 2010;35(1):117–123. | |
Beroukhim R, Mermel CH, Porter D, et al. The landscape of somatic copy-number alteration across human cancers. Nature. 2010;463(7283):899–905. | |
Lizardi PM, Forloni M, Wajapeyee N. Genome-wide approaches for cancer gene discovery. Trends Biotechnol. 2011;29(11):558–568. | |
Meyerson M, Gabriel S, Getz G. Advances in understanding cancer genomes through second-generation sequencing. Nat Rev Genet. 2010;11(10):685–696. | |
Rodríguez-Paredes M, Esteller M. Cancer epigenetics reaches mainstream oncology. Nat Med. 2011;17(3):330–339. | |
Thomas RK, Baker AC, Debiasi RM, et al. High-throughput oncogene mutation profiling in human cancer. Nat Genet. 2007;39(3):347–351. | |
Shaffer LG, Bejjani BA, Torchia B, Kirkpatrick S, Coppinger J, Ballif BC. The identification of microdeletion syndromes and other chromosome abnormalities: cytogenetic methods of the past, new technologies for the future. Am J Med Genet C Semin Med Genet. 2007;145C(4):335–345. | |
Szuhai K, Cleton-Jansen AM, Hogendoorn PC, Bovee JV. Molecular pathology and its diagnostic use in bone tumors. Cancer Genet. 2012;205(5):193–204. | |
Rydzanicz M, Wrzesinski T, Bluyssen HA, Wesoly J. Genomics and epigenomics of clear cell renal cell carcinoma: recent developments and potential applications. Cancer Lett. 2013;341(2):111–126. | |
Bayrakli F, Guney I, Kilic T, Ozek M, Pamir MN. New candidate chromosomal regions for chordoma development. Surg Neurol. 2007;68(4):425–430; discussion 430. | |
Horbinski C, Oakley GJ, Cieply K, et al. The prognostic value of Ki-67, p53, epidermal growth factor receptor, 1p36, 9p21, 10q23, and 17p13 in skull base chordomas. Arch Pathol Lab Med. 2010;134(8):1170–1176. | |
Larizza L, Mortini P, Riva P. Update on the cytogenetics and molecular genetics of chordoma. Hered Cancer Clin Pract. 2005;3(1):29–41. | |
Longoni M, Orzan F, Stroppi M, Boari N, Mortini P, Riva P. Evaluation of 1p36 markers and clinical outcome in a skull base chordoma study. Neuro Oncol. 2008;10(1):52–60. | |
Miozzo M, Dalpra L, Riva P, et al. A tumor suppressor locus in familial and sporadic chordoma maps to 1p36. Int J Cancer. 2000;87(1):68–72. | |
Riva P, Crosti F, Orzan F, et al. Mapping of candidate region for chordoma development to 1p36.13 by LOH analysis. Int J Cancer. 2003;107(3):493–497. | |
Blyth K, Cameron ER, Neil JC. The RUNX genes: gain or loss of function in cancer. Nat Rev Cancer. 2005;5(5):376–387. | |
Diaz RJ, Guduk M, Romagnuolo R, et al. High-resolution whole-genome analysis of skull base chordomas implicates FHIT loss in chordoma pathogenesis. Neoplasia. 2012;14(9):788–798. | |
Kuzniacka A, Mertens F, Strömbeck B, Wiegant J, Mandahl N. Combined binary ratio labeling fluorescence in situ hybridization analysis of chordoma. Cancer Genet Cytogenet. 2004;151(2):178–181. | |
Sommer J, Itani DM, Homlar KC, et al. Methylthioadenosine phosphorylase and activated insulin-like growth factor-1 receptor/insulin receptor: potential therapeutic targets in chordoma. J Pathol. 2010;220(5):608–617. | |
Hallor KH, Staaf J, Jönsson G, et al. Frequent deletion of the CDKN2A locus in chordoma: analysis of chromosomal imbalances using array comparative genomic hybridisation. Br J Cancer. 2008;98(2):434–442. | |
Le LP, Nielsen GP, Rosenberg AE, et al. Recurrent chromosomal copy number alterations in sporadic chordomas. PLoS One. 2011;6(5):e18846. | |
Naka T, Boltze C, Kuester D, et al. Alterations of G1-S checkpoint in chordoma: the prognostic impact of p53 overexpression. Cancer. 2005;104(6):1255–1263. | |
McDermott KM, Zhang J, Holst CR, Kozakiewicz BK, Singla V, Tlsty TD. p16(INK4a) prevents centrosome dysfunction and genomic instability in primary cells. PLoS Biol. 2006;4(3):e51. | |
Tang B, Testa JR, Kruger WD. Increasing the therapeutic index of 5-fluorouracil and 6-thioguanine by targeting loss of MTAP in tumor cells. Cancer Biol Ther. 2012;13(11):1082–1090. | |
Li J, Yen C, Liaw D, et al. PTEN, a putative protein tyrosine phosphatase gene mutated in human brain, breast, and prostate cancer. Science. 1997;275(5308):1943–1947. | |
Risinger JI, Hayes AK, Berchuck A, Barrett JC. PTEN/MMAC1 mutations in endometrial cancers. Cancer Res. 1997;57(21):4736–4738. | |
Scheil S, Brüderlein S, Liehr T, et al. Genome-wide analysis of sixteen chordomas by comparative genomic hybridization and cytogenetics of the first human chordoma cell line, U-CH1. Genes Chromosomes Cancer. 2001;32(3):203–211. | |
Han S, Polizzano C, Nielsen GP, Hornicek FJ, Rosenberg AE, Ramesh V. Aberrant hyperactivation of akt and mammalian target of rapamycin complex 1 signaling in sporadic chordomas. Clin Cancer Res. 2009;15(6):1940–1946. | |
Stahl JM, Cheung M, Sharma A, Trivedi NR, Shanmugam S, Robertson GP. Loss of PTEN promotes tumor development in malignant melanoma. Cancer Res. 2003;63(11):2881–2890. | |
Wu H, Goel V, Haluska FG. PTEN signaling pathways in melanoma. Oncogene. 2003;22(20):3113–3122. | |
Steelman LS, Chappell WH, Abrams SL, et al. Roles of the Raf/MEK/ERK and PI3K/PTEN/Akt/mTOR pathways in controlling growth and sensitivity to therapy – implications for cancer and aging. Aging (Albany NY). 2011;3(3):192–222. | |
Brüderlein S, Sommer JB, Meltzer PS, et al. Molecular characterization of putative chordoma cell lines. Sarcoma. 2010;2010:630129. | |
Lavin MF, Kozlov S. ATM activation and DNA damage response. Cell Cycle. 2007;6(8):931–942. | |
Hsu W, Mohyeldin A, Shah SR, et al. Generation of chordoma cell line JHC7 and the identification of brachyury as a novel molecular target. J Neurosurg. 2011;115(4):760–769. | |
Nelson AC, Pillay N, Henderson S, et al. An integrated functional genomics approach identifies the regulatory network directed by brachyury (T) in chordoma. J Pathol. 2012;228(3):274–285. | |
Nibu Y, José-Edwards DS, Di Gregorio A. From notochord formation to hereditary chordoma: the many roles of brachyury. Biomed Res Int. 2013;2013:826435. | |
Walcott BP, Nahed BV, Mohyeldin A, Coumans JV, Kahle KT, Ferreira MJ. Chordoma: current concepts, management, and future directions. Lancet Oncol. 2012;13(2):e69–e76. | |
Zhang L, Guo S, Schwab JH, et al. Tissue microarray immunohistochemical detection of brachyury is not a prognostic indicator in chordoma. PLoS One. 2013;8(9):e75851. | |
Yang XR, Ng D, Alcorta DA, et al. T (brachyury) gene duplication confers major susceptibility to familial chordoma. Nat Genet. 2009;41(11):1176–1178. | |
Presneau N, Shalaby A, Ye H, et al. Role of the transcription factor T (brachyury) in the pathogenesis of sporadic chordoma: a genetic and functional-based study. J Pathol. 2011;223(3):327–335. | |
Brandal P, Bjerkehagen B, Danielsen H, Heim S. Chromosome 7 abnormalities are common in chordomas. Cancer Genet Cytogenet. 2005;160(1):15–21. | |
Walter BA, Begnami M, Valera VA, Santi M, Rushing EJ, Quezado M. Gain of chromosome 7 by chromogenic in situ hybridization (CISH) in chordomas is correlated to c-MET expression. J Neurooncol. 2011;101(2):199–206. | |
Naka T, Boltze C, Samii A, et al. Expression of c-MET, low-molecular-weight cytokeratin, matrix metalloproteinases-1 and -2 in spinal chordoma. Histopathology. 2009;54(5):607–613. | |
Naka T, Iwamoto Y, Shinohara N, Ushijima M, Chuman H, Tsuneyoshi M. Expression of c-met proto-oncogene product (c-MET) in benign and malignant bone tumors. Mod Pathol. 1997;10(8):832–838. | |
Naka T, Kuester D, Boltze C, et al. Expression of hepatocyte growth factor and c-MET in skull base chordoma. Cancer. 2008;112(1):104–110. | |
Grabellus F, Konik MJ, Worm K, et al. MET overexpressing chordomas frequently exhibit polysomy of chromosome 7 but no MET activation through sarcoma-specific gene fusions. Tumour Biol. 2010;31(3):157–163. | |
Pillay N, Plagnol V, Tarpey PS, et al. A common single-nucleotide variant in T is strongly associated with chordoma. Nat Genet. 2012;44(11):1185–1187. | |
Wu Z, Wang K, Wang L, et al. The brachyury Gly177Asp SNP is not associated with a risk of skull base chordoma in the Chinese population. Int J Mol Sci. 2013;14(11):21258–21265. | |
Schwab JH, Boland PJ, Agaram NP, et al. Chordoma and chondrosarcoma gene profile: implications for immunotherapy. Cancer Immunol Immunother. 2009;58(3):339–349. | |
Trucco MM, Awad O, Wilky BA, et al. A novel chordoma xenograft allows in vivo drug testing and reveals the importance of NF-κB signaling in chordoma biology. PLoS One. 2013;8(11):e79950. | |
Dhe-Paganon S, Syeda F, Park L. DNA methyl transferase 1: regulatory mechanisms and implications in health and disease. Int J Biochem Mol Biol. 2011;2(1):58–66. | |
Hsieh J, Gage FH. Epigenetic control of neural stem cell fate. Curr Opin Genet Dev. 2004;14(5):461–469. | |
Robertson KD. DNA methylation and human disease. Nat Rev Genet. 2005;6(8):597–610. | |
Sandoval J, Esteller M. Cancer epigenomics: beyond genomics. Curr Opin Genet Dev. 2012;22(1):50–55. | |
Herman JG, Baylin SB. Gene silencing in cancer in association with promoter hypermethylation. N Engl J Med. 2003;349(21):2042–2054. | |
Ransohoff DF. Cancer. Developing molecular biomarkers for cancer. Science. 2003;299(5613):1679–1680. | |
Hernández HG, Tse MY, Pang SC, Arboleda H, Forero DA. Optimizing methodologies for PCR-based DNA methylation analysis. Biotechniques. 2013;55(4):181–197. | |
Jaenisch R, Bird A. Epigenetic regulation of gene expression: how the genome integrates intrinsic and environmental signals. Nat Genet. 2003;33 Suppl:245–254. | |
Rinner B, Weinhaeusel A, Lohberger B, et al. Chordoma characterization of significant changes of the DNA methylation pattern. PLoS One. 2013;8(3):e56609. | |
Shi XB, Tepper CG, deVere White RW. Cancerous miRNAs and their regulation. Cell Cycle. 2008;7(11):1529–1538. | |
Tong AW, Nemunaitis J. Modulation of miRNA activity in human cancer: a new paradigm for cancer gene therapy? Cancer Gene Ther. 2008;15(6):341–355. | |
Bartel DP. MicroRNAs: genomics, biogenesis, mechanism, and function. Cell. 2004;116(2):281–297. | |
Medina PP, Slack FJ. MicroRNAs and cancer: an overview. Cell Cycle. 2008;7(16):2485–2492. | |
Bayrak OF, Gulluoglu S, Aydemir E, et al. MicroRNA expression profiling reveals the potential function of microRNA-31 in chordomas. J Neurooncol. 2013;115(2):143–151. | |
Duan Z, Choy E, Nielsen GP, et al. Differential expression of microRNA (miRNA) in chordoma reveals a role for miRNA-1 in Met expression. J Orthop Res. 2010;28(6):746–752. | |
Long C, Jiang L, Wei F, et al. Integrated miRNA-mRNA analysis revealing the potential roles of miRNAs in chordomas. PLoS One. 2013;8(6):e66676. | |
Phillip CJ, Stellrecht CM, Nimmanapalli R, Gandhi V. Targeting MET transcription as a therapeutic strategy in multiple myeloma. Cancer Chemother Pharmacol. 2009;63(4):587–597. | |
Ostroumov E, Hunter CJ. Identifying mechanisms for therapeutic intervention in chordoma: c-Met oncoprotein. Spine (Phila Pa 1976). 2008;33(25):2774–2780. | |
Duan Z, Shen J, Yang X, et al. Prognostic significance of miRNA-1 (miR-1) expression in patients with chordoma. J Orthop Res. 2014;32(5):695–701. | |
Comoglio PM, Giordano S, Trusolino L. Drug development of MET inhibitors: targeting oncogene addiction and expedience. Nat Rev Drug Discov. 2008;7(6):504–516. | |
Hua D, Ding D, Han X, et al. Human miR-31 targets radixin and inhibits migration and invasion of glioma cells. Oncol Rep. 2012;27(3):700–706. | |
Valderrama F, Thevapala S, Ridley AJ. Radixin regulates cell migration and cell-cell adhesion through Rac1. J Cell Sci. 2012;125(Pt 14):3310–3319. | |
Zheng B, Liang L, Huang S, et al. MicroRNA-409 suppresses tumour cell invasion and metastasis by directly targeting radixin in gastric cancers. Oncogene. 2012;31(42):4509–4516. | |
Medina R, Zaidi SK, Liu CG, et al. MicroRNAs 221 and 222 bypass quiescence and compromise cell survival. Cancer Res. 2008;68(8):2773–2780. | |
Santarpia L, Lippman SM, El-Naggar AK. Targeting the MAPK-RAS-RAF signaling pathway in cancer therapy. Expert Opin Ther Targets. 2012;16(1):103–119. | |
Whelan JT, Hollis SE, Cha DS, Asch AS, Lee MH. Post-transcriptional regulation of the Ras-ERK/MAPK signaling pathway. J Cell Physiol. 2012;227(3):1235–1241. | |
Tamborini E, Virdis E, Negri T, et al. Analysis of receptor tyrosine kinases (RTKs) and downstream pathways in chordomas. Neuro Oncol. 2010;12(8):776–789. | |
Pan J, Hu H, Zhou Z, et al. Tumor-suppressive mir-663 gene induces mitotic catastrophe growth arrest in human gastric cancer cells. Oncol Rep. 2010;24(1):105–112. | |
Wang Y, Gao X, Wei F, et al. Diagnostic and prognostic value of circulating miR-21 for cancer: a systematic review and meta-analysis. Gene. 2014;533(1):389–397. | |
Pencheva N, Tran H, Buss C, et al. Convergent multi-miRNA targeting of ApoE drives LRP1/LRP8-dependent melanoma metastasis and angiogenesis. Cell. 2012;151(5):1068–1082. | |
Sand M, Skrygan M, Sand D, et al. Expression of microRNAs in basal cell carcinoma. Br J Dermatol. 2012;167(4):847–855. | |
Saito K, Inagaki K, Kamimoto T, et al. MicroRNA-196a is a putative diagnostic biomarker and therapeutic target for laryngeal cancer. PLoS One. 2013;8(8):e71480. | |
Bell DW. Our changing view of the genomic landscape of cancer. J Pathol. 2010;220(2):231–243. | |
DeLaney TF, Duan Z, Hornicek FJ. Proteomic profiling of chordoma. J Surg Oncol. 2010;102(7):719. | |
Zhou H, Chen CB, Lan J, et al. Differential proteomic profiling of chordomas and analysis of prognostic factors. J Surg Oncol. 2010;102(7):720–727. | |
Bozzi F, Manenti G, Conca E, et al. Development of transplantable human chordoma xenograft for preclinical assessment of novel therapeutic strategies. Neuro Oncol. 2014;16(1):72–80. | |
Burger A, Vasilyev A, Tomar R, et al. A zebrafish model of chordoma initiated by notochord-driven expression of HRASV12. Dis Model Mech. Epub December 5, 2013. |
 © 2014 The Author(s). This work is published and licensed by Dove Medical Press Limited. The full terms of this license are available at https://www.dovepress.com/terms.php and incorporate the Creative Commons Attribution - Non Commercial (unported, v3.0) License.
By accessing the work you hereby accept the Terms. Non-commercial uses of the work are permitted without any further permission from Dove Medical Press Limited, provided the work is properly attributed. For permission for commercial use of this work, please see paragraphs 4.2 and 5 of our Terms.
© 2014 The Author(s). This work is published and licensed by Dove Medical Press Limited. The full terms of this license are available at https://www.dovepress.com/terms.php and incorporate the Creative Commons Attribution - Non Commercial (unported, v3.0) License.
By accessing the work you hereby accept the Terms. Non-commercial uses of the work are permitted without any further permission from Dove Medical Press Limited, provided the work is properly attributed. For permission for commercial use of this work, please see paragraphs 4.2 and 5 of our Terms.