")
Back to Journals » Drug Design, Development and Therapy » Volume 14
Galangin Improved Non-Alcoholic Fatty Liver Disease in Mice by Promoting Autophagy
Authors Zhang X, Deng Y, Xiang J , Liu H, Zhang J, Liao J, Chen K, Liu B, Liu J, Pu Y
Received 25 April 2020
Accepted for publication 23 July 2020
Published 19 August 2020 Volume 2020:14 Pages 3393—3405
DOI https://doi.org/10.2147/DDDT.S258187
Checked for plagiarism Yes
Review by Single anonymous peer review
Peer reviewer comments 2
Editor who approved publication: Prof. Dr. Tin Wui Wong
Xinxu Zhang, Yuanyuan Deng, Juan Xiang, Huixia Liu, Jiani Zhang, Jie Liao, Ke Chen, Bo Liu, Jun Liu, Ying Pu
Department of Geriatric Endocrinology, Xiangya Hospital, Central South University, Changsha, Hunan 410008, People’s Republic of China
Correspondence: Ying Pu
Department of Geriatric Endocrinology, Xiangya Hospital, Central South University, 87 Xiangya Road, Kaifu District, Changsha, Hunan 410008, People’s Republic of China
Tel +86 137 8727 3373
Email [email protected]
Background: Previous studies have shown that curcumin derivatives can improve the fatty degeneration of liver tissue that occurs in nonalcoholic fatty liver disease (NAFLD). However, the specific mechanism for that improvement remains unclear. We examined whether the curcumin derivative galangin could reduce the fatty degeneration of liver tissue in mice with NAFLD by inducing autophagy, from the perspective of both prevention and treatment.
Methods: C57BL/6J mice were randomly assigned to a prevention group (given galangin and a HFD simultaneously) or a treatment group (given galangin after being fed an HFD). The prevention group was treated with galangin (100 mg/kg/d) or an equal volume of normal saline (NS) while being fed an HFD. Some mice were treated with an autophagy inhibitor (3-methyladenine, 3-MA; 30 mg/kg/biwk, i.p.) while being fed an HFD and galangin. HepG2 cells were cultured in DMEM medium containing both free fatty acids and galangin.
Results: Galangin was found to reduce the fatty degeneration of liver tissue induced by eating an HFD at both the prevention and treatment levels, and that effect might be related to an enhancement of hepatocyte autophagy. Inhibition of autophagy by 3-MA blocked the protective effect of galangin on hepatic steatosis. At the cellular level, galangin reduced lipid accumulation and enhanced the level of hepatocyte autophagy.
Conclusion: In vitro and in vivo studies showed that galangin cannot only improve pre-existing hepatic steatosis but also prevent the development of stenosis by promoting hepatocyte autophagy.
Keywords: nonalcoholic fatty liver disease, autophagy, galangin, 3-methyladenine, free fatty acid
Corrigendum for this paper has been published
Introduction
Non-alcoholic fatty liver disease (NAFLD) is an increasing cause of liver disease worldwide, and especially in Western countries.1 NAFSD is the most common form of chronic liver disease in the United States, where it affects ~25% of the population. However, the overall prevalence of NAFLD in Asia is now estimated to be 29.6% and may have surpassed that in Western countries.2 The incidence rate of NAFD has been increasing on a yearly basis, and the median age of those patients has steadily declined, making NAFD a significant public health problem.3–5 NAFLD is a general term that includes diseases such as simple nonalcoholic fatty liver disease, nonalcoholic fatty liver hepatitis (NASH), liver fibrosis, liver cirrhosis, and even late-stage hepatocellular carcinoma.6 Nonetheless, the pathogenesis of NAFLD has not been fully elucidated.
Autophagy is a vital process by which the body’s cells eliminate unnecessary or damaged components by transporting damaged organelles, unfolded proteins, and intracellular pathogens into lysosomes for degradation.7 Autophagy is an evolutionarily conserved intracellular degradative function that is crucial for cellular development, differentiation, survival, and homeostasis.8 Accumulating evidence suggests important links between the regulation of autophagy and liver complications associated with obesity and NAFLD.9–11 In particular, a previous study of the drug liraglutide indicated that the promotion of autophagy can ameliorate the effects of NAFLD via the SIRT1/SIRT3-FOXO3a pathway.10
The autophagy process is dependent on a multitude of signaling pathways. Adenosine monophosphate activated protein kinase (AMPK) functions as a regulator of cell energy metabolism,12–14 and phosphorylated AMPK (pAMPK) plays a key role in autophagy.15 Mammalian target of rapamycin (mTOR), as one of the main autophagy inhibitory pathways, also plays an important role in the occurrence of autophagy.16 It has been demonstrated that Beclin1, autophagy-related gene 3 (Atg3), and microtubule-associated protein light chain-1 (LC3-I) and LC3-II are significantly related to the autophagy process.17,18
Galangin is a flavonol compound and curcumin derivative extracted from the root of Alpinia officinarum.19 Accumulating evidence suggests that galangin can induce autophagy;20–22 however, the effect of galangin on NAFLD has not been explored. In this study, we investigated the effects of galangin on lipid metabolism and autophagy in a mouse model of NAFLD in order to provide an experimental basis for finding new targets for treating that disease.
Methods
Animal Treatment
SPF male C57BL/6J mice were purchased from the Laboratory Animal Department of Xiangya Medical College, Central South University. All mice were 4–5 weeks old and were housed separate cages in a room maintained at 20–24°C. Food and water were available ad libitum. All procedures involving animals were approved by the Ethics Committee of the Laboratory Animal Department of Xiangya Hospital of Central South University and were performed in accordance with its ethical guidelines. The C57BL/6J mice were randomly assigned to a prevention group and a treatment group after adaptive feeding for 1 week.
Mice in the prevention group were further divided into the following five subgroups (4 to 5 mice per subgroup). Group #1, normal chow diet (NC) group: mice were fed a normal control diet and purified water (Research diet, D12450J); Group #2, HFD group: mice were fed an HFD (60% fat) and purified water (Research diet, D12942); Group 3, HFD + galangin (H+G) group: mice were treated with galangin (100 mg/kg, i.g, daily, MCE) dissolved in purified water and fed a high fat diet; Group #4, High fat + galangin + 3-MA (H+G+3-MA) group: mice were fed a high-fat diet and treated with galangin dissolved in purified water, and also treated with 3-MA (30 mg/kg, IP, three times per week, MCE) dissolved in normal saline; 5. HFD + normal saline (H+NS) group: mice were fed a high-fat diet (60% fat) and purified water, and also treated with normal saline (IP, three times per week, MCE, volume equal to the 3-MA solution). All mice in the prevention group were fed their respective diets for 8 weeks.
All mice in the treatment group, except those in subgroup #1, (normal control [NC] group fed a normal diet and purified water) were fed an HFD for 8 weeks, and then divided into the following subgroups. Group #2, HFD group: mice were fed a diet containing 60% fat (Research diet, D12942) for another 4 weeks; Group 3, HFD + galangin (H+G) group: mice were fed galangin dissolved in purified water along with their high-fat diet; Group 4. HFD + galangin + 3-MA (H+G+3-MA) group: mice were fed galangin dissolved in purified water and were treated with 3-MA (30 mg/kg, IP, three times per week, MCE) dissolved in normal saline along with eating a high-fat diet; Group 5, HFD + normal saline (H+NS) group: mice were fed a diet containing 60% fat, plus purified water, and were treated with normal saline (IP, three times per week, MCE, volume equal to the 3-MA solution). The treatment group was fed for 12 weeks.
The hair color, food intake, water intake, and mental activity of the mice in each cage were observed on a daily basis, and their weights were recorded on a weekly basis. At the end of treatment, the mice in each group were anesthetized by an intraperitoneal injection of pentobarbital sodium; after which, their eyeballs were extracted and blood samples were collected for analysis. Approximately 0.8 mL of blood was collected into a tube containing heparin, and let sit at room temperature for 20 min. The blood sample was then centrifuged at 4000 rpm (4°C) for 5 min, and the supernatant was transferred to a new centrifuge tube and tested for various biochemical parameters. After a blood sample was collected, each mouse was sacrificed by cervical dislocation and placed in an ice box. Next, the body was sheared to open the abdomen, a dissection was performed, and the liver tissues were collected and placed in a centrifuge tube pre-filled with 4% formalin solution (Biosharp, BL539A). Samples of liver tissue were stained with oil red O or hematoxylin-eosin (HE). The remaining tissues were frozen in liquid nitrogen and subsequently transferred to a −80° refrigerator for later analyses in Western blot and qRT-PCR studies.
Cell Culture and Treatment
HepG2 cells (ATCC, Manassas, VA, USA) were cultured in DMEM (Gibco, Waltham, MA, USA) supplemented with 10% fetal bovine serum (10% FBS, Gibco) at 37°C in a humidified atmosphere containing 5% CO2. Oleic acid and palmitic acid (2:1, Sigma-Aldrich, St. Louis, MO, USA) were conjugated to bovine serum albumin (Gibco) to create a free fatty acid (FFA) mixture. To create an in vitro model of hepatic steatosis (NAFLD cell), HepG2 cells were exposed to a 1 mM concentration of the FFA mixture for 24 h to induce lipid accumulation within the cells.23 The effect of galangin on the survival of NAFLD model cells was determined by the MTT (Beyotime, China) method. NAFLD cells are divided into administration wells (6 types of galangin at different concentrations), blank control wells (without galangin), and zero adjustment wells (equal amounts of culture solution). Five replicate wells were created in 96-well plates to screen for the appropriate interventional drug concentration. In the prevention group: ① an FFA+G subgroup was created that had the most suitable concentration of galangin in high-fat culture medium, and the cells were incubated in the medium for 24 h; ② an FFA+G+3-MA subgroup was created that used the most suitable concentration of galangin in high-fat culture medium, and the cells were incubated in the medium along with 5 mM 3-MA for 24 h; ③ an FFA+vehicle subgroup was created by adding DMSO (<1%) to the high-fat medium and incubating the cells for 24 h; ④ a blank control subgroup was created using HepG2 cultured under normal conditions, and ⑤ a positive control subgroup (FFA group) was created by culturing HepG2 cells in high-fat medium. The treatment group: ① FFA+G subgroup: HepG2 cells were exposed to a 1 mM concentration of high-fat medium for 24 h, and then cultured with the optimum concentration of galangin for 12 h; ② an FFA+G+3-MA group was created that used the most suitable concentration of galangin to culture cells for another 12 h after they had been previously cultured in high-fat medium treatment for 24 h; ③ an FFA+vehicle group was created by culturing cells in medium containing vehicle (1% DMSO) for 12 h after they had been previously cultured in high-fat medium for 24 h; ④ a blank control group consisted of HepG2 cells cultured under normal conditions, and ⑤ a positive control group (FFA group) consisted of HepG2 cells cultured in high-fat medium.
Immunoblotting Analysis
Liver tissues or harvested cells were homogenized and sonicated in RIPA (strong) protein extract buffer (Beyotime) containing a protease inhibitor and phosphatase inhibitor (Mannheim Roche, Germany). Equal amounts of protein were separated on SDS-polyacrylamide gels in a mini-gel apparatus (Bio-Rad, Hercules, CA, USA). Next, the protein bands were transferred onto polyvinylidene fluoride (Millipore, IPVH00010, Burlington, MA, USA) membranes that were blocked with 5% milk at room temperature for 1 h. The membranes were then incubated overnight at 4°C with the following primary antibodies: anti-Beclin1 (Abclonal, A7353), anti-ATG3 (Abclonal, A5809), anti-Caspase-3 (Abclonal, A19654), anti-mTOR (Abclonal, A2445), anti-AMPK (Abclonal, A16960), anti-LC3-II&LC3-I (CST, #12741S), anti-p-AMPKα1 (CST, #2537S) or anti-β-actin-HRP (Bioworld, BS6007MH). After being washed 3 times, the membranes were incubated with goat anti-rabbit antibody (Abclonal, AS014) for 1 h at room temperature. Next, the membranes were washed again, and the immunostained protein bands were visualized by enhanced chemiluminescence (Thermo Scientific, 32106, Waltham, MA, USA). NoveVR 4. 6. 2 software (Bio-Rad) was to analyze the staining intensity of each band.
Biochemical Assays
Serum levels of alanine aminotransferase (ALT) and aspartate aminotransferase (AST) were measured by members of the Department of Geriatrics, Xiangya Hospital, Central South University. Liver cholesterol (CHOL) and triglyceride (TG) levels were measured using a commercially available kit (Nanjing Jiancheng Corp., Nanjing, China).
HE Staining
Specimens of liver tissue were fixed in 4% paraformaldehyde for at least 24 h, and then embedded with paraffin. The paraffin-embedded sections (5 um) were stained with hematoxylin-eosin, and their morphological features were photographed using an Olympus light microscope (Olympus, Tokyo, Japan).
Oil Red O Staining and Intracellular Triglyceride Assay
Liver cryosections or HepG2 cells were stained with Oil red O (ORO, Wellbio) solution to visualize intracellular lipid accumulations, as previously described.24 In brief, the cryosections or cells were washed twice with PBS and then fixed with 4% paraformaldehyde for 30 min. Slides with the stained cryosections or cells were washed with 60% isopropanol for 10 s, and then stained with ORO solution for 30 min at room temperature. After another wash with 60% isopropanol, the cells or sections were counterstained with hematoxylin. The red-stained lipid droplets were then photographed using an Olympus light microscope (Olympus, Japan).
Real-time Polymerase Chain Reaction
Total liver RNA was isolated using a TransZol Up Plus RNA Kit (TransGen Biotech, Beijing, China, ER501), and then reverse-transcribed into cDNA with an All-in-One First-Strand cDNA synthesis kit (TransGen Biotech, AT341). The cDNA was subjected to quantitative real-time PCR performed using a CFX384 Touch System (Bio-Rad). All expression levels were normalized to β-actin levels in the same sample. Quantitative analyses were performed using the 2-ΔΔCt method. The sequences of the primer pairs are listed in Table 1.
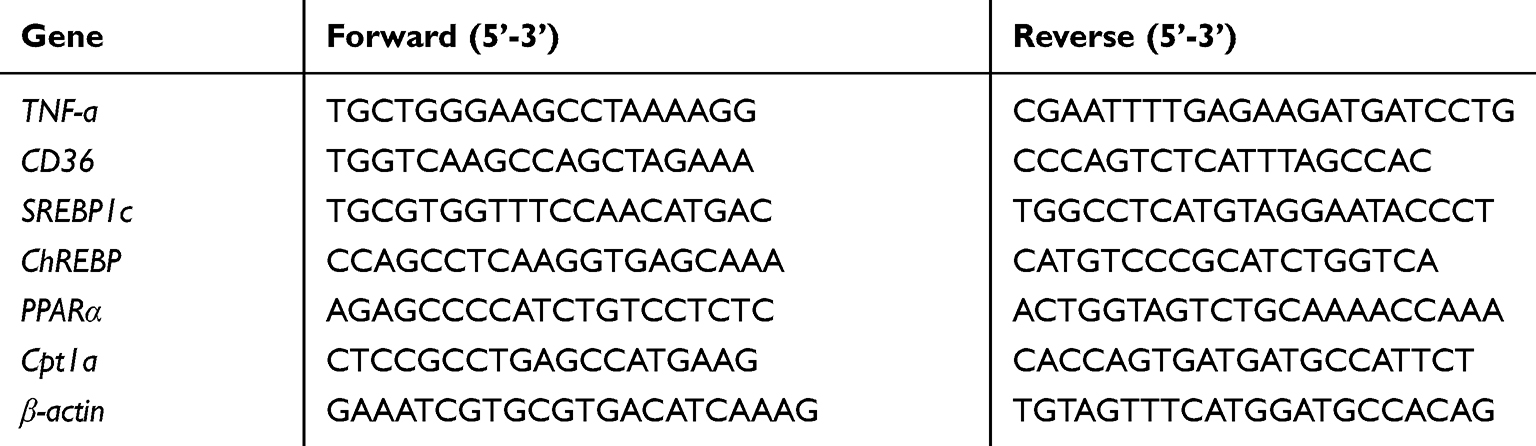 |
Table 1 Primers Used for Real-Time PCR |
Statistical Analysis
All data were analyzed using IBM SPSS Statistics for Windows, Version 23 (IBM Corp, Armonk, NY, USA). Results are expressed as the mean ± SEM. Statistical significance was estimated by using t-test and one-way ANOVA. P-values <0.05 were considered to be statistically significant.
Results
Galangin Helped to Protect Against Fatty Degeneration of Liver Tissue in HFD Mice
We employed an HFD mouse model to determine the effect of galangin on fatty degeneration of the liver. Our results showed that the serum ALT and AST levels, as well as mouse body weights, liver wet weights, and TG and CHOL levels in samples of liver tissue from the HFD group were significantly higher than those from the NC group. When combined with HE staining results that showed increased numbers of fat vacuoles and severe liver damage in the HFD group, our findings indicated that the HFD model had been successfully established (Figures 1 and 2). It is noteworthy that galangin treatment administered either simultaneous with an HFD or at 8 weeks after eating an HFD significantly decreased HFD-associated indexes, and also reduced tissue damage and lipid deposition, as shown by HE and Oil Red O (ORO) staining results. However, treatment with 3-MA, which affects hepatocyte autophagy, partially attenuated the protective effect of galangin against hepatic steatosis (Figures 1 and 2).
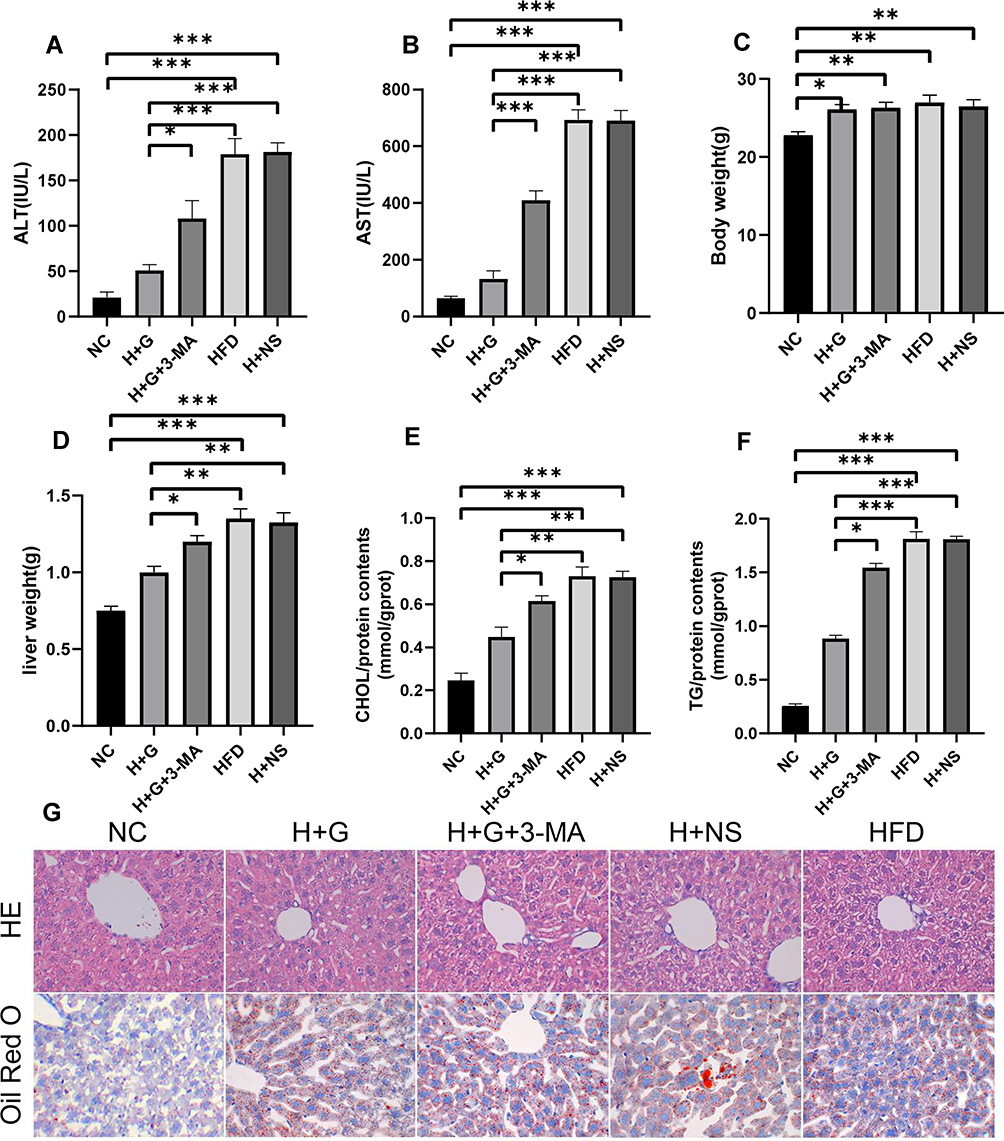 |
Figure 1 Preventive administration of galangin reduced hepatic steatosis. Mice were fed a HFD or a normal control diet (NC) for 8 weeks. Galangin (100 mg/kg/d) was given orally for 8 weeks. (A) ALT and (B) AST levels. (C) Weights of the mice in each group. (D) Wet weight of the liver. (E) TG content in liver tissue. (F) CHOL content in liver tissue. (G) Liver sections stained with HE or ORO (x400). The displayed value represents the mean value ± SEM (n = 4). Asterisks (*P < 0.05, **P < 0.01, ***P < 0.001) indicate statistically significant differences. |
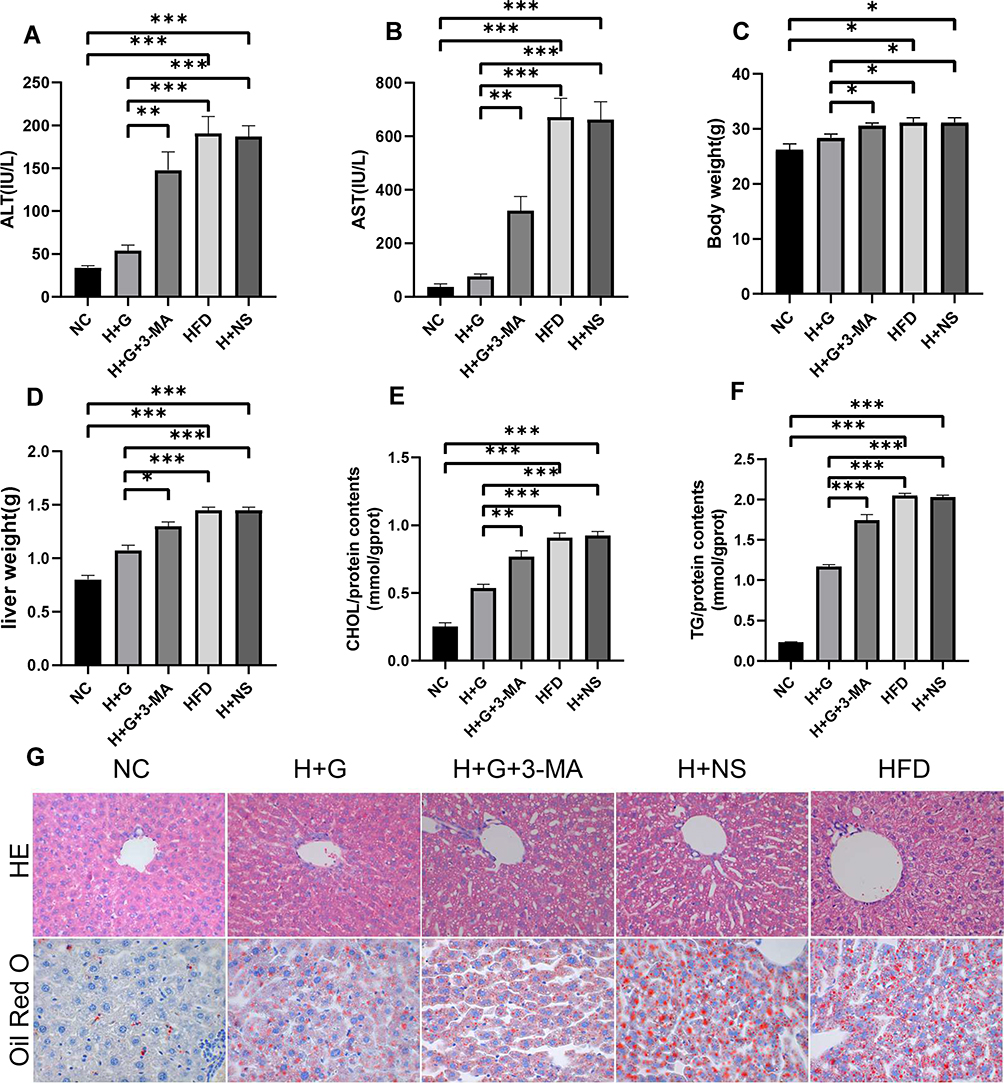 |
Figure 2 Galangin administration reduced hepatic steatosis in NAFLD mice. After the mice were fed HFD or control normal diet for 8 weeks, galangin (100 mg/kg/d) was given orally for the next 4 weeks. (A) ALT and (B) AST levels. (C) Weights of the mice in each group. (D) Wet weight of the liver. (E) TG content in liver tissue. (F) CHOL content in liver tissue. (G) Liver sections stained with HE or ORO (x400). The displayed value represents the mean value ± SEM (n = 4). Asterisks (*P < 0.05, **P < 0.01, ***P < 0.001) indicate statistically significant differences. |
Galangin Reduced FFA-Induced Lipid Accumulation in HepG2 Cells
The mechanism by which galangin affects the status of liver tissue was further investigated in vitro using HepG2 cells. MTT assays showed that galangin had no significant effect on cell viability when administered in the concentration range of 50–100 μmol/L (P > 0.05), but significantly decreased cell the survival rate when given at a concentration >150 μmol/L (P < 0.05) (Figure 3). Based on those results, 100 μM was accepted as the appropriate concentration for use in treatment.
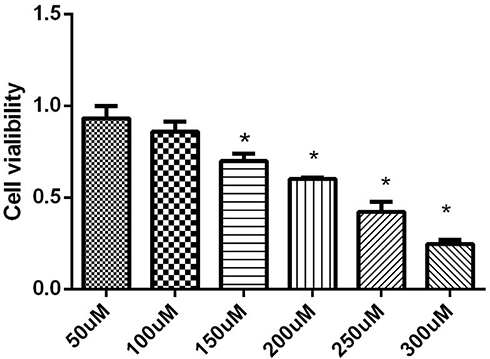 |
Figure 3 Effect of galangin at different concentrations on NAFLD cell viability. Asterisks (*P < 0.05) indicate statistically significant differences. |
HepG2 cells were exposed to the FFA mixture for 24 h. At the same time, 100 μM galangin was added to the free fatty acids administered to the prevention group and treatment group for a 12 h period starting at 24 h after free fatty acid treatment. As shown in Figure 4A–B, the TG contents in the FFA group were significantly increased in both the prevention group and treatment group, when compared to those in the untreated HepG2 cells (P < 0.05). Increased accumulations of intracellular lipid droplets were also found in cells that were exposed to FFAs for 24 h (Figure 4C). Similar to the in vivo result for galangin in HFD mice, our in vitro data indicated that galangin significantly inhibited lipid deposition in hepatocytes, and significantly downregulated TG levels (P < 0.05), whereas those effects were markedly reduced by treatment with 3-MA (Figure 4). The combined in vivo and in vitro data further suggested that autophagy was involved in reducing lipid accumulations in NAFLD hepatocytes.
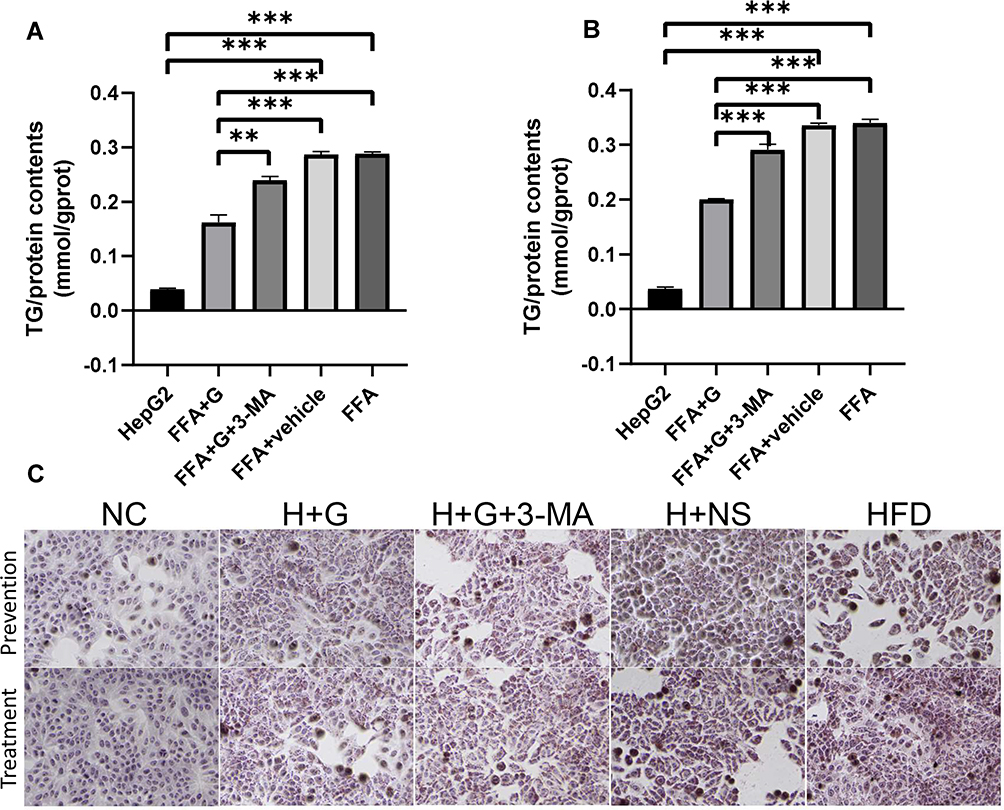 |
Figure 4 Galangin reduced FFA-induced lipid accumulation in HepG2 cells. (A) TG content in HepG2 cells in the prevention group. (B) TG content in HepG2 cells in the treatment group. (C) ORO staining (x400) was used to observe lipid deposits in each group of HepG2 cells. The displayed value represents the mean value ± SEM (n = 3). Asterisks (**P < 0.01, ***P < 0.001) indicate statistically significant differences. |
Galangin Improved Hepatocyte Steatosis by Inducing Autophagy Both in vivo and in vitro
In order to determine whether induction of hepatocyte autophagy was the mechanism by which galangin protected against hepatic steatosis, we detected the levels of becline1, LC3-II/LC3-I, mTOR, Atg3, AMPKα1, and phosphorylated AMPKα1 protein expression in both the prevention group (Figure 5A and C) and treatment group (Figure 5B and D) in vivo and in vitro. We found that the levels of becline1, Atg3, LC3-II, AMPKα1, and phosphorylated AMPKα1 were decreased, while mTOR expression was increased both in the HFD mice (Figure 5A and B) and NAFLD cells, when compared with those levels in control groups (Figure 5C and D). Notably, treatment with galangin increased the levels of becline1, LC3-II/LC3-I, Atg3, AMPKα1, and phosphorylated AMPKα1 protein expression, and decreased mTOR expression. However, those changes in protein expression were inhibited by 3-MA treatment, indicating that the autophagy activity induced by galangin was inhibited.
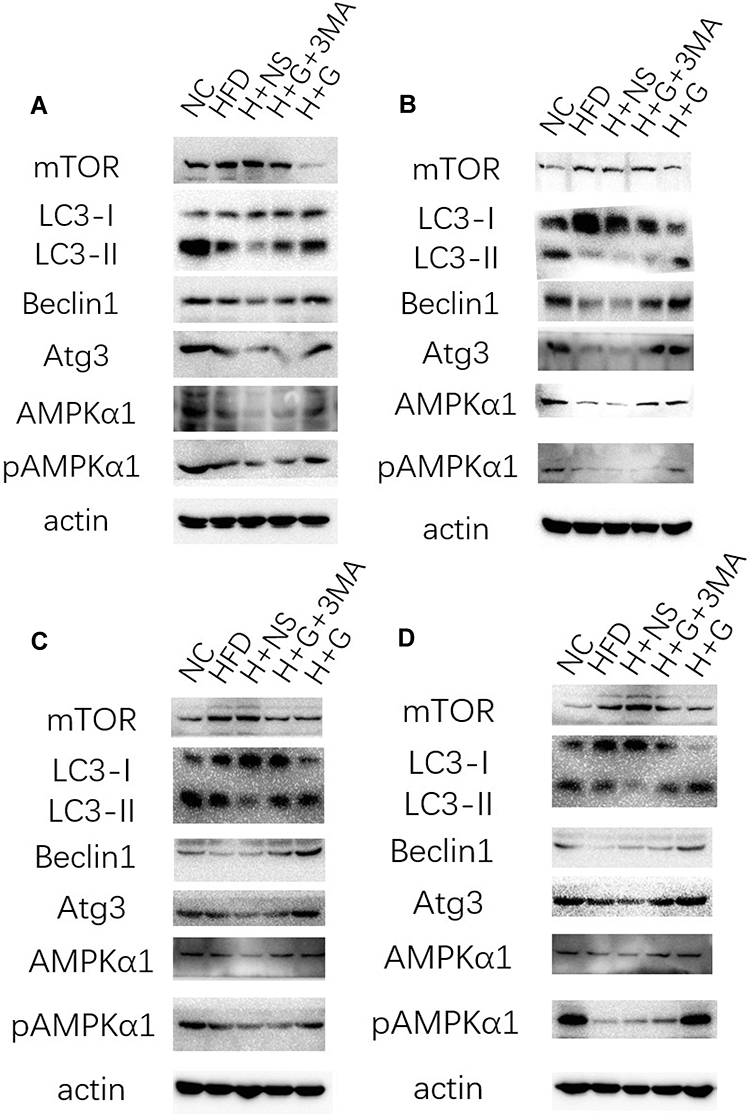 |
Figure 5 Galangin induced hepatocyte autophagy in vivo and in vitro. Western blotting for mTOR, LC3-I/II, Beclin1, Atg3, AMPKα1, and pAMPKα1 expression was performed in the following groups: (A) C57BL/6 mice were fed a normal diet (NC) or HFD for 8 weeks, and galangin (100 mg/kg/d) H+G) or normal saline (H+NS) was given by stomach irrigation. Some of the mice that were fed galangin and a HFD diet were also injected with 3-MA (30 mg/kg, three times per week, IP) (H+G+3-MA) before their liver tissues were harvested. (B) C57BL/6 mice were fed a normal diet (NC) or HFD for 8 weeks and then given galangin (100 mg/kg/d) (H+G) or normal saline (H+NS). Some of the mice fed galangin and a HFD were also injected with 3-MA (30 mg/kg three times per week, IP) (H+G+3-MA). Some of the mice were fed only a HFD for another 4 weeks (HFD) before their liver tissues were harvested. (C) HepG2 cells were induced by free fatty acids (FFAs) for 24 h and then treated with galangin (100 μM) (FFA+G) and vehicle (DMSO) (FFA+vehicle). In order to study the effect of galangin on autophagy, a 3-MA (5 mM) co-treatment group (FFA+G+3-MA) was added for comparison. (D) HepG2 cells were treated with galangin (100 μM) for 12 h (FFA+G) or with vehicle (DMSO) plus FFAs (FFAs+vehicle) after 24 hours of FFA induction. In order to study the effect of galangin on autophagy, a 3-MA (5 mM) co-treatment group (FFA+G+3-MA) was partially added to the FFA+G treatment group for comparison. |
The Enhanced Autophagy Induced by Galangin Reduced Inflammation and Regulated Liver Lipid Metabolism
We examined the effects of galangin-induced autophagy on hepatic stenosis in mice while they were being fed an HFD and also at 8 weeks after being fed that diet. We found that TNF-α mRNAs levels in the HFD group were increased when compared with those in the NC group. However, galangin treatment eliminated that increase. Interestingly, as autophagy was suppressed by 3-MA, the anti-inflammatory effect of galangin became more limited, resulting in elevated levels of TNF-α mRNA expression (Figures 6A and 7A). In order to evaluate the impact on fatty acid uptake, liver fat, and steatosis, we examined the levels of fatty acid translocase (CD36) gene expression, activated carbohydrate response element-binding protein (ChREBP) expression, and sterol regulatory element-binding protein 1C (SREBP-1c) expression. Our results showed that the up-regulated levels of CD36, SREBP1c, and ChREBP expression in the livers of mice fed an HFD were significantly decreased by galangin (Figures 6B–D and 7B–D). An assessment of fatty acid oxidation showed that the levels of PPARα and CPT1a mRNA in HFD mice were significantly increased after the mice had been treated with galangin (Figures 6E and F, 7E and F). Nonetheless, we noticed that 3-MA reduced the ability of galangin to regulate lipid metabolism in the liver, indicating that impaired autophagy had attenuated the improvement in liver steatosis.
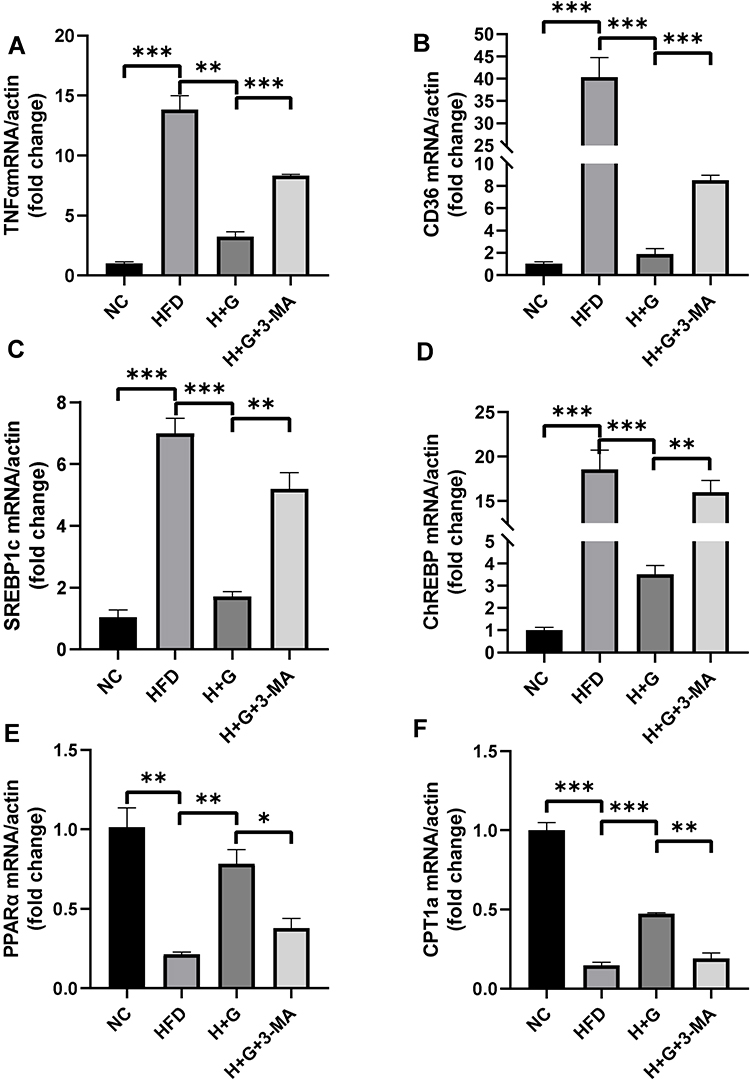 |
Figure 6 Effect of galangin on liver inflammation and lipid metabolism-related gene expression in mice in the prevention group. Mice were fed a normal diet (NC) or HFD for 8 weeks, and galangin (100 mg/kg, stomach irrigation) (H+G) was administered each day at the same time. The HFD-fed mice were co-treated with galangin and 3-methyladenine (3-MA, 30 mg/kg, IP, three times per week) (H+G+3-MA) prior to being sacrificed. Liver inflammation- and lipid metabolism-related gene expression in mouse liver tissue was detected by real-time PCR. (A) TNF-α mRNA expression. (B) Fatty acid translocase (CD36) mRNA expression. (C and D) SREBP1c (C) and ChREBP (D) mRNA expression. (E and F) PPARα (E) mRNA expression and expression of its target gene, CPT1a (F). Each value represents a mean value ± SEM (n = 3). The asterisks (*P < 0.05, **P < 0.01, ***P < 0.001) indicate a statistically significant difference. |
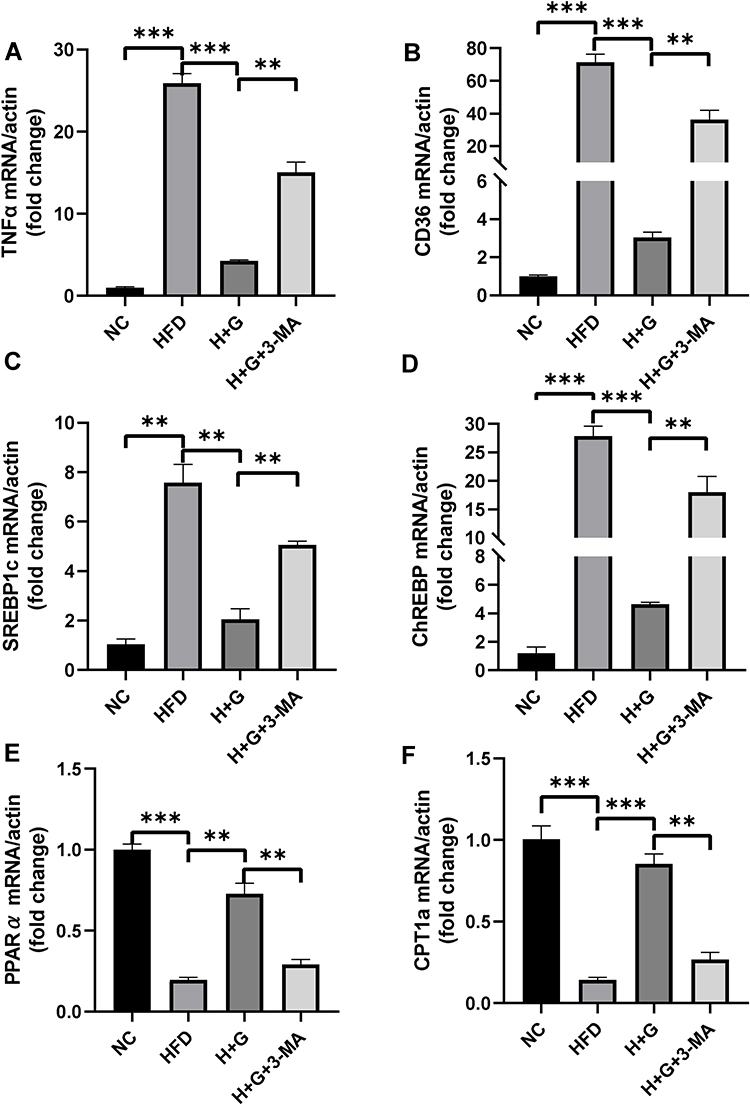 |
Figure 7 Effects of galangin on liver inflammation and lipid metabolism-related gene expression in mice in the treatment group. Mice were fed a normal diet (NC) or high-fat diet (HFD) for 8 weeks. Galangin (100 mg/kg, stomach irrigation) (H+G) was administered each day for another 4 weeks. The HFD-fed mice were co-treated with galangin and 3-methyladenine (3-MA, 30 mg/kg, IP, three times per week) (H+G+3-MA) for another 4 weeks prior to being sacrificed. Liver inflammation- and lipid metabolism-related gene expression in samples of mouse liver tissue was detected by real-time PCR. (A) TNF-α mRNA expression. (B) Fatty acid translocase (CD36) mRNA expression. (C and D) SREBP1c (C) and ChREBP (D) mRNA expression. (E and F) PPARα (E) mRNA expression and CPT1a mRNA expression (F). Values represent the mean value ± SEM (n = 3). The asterisks (**P < 0.01, ***P < 0.001) indicate a statistically significant difference. |
Discussion
Galangin (3,5,7-trihydroxyflavone) is a flavonoid compound found at high concentrations in lesser galangal. It has been shown that galangin can inhibit 12-O-tetradecanoylphorbol-13-acetate (TPA)-induced invasion and metastasis of HepG2 liver cancer cells via a protein kinase C/extracellular signal-regulated kinase (PKC/ERK) pathway, suggesting it as a possible anti-metastatic agent.25 Galangin was also found to inhibit liver fibrosis, possibly by removing oxygen free radicals, decreasing lipid peroxidation, and inhibiting the activation and proliferation of hepatic stellate cells.26 Because galangin has shown remarkable effects in liver-associated diseases, we explored its role in protecting against the effects of HFD or FFA-induced hepatic steatosis. Studies with our HFD mouse model demonstrated that galangin could effectively reduce the levels of serum ALT and AST, and also reduce body weight, liver wet weight, and TG and CHOL levels in liver tissue, either via simultaneous administration with an HFD or administration at 8 weeks after an HFD. Additionally, the numbers of morphological changes and lipid droplets in specimens of liver tissue were markedly decreased by galangin as observed by hematoxylin-eosin (HE) staining and Oil Red O staining, respectively. Our findings regarding decreased indices of non-alcoholic fatty liver disease (NAFLD) severity are in line with previous evidence indicating that galangin could improve liver function.27 Furthermore, similar results were obtained when using an in vitro cell model consisting of HepG2 cells that were treated with 100 μM galangin.28 Our in vitro data demonstrated that galangin reduced FFA-induced lipid deposits in HepG2 cells.
Autophagy induction has been widely accepted as a protective mechanism that maintains intracellular homeostasis under stressful conditions.29 At the basic level of liver autophagy, intracellular components and organelles are degraded in lysosomes to prevent the intracellular accumulation of degradation products such as lipid droplets.30 In our study, inhibition of autophagy caused significant TG and CHOL accumulations in the liver cells of mice fed an HFD. In contrast, autophagy recovery or enhancement has been shown to improve steatosis.31,32 These observations indicate that autophagy induction may be an effective strategy for treating fatty liver. Our study showed that hepatic autophagy was suppressed in mice fed an HFD and also in FFA-treated HepG2 cells; however, those effects were clearly reversed by galangin, suggesting that galangin affected the autophagy process. To further validate the link between autophagy and the protective effects of galangin, we used 3-methyladenine (3-MA), the most widely used inhibitor of autophagy,33 to restrict galangin-induced autophagy. The beneficial effects of galangin on hepatic steatosis, both in vivo and in vitro, were clearly reduced by 3-MA treatment. Our results confirmed that galangin could induce autophagy, and a previous study reported that galangin mediated autophagy via a p53-dependent pathway as well as by deacetylation of LC3 by SIRT1 in HepG2 cells.28,34
We further investigated the effects of autophagy on inflammation and regulation of liver lipid metabolism in nonalcoholic fatty liver disease. Increasing evidence indicates that autophagy helps to prevent against cellular conditions that favor the development of NAFLD.35 Autophagy is involved in attenuating inflammation and liver injury. Human obesity is associated with increased levels of circulating TNF-α (a proinflammatory cytokine that induces hepatocyte death), and our previous study showed that autophagy induced by galangin was related to a decrease in TNF-α levels.36 The presence of TG droplets in liver cells may reflect an imbalance in the processes of fatty acid uptake, hepatic triglyceride synthesis, and fatty acid oxidation and/or secretion.37 For that reason, we examined the fatty acid translocase CD36 gene, which is related to fatty acid uptake.38 SREBP1c and ChREBP are the main transcription factors that promote the transcription of fat synthesis genes, and also participate in and promote the synthesis of TGs in the liver.39 The TG levels in liver cells can maintain a dynamic equilibrium without fatty acid β oxidation via a process in which peroxisome proliferator activated receptor α (PPARα) plays a key role in enhancing the expression of fatty acid oxidases such as carnitine palmitoyltransferase (CPT), and promoting lipid oxidation.40 Our data revealed that galangin down-regulated the levels of CD36, SREBP1c and ChREBP in the livers of mice fed an HFD, but increased the levels of PPARα and CPT1a mRNA in those mice. That information validated previous results that showed reduced hepatic triglyceride levels were associated with fatty acid uptake and triglyceride synthesis.41,42 Taken together, our results indicated that galangin-induced autophagy exerted anti-inflammatory effects. We also found that galangin-induced autophagy could inhibit fatty acid uptake and lipogenesis, and also promote TG oxidation. These findings suggest that galangin may play a role in reducing inflammation and modulating lipid metabolism.
Conclusions
Our study demonstrated that galangin protects against hepatic steatosis by stimulating autophagy. Furthermore, it also showed that galangin-induced autophagy reduced liver inflammation and regulated lipid metabolism in mice. These results suggest that galangin administration and autophagy induction may be effective strategies for treating hepatic steatosis.
Disclosure
The authors declare that they have no conflicts of interest regarding this study.
References
1. Yue F, Xia K, Wei L, et al. Effects of constant light exposure on sphingolipidomics and progression of NASH in high-fat-fed rats. J Gastroenterol Hepatol. 2020. doi:10.1111/jgh.15005
2. Wong SW, Chan WK. Epidemiology of non-alcoholic fatty liver disease in Asia. Indian J Gastroenterol. 2020;39(1):1–8. doi:10.1007/s12664-020-01018-x
3. Musso G, Gambino R, Cassader M, Pagano G. Meta-analysis: natural history of non-alcoholic fatty liver disease (NAFLD) and diagnostic accuracy of non-invasive tests for liver disease severity. Ann Med. 2011;43(8):617–649. doi:10.3109/07853890.2010.518623
4. Soderberg C, Stal P, Askling J, et al. Decreased survival of subjects with elevated liver function tests during a 28-year follow-up. Hepatology. 2010;51(2):595–602. doi:10.1002/hep.23314
5. Pan X, Wang P, Luo J, et al. Adipogenic changes of hepatocytes in a high-fat diet-induced fatty liver mice model and non-alcoholic fatty liver disease patients. Endocrine. 2015;48(3):834–847. doi:10.1007/s12020-014-0384-x
6. Brunt EM. Pathology of nonalcoholic fatty liver disease. Nat Rev Gastroenterol Hepatol. 2010;7(4):195–203. doi:10.1038/nrgastro.2010.21
7. Liu S, Huang T, Liu R, et al. Spermidine suppresses development of experimental abdominal aortic aneurysms. J Am Heart Assoc. 2020;9(8):e014757. doi:10.1161/JAHA.119.014757
8. Khambu B, Yan S, Huda N, Liu G, Yin XM. Autophagy in non-alcoholic fatty liver disease and alcoholic liver disease. Liver Res. 2018;2(3):112–119. doi:10.1016/j.livres.2018.09.004
9. Stacchiotti A, Grossi I, Garcia-Gomez R, et al. Melatonin effects on non-alcoholic fatty liver disease are related to microRNA-34a-5p/Sirt1 axis and autophagy. Cells. 2019;8(9):1053. doi:10.3390/cells8091053
10. Zhang L, Yao Z, Ji G. Herbal extracts and natural products in alleviating non-alcoholic fatty liver disease via activating autophagy. Front Pharmacol. 2018;9:1459. doi:10.3389/fphar.2018.01459
11. Tong W, Ju L, Qiu M, et al. Liraglutide ameliorates non-alcoholic fatty liver disease by enhancing mitochondrial architecture and promoting autophagy through the SIRT1/SIRT3-FOXO3a pathway. Hepatol Res. 2016;46(9):933–943. doi:10.1111/hepr.12634
12. Zhang HA, Yang XY, Xiao YF. AMPKα1 overexpression alleviates the hepatocyte model of nonalcoholic fatty liver disease via inactivating p38MAPK pathway. Biochem Biophys Res Commun. 2016;474(2):364–370. doi:10.1016/j.bbrc.2016.04.111
13. Kamikubo R, Kai K, Tsuji-Naito K, Akagawa M. β-Caryophyllene attenuates palmitate-induced lipid accumulation through AMPK signaling by activating CB2 receptor in human HepG2 hepatocytes. Mol Nutr Food Res. 2016;60(10):2228–2242. doi:10.1002/mnfr.201600197
14. You B, Dun Y, Zhang W, et al. Anti-insulin resistance effects of salidroside through mitochondrial quality control. J Endocrinol. 2020;244:383–393.
15. Jager S, Handschin C, St-Pierre J, Spiegelman BM. AMP-activated protein kinase (AMPK) action in skeletal muscle via direct phosphorylation of PGC-1alpha. Proc Natl Acad Sci U S A. 2007;104(29):12017–12022. doi:10.1073/pnas.0705070104
16. Shinojima N, Yokoyama T, Kondo Y, Kondo S. Roles of the Akt/mTOR/p70S6K and ERK1/2 signaling pathways in curcumin-induced autophagy. Autophagy. 2007;3(6):635–637. doi:10.4161/auto.4916
17. Zhou T, Ye L, Bai Y, et al. Autophagy and apoptosis in hepatocellular carcinoma induced by EF25-(GSH)2: a novel curcumin analog. PLoS One. 2014;9(9):e107876. doi:10.1371/journal.pone.0107876
18. Fujita N, Itoh T, Omori H, Fukuda M, Noda T, Yoshimori T. The Atg16L complex specifies the site of LC3 lipidation for membrane biogenesis in autophagy. Mol Biol Cell. 2008;19(5):2092–2100. doi:10.1091/mbc.e07-12-1257
19. Yu S, Gong L-S, Li N-F, Pan Y-F, Zhang L. Galangin (GG) combined with cisplatin (DDP) to suppress human lung cancer by inhibition of STAT3-regulated NF-κB and Bcl-2/Bax signaling pathways. Biomed Pharmacother. 2018;97:213–224. doi:10.1016/j.biopha.2017.10.059
20. Zhang HT, Wu J, Wen M, Su LJ, Luo H. Galangin induces apoptosis in hepatocellular carcinoma cells through the caspase 8/t-Bid mitochondrial pathway. J Asian Nat Prod Res. 2012;14(7):626–633. doi:10.1080/10286020.2012.682152
21. Zhang HT, Luo H, Wu J, et al. Galangin induces apoptosis of hepatocellular carcinoma cells via the mitochondrial pathway. World J Gastroenterol. 2010;16(27):3377–3384. doi:10.3748/wjg.v16.i27.3377
22. Kong Y, Feng Z, Chen A, et al. The natural flavonoid galangin elicits apoptosis, pyroptosis, and autophagy in glioblastoma. Front Oncol. 2019;9:942. doi:10.3389/fonc.2019.00942
23. Li R, Guo E, Yang J, et al. 1,25(OH)2 D3 attenuates hepatic steatosis by inducing autophagy in mice. Obesity. 2017;25(3):561–571. doi:10.1002/oby.21757
24. Li M, Meng X, Xu J, et al. GPR40 agonist ameliorates liver X receptor-induced lipid accumulation in liver by activating AMPK pathway. Sci Rep. 2016;6:25237. doi:10.1038/srep25237
25. Chien ST, Shi MD, Lee YC, Te CC, Shih YW. Galangin, a novel dietary flavonoid, attenuates metastatic feature via PKC/ERK signaling pathway in TPA-treated liver cancer HepG2 cells. Cancer Cell Int. 2015;15:15. doi:10.1186/s12935-015-0168-2
26. Wang X, Gong G, Yang W, Li Y, Jiang M, Li L. Antifibrotic activity of galangin, a novel function evaluated in animal liver fibrosis model. Environ Toxicol Pharmacol. 2013;36(2):288–295. doi:10.1016/j.etap.2013.04.004
27. Gelli C, Tarocchi M, Abenavoli L, Di Renzo L, Galli A, De Lorenzo A. Effect of a counseling-supported treatment with the Mediterranean diet and physical activity on the severity of the non-alcoholic fatty liver disease. World J Gastroenterol. 2017;23(17):3150–3162. doi:10.3748/wjg.v23.i17.3150
28. Wen M, Wu J, Luo H, Zhang H. Galangin induces autophagy through upregulation of p53 in HepG2 cells. Pharmacology. 2012;89(5–6):247–255. doi:10.1159/000337041
29. Madrigal-Matute J, Cuervo AM. Regulation of liver metabolism by autophagy. Gastroenterology. 2016;150(2):328–339. doi:10.1053/j.gastro.2015.09.042
30. Komatsu M. Liver autophagy: physiology and pathology. J Biochem. 2012;152(1):5–15. doi:10.1093/jb/mvs059
31. Sinha RA, Farah BL, Singh BK, et al. Caffeine stimulates hepatic lipid metabolism by the autophagy-lysosomal pathway in mice. Hepatology. 2014;59(4):1366–1380. doi:10.1002/hep.26667
32. Yang L, Li P, Fu S, Calay ES, Hotamisligil GS. Defective hepatic autophagy in obesity promotes ER stress and causes insulin resistance. Cell Metab. 2010;11(6):467–478. doi:10.1016/j.cmet.2010.04.005
33. Wu Y, Wang X, Guo H, et al. Synthesis and screening of 3-MA derivatives for autophagy inhibitors. Autophagy. 2013;9(4):595–603. doi:10.4161/auto.23641
34. Li X, Wang Y, Xiong Y, et al. Galangin induces autophagy via deacetylation of LC3 by SIRT1 in HepG2 cells. Sci Rep. 2016;6:30496. doi:10.1038/srep30496
35. Liu Y, Zhou X, Xiao Y, et al. miR-188 promotes liver steatosis and insulin resistance via the autophagy pathway. J Endocrinol. 2020;245(3):411–423. doi:10.1530/JOE-20-0033
36. Youssry S, Kamel MA. Effect of folate supplementation on immunological and autophagy markers in experimental nonalcoholic fatty liver disease. Eur Cytokine Netw. 2019;30(4):135–143. doi:10.1684/ecn.2019.0437
37. Musso G, Gambino R, Cassader M. Recent insights into hepatic lipid metabolism in non-alcoholic fatty liver disease (NAFLD). Prog Lipid Res. 2009;48(1):1–26. doi:10.1016/j.plipres.2008.08.001
38. Miquilena-Colina ME, Lima-Cabello E, Sanchez-Campos S, et al. Hepatic fatty acid translocase CD36 upregulation is associated with insulin resistance, hyperinsulinaemia and increased steatosis in non-alcoholic steatohepatitis and chronic hepatitis C. Gut. 2011;60(10):1394–1402. doi:10.1136/gut.2010.222844
39. Cohen JC, Horton JD, Hobbs HH. Human fatty liver disease: old questions and new insights. Science. 2011;332(6037):1519–1523. doi:10.1126/science.1204265
40. Aoyama T, Peters JM, Iritani N, et al. Altered constitutive expression of fatty acid-metabolizing enzymes in mice lacking the peroxisome proliferator-activated receptor α (PPARα). J Biol Chem. 1998;273(10):5678–5684. doi:10.1074/jbc.273.10.5678
41. Wooten JS, Nick TN, Seija A, Poole KE, Stout KB. High-fructose intake impairs the hepatic hypolipidemic effects of a high-fat fish-oil diet in C57BL/6 mice. J Clin Exp Hepatol. 2016;6(4):265–274. doi:10.1016/j.jceh.2016.09.001
42. Janevski M, Ratnayake S, Siljanovski S, McGlynn MA, Cameron-Smith D, Lewandowski P. Fructose containing sugars modulate mRNA of lipogenic genes ACC and FAS and protein levels of transcription factors ChREBP and SREBP1c with no effect on body weight or liver fat. Food Funct. 2012;3(2):141–149. doi:10.1039/C1FO10111K
 © 2020 The Author(s). This work is published and licensed by Dove Medical Press Limited. The full terms of this license are available at https://www.dovepress.com/terms.php and incorporate the Creative Commons Attribution - Non Commercial (unported, v3.0) License.
By accessing the work you hereby accept the Terms. Non-commercial uses of the work are permitted without any further permission from Dove Medical Press Limited, provided the work is properly attributed. For permission for commercial use of this work, please see paragraphs 4.2 and 5 of our Terms.
© 2020 The Author(s). This work is published and licensed by Dove Medical Press Limited. The full terms of this license are available at https://www.dovepress.com/terms.php and incorporate the Creative Commons Attribution - Non Commercial (unported, v3.0) License.
By accessing the work you hereby accept the Terms. Non-commercial uses of the work are permitted without any further permission from Dove Medical Press Limited, provided the work is properly attributed. For permission for commercial use of this work, please see paragraphs 4.2 and 5 of our Terms.