")
Back to Journals » International Journal of Nanomedicine » Volume 13
Functionalization-dependent effects of cellulose nanofibrils on tolerogenic mechanisms of human dendritic cells
Authors Tomić S , Ilić N , Kokol V , Gruden-Movsesijan A, Mihajlović D, Bekić M, Sofronić-Milosavljević L , Čolić M, Vučević D
Received 11 August 2018
Accepted for publication 15 September 2018
Published 31 October 2018 Volume 2018:13 Pages 6941—6960
DOI https://doi.org/10.2147/IJN.S183510
Checked for plagiarism Yes
Review by Single anonymous peer review
Peer reviewer comments 2
Editor who approved publication: Dr Thomas Webster
Sergej Tomić,1,2 Nataša Ilić,1 Vanja Kokol,3 Alisa Gruden-Movsesijan,1 Dušan Mihajlović,2 Marina Bekić,1 Ljiljana Sofronić-Milosavljević,1 Miodrag Čolić,1,2,4 Dragana Vučević2
1Institute for the Application of Nuclear Energy, University of Belgrade, Belgrade, Serbia; 2Institute for Medical Research, Medical Faculty of the Military Medical Academy, University of Defense, Belgrade, Serbia; 3Institute of Engineering Materials and Design, University of Maribor, Maribor, Slovenia; 4Medical Faculty Foča, University of East Sarajevo, Foča, Bosnia and Herzegovina
Background: Cellulose nanofibrils (CNF) are attractive nanomaterials for various biomedical applications due to their excellent biocompatibility and biomimetic properties. However, their immunoregulatory properties are insufficiently investigated, especially in relation to their functionalization, which could cause problems during their clinical application.
Methods: Using a model of human dendritic cells (DC), which have a central role in the regulation of immune response, we investigated how differentially functionalized CNF, ie, native (n) CNF, 2,2,6,6-tetramethylpiperidine 1-oxyl radical-oxidized (c) CNF, and 3-aminopropylphosphoric acid-functionalized (APAc) CNF, affect DC properties, their viability, morphology, differentiation and maturation potential, and the capacity to regulate T cell-mediated immune response.
Results: Nontoxic doses of APAcCNF displayed the strongest inhibitory effects on DC differentiation, maturation, and T helper (Th) 1 and Th17 polarization capacity, followed by cCNF and nCNF, respectively. These results correlated with a specific pattern of regulatory cytokines production by APAcCNF-DC and their increased capacity to induce suppressive CD8+CD25+IL-10+ regulatory T cells in immunoglobulin-like transcript (ILT)-3- and ILT-4-dependent manner. In contrast, nCNF-DC induced predominantly suppressive CD4+CD25hiFoxP3hi regulatory T cells in indolamine 2,3-dioxygenase-1-dependent manner. Different tolerogenic properties of CNF correlated with their size and APA functionalization, as well as with different expression of CD209 and actin bundles at the place of contact with CNF.
Conclusion: The capacity to induce different types of DC-mediated tolerogenic immune responses by functionalized CNF opens new perspectives for their application as well-tolerated nanomaterials in tissue engineering and novel platforms for the therapy of inflammatory T cell-mediated pathologies.
Keywords: cellulose nanofibrils, biocompatibility, tolerogenic dendritic cells, regulatory T-cell subsets, immunomodulation
Plain language summary
Cellulose nanofibrils (CNF) display fascinating potential for application in biomedicine, and they are suitable for loading with different biomolecules, such as the osteogenesis-promoting phosphonates. Recently, our group showed that native CNF display an intrinsic potential to induce immune tolerance, thus lowering the possibility of adverse immune reactions upon implantation. However, it remained unknown as to how the modification of CNF with biomolecules may affect their immunomodulatory properties. Here, we showed that phosphonation of CNF enhances their capacity to induce anti-inflammatory and tolerogenic properties in human dendritic cells (DC), key cells controlling the immune response. The effects rely on a switch in tolerogenic mechanisms used by DC to spread tolerance via regulatory T-cell subsets. These results open new perspectives for the application of CNF, not only as well-tolerated scaffolds in tissue engineering and regenerative medicine, but also as a novel platform for a controlled DC-mediated induction of tolerogenic immune responses in immunotherapies of autoimmune diseases or allogenic transplantation.
Introduction
Research on the production of nanocellulose-based materials has significantly increased over the last few decades owing to their nanoscale dimensions and unique optical, electrical, magnetic, and mechanical properties, as well as biodegradability and nontoxicity.1 Cellulose nanofibrils (CNF) became highly attractive natural nanomaterials for biomedical applications. Thanks to their alternating crystalline and amorphous structures, physical properties of CNF resemble more to body nanofibers.2 In this sense, CNF have already been explored as scaffolds in tissue engineering,3 tridimensional matrices supporting cell growth,4 wound dressings,5 and others. A specific surface chemistry of CNF enables the formation of hydrogels, long-lasting drug delivery systems,6 and engineered biomimetic surfaces,7 all of which allow their multifunctional application.8 Although recent studies confirmed the good biocompatibility of CNF,9,10 their slow degradability in vivo11 could be a problem if the scaffold needs to be replaced gradually by a natural extracellular matrix.4 The oxidation of CNF was shown to be an efficient way of increasing their degradability,12 which also enables their functionalization with biomolecules.7 In line with this, we showed previously that 2,2,6,6-tetramethylpiperidine 1-oxyl radical (TEMPO)-oxidized carboxylated-CNF (cCNF) can be functionalized efficiently with 3-aminopropylphosphoric acid (APA), to introduce phosphonate groups onto CNF-based scaffolds. Besides providing desirable porosity and mechanical properties, the phosphonation of CNF promoted osteogenic differentiation of mesenchymal stem cells, and increased Ca deposition and the formation of hydroxyapatite-like structures for bone tissue engineering.7 In addition to inducing a beneficial response in target tissue, a biomaterial should not elicit any adverse local or systemic reactions, especially those related to unwanted immune response.13 However, except for a few investigations on different cellulose-based materials,14–16 the immunological properties of native and functionalized CNF are largely unknown.
Key immune cells regulating the immune response, including the response to biomaterials and nanomaterials, are DC.17 DC can recognize nanomaterials17,18 and respond by triggering pro-inflammatory/immunogenic or anti-inflammatory/tolerogenic immune response, depending on the nanomaterials’ size, surface chemistry, charge, functional groups, and other parameters.17 Immunogenic DC are characterized by high expression of major histocompatibility complex and costimulatory molecules, and an increased production ratio of pro-inflammatory vs anti-inflammatory cytokines, particularly interleukin (IL)-12 p70/IL-10.19 This correlates with the increased capacity of DC to induce differentiation of T helper (Th) 1, Th17 cells, and cytotoxic CD8+ T lymphocytes, which are critically involved not only in fighting infections and tumors20 but also in graft destruction21 and autoimmune processes.22 In contrast, the induction of anti-inflammatory response and immune tolerance is mediated by DC with immature or semi-matured phenotype,23 increased expression of co-inhibitory molecules, such as immunoglobulin-like transcript (ILT)-3 and ILT-4 molecules, and immunosuppressive factors, such as indolamine 2,3-dyoxigenase (IDO)-1,24 IL-10, IL-27, and transforming growth factor (TGF)-β.25 These features were shown to be critical for the induction of regulatory CD4+ and CD8+ T-cell subpopulations,26 as well as for tolerogenic DC-mediated suppression of autoimmune processes,27 increased transplant survival,28 and implant tolerance.29 Recent studies suggested that CD8+ Treg subpopulations may exhibit stronger suppressive capacity than the more familiar CD4+ Treg subpopulations.30 However, it is still unknown which Treg subpopulation is involved predominantly in a particular DC-mediated tolerogenic immune response, and whether these processes can be manipulated precisely for DC-based therapy.
New approaches for the manipulation of DC functions came from the recently described intrinsic immunomodulatory properties of biomaterials and nanomaterials.25 We discovered that nCNF are able to induce immunoregulatory cytokine profile in human peripheral blood mononuclear cells (PBMC) cultures.9 The effects correlated with the intrinsic capacity of nCNF to induce tolerogenic properties in human DC with a lower Th1/Th17-polarization capacity, and an increased capacity to induce anti-inflammatory Th2 cells and suppressive Treg cells.31 These properties of nCNF could be beneficial for scaffold tolerance, wound healing, and chronic inflammation therapies.31 However, it is not known as to how additional modification of nCNF through oxidation and functionalization with phosphonate groups modifies their cytocompatibility and DC-mediated immunomodulatory effects. Such investigations are prerequisite for the safe application of functionalized CNF, since unwanted stimulation or suppression of immune response may compromise their efficacy and induce adverse effects. The study objective was to compare the effects of nCNF, cCNF, and APAcCNF on human DC phenotype and functions, as well as the mechanisms involved in CNF actions on DC and DC-mediated control of the immune response.
Materials and methods
Synthesis and characterization of CNF
Native CNF (nCNF, 20–50 nm thick and several μm long) were produced from bleached birch pulp and were obtained as 2.5 wt% water dispersion (Betulium Ltd., Espoo, Finland).7 Oxidized (carboxylated) CNF (cCNF, 3–5 nm thick and 500–2,000 nm long; bearing 1.3±0.1 mmol/g of carboxylic groups) were prepared by TEMPO-oxidation of native CNF12 as 1.14 wt% water dispersion (Betulium Ltd.), and used for further functionalization with APA (Sigma-Aldrich Co., St Louis, MO, USA). The APA molecules were coupled to cCNF under heterogeneous conditions, using carbodiimide chemistry to produce APA-functionalized (APAc) CNF (0.5 wt%). Briefly, APA (17.5 mg) was suspended in 4 mL of Milli-Q water, prior to mixing with 25 mL of 0.5% w/v of cCNF dispersion in 0.05 M 2-(N morpholino) ethanesulfonic acid buffer, corresponding to a 1:1 M ratio between the carboxylic groups of cCNF and amino groups of APA (0.5 wt% in water). Carboxylic groups of cCNF were activated with 1-ethyl-3 (3-dimethylaminopropyl)-1 – carbodiimide hydrochloride and N-hydroxy succinimide in 10:1 M ratio to the carboxylic groups, and the dispersion was incubated at room temperature for 24 hours under mild shaking conditions, followed by a complete dialysis through cellulose membrane of 1 kDa cutoff.7 All CNF and APA samples were characterized as described previously,7 and sterilized in sealed glass tubes in an autoclave at 121°C for 15 minutes, and then sonicated for 15 minutes prior to use. For the transmission electron microscopy (TEM) analysis, nCNF, cCNF, and APAcCNF were centrifuged in PBS, fixed with 2% glutaraldehyde, and post-fixed in 1% OsO4. After dehydration in graded alcohols, thin sections were embedded in Epon 812 and analyzed by TEM (Morgagni 268D). The concentration of phosphates in APAcCNF, corresponding to the concentration of APA attached to cCNF, was determined by ion liquid chromatography according to ISO 10304-1:2007.32 Additionally, phosphates were determined by the colorimetric UV method as described earlier,33 using a UV-vis Shimadzu 1700A spectrophotometer (Duisburg, Germany).
Cells and cultures
All experiments and protocols involving human blood samples were approved by the Ethical Board of the Military Medical Academy, University of Defense (MMA), and carried out in accordance with the MMA Guidelines. PBMC were obtained from buffy coats of healthy volunteers, who signed informed consent in accordance with the Declaration of Helsinki, using density gradient centrifugation on lymphocyte separation medium 1077 (PAA, Linz, Austria). Monocytes, CD3+ T cells, and CD8+ T cells were isolated from PBMC with magnetic-activated cell sorting (MACS) of untouched cell populations, using the monocyte iolation kit II, pan T cell isolation kit, and CD8+ T isolation kit (Miltenyi Biotec, Bergisch Gladbach, Germany), respectively. The purity of CD14+ monocytes, CD3+ and CD8+ T cells was higher than 90%, as evaluated by flow cytometry (Cube 6; Sysmex Partec GmbH, Görlitz, Germany). HEp-2 larynx epidermoid carcinoma cells were obtained from the American Type Culture Collection (Rockwell, MD, USA) and cultivated in complete Roswell Park Memorial Institute (RPMI)-1640 medium containing 10% fetal calf serum (FCS), 50 μM 2-mercaptoethanol (all from Sigma-Aldrich Co.), and 1% streptomycin, gentamicin, and penicillin (ICN Galenika, Belgrade, Serbia) at 37°C, 90% humidity, and 5% CO2.
Monocytes (1×10⁶/mL) were cultivated in CellGenix® GMP Dendritic Cell Medium (CellGenix, Freiburg, Germany) supplemented with 100 ng/mL of human recombinant granulocyte macrophages colony stimulating factor (GM-CSF; Novartis, Basel, Switzerland) and 20 ng/mL of human recombinant IL-4 (Roche Diagnostics, Basel, Switzerland). Monocytes were cultured either in the presence of nCNF, cCNF, APAcCNF (250–500 μg/mL), soluble APA at the concentrations equivalent to the amount attached to APAcCNF, or in their absence (control DC) for 4 days. Prior to use in cell cultures, CNF samples were pre-diluted in CellGenix medium and pH was adjusted to 7.2 with NaOH and HCl. After 4 days of cultivation with CNF, the cultures were either treated with 500 ng/mL of lipopolysaccharide (LPS) from Escherichia coli 0.111:B4 (Sigma-Aldrich Co.) and 50 ng/mL of interferon (IFN)-γ (R&D Systems, Minneapolis, MN, USA), or left untreated for the next 16 hours. In some experiments, anti-IL-6 receptor (R) (tocilizumab [Actemra®; Roche Diagnostics], 20 μg/mL) and/or IL-6 (40 ng/mL; R&D systems) were added during differentiation of DC, as described in the “CNF differently impair differentiation and subsequent maturation of DC” section.
Mixed cell cultures
Before cocultivation experiments with T cells, DC were filtered through sterile 30 μm pore-size filters (Miltenyi Biotec) and washed twice in complete RPMI medium to prevent transfer of free CNF and stimuli. DC (0.25×10⁴–0.5×10⁴/well in 96-well plate) were cocultivated with MACS-purified allogeneic T cells (1×10⁵/well) for 5 days. For proliferation assays, CD3+ T cells were pre-labeled with carboxyfluorescein succinimidyl ester (CFSE, 2 μM; Thermo Fisher Scientific, Waltham, MA, USA), according to the manufacturer’s protocol. For cytokines’ analysis, the supernatants of DC/CD3+ T-cell cocultures were collected after addition of phorbol-myristate acetate (PMA) (20 ng/mL) and ionomycin (500 ng/mL) (both from Sigma-Aldrich Co.) for the last 4 hours of incubation. For the flow cytometric detection of intracellular cytokines, the cocultures were treated with PMA/ionomycin and monensin (3 μM; Sigma-Aldrich Co.) for the last 3 hours of incubation. In some experiments, CD3+ or CD8+ T cells (5×10⁵/well in a 24-well plate) were primed for 3 days with DC (1×10⁴/well), either in the presence or absence of 1-methyl-tryptophan (1-MT, 0.3 mM; Sigma-Aldrich Co.), anti-ILT-3, and anti-ILT-4 antibody (Ab) (both at 2 μg/mL; R&D Systems) or isotype control Ab (anti-rat IgG2b; Thermo Fisher Scientific), and then treated with IL-2 (3 ng/mL; R&D Systems) for an additional 3 days. Additional control included the T cells cultivated likewise, but in the absence of DC. The primed T cells were analyzed phenotypically or used in the suppression assay in which different numbers of primed T cells (0.5×10⁵–1×10⁵/well in a 96-well plate) were cocultivated with responder allogeneic CFSE-labeled CD3+ T cells (2×10⁵/well) in the presence of plate-bonded anti-CD3 (5 μg/mL) Ab and soluble anti-CD28 Ab (1 μg/mL) (both from eBioscience, San Diego, CA, USA) for 5 days. The cytotoxic activity of CD8+ T cells (0.5×10⁵ cells/sample) primed with HEp-2 lysate-pulsed syngeneic DC was evaluated by their co-incubation with CFSE-labeled HEp-2 target cells (1×10⁵ cells/sample) for 4 hours, as described previously.34 PBMC (10×106/mL) were cryopreserved in 10% dimethyl-sulfoxide/FCS at -80°C for 5 days, and used for the isolation of syngeneic CD8+ T cells on day of cocultivation with HEp-2 lysate-pulsed DC. The viability of CD8+ T cells after the thawing of PBMC and MACS sorting was more than 95%, according to Trypan blue exclusion test.
Cell viability, proliferation, and cytokine production
The analysis of DC viability after 4 days of cultivation with or without CNF and APA samples was done after staining the cells with Trypan blue (1% in physiological solution), or propidium iodide (PI, 10 μg/mL; Sigma-Aldrich Co.), as described earlier.34 HEp-2 cell death in coculture with DC-primed CD8+ T cells was analyzed by flow cytometry (Sysmex Partec Cube 6) based on PI staining of CFSE-labeled HEp-2 cells. The proliferation of CFSE-labeled CD3+ T cells in response to DC, or CD3/CD28 stimulation, was analyzed within PI- population by flow cytometric measurement of CFSE dilution during cell division.34 The Proliferation Index, ie, the average number of cells derived from an initial cell, was calculated using proliferation fit statistics in FCS Express 4 (De Novo Software, Glendale, CA, USA). The cytokine concentrations in cell culture supernatants were determined by appropriate enzyme-linked immunosorbent assay (ELISA) kits (R&D Systems).
Flow cytometry
Phenotype analysis of DC and T cells after the cultures was carried out using flow cytometer (Sysmex Partec Cube 6) after staining the cells by using the following Abs (Clone) and reagents: immunoglobulin (Ig) G1a negative control-biotin (MCA928), IgG1 negative control-phycoerythrin (PE) (MCA928PE), IgG1 negative control-fluorescein isothiocyanate (FITC) (MCA928F), anti-CD1a-PE-Cy5 (NA1/34HLK) (all from Serotec, Oxford, UK), anti-human leukocyte antigen (HLA)-DR-biotin (LN3), IgG1a negative control-PECy5 (P.3.6.2.8.1), anti-CD86-PE (IT2.2), streptavidin-PECy5, anti-CD4-PECy5 (RPA-T4), anti-IL-4-PE (8D4-8), anti-ILT3-PE (ZM4.1), anti-ILT-4-PE (42D1), anti-TGF-β-biotin (eBio16TFB), anti-CD25-PE, anti-CD25-PECy5 (BC96), anti-forkhead box (Fox) P3-FITC (PCH101), anti-IL-10-PE (JES5-16E3), anti-CD39-FITC (A1), anti-CD8-PEcy5 (RPA-T8), anti-cytotoxic T-lymphocyte-associated protein (CTLA)-4-PE (14D3) (all from eBioscience), streptavidin-Alexa 488, anti-mouse IgG-Alexa 488, anti-CD1a-PE (HI149) (all from Biolegend, San Diego, CA, USA), anti CD40-allophycocyanin (APC) (5C3), anti-IL-12 (p40/p70)-PE (C11.5) (all from BD Pharmingen, San Diego, CA, USA), anti-CD83-FITC (HB15e), anti-IFN-γ-FITC (25723), anti-IL17-peridinin-chlorophyll-protein complex conjugate (PerCP) (41802), anti-IL-10-FITC (127107), anti-HLA-DR PerCP (L243), anti-CD4-FITC, anti-CD4-PerCP (11830), anti-IDO-1-APC (700838) (all from R&D Systems), anti-CD14-FITC (TUK4), IgG1 negative control-PerCP (IS5-21F5) (Miltenyi Biotec), anti-CD4-PE (MEM-241) (Partec Sysmex). Surface staining with primary Abs was conducted in PBS/0.1% NaN3/0.5% FBS prior to intracellular staining that was carried out using the flow cytometry fixation and permeabilization kit (R&D Systems).31,34 The gates for cultivated DC and T cells were set according to their specific forward scatter (FS) and side scatter (SS) properties, thereby avoiding dead cells with low FS/SS signal. The gates, containing more than 97% of live cells, were confirmed by independent PI+ staining of non-permeabilized cells. Signal overlap between the fluorescent channels was compensated before each experimental analysis using single labeled samples. Non-specific fluorescence was determined by using the appropriate isotype control Abs and fluorescence minus one controls.
Analysis of DC–CNF interactions
The internalization of CNF by DC was assessed by flow cytometry, wherein the internal granularity of DC was analyzed by monitoring the SS parameter, as described earlier.31,34 Additionally, light and epi-fluorescent microscopy analyses (Nikon Eclipse 55i, Tokyo, Japan) were carried out to assess the interaction of DC with the CNF samples. The cells were collected from the cultures without filtration and the cytospins were prepared at 500 rpm for 5 minutes. The cells were stained with May-Grunwald Giemsa for light microscopy analysis. For epi-fluorescent microscopy, the slides were stained with anti-CD209, followed by anti-mouse IgG-Alexa 488 for analysis with green filter set (B-2A, ex: 450–490 nm, DM 505, BA 520). Actin filaments were stained with phalloidin rhodamine (0.16 μM; Thermo Fisher Scientific), according to the manufacturer’s protocol and monitored with red filter set (G-2A, ex: 510–560 nm, DM 575, BA 590). After that, the samples were stained with calcofluor white (Sigma-Aldrich Co.), as described earlier,31 and DAPI (40 μg/mL; Sigma-Aldrich Co.) simultaneously, and monitored with UV filter set (UV-2B, ex: 330–380 nm, DM 400, BA 435). The images taken by each filter set were acquired in red-green-blue (RGB) format, and the channels were separated offline in ImageJ software (National Institutes of Health, Bethesda, MD, USA). The images acquired under UV filter set contained a green component (DAPI-stained nuclei) and a blue component (calcofluor-stained CNF, cytoplasm, and nuclei), so they were analyzed and presented as separate channels. Accumulation of actin and CD209 at the place of contact with CNF was quantified by measuring the fold change of mean gray values in red and green channels, respectively, in the regions of DC-CNF contact against the cytoplasmic part of the same cell, for a total of 15–25 cells per CNF treatment. Raw images are accessible upon request from the authors.
Statistical analysis
The results are presented as representative data or mean ± SD values of at least three independent experiments. The differences between treatments were analyzed by repeated measures (RM) ANOVA with Tukey’s multiple comparison test using GraphPad Prism software (GraphPad, La Jolla, CA, USA). All tests were two-sided with the significance level of P=0.05.
Results
CNF properties
Native CNF, cCNF, and APAcCNF size and dispersity were determined as described previously.7,9,31 The analysis of vibration bands within cCNF and APAcCNF by Fourier transform infrared spectroscopy confirmed the formation of covalent amide bonds between amino groups of APA and carboxylic groups of cCNF, rather than APA adsorption on cCNF.7 TEM investigation confirmed that TEMPO-oxidation of nCNF, besides homogenization and dispersion, also reduced the length of nanofibrils (Figure S1). Moreover, it seems that APA functionalization of cCNF additionally dispersed the nanofibrils, although it did not alter their size significantly.7 Measurements of surface charge by potentiometric titration showed that oxidation increased the concentration of negative surface charge significantly due to the presence of carboxylic groups (from 0.034±0.001 mmol/g to 1.3±0.1 mmol/g) and its reduction to 0.5±0.01 mmol/g after APA functionalization.7 Considering that negative surface charge may come from free carboxylic groups, as well as from phosphate groups, we determined the concentration of phosphates in APAcCNF directly. Both the ion liquid chromatography method32 and the UV method suggested that 10.9%±1.1% of phosphates are present in APAcCNF, whereas phosphate levels in nCNF and cCNF were not detectable. Since all methods suggested that about 11 wt% of APA is attached to APAcCNF, the corresponding concentrations of soluble APA were used in cell culture experiments.
CNF affect DC morphology
To study the immunomodulatory actions of CNF, we used a model of human monocytes-derived DC. Therefore, MACS-sorted CD14+ blood monocytes were cultured in the presence of GM-CSF/IL-4 for 4 days, which led to differentiation of immature CD209-expressing DC.31,35 Native CNF, cCNF, APAcCNF, and equivalent concentrations of soluble APA were added to GM-CSF/IL-4-treated monocytes on day 0. To exclude the possibility that the immunomodulatory effects of CNF are due to cytotoxicity, the viability of DC after 4 days of cultivation was evaluated first. The Trypan blue exclusion test suggested that 500 μg/mL of APAcCNF lowered DC viability significantly, by 27%± 8%, unlike the sample concentration of nCNF, cCNF, and the corresponding concentration of soluble APA (55 μg/mL) (Figure 1A). This was confirmed by flow cytometric analysis of the cells stained with PI/PBS (data not shown). In contrast, neither of the investigated CNF samples had significant effects on DC viability at the concentration of 250 μg/mL, so further experiments were carried out with nontoxic doses of 250 μg/mL of CNF samples and 27.5 μg/mL of APA.
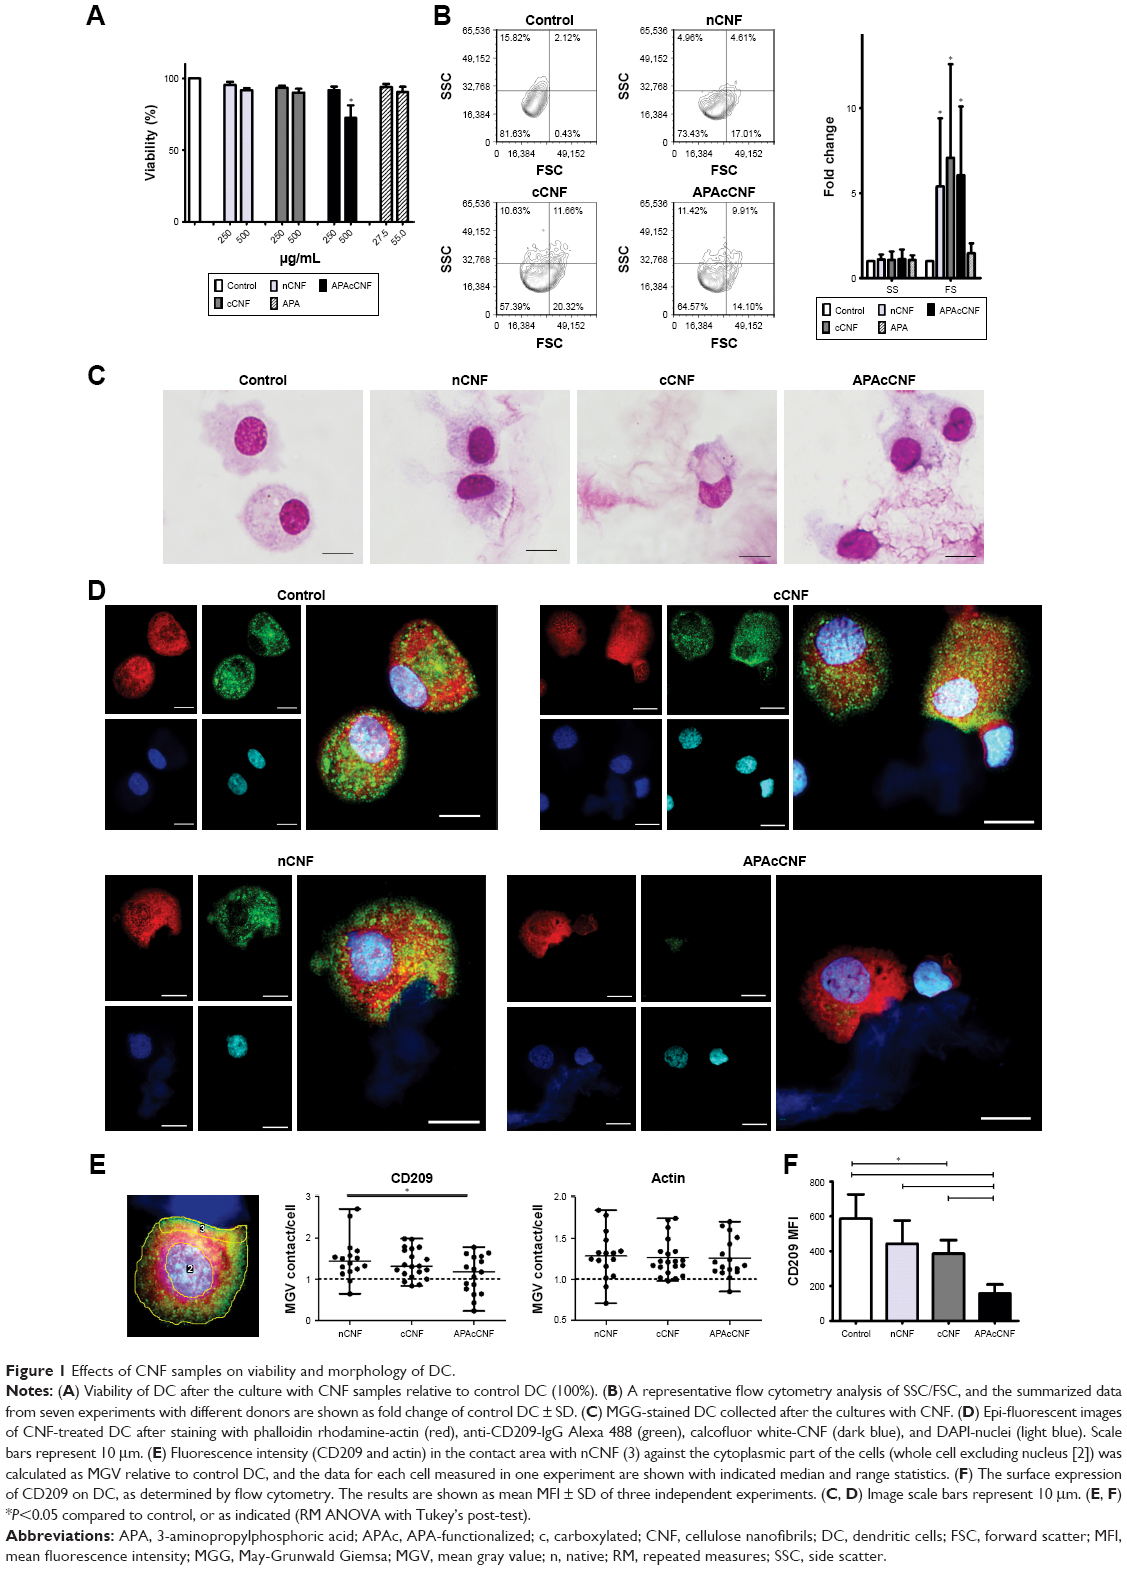 | Figure 1 Effects of CNF samples on viability and morphology of DC. |
Next, we assessed the changes in DC morphology after their differentiation with nontoxic doses of CNF samples. As a common method for the evaluation of nanoparticle internalization,31,34,36 we monitored the granularity of DC according to their SS properties. It was found that the granularity of DC differentiated with CNF samples was insignificantly modified compared to the untreated control DC (Figure 1B). In contrast, DC differentiated with CNF samples, but not soluble APA, showed an increase in their FS properties (ie, size) significantly, which suggested that CNF were not internalized significantly, but rather acted on the cell surface. The MGG-stained preparation confirmed that DC interacted closely with CNF via many extended processes and membrane invaginations. It appeared that DC were trying to internalize CNF, but the majority of nanofibers were just too long (Figure 1C), so the process resembled frustrated phagocytosis. Our previous study suggested that CD209 was directly involved in interaction between DC and nCNF.31 The epi-fluorescent microscopy, indeed, showed a redistribution of CD209 expression in contact with nCNF as well as cCNF samples. CD209 expression, as well as the actin expression, was increased significantly at the place of contact with these CNF (Figure 1D and E). Although the actin expression was increased at the place of contact with APAcCNF, the expression of CD209 by these DC was severely downregulated (Figure 1E), which was confirmed by flow cytometry as well (Figure 1F). The lack of CD209 expression on DC differentiated in the presence of APAcCNF suggested their severely impaired differentiation pattern.
CNF differently impair differentiation and subsequent maturation of DC
GM-CSF/IL-4-induced differentiation of DC correlates with a complete downregulation of CD14 expression and upregulation of CD1a after 4 days of cultivation.34 After the differentiation in the presence of CNF samples, DC indeed displayed a significantly altered differentiation pattern. For instance, both control DC and those differentiated in presence of soluble APA downregulated CD14 completely and upregulated CD1a (Figure 2A and B). nCNF and cCNF impaired the upregulation of CD1a on DC significantly, without affecting downregulation of CD14. In contrast, DC differentiated with APAcCNF expressed the highest levels of CD14 and the lowest levels of CD1a compared to all other DC.
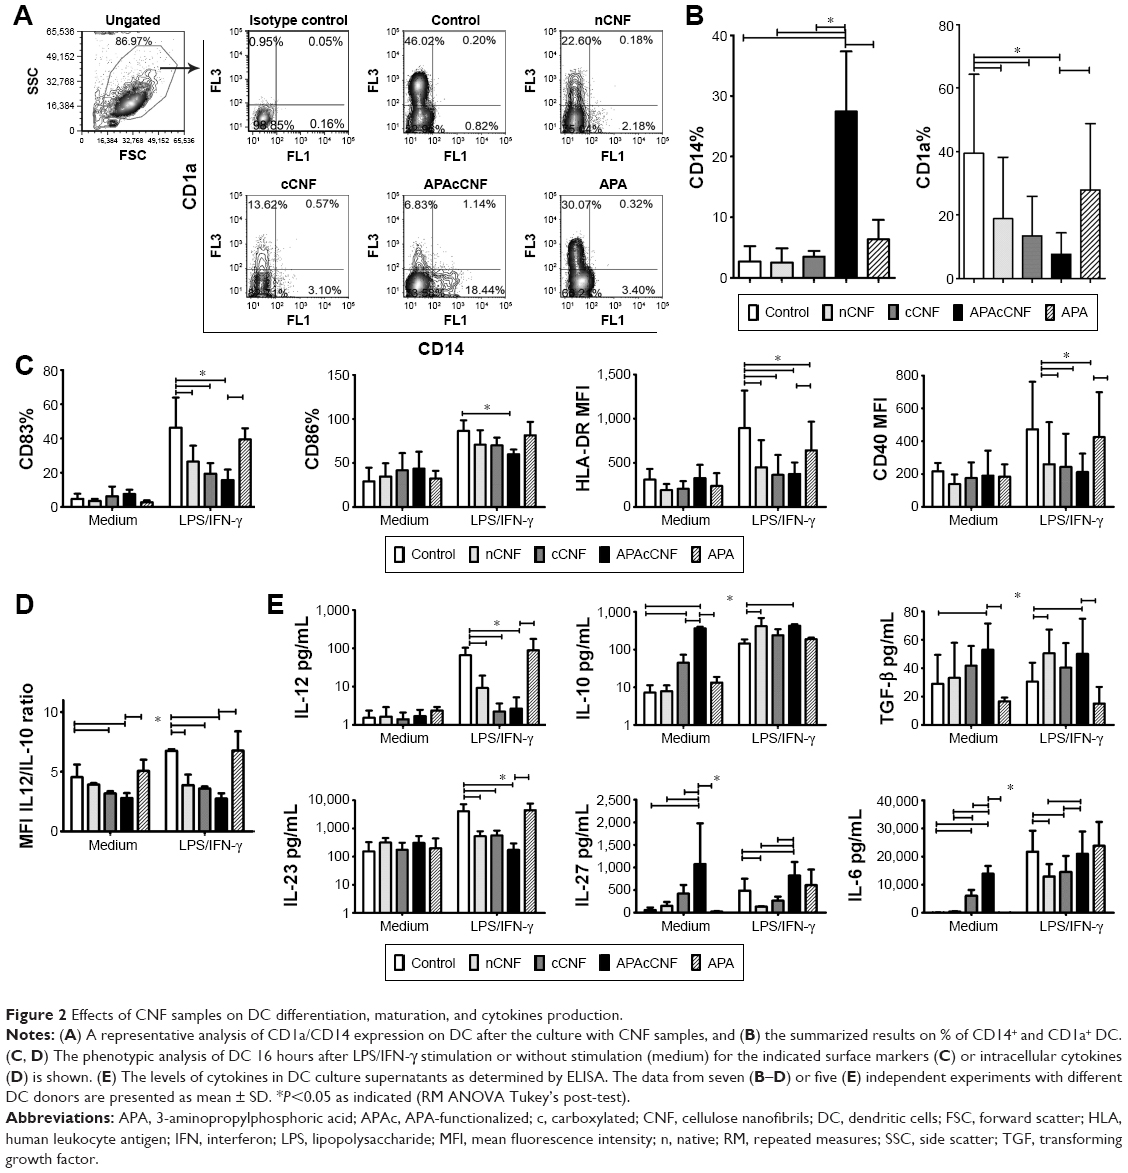 | Figure 2 Effects of CNF samples on DC differentiation, maturation, and cytokines production. |
To assess the maturation potential of DC differentiated with CNF, a strong type 1-inducing inflammatory cocktail, LPS and IFN-γ,37 was added on day 4, for the next 16 hours. Flow cytometry analysis showed that without LPS/IFN-γ stimulation, the expression of CD83, CD86, HLA-DR, and CD40 on all treated DC were similar to that on non-treated control DC, ie, they contained the immature phenotype (Figure 2C). LPS/IFN-γ stimulation induced a strong upregulation of all tested markers on the control DC, as expected.34,37 However, the upregulation of CD83, HLA-DR, and CD40 on DC differentiated in the presence of nCNF and cCNF was significantly lower compared to the control LPS/IFN-γ-stimulated DC. In this sense, APAcCNF displayed the strongest inhibitory effect, including the expression of co-stimulatory CD86 molecule. DC differentiated with soluble APA had a lower upregulation capacity of HLA-DR after the LPS/IFN-γ treatment, but not other examined markers, as compared to the corresponding control DC.
In addition to surface markers, DC mediate the polarization of T-cell differentiation via different cytokines.20 IL-12/IL-10 production ratio by DC was shown as a good indicator of their Th polarization capacity.19 The intracellular analysis of IL-12p40/p70 and IL-10 in DC by flow cytometry suggested that nCNF reduced IL-12/IL-10 expression ratio in LPS/IFN-γ-stimulated DC significantly, whereas cCNF and APAcCNF displayed such an effect in non-stimulated DC as well. Soluble APA did not change significantly the IL-12/IL-10 ratio in DC (Figure 2D). The measurements of the secreted IL-12p70 and IL-10 products in DC culture supernatants by ELISA confirmed such findings (Figure 2E).
The analysis of other DC cytokines in cell culture supernatants showed that nCNF did not modulate their production by immature DC (Figure 2E). After LPS/IFN-γ stimulation, nCNF-DC displayed an increased capacity to produce TGF-β, and a lower capacity to produce IL-23, IL-27, and IL-6 compared to the corresponding control DC. Immature DC differentiated with cCNF produced somewhat higher levels of IL-6, and lower levels of IL-23, IL-27, and IL-6 upon LPS/IFN-γ-induced maturation, whereas TGF-β production was not affected. Immature APAcCNF-DC produced significantly higher levels of TGF-β, IL-27, and IL-6 compared to the control immature DC. After LPS/IFN-γ treatment, those cells still displayed an increased capacity to produce IL-27 and TGF-β, and a diminished capacity for IL-23 production, whereas their capacity to produce IL-6 was similar to the corresponding control LPS/IFN-γ-stimulated DC.
Frustrated phagocytosis of fibrillar nanomaterials was shown to correlate with increased IL-6 expression,38 and IL-6 alone can shift GM-CSF/IL-4-induced differentiation of monocytes toward CD14+ macrophage-like cells.39 Therefore, we wondered whether the blockage of IL-6-mediated effects could recover the differentiation and maturation of DC differentiated in the presence of APAcCNF. Although anti-IL6R Ab (tocilizumab, 20 μg/mL) could block completely the effects of exogenous IL-6 (40 ng/mL) (data not shown), the differentiation and subsequent maturation of DC in the presence of tocilizumab and APAcCNF were only improved slightly compared to the corresponding DC treated in the presence of irrelevant Ab (Figure S2). These results suggested that the stimulation of IL-6 by APAcCNF in DC was only partially involved in the regulation of their differentiation and maturation capacity, so other mechanisms were probably more dominant.
CNF impair DC capacity to stimulate proliferation and differentiation of Th1 and Th17 cells
To assess the functions of DC in contact with T cells, allogeneic purified CD3+ T cells were cocultivated with DC at different cell-to-cell ratios for 5 days. The proliferation of T cells was assessed by labeling of T cells with CFSE and monitoring the CFSE fluorescence dilution by flow cytometry after coculturing with DC (Figure 3A and B). It was found that mature CNF-DC possessed significantly lower capacity to stimulate T-cell proliferation compared to the corresponding control (LPS/IFN-γ-stimulated) DC. In that sense, APAcCNF-DC displayed the lowest allostimulatory capacity, irrespective of their additional stimulation with LPS/IFN-γ.
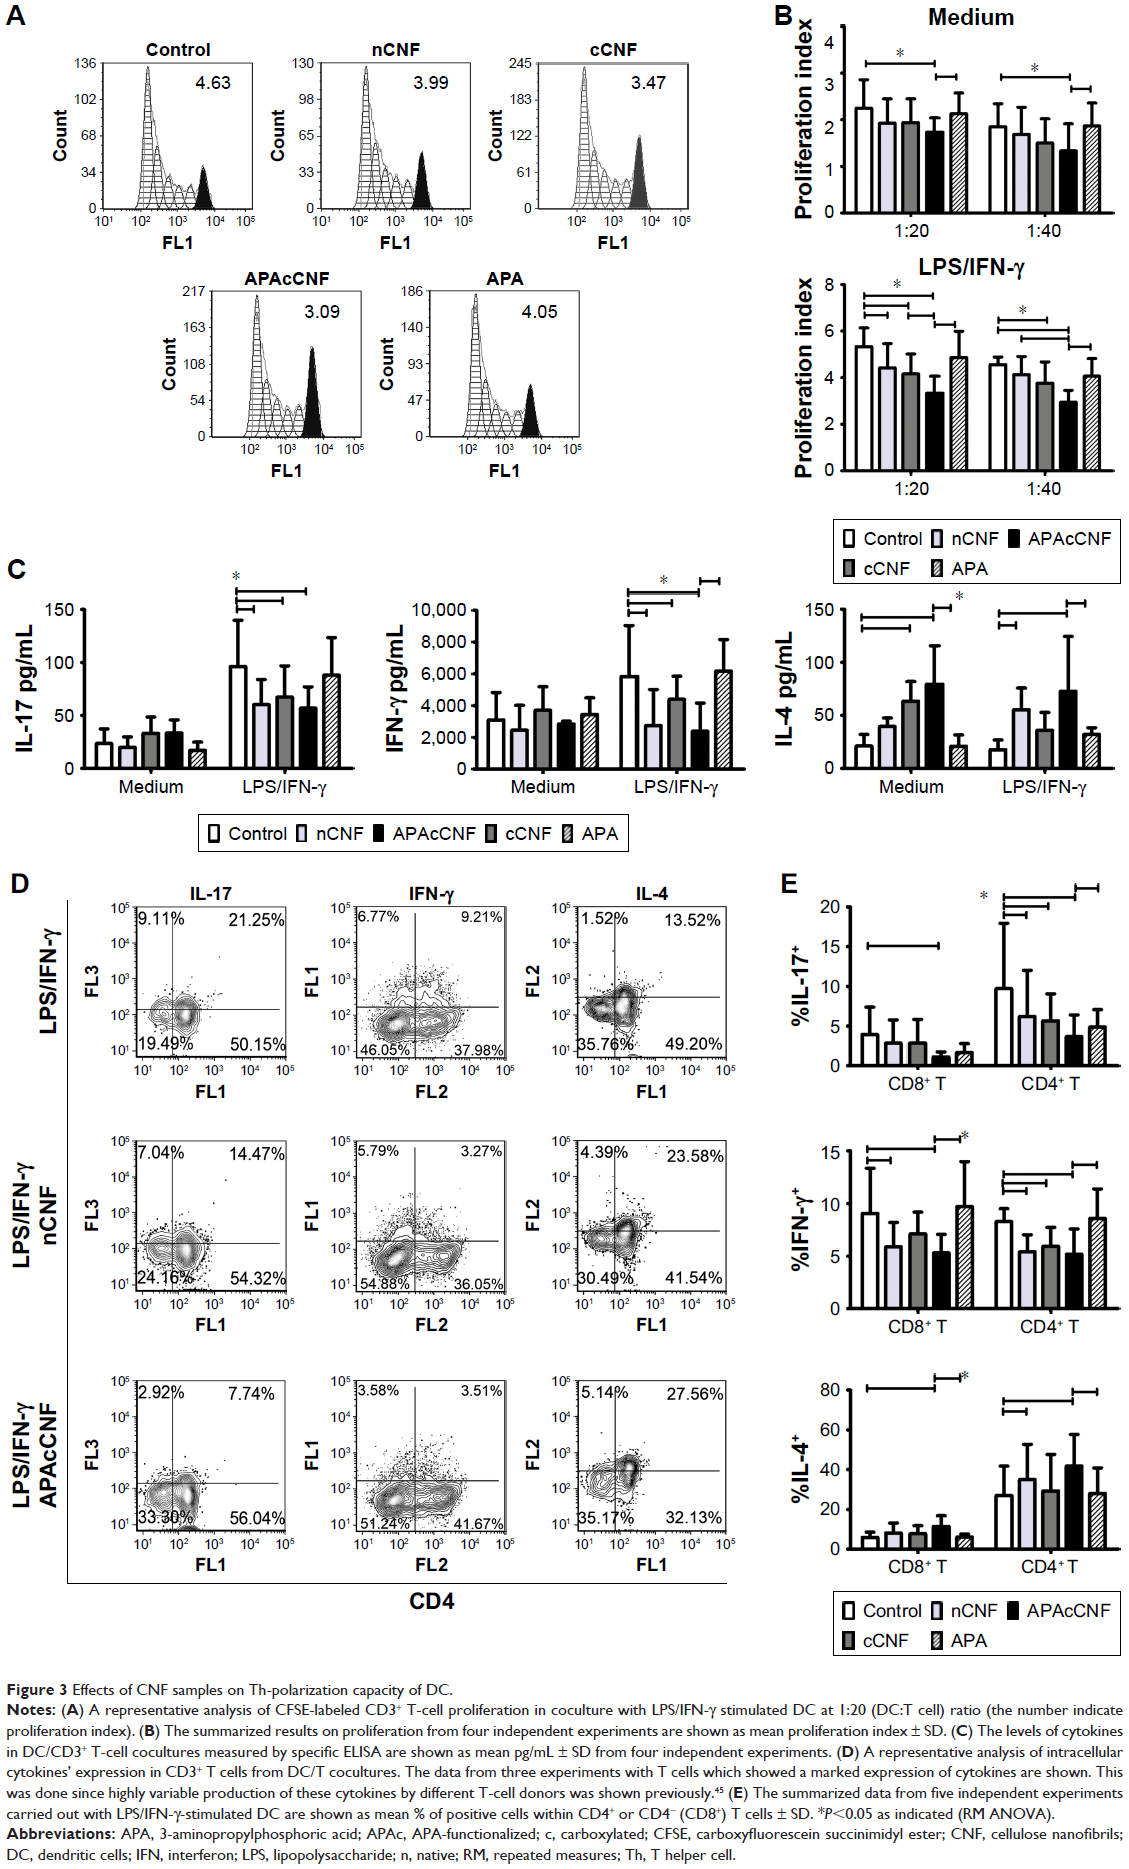 | Figure 3 Effects of CNF samples on Th-polarization capacity of DC. |
The Th polarization capacity of DC was analyzed by measuring the levels of IL-17, IFN-γ, and IL-4 in DC/T-cell culture supernatants (Figure 3C), or intracellularly in T cells (Figure 3D and E). No changes in IFN-γ and IL-17 levels were detected in cocultures with non-stimulated DC differentiated with either of the CNF samples. LPS/IFN-γ stimulated the capacity of the control DC to induce IFN-γ and IL-17, but not IL-4, production in coculture with T cells, as expected.34,37 However, stimulated CNF-treated DC had significantly lower capacity to induce IL-17 and IFN-γ production, compared to the corresponding control stimulated DC. These results correlated with a lower percentage of IL-17+ and IFN-γ+ within CD4+ and CD4- T cells (>98% of CD8+ cells40) cultivated with stimulated CNF-treated DC (Figure 3D and E). Immature cCNF-DC and APAcCNF-DC induced the production of IL-4 in coculture (Figure 3C) and increased the percentage of IL-4 producing CD4+ T cells (data not shown). However, after the maturation with LPS/IFN-γ, only nCNF-DC and APAcCNF-DC induced significantly higher production of IL-4 and increased the percentage of IL-4+ CD4+ T cells (Figure 3D and E). The equivalent concentrations of soluble APA had no significant effects on the Th polarization capacity of DC either, so this control was not used in further experiments. Since the differences between CNF samples with regard to DC phenotype and functions were more prominent after the LPS/IFN-γ-treatment, further experiments were carried out with LPS/IFN-γ-stimulated DC for the sake of simplicity and convenience.
DC differentiated with nCNF, but not cCNF and APAcCNF, induce Tregs via IDO-1
The impaired maturation and immunogenic functions of DC were shown to correlate with their increased potential to induce regulatory T cells.26 One of the key mechanisms by which human tolerogenic DC induce CD4+CD25hiFoxP3hi Treg includes IDO-1-dependent mechanisms.26 Therefore, we first assessed intracellular expression of IDO-1 by flow cytometry and found that stimulated nCNF-DC expressed significantly higher levels of IDO-1 compared to the stimulated control DC (Figure 4A and B). As expected, nCNF-DC in coculture with CD3+ T cells induced significantly higher percentage of CD4+CD25hiFoxP3hi cells (Figure 4C and D). In contrast, cCNF-DC and APAcCNF-DC did not upregulate IDO-1 expression and did not induce CD4+CD25hiFoxP3hi Treg in the coculture (Figure 4A–D).
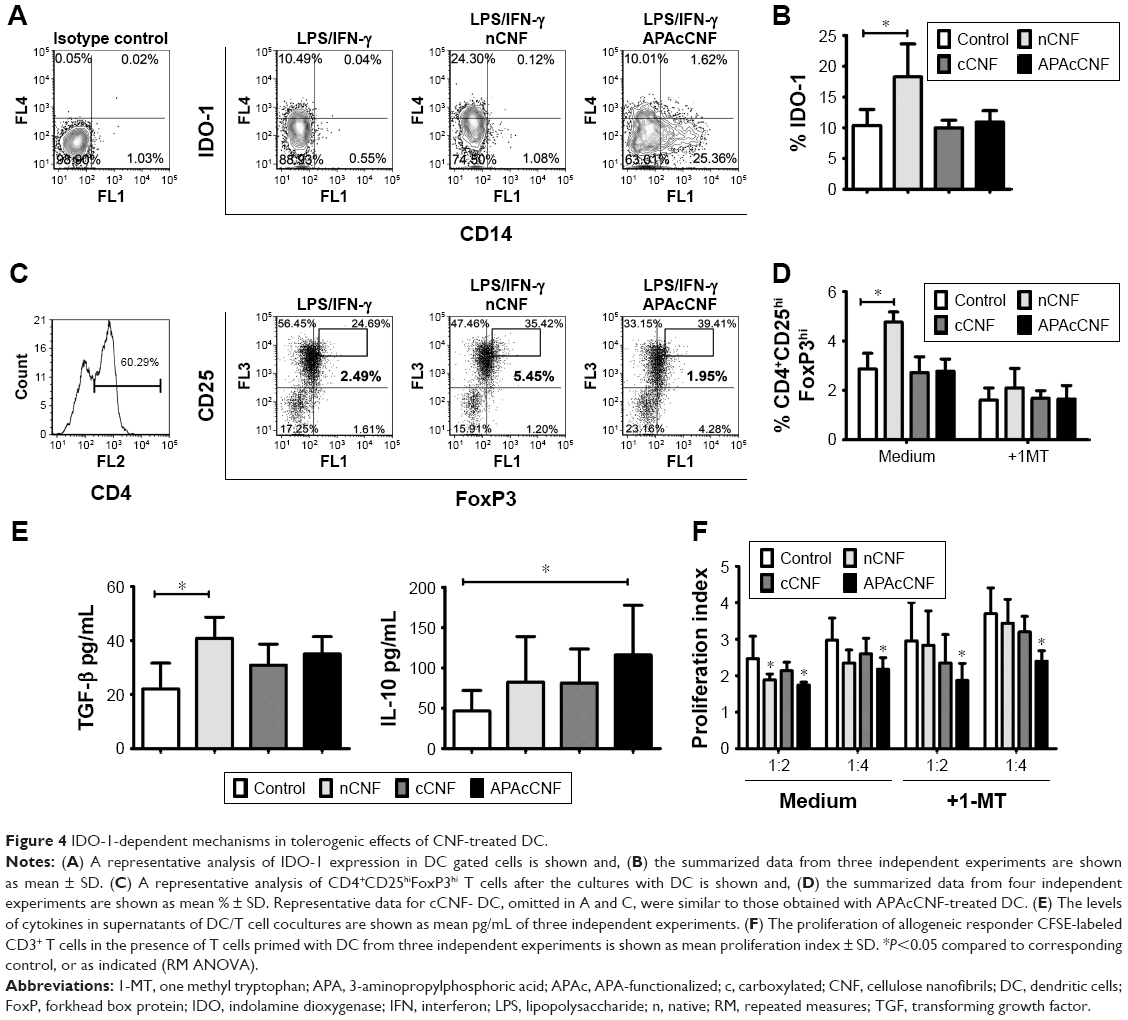 | Figure 4 IDO-1-dependent mechanisms in tolerogenic effects of CNF-treated DC. |
In coculture supernatants, significantly higher levels of TGF-β were detected in nCNF-DC/T-cell cocultures, whereas the increase of IL-10 was not significant compared to cocultures with the control DC (Figure 4E). Interestingly, APAcCNF-DC induced significantly higher production of IL-10 in cocultures, whereas TGF-β levels increased insignificantly compared to the corresponding control cocultures. The levels of IL-10 and TGF-β in cocultures with cCNF-DC were not increased significantly compared to the control cocultures (Figure 4E). To assess whether T cells cocultivated with CNF-treated DC display any suppressive potential, they were cocultivated with CFSE-labeled allogeneic CD3+ T cells in the presence of anti-CD3/anti-CD28 Ab stimulation (Figure 4F). The results showed that T cells primed with nCNF-DC and APAcCNF-DC suppressed significantly the proliferation of responder allogeneic T cells at 2:1 and 4:1 ratios (T responder:T primed cell ratio), respectively. When the priming of T cells in coculture with DC was carried out in the presence of IDO-1 inhibitor 1-MT, T cells primed with nCNF-DC contained a significantly lower percentage of CD4+CD25hiFoxP3hi cells (Figure 4D), and the primed T cells displayed no significant suppression of allogenic T cell proliferation (Figure 4F). In contrast, T cells primed with APAcCNF-DC displayed the suppressive capacity even if the priming was carried out in the presence of 1-MT. The suppressive effects of T cells primed with cCNF-DC were detected, but the differences were not significant compared to the control T cells. These results suggested that, unlike nCNF-DC, APAcCNF-DC induce suppressive T cells other than CD4+CD25hiFoxP3hi Treg, via IDO-1-independent mechanisms.
APAcCNF-DC induce predominantly suppressor CD8+ T cells via ILT-3 and ILT-4
Additional molecules, such as ILT-4 and ILT-3, were shown to be involved in DC-mediated tolerogenic effects and induction of CD4+ IL-10+41 and CD8+ IL-10+42 regulatory T-cell populations, respectively, some of which use IFN-γ for their suppressor activity.43,44 The assessment of ILT-3 and ILT-4 expression on stimulated DC showed that APAcCNF-DC, unlike nCNF-DC, displayed significantly higher expression of both markers compared to the control stimulated DC (Figure 5A and B). No significant upregulation of ILT-3 and ILT-4 on cCNF-DC was detected. Next, we assessed which T-cell population increased IL-10 expression after the priming with DC, and how this correlated with their IFN-γ expression (Figure 5C and D). Flow cytometry analysis showed that cCNF-DC upregulated IL-10 expression by CD8+ T cells significantly. APAcCNF-DC upregulated IL-10 expression by both CD4+ and CD8+ T cells (within both IFN-γ+ and IFN-γ- population), whereas the upregulation of IL-10+ T cells cocultivated with nCNF-DC was not significant statistically. The highest expression of IL-10 was detected in the CD8+ IFN-γ+ T-cell population after the priming with APAcCNF-DC (Figure 5C and D).
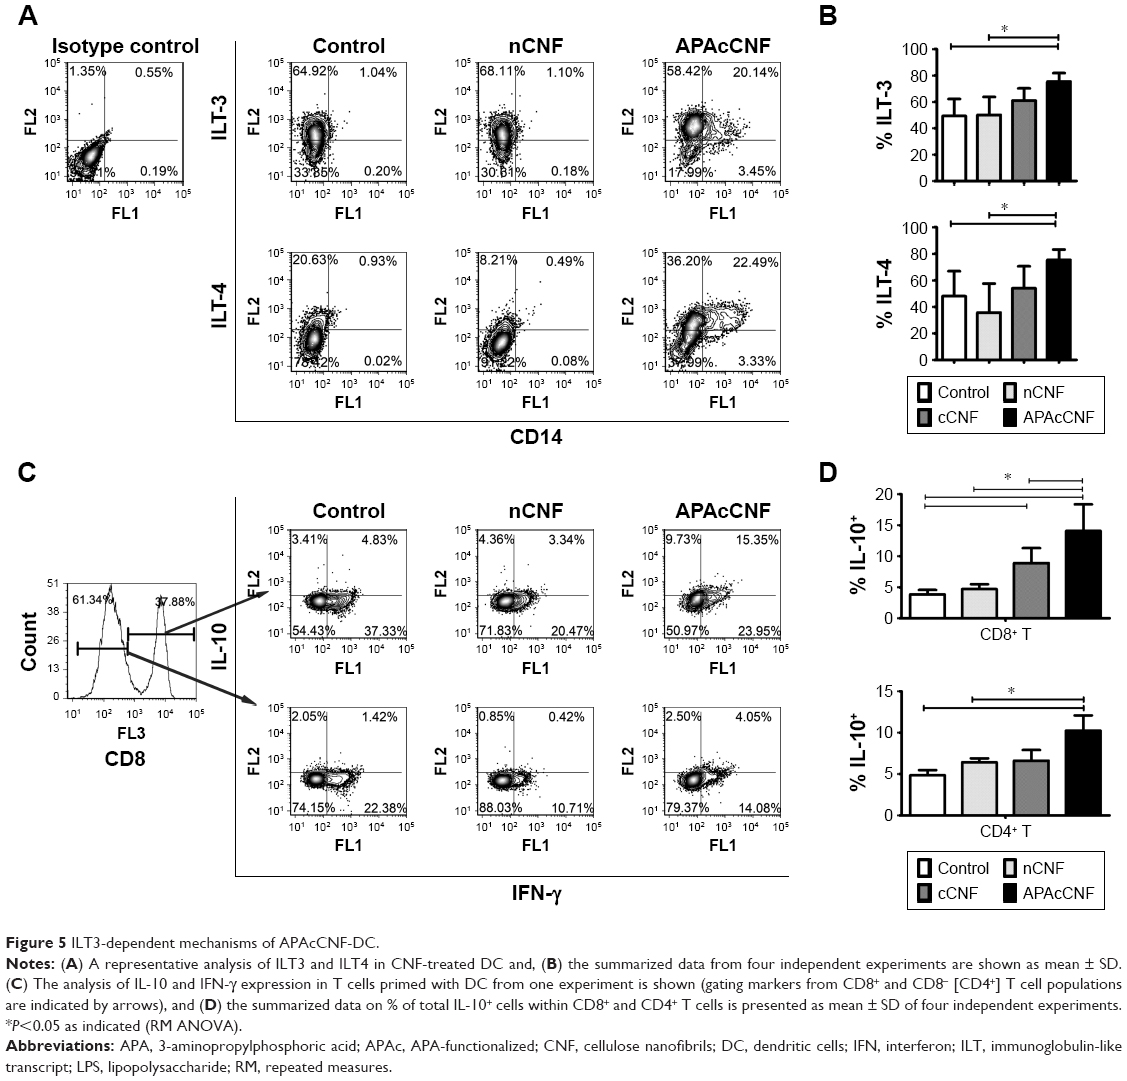 | Figure 5 ILT3-dependent mechanisms of APAcCNF-DC. |
Therefore, we explored in more detail the phenotype and functions of the CD8+ T cells primed with APAcCNF-DC. CD8+ T cells were MACS-purified and then cocultivated with APAcCNF-DC for 6 days, followed by their flow cytometry analysis according to the markers proposed for suppressor CD8+ T cells.45 It was found that, even in the absence of CD4+ T cells, APAcCNF-DC induced significantly higher percentage of IL-10+ cells within the CD8+CD25+ population (Figure 6A and B), whereas CD8+CD25- T cells did not express significant levels of IL-10 (data not shown). The increased IL-10 expression was detected in both IFN-γ+ and IFN-γ- CD8+CD25+ T cells, but a higher percentage of CD8+CD25+IFN-γ+ T cells expressed IL-10. Additionally, CD8+CD25+ T cells expressed higher levels of CTLA-4 and TGF-β (Figure 6A and B).
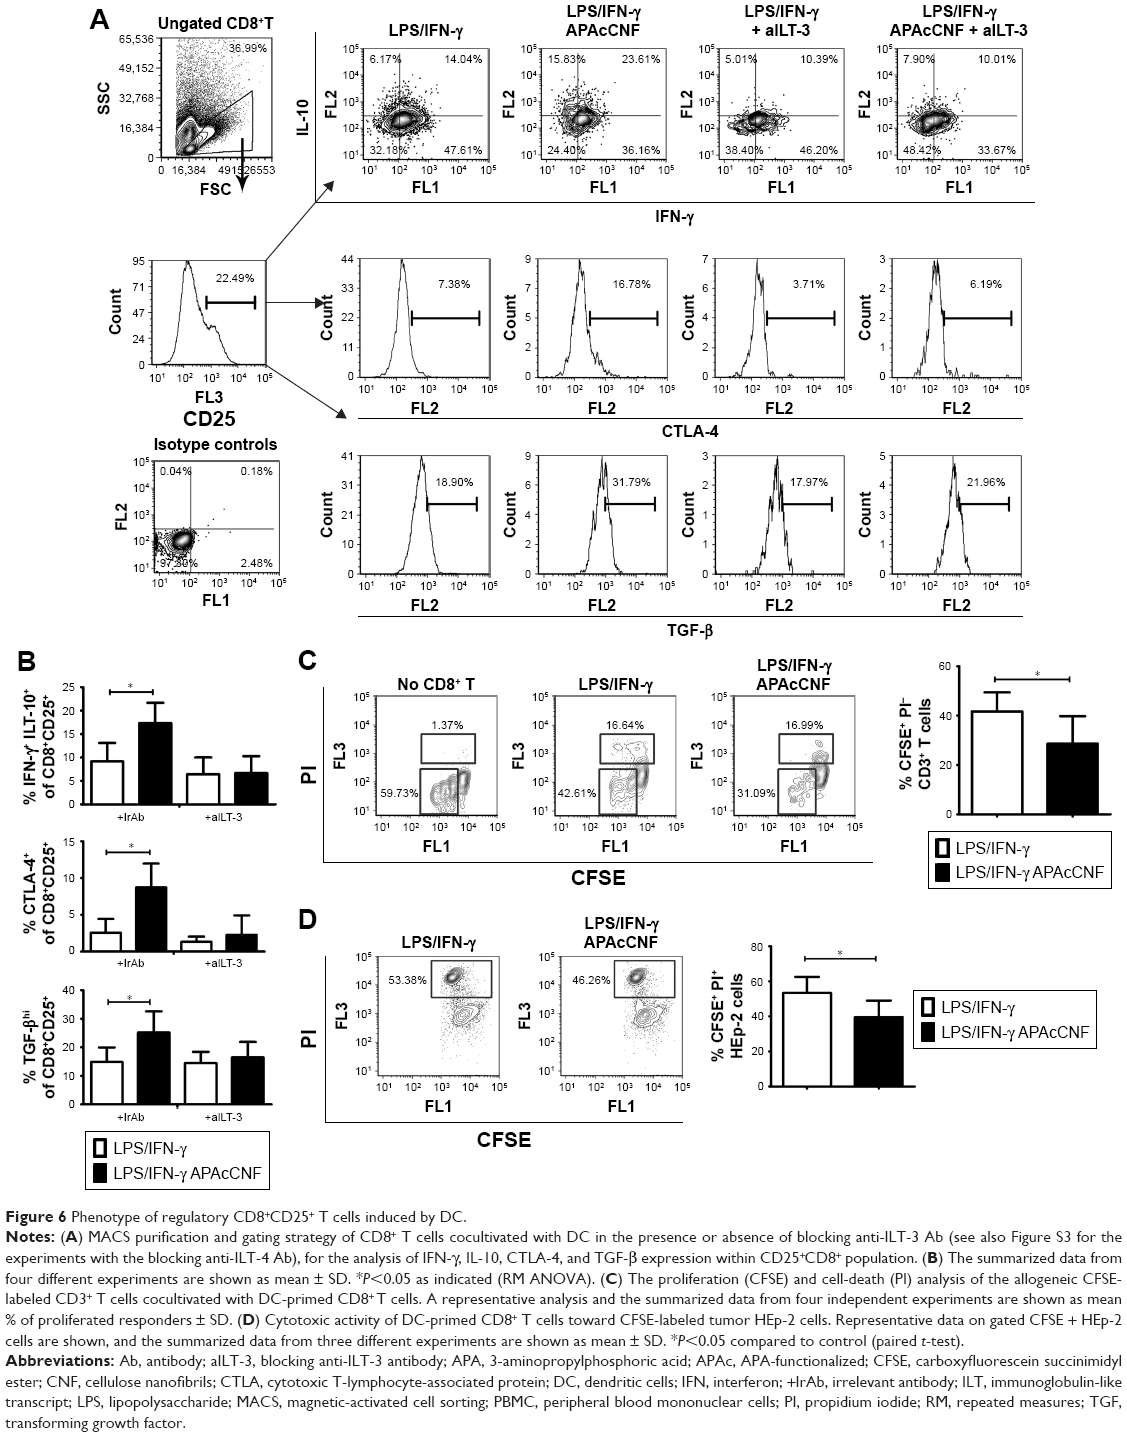 | Figure 6 Phenotype of regulatory CD8+CD25+ T cells induced by DC. |
ILT-3 was described as a master inducer of regulatory CD8+ T cells,42 so we tested whether the blockage of ILT-3 could alleviate the effect of APAcCNF-DC on CD8+ T cells. In the presence of anti-ILT-3 Ab, no increase in IL-10, TGF-β, and CTLA-4 expression was observed in the CD8+CD25+ populations in comparison to the corresponding CD8+CD25+ T cells cocultivated with control DC in the presence of isotype control Ab (Figure 6A and B). Similar phenomenon was observed when ILT-4 was blocked with APAcCNF-DC (Figure S3) during the priming of purified CD8+ T cells. In addition to suppressive phenotype, CD8+ T cells primed with APAcCNF-DC suppressed the proliferation of CFSE-labeled allogeneic CD3+ T cells in the presence of CD3/CD28 stimulus, and this was not due to their increased cytotoxicity (Figure 6C). Moreover, CD8+ T cells primed with syngeneic APAcCNF-DC pulsed with HEp-2 lysate, displayed a lower cytotoxicity toward HEp-2 cell line, compared to CD8+ T cells primed with the control DC that were not differentiated in the presence of APAcCNF (Figure 6D). These data suggested that APAcCNF-DC induces predominantly suppressive CD8+ T-cell populations in ILT-3- and ILT-4-dependent manner.
Discussion
While good biocompatibility of CNF in vitro and in vivo was described previously,2,9 their immunomodulatory actions were not investigated sufficiently, even though that could have explained some of the beneficial clinical effects observed.5 Previous findings suggested that different cellulose-based nanomaterials could have anti-inflammatory effects in vivo16 and in vitro,9 but more detailed immunological mechanisms remained largely unknown. Our recent findings suggested that nCNF can induce beneficial tolerogenic response in human immune cells,9 including DC.31 Here, we showed for the first time that such an effect could even be potentiated by phosphonation of CNF, making them suitable for further development as bone tissue scaffolds.7 More interestingly, APA-functionalized CNF induced stronger tolerogenic properties in DC by activating mechanisms that mediate induction of different Treg populations, thus providing a good platform for a well-controlled DC-mediated induction of tolerogenic immune response.
All tested CNF altered the differentiation of DC from monocytes, as indicated by the impaired upregulation of CD1a and CD209 during differentiation. CD1a+ DC were shown to produce more IL-12 and induce Th1 polarization,46 whereas CD1a- DC displayed a weaker maturation potential and a higher capacity to produce IL-10 and regulatory T cells.47 Such an effect of nCNF from a different source,31 as well as other nanomaterials34,36 and cultivation procedures,24,48 was described previously by our group. Therefore, the ratio between CD1a+ and CD1a- DC might be a good indicator of DC tolerogenicity. However, it is unclear whether an increased expression of CD14, alongside low CD1a expression, is an indication of shifted differentiation of monocytes toward macrophage-like cells. Chomarat et al39 showed that high concentrations of IL-6 (up to 150 ng/mL) shift monocytes’ differentiation toward macrophage-like cells. However, APAcCNF induced much lower IL-6 production by DC (up to 20 ng/mL), and the blockade of IL-6R only partially restored APAcCNF-mediated inhibition of DC differentiation, suggesting that IL-6 was not fully responsible for the increased CD14 expression on DC. Alternatively, both expression of CD14 and IL-6 could indicate DC tolerogenic properties. In line with this, Gregori et al49 described a population of tolerogenic IL-10-producing DC which displayed CD1a-CD14+ phenotype, expressed high levels of IL-6, IL-10, and ILT-4, as well as low levels of IL-12, which is in line with the phenotype of APAcCNF-DC. The fact that similar cells can be differentiated from monocytes in vitro in the presence of IL-1049 suggests that the autocrine production of IL-10 by APAcCNF-DC could be a major trigger for their tolerogenic phenotype and functions.
Functionally, APAcCNF-DC displayed the weakest capacity to express co-stimulatory molecules (CD86 and CD40) and HLA-DR. Additionally, a higher capacity of APAcCNF-DC to produce IL-10 and TGF-β, with known anti-proliferative effects,50,51 could explain their weakest allostimulatory capacity. Both of these cytokines were shown to suppress the production of IL-12 and IL-23,52 which are involved in the induction and maintenance of Th1 and Th17 cells, respectively.53 Besides, an increased expression of IL-27 by APAcCNF-DC probably contributed to their lowest capacity to induce IL-17+ T cells, as IL-27 directly inhibit Th17 development and functions.54 Downregulation of Th1 response can be a default pathway for development of Th2 response, but other mechanisms such as CD209-dependent upregulation of IL-10 and Notch ligands55 have been proposed as well. Taken together, all CNF-treated DC displayed a diminished Th1/Th17 and augmented Th2 polarizing capacity of DC, even in a strong Th1/Th17-inducing microenvironment, such as LPS/IFN-γ.37 This could be quite beneficial for controlling different Th1- and Th17-mediated immunopathologies.53 In this sense, APAcCNF-DC exhibited the strongest effects, followed by nCNF and cCNF, respectively. The differences between CNF effects on Th polarization capacity of DC could be explained by the different cytokine profiles they induced in DC, and also by the different capacity of those DC to induce regulatory T-cell populations.
It was previously shown that nCNF-DC induced CD4+CD25hiFoxP3hi Treg, which exhibit suppressive functions, unlike activated CD25+FoxP3+ Th cells.56 We showed previously that the induced CD4+CD25hiFoxP3hi Treg express more CD39, TGF-β, and IL-10, which contribute significantly to the suppressive functions of Tregs.31,57 IDO-1 expression by tolerogenic DC was shown to be important for the induction of CD4+CD25hiFoxP3hi,26 which seems true for nCNF-induced tolerogenic DC as well. Previously, we showed that a higher dose of nCNF (500 μg/mL) upregulated both ILT-4 and IDO-1, but downregulated ILT-3 expression by DC.31 According to the finding that ILT-3 is dispensable for the induction of CD4+CD25hiFoxP3hi Treg,58 but not CD8+ regulatory T cells,42 it is possible that DC treated with lower doses of nCNF induce predominantly CD4+ Tregs without affecting the CD8+ T-cell compartment.
In contrast to nCNF, APAcCNF-DC induced regulatory IL-10-producing CD4+, and particularly, CD8+ T-cell populations. CD4+ IL10+ T cells were recently interpreted as a heterogenous T-cell population with suppressive functions due to IL-10 production.41 Although described with different phenotype due to lack of specific markers, CD4+ T cells expressing high levels of IL-10, moderate levels of IFN-γ, and low levels of IL-4 are often referred to as Tr1/Tr1-like cells.41,59 Gregori et al49 showed that tolerogenic CD1a-CD14+ IL-10-producing DC induce Tr1 cells via ILT-4, although it remained unclear what effects DC-10 have on CD8+ T cells. IL-10, IL-6, IL-27, and ILT-4 were shown to be important inducers of Tr1/Tr1-like cells,60,61 all of which could explain the effects of APAcCNF-DC in the induction of IL-10-producing CD4+ IFN-γ+ T cells. An increased expression of IL-10 in CD4+ IFN-γ- T cells after the priming with APAcCNF-DC could also be a result of expanded Th2 cells, as they were also shown to produce IL-10, but not IFN-γ.59
In addition to IL-10-producing CD4+ T cells, DC differentiated in the presence of cCNF, and APAcCNF particularly, induced a higher expansion of regulatory IL-10-producing CD8+ T cells, which correlated with their high ILT-3 and ILT-4 expression. ILT-3 was described as a key inducer of suppressor CD8+ T cells, which was confirmed in this study as well. However, although both regulatory CD4+ and CD8+ T cells were shown previously to express ILT-4 ligand, HLA-G,62 it was not clearly defined whether ILT-4 also plays an important role in the induction of regulatory CD8+ T cells. To our knowledge, this is the first study to show that both ILT-3 and ILT-4 contribute to the expansion of human regulatory CD8+ T cells by tolerogenic DC. Different regulatory CD8+ T-cell populations were described in rodents, and some human counterparts have been proposed,63,64 but not clearly defined.65 Functional IL-2 receptor (CD25/CD122) seems to be critical for the expansion of CD8+ Treg both in humans and mice,64,65 which could explain why the upregulation of IL-10, CTLA-4, and TGF-β was exclusive for CD25+, but not for CD25-CD8+ T cells. It is not yet clear how FoxP3 expression in human CD8+ T cells correlates with their regulatory phenotype and functions, since FoxP3 is a marker of activated T cells as well.66 Zheng et al67 showed that human alloantigen specific CD8+ T cells display memory-like phenotype and mediate suppression via IL-10, CTLA-4, and TGF-β. Although the authors showed that IFN-γ is expressed highly by CD8+ Treg population,67 its presence was not clarified. IFN-γ is a potent inducer of IDO-1,26 but IDO-1 independent suppressive effects of IFN-γ were demonstrated as well.44,68 Therefore, it is possible that IFN-γ expression by human regulatory CD8+ T cells is both a marker and a suppressive mediator of human regulatory CD8+ T cells. However, additional phenotypical characterization of CD8+CD25+ IL-10+ T cells should be available, to clarify whether more than one CD8+ IL-10+ regulatory subpopulation was induced by APAcCNF-DC. The somewhat higher suppressive capacity of T cells induced by APAcCNF-DC, compared to those induced by nCNF-DC (Figure 4F), could be explained by the fact that APAcCNF-DC induced both CD8+ and CD4+ IL-10-producing T cells, but also due to the potentially higher suppressive capacity of CD8+ regulatory T cells compared to CD4+CD25hiFoxP3hi cells. In line with this, it was shown that mice regulatory CD8+ Tregs are more potent in the suppression of allograft rejection than conventional CD4+CD25+ Tregs.30,64 Unlike previous studies which showed an increased cytotoxicity of human regulatory CD8+CD103+ T cells,69 CD8+ T cells induced by HEp2 lysate-pulsed APAcCNF-DC displayed a diminished cytotoxicity potential toward tumor HEp2 cell line. Although cytotoxicity of the induced allogeneic CD8+ T cells toward HEp2 cells was still high, a diminished cytotoxicity potential of induced CD8+ T cells could be a problem if the organism ought to fight infections and tumor. In that sense, adverse effects, such as loss of immune surveillance of tumors and a weaker control of infections, were described in both autoimmunity and transplantation immunotherapies.70 Therefore, besides the strength of the induced suppressive mechanisms, potentially adverse effects should be considered when designing a therapy for autoimmunity and transplantation. Developing new tools which can control the induction of regulatory mechanisms more precisely, such as those based on CNF, could be a good starting point. Our pilot experiment in vivo, in a rat model of experimental autoimmune encephalomyelitis, a model of multiple sclerosis,71 suggested that the rat bone marrow-derived DC display a tolerogenic phenotype upon differentiation with APAcCNF, and when applied prophylactically, delayed the onset, enhanced recovery, and reduced the overall clinical signs of the disease. These studies, and additional ones on different models of autoimmunity and transplantation, could provide important clues to which tolerogenic mechanisms should be targeted in the development of a specific immunotherapy.
The precise mechanisms by which CNF samples induced different tolerogenic effects on DC remain unclear. It is possible that CNF size and composition could have induced different effects in DC leading to their divergent tolerogenic response. An increased expression of actin filaments at the place of contact with CNF, according to their role in internalization,72 suggests that CNF provide enough signals for DC to internalize them. Signaling through C-type lectins, such as CD209, was shown to regulate the activity of small GTPases RhoA, Rac1, and Cdc42, which are the central regulators of actin dynamics during DC internalization and functions.73 CNF contains different branching glycans31 able to ligate CD209.74 CD209 expression was indeed increased at the place of contact with nCNF and cCNF, but not with APAcCNF, which downregulated the expression of this molecule by DC significantly. In line with this, it was shown that the ligation of CD209 during DC differentiation downregulates CD209 expression and induces tolerogenic DC with low CD1a and high CD14 expression.75 Upon stimulation with LPS, those DC displayed a reduced Th1 polarizing capacity and increased expression of ILT-3 and IL-10,75 but it remained unknown how these correlate with DC capacity to induce Treg. Actin cytoskeleton alone can act as a cell’s mechanosensitive receptor.76 Previous data demonstrated that DC which adhered to the multi-walled carbon nanotubes-based scaffolds during differentiation displayed an impaired LPS-induced maturation, allostimulatory capacity, and the production of IL-12.18 In this sense, it is possible that different tolerogenic effects of nCNF were due to their larger size compared to cCNF and APAcCNF. Although similarly sized, APAcCNF displayed stronger tolerogenic effects on DC than cCNF, possibly due to increased local concentrations of APA attached to CNF. APA was shown to activate metabotropic GABA-B receptors partially,77 which are involved in migration of inflammatory cells to the skin, pointing to its anti-inflammatory effects.78 However, the role of GABA-B receptors in DC biology is still unknown.
Conclusion
Here, we showed for the first time that CNF induction of DC-mediated anti-inflammatory effects can be potentiated by functionalization of CNF with APA. Additionally, the functionalization of CNF shifted the tolerogenic properties of DC, from those inducing predominantly CD4+CD25hiFoxP3hi Treg toward those inducing potentially more suppressive regulatory CD8+CD25+IL10+ T cells. Different tolerogenic effects were mediated by induction of different regulatory molecules involved in DC tolerogenic activity, including IDO-1, ILT-3, and ILT-4. These results provide novel insights into immunomodulatory mechanisms of CNF and indicate their potential usefulness not only as well-tolerated scaffolds in tissue engineering, but also in designing a new platform for a controlled DC-mediated induction of tolerogenic immune response.
Acknowledgments
The authors are grateful to Dr Aleksandar Marinković, Faculty of Technology and Metallurgy, University of Belgrade, for performing the phosphate measurements on CNF samples. The work was supported financially by the Ministry of Education, Science and Technological Development of the Republic of Serbia (projects 175102, 173050), local grant of MMA (MFVMA/09/16-18), and the Slovenian Ministry of Education, Science, Culture and Sport (project MNT-Era-Net n-POSSCOG). The funding sources were not involved in study design; in the collection, analysis, and interpretation of data; in the writing of the report; or in the decision to submit the article for publication.
Author contributions
All authors contributed toward data analysis, drafting and critically revising the paper, gave final approval of the version to be published, and agree to be accountable for all aspects of the work.
Disclosure
The authors report no conflicts of interest in this work.
References
Kargarzadeh H, Mariano M, Gopakumar D, et al. Advances in cellulose nanomaterials. Cellulose. 2018;25(4):2151–2189. | ||
Lin N, Dufresne A. Nanocellulose in biomedicine: Current status and future prospect. Eur Polym J. 2014;59:302–325. | ||
Wen X, Zheng Y, Wu J, et al. Immobilization of collagen peptide on dialdehyde bacterial cellulose nanofibers via covalent bonds for tissue engineering and regeneration. Int J Nanomedicine. 2015;10:4623. | ||
Novotna K, Havelka P, Sopuch T, et al. Cellulose-based materials as scaffolds for tissue engineering. Cellulose. 2013;20(5):2263–2278. | ||
Hakkarainen T, Koivuniemi R, Kosonen M, et al. Nanofibrillar cellulose wound dressing in skin graft donor site treatment. J Control Release. 2016;244(Pt B):292–301. | ||
Janjic M, Pappa F, Karagkiozaki V, Gitas C, Ktenidis K, Logothetidis S. Surface modification of endovascular stents with rosuvastatin and heparin-loaded biodegradable nanofibers by electrospinning. Int J Nanomedicine. 2017;12:6343–6355. | ||
Gorgieva S, Girandon L, Kokol V. Mineralization potential of cellulose-nanofibrils reinforced gelatine scaffolds for promoted calcium deposition by mesenchymal stem cells. Mater Sci Eng C Mater Biol Appl. 2017;73:478–489. | ||
Ding Q, Xu X, Yue Y, et al. Nanocellulose-mediated electroconductive self-healing hydrogels with high strength, plasticity, viscoelasticity, stretchability, and biocompatibility toward multifunctional applications. ACS Appl Mater Interfaces. 2018;10(33):27987–28002. | ||
Čolić M, Mihajlović D, Mathew A, Naseri N, Kokol V. Cytocompatibility and immunomodulatory properties of wood based nanofibrillated cellulose. Cellulose. 2015;22(1):763–778. | ||
Tibolla H, Pelissari FM, Martins JT, Vicente AA, Menegalli FC. Cellulose nanofibers produced from banana peel by chemical and mechanical treatments: Characterization and cytotoxicity assessment. Food Hydrocoll. 2018;75:192–201. | ||
Märtson M, Viljanto J, Hurme T, Laippala P, Saukko P. Is cellulose sponge degradable or stable as implantation material? An in vivo subcutaneous study in the rat. Biomaterials. 1999;20(21):1989–1995. | ||
Saito T, Kimura S, Nishiyama Y, Isogai A. Cellulose nanofibers prepared by TEMPO-mediated oxidation of native cellulose. Biomacromolecules. 2007;8(8):2485–2491. | ||
O’Brien FJ. Biomaterials & scaffolds for tissue engineering. Mater Today. 2011;14(3):88–95. | ||
Kollar P, Závalová V, Hošek J, et al. Cytotoxicity and effects on inflammatory response of modified types of cellulose in macrophage-like THP-1 cells. Int Immunopharmacol. 2011;11(8):997–1001. | ||
Vartiainen J, Pöhler T, Sirola K, et al. Health and environmental safety aspects of friction grinding and spray drying of microfibrillated cellulose. Cellulose. 2011;18(3):775–786. | ||
Azuma K, Osaki T, Ifuku S, et al. Suppressive effects of cellulose nanofibers – made from adlay and seaweed – on colon inflammation in an inflammatory bowel-disease model. Bioactive Carbohydrates and Dietary Fibre. 2013;2(1):65–72. | ||
Dobrovolskaia MA, Mcneil SE. Immunological properties of engineered nanomaterials. Nat Nanotechnol. 2007;2(8):469–478. | ||
Aldinucci A, Turco A, Biagioli T, et al. Carbon nanotube scaffolds instruct human dendritic cells: modulating immune responses by contacts at the nanoscale. Nano Lett. 2013;13(12):6098–6105. | ||
Gad M, Ravn P, Søborg DA, Lund-Jensen K, Ouwehand AC, Jensen SS. Regulation of the IL-10/IL-12 axis in human dendritic cells with probiotic bacteria. FEMS Immunol Med Microbiol. 2011;63(1):93–107. | ||
Steinman RM, Hawiger D, Nussenzweig MC. Tolerogenic dendritic cells. Annu Rev Immunol. 2003;21(1):685–711. | ||
Nich C, Takakubo Y, Pajarinen J, et al. Macrophages-Key cells in the response to wear debris from joint replacements. J Biomed Mater Res A. 2013;101(10):3033–3045. | ||
Luger D, Silver PB, Tang J, et al. Either a Th17 or a Th1 effector response can drive autoimmunity: conditions of disease induction affect dominant effector category. J Exp Med. 2008;205(4):799–810. | ||
Cvetkovic J, Sofronic-Milosavljevic L, Ilic N, Gnjatovic M, Nagano I, Gruden-Movsesijan A. Immunomodulatory potential of particular Trichinella spiralis muscle larvae excretory-secretory components. Int J Parasitol. 2016;46(13–14):833–842. | ||
Dokić J, Tomić S, Marković M, Milosavljević P, Colić M. Mesenchymal stem cells from periapical lesions modulate differentiation and functional properties of monocyte-derived dendritic cells. Eur J Immunol. 2013;43(7):1862–1872. | ||
Ilarregui JM, Croci DO, Bianco GA, et al. Tolerogenic signals delivered by dendritic cells to T cells through a galectin-1-driven immunoregulatory circuit involving interleukin 27 and interleukin 10. Nat Immunol. 2009;10(9):981–991. | ||
Raker VK, Domogalla MP, Steinbrink K. Tolerogenic dendritic cells for regulatory T cell induction in man. Front Immunol. 2015;6:569. | ||
van Brussel I, Lee WP, Rombouts M, et al. Tolerogenic dendritic cell vaccines to treat autoimmune diseases: can the unattainable dream turn into reality? Autoimmun Rev. 2014;13(2):138–150. | ||
Li H, Shi B. Tolerogenic dendritic cells and their applications in transplantation. Cell Mol Immunol. 2015;12(1):24–30. | ||
Tomić S, Rudolf R, Brunčko M, Anžel I, Savić V, Colić M. Response of monocyte-derived dendritic cells to rapidly solidified nickel-titanium ribbons with shape memory properties. Eur Cell Mater. 2012;23:58–80. | ||
Dai Z, Zhang S, Xie Q, et al. Natural CD8+CD122+ T cells are more potent in suppression of allograft rejection than CD4+CD25+ regulatory T cells. Am J Transplant. 2014;14(1):39–48. | ||
Tomić S, Kokol V, Mihajlović D, Mirčić A, Čolić M. Native cellulose nanofibrills induce immune tolerance in vitro by acting on dendritic cells. Sci Rep. 2016;6:31618. | ||
ISO 10304-1. Water quality – Determination of dissolved anions by liquid chromatography of ions. Part 1: Determination of bromide, chloride, fluoride, nitrate, nitrite, phosphate and sulfate. Vol 10304-1. International Standards Organisation; 2007. Available from: https://www.iso.org/standard/46004.html. Accessed October 16, 2018. | ||
Pradhan S, Pokhrel MR. Spectrophotometric determination of phosphate in sugarcane juice, fertilizer, detergent and water samples by molybdenum blue method. Scientific World. 2013;11(11):58–62. | ||
Tomić S, Janjetović K, Mihajlović D, et al. Graphene quantum dots suppress proinflammatory T cell responses via autophagy-dependent induction of tolerogenic dendritic cells. Biomaterials. 2017;146:13–28. | ||
Relloso M, Puig-Kröger A, Pello OM, et al. DC-SIGN (CD209) expression is IL-4 dependent and is negatively regulated by IFN, TGF-beta, and anti-inflammatory agents. J Immunol. 2002;168(6):2634–2643. | ||
Tomić S, Ðokić J, Vasilijić S, et al. Size-dependent effects of gold nanoparticles uptake on maturation and antitumor functions of human dendritic cells in vitro. PLoS One. 2014;9(5):e96584. | ||
Kalinski P, Wieckowski E, Muthuswamy R, de Jong E. Generation of stable Th1/CTL-, Th2-, and Th17-inducing human dendritic cells. Dendritic Cell Protocols. 2010:117–133. | ||
Murphy FA, Schinwald A, Poland CA, Donaldson K. The mechanism of pleural inflammation by long carbon nanotubes: interaction of long fibres with macrophages stimulates them to amplify pro-inflammatory responses in mesothelial cells. Part Fibre Toxicol. 2012;9(1):8. | ||
Chomarat P, Banchereau J, Davoust J, Palucka AK. IL-6 switches the differentiation of monocytes from dendritic cells to macrophages. Nat Immunol. 2000;1(6):510–514. | ||
Magerus-Chatinet A, Stolzenberg MC, Loffredo MS, et al. FAS-L, IL-10, and double-negative CD4- CD8- TCR alpha/beta+ T cells are reliable markers of autoimmune lymphoproliferative syndrome (ALPS) associated with FAS loss of function. Blood. 2009;113(13):3027–3030. | ||
White AM, Wraith DC. Tr1-Like T Cells – An Enigmatic Regulatory T Cell Lineage. Front Immunol. 2016;7(Suppl 1):355. | ||
Vlad G, Cortesini R, Suciu-Foca N. CD8+ T suppressor cells and the ILT3 master switch. Hum Immunol. 2008;69(11):681–686. | ||
Bahri R, Bollinger A, Bollinger T, Orinska Z, Bulfone-Paus S. Ectonucleotidase CD38 demarcates regulatory, memory-like CD8+ T cells with IFN-γ-mediated suppressor activities. PLoS One. 2012;7(9):e45234. | ||
Stroopinsky D, Avivi I, Rowe JM, Avigan D, Katz T. Allogeneic induced human FOXP3(+)IFN-gamma(+) T cells exhibit selective suppressive capacity. Eur J Immunol. 2009;39(10):2703–2715. | ||
Xu Z, Ho S, Chang CC, et al. Molecular and cellular characterization of human CD8 T suppressor cells. Front Immunol. 2016;7:549. | ||
Cernadas M, Lu J, Watts G, Brenner MB. CD1a expression defines an interleukin-12 producing population of human dendritic cells. Clin Exp Immunol. 2009;155(3):523–533. | ||
Kvistborg P, Boegh M, Pedersen AW, Claesson MH, Zocca MB. Fast generation of dendritic cells. Cell Immunol. 2009;260(1):56–62. | ||
Pavlović B, Tomić S, Đokić J, et al. Fast dendritic cells matured with Poly (I: C) may acquire tolerogenic properties. Cytotherapy. 2015;17(12):1763–1776. | ||
Gregori S, Tomasoni D, Pacciani V, et al. Differentiation of type 1 T regulatory cells (Tr1) by tolerogenic DC-10 requires the IL-10–dependent ILT4/HLA-G pathway. Blood. 2010;116(6):935–944. | ||
Gu Y, Yang J, Ouyang X, et al. Interleukin 10 suppresses Th17 cytokines secreted by macrophages and T cells. Eur J Immunol. 2008;38(7):1807–1813. | ||
Gorelik L, Flavell RA. Transforming growth factor-beta in T-cell biology. Nat Rev Immunol. 2002;2(1):46–53. | ||
Gerosa F, Baldani-Guerra B, Lyakh LA, et al. Differential regulation of interleukin 12 and interleukin 23 production in human dendritic cells. J Exp Med. 2008;205(6):1447–1461. | ||
Damsker JM, Hansen AM, Caspi RR. Th1 and Th17 cells. Ann N Y Acad Sci. 2010;1183(1):211–221. | ||
Liu H, Rohowsky-Kochan C. Interleukin-27-mediated suppression of human Th17 cells is associated with activation of STAT1 and suppressor of cytokine signaling protein 1. J Interferon Cytokine Res. 2011;31(5):459–469. | ||
Macdonald AS, Maizels RM. Alarming dendritic cells for Th2 induction. J Exp Med. 2008;205(1):13–17. | ||
Rosenblum MD, Way SS, Abbas AK. Regulatory T cell memory. Nat Rev Immunol. 2016;16(2):90–101. | ||
Vignali DA, Collison LW, Workman CJ. How regulatory T cells work. Nat Rev Immunol. 2008;8(7):523–532. | ||
Penna G, Roncari A, Amuchastegui S, et al. Expression of the inhibitory receptor ILT3 on dendritic cells is dispensable for induction of CD4+Foxp3+ regulatory T cells by 1,25-dihydroxyvitamin D3. Blood. 2005;106(10):3490–3497. | ||
Groux H, O’Garra A, Bigler M, et al. A CD4+ T-cell subset inhibits antigen-specific T-cell responses and prevents colitis. Nature. 1997;389(6652):737–742. | ||
Jin JO, Han X, Yu Q. Interleukin-6 induces the generation of IL-10-producing Tr1 cells and suppresses autoimmune tissue inflammation. J Autoimmun. 2013;40:28–44. | ||
Pot C, Jin H, Awasthi A, et al. Cutting edge: IL-27 induces the transcription factor c-Maf, cytokine IL-21, and the costimulatory receptor ICOS that coordinately act together to promote differentiation of IL-10-producing Tr1 cells. J Immunol. 2009;183(2):797–801. | ||
Le Rond S, Le Maoult J, Créput C, et al. Alloreactive CD4+ and CD8+ T cells express the immunotolerant HLA-G molecule in mixed lymphocyte reactions: in vivo implications in transplanted patients. Eur J Immunol. 2004;34(3):649–660. | ||
Shi Z, Okuno Y, Rifa’i M, et al. Human CD8+CXCR3+ T cells have the same function as murine CD8+CD122+ Treg. Eur J Immunol. 2009;39(8):2106–2119. | ||
Churlaud G, Pitoiset F, Jebbawi F, et al. Human and Mouse CD8(+)CD25(+)FOXP3(+) Regulatory T Cells at Steady State and during Interleukin-2 Therapy. Front Immunol. 2015;6:171. | ||
Liu J, Chen D, Nie GD, Dai Z. CD8(+)CD122(+) T-Cells: A Newly Emerging Regulator with Central Memory Cell Phenotypes. Front Immunol. 2015;6:494. | ||
Kmieciak M, Gowda M, Graham L, et al. Human T cells express CD25 and Foxp3 upon activation and exhibit effector/memory phenotypes without any regulatory/suppressor function. J Transl Med. 2009;7(1):89. | ||
Zheng J, Liu Y, Qin G, et al. Efficient induction and expansion of human alloantigen-specific CD8 regulatory T cells from naive precursors by CD40-activated B cells. J Immunol. 2009;183(6):3742–3750. | ||
Li XL, Ménoret S, Bezie S, et al. Mechanism and localization of CD8 regulatory T cells in a heart transplant model of tolerance. J Immunol. 2010;185(2):823–833. | ||
Koch SD, Uss E, van Lier RA, Ten Berge IJ. Alloantigen-induced regulatory CD8+CD103+ T cells. Hum Immunol. 2008;69(11):737–744. | ||
Caspi RR. Immunotherapy of autoimmunity and cancer: the penalty for success. Nat Rev Immunol. 2008;8(12):970–976. | ||
Sofronic-Milosavljevic LJ, Radovic I, Ilic N, Majstorovic I, Cvetkovic J, Gruden-Movsesijan A. Application of dendritic cells stimulated with Trichinella spiralis excretory-secretory antigens alleviates experimental autoimmune encephalomyelitis. Med Microbiol Immunol. 2013;202(3):239–249. | ||
Collins A, Warrington A, Taylor KA, Svitkina T. Structural organization of the actin cytoskeleton at sites of clathrin-mediated endocytosis. Curr Biol. 2011;21(14):1167–1175. | ||
Schulz AM, Stutte S, Hogl S, et al. Cdc42-dependent actin dynamics controls maturation and secretory activity of dendritic cells. J Cell Biol. 2015;211(3):553–567. | ||
Guo Y, Feinberg H, Conroy E, et al. Structural basis for distinct ligand-binding and targeting properties of the receptors DC-SIGN and DC-SIGNR. Nat Struct Mol Biol. 2004;11(7):591–598. | ||
VajgerSvajger U, Obermajer N, Anderluh M, Kos J, Jeras M. DC-SIGN ligation greatly affects dendritic cell differentiation from monocytes compromising their normal function. J Leukoc Biol. 2011;89(6):893–905. | ||
di Cio S, Gautrot JE. Cell sensing of physical properties at the nanoscale: Mechanisms and control of cell adhesion and phenotype. Acta Biomater. 2016;30:26–48. | ||
Klunk WE, Mcclure RJ, Xu C-J, Pettegrew JW. Structural determinants of activity at the GABAB receptor. Mol Chem Neuropathol. 1995;26(1):15–30. | ||
Duthey B, Hübner A, Diehl S, Boehncke S, Pfeffer J, Boehncke WH. Anti-inflammatory effects of the GABA(B) receptor agonist baclofen in allergic contact dermatitis. Exp Dermatol. 2010;19(7):661–666. |
Supplementary materials
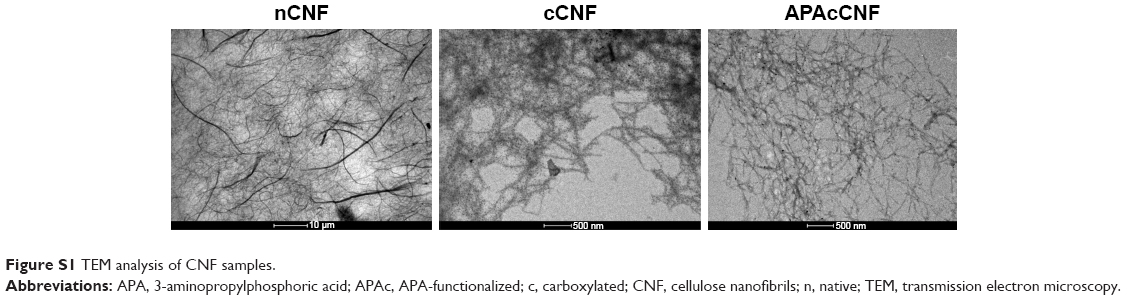 | Figure S1 TEM analysis of CNF samples. |
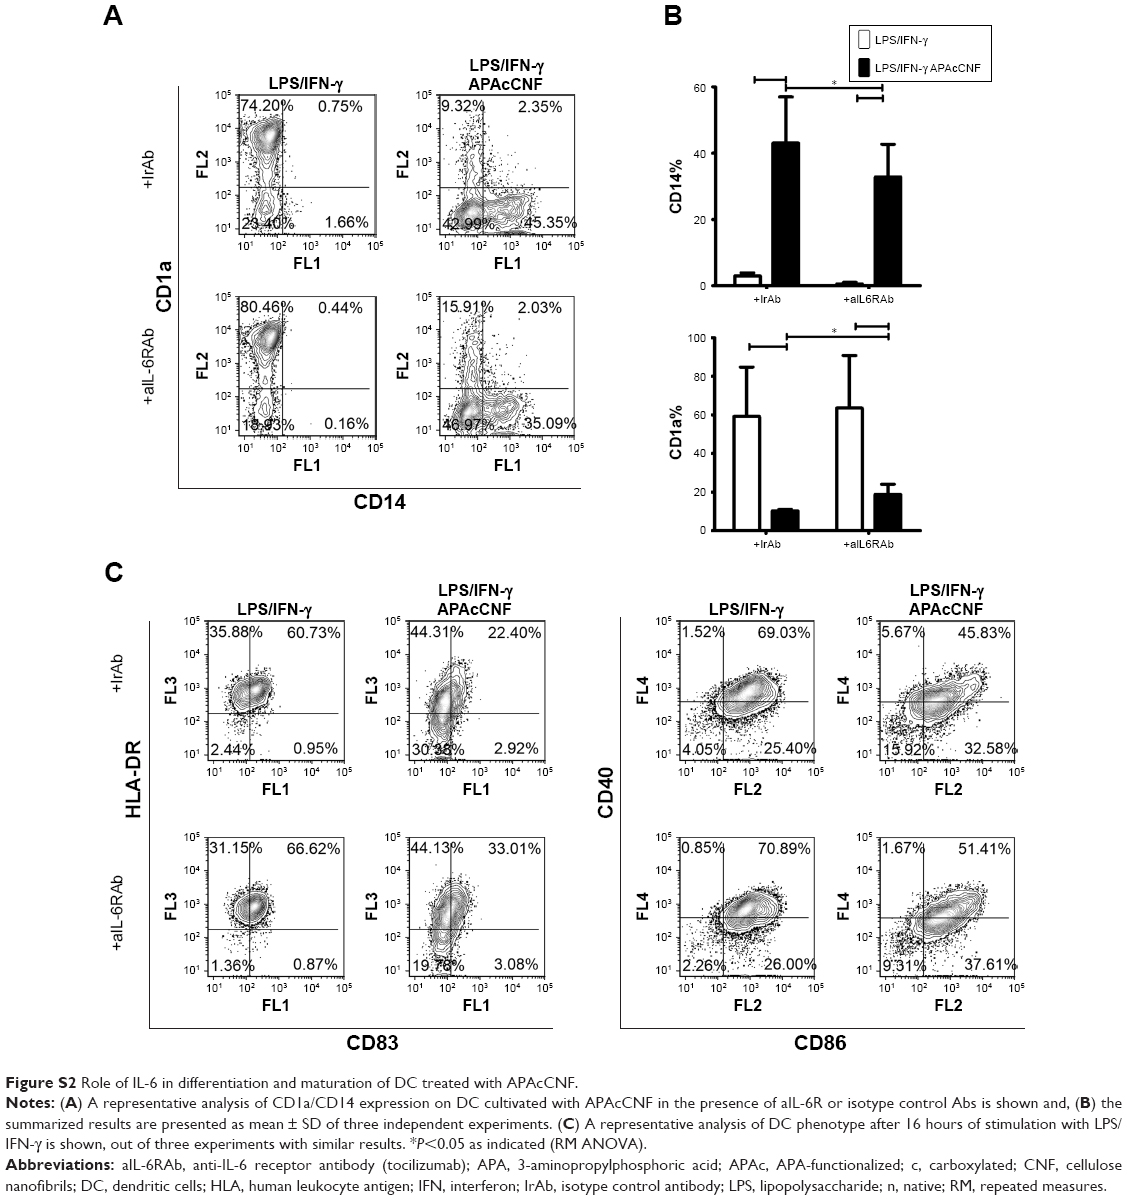 | Figure S2 Role of IL-6 in differentiation and maturation of DC treated with APAcCNF. |
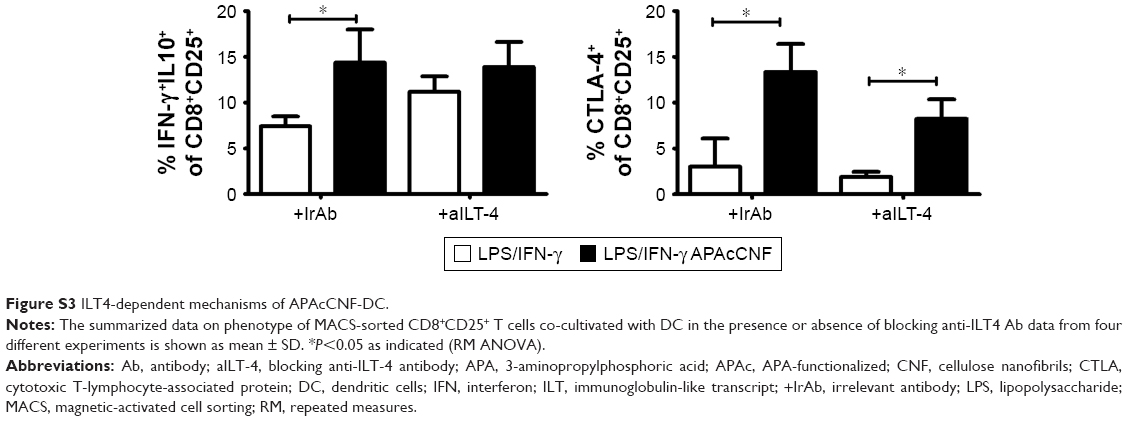 | Figure S3 ILT4-dependent mechanisms of APAcCNF-DC. |
 © 2018 The Author(s). This work is published and licensed by Dove Medical Press Limited. The full terms of this license are available at https://www.dovepress.com/terms.php and incorporate the Creative Commons Attribution - Non Commercial (unported, v3.0) License.
By accessing the work you hereby accept the Terms. Non-commercial uses of the work are permitted without any further permission from Dove Medical Press Limited, provided the work is properly attributed. For permission for commercial use of this work, please see paragraphs 4.2 and 5 of our Terms.
© 2018 The Author(s). This work is published and licensed by Dove Medical Press Limited. The full terms of this license are available at https://www.dovepress.com/terms.php and incorporate the Creative Commons Attribution - Non Commercial (unported, v3.0) License.
By accessing the work you hereby accept the Terms. Non-commercial uses of the work are permitted without any further permission from Dove Medical Press Limited, provided the work is properly attributed. For permission for commercial use of this work, please see paragraphs 4.2 and 5 of our Terms.