")
Back to Journals » Clinical Interventions in Aging » Volume 15
Frail Older Individuals Maintaining a Steady Standing Position: Associations Between Sway Measurements with Frailty Status Across Four Different Frailty Instruments
Authors Schülein S , Sieber CC, Gaßmann KG, Ritt M
Received 13 July 2019
Accepted for publication 13 December 2019
Published 23 March 2020 Volume 2020:15 Pages 451—467
DOI https://doi.org/10.2147/CIA.S223056
Checked for plagiarism Yes
Review by Single anonymous peer review
Peer reviewer comments 3
Editor who approved publication: Dr Richard Walker
Samuel Schülein,1 Cornel Christian Sieber,2,3 Karl-Günter Gaßmann,1,2 Martin Ritt2,4
1Geriatrics Centre Erlangen, Malteser Waldkrankenhaus St. Marien, Erlangen, Germany; 2Institute for Biomedicine of Aging (IBA), Friedrich-Alexander Universität Erlangen-Nürnberg (FAU), Nürnberg, Germany; 3Department of Internal Medicine, Kantonsspital Winterthur, Winterthur, Switzerland; 4Department of Internal Medicine III, Klinikum Neumarkt, Kliniken des Landkreises Neumarkt i. d. OPf, Neumarkt, Germany
Correspondence: Martin Ritt
Institute for Biomedicine of Ageing (IBA), Friedrich-Alexander-Universität Erlangen-Nürnberg (FAU), Kobergerstraße 60, Nürnberg D-90408, Germany
Tel +49 9181 420 3076
Fax +49 9181 420 3077
Email [email protected]
Objective: An analysis of the relationships between static equilibrium parameters and frailty status and/or severity across four different frailty measures.
Design: Cross-sectional analysis.
Setting: Geriatric wards of a general hospital.
Participants: One hundred twenty-three geriatric inpatients comprising 70 women (56.5%) and 53 men (42.7%) with an age range of 68– 95 years.
Methods: The variation in the center of pressure (CoP), ie, the length of sway, the area of sway, and the mean speed, was assessed for different positions/tasks: 1) wide standing with eyes open (WSEO); 2) wide standing with eyes closed (WSEC); 3) narrow standing with eyes open (NSEO) and 4) narrow standing with eyes closed (NSEC), using a force plate. Frailty status and/or frailty severity were evaluated using the frailty phenotype (FP), the clinical frailty scale (CFS), the 14-item frailty index based on a comprehensive geriatric assessment (FI-CGA), and a 47-item frailty index (FI).
Results: WSEO length of sway (FP, CFS, FI-CGA, FI), WSEO area of sway (FP, CFS, FI-CGA, FI), and WSEO mean speed (FP, CFS, FI-CGA, FI), WSEC length of sway (FP, FI-CGA, FI), WSEC area of sway (FP, FI-CGA, FI) and WSEC mean speed (FI-CGA, FI), NSEO length of sway (FP, FI-CGA, FI), NSEO area of sway (FP, CFS, FI-CGA, FI), and NSEO mean speed (FP, CFS, FI-CGA, FI), NSEC length of sway (FI-CGA, FI), NSEC area of sway (FI-CGA, FI) and NSEC mean speed (FI-CGA, FI) were associated with the frailty status and/or severity across the four different frailty instruments (all p < 0.05, respectively).
Conclusion: Greater fluctuations in CoP with increasing frailty status and/or severity were a uniform finding across various major frailty instruments.
Keywords: frailty instruments, balance quality parameters, older people
Introduction
Frailty in older people refers to a clinically identifiable syndrome or condition of reduced reserve capacity, often of multiple organ systems.1 This leads to frail individuals showing increased vulnerability and is characterized by their impaired ability to regulate homeostasis, in order to adequately compensate for the effects of an intrinsic and/or extrinsic stressor.1 Consequently, frail individuals are exposed to an increased risk of mortality and other adverse health effects.2–7 Several diseases or adverse medical conditions, such as malnutrition, sarcopenia, gait, and visual impairments, endocrine alterations, mild inflammations, (chronic) diseases, multimorbidity, polypharmacy, cognitive impairments, affective changes, dependency on help in relation to the activities of daily life, as well as social isolation, amongst others, have been identified as risk factors for the development of frailty.8–12 Up until now, no single screening or assessment instrument for the detection of frailty has been established as the gold standard. Nonetheless, the frailty phenotype (FP),3 the clinical frailty scale (CFS),13 the frailty index based on a comprehensive geriatric assessment (FI-CGA),14,15 and the frailty index (FI)16 are well-validated instruments for the evaluation of older people in relation to frailty.
Postural stability, also referred to as balance, might best be considered as a multidimensional concept indicating the ability of a person not to fall.17–21 Postural stability/postural control is regarded as the ability to control body position in space, in order to achieve or restore a state of equilibrium by maintaining, achieving, or restoring posture or activity.17,21–23 The postural system comprises a complex assembly of related and interacting neuronal and musculoskeletal units. Amongst others, these include sensory/perceptual processes (visual acuity, vestibular and proprioceptive sensation), motor processes (organization of all body muscles into neuromuscular synergies), and central processing (slowing and/or reducing signal frequencies to and from effector organs).18,24–29 Posture control is commonly quantified by measuring the postural sway resulting from the displacement of the center of pressure (CoP) at the feet.17,18,22,23,25,30–32 Changes in such systems may result in impaired posture. Several different conditions have been associated with postural control impairment in older people. This includes, for example, a reduction in visual acuity, polyneuropathy, diabetes mellitus, and peripheral arterial disease.33–36 Changes such as a decrease in muscle strength,23 the development of sarcopenia, and the duration of bed rest during hospitalization,37 increase in muscle volume and size, for example, plantar flexors or trunk musculature, muscle density, lower muscle fat content,23,25,38 and increases in body weight. Also of relevance are Parkinson’s disease,39 arthrosis of the cervical spine, gonarthrosis and fear of falling,22,40 cognitive impairment and moderate Alzheimer’s disease,41,42 and the presence of orthostatic hypotension.33
It therefore is of interest to examine older frail people, who often have deficiencies in the functioning of several body/organ systems and/or patients who have risk factors for frailty, for changes in those systems decisively involved in the body’s postural control. However, previous studies investigating this relationship between postural control and/or equilibrium parameters and frailty status produced inconsistent results.36,43–45 A limitation of the aforementioned studies was that they categorized patients’ frailty exclusively by the frailty phenotype instrument.43 To the best of our knowledge, so far, no data has become available to enable the evaluation of postural control and/or balance in frail individuals whose frailty status has been assessed by frailty assessment tools other than the frailty phenotype instrument. Against this background, our aim was to evaluate postural control and frailty status and/or degree of frailty severity using four significant frailty instruments and risk factors associated with the development of frailty in geriatric inpatients. We investigated whether postural sway measurements are associated with frailty status and/or degree according to the criteria adopted by the four frailty instruments and/or risk factors for frailty.
Methods
Participants and Study Design
This cross-sectional study included 123 geriatric inpatients [70 women (56.5%), 53 men (42.7%)] from the wards of the Geriatrics Centre Erlangen (GCE) of the Malteser Waldkrankenhaus St. Marien, Erlangen, Germany. As recommended by the Medical Association for the Promotion of Geriatrics in Bavaria, Germany (Ärztliche Arbeitsgemeinschaft zur Förderung der Geriatrie in Bayern (AfGiB e.V.)), all patients with signs of balance and mobility disorders undergo a functional mobility assessment. This includes a basic geriatric assessment procedure, in particular, the Timed Up & Go Test (TUG),46 a postural stability measurement, and gait analysis. In addition to these functional assessments, visual acuity measured at a distance of 5 m, sensory perception (depth sensitivity) in the feet, and the presence of orthostatic hypotension were examined in the GCE mobility laboratory.47,48
Each patient received detailed information about the study and written informed consent was obtained prior to data collection, in accordance with the Helsinki Declaration. The study was approved by the Clinical Ethics Committee of the Medical Faculty of the Friedrich-Alexander-University Erlangen-Nürnberg (FAU), Germany.
Patients (at least 65 years old) were included if they were able to stand upright, barefoot, with arms held relaxed along the side of the body for at least 60 s without assistance, and understood and were able to follow verbal instructions. Exclusion criteria were a pronounced Genu valgum, evidence of severe pain, visual impairment (<0125/40 at 5 m), Mini-Mental State Examination (MMSE)49 score ≤20, acute injuries and conditions preventing the patient from performing the analysis, such as (sub-)acute limiting diseases, fatigue, vomiting, and dehydration.
Frailty Measures
The Frailty Phenotype (FP)
The FP classifies patients into three categories based on five phenotypic components: “robust” (no deficit in one phenotypic component), “pre-frail” (deficit in one or two phenotypic components), and “frail” (deficit in three or more phenotypic components).3 The operationalization of the five phenotypic components in this study was as follows: 1. unintentional loss of either ≥10 lbs or ≥5% of body weight within the last 12 months. 2. self-reported feeling of “constant fatigue”, 3. time required for the Timed Up & Go test (>19 s), 4. patient’s inability to stand up and walk at least 50 m (without the wheeled walker), and 5. significant loss of strength within the physical examination as done previously by our group10 et al.
The Clinical Frailty Scale (CFS)
The clinical frailty scale was adopted from the work of Rockwood et al13 by assessing function, morbidity, central nervous system impairment (including severity of dementia), and clinical judgment, as described in detail elsewhere.13 The Clinical Frailty Scale discriminates patients across nine categories: Category 1: very fit, category 2: well, category 3: managing well, category 4: vulnerable, category 5: mildly frail, category 6: moderately frail, category 7: severely frail, category 8: very severely frail, category 9: terminally ill.13
The Frailty Index Based on a Comprehensive Geriatric Assessment (FI-CGA)
The 14-item frailty index, based on a comprehensive geriatric assessment (FI-CGA), was operationalized on the basis of impairments in 10 functional areas (i.e., cognition, emotion, communication, nutrition, bladder function, bowel function, mobility, balance/history of falls, instrumental, and the basic activities of daily living, social situation) and a comorbidity index (ie, the Cumulative Illness Rating Scale (CIRS)),50 based on previous work by Jones et al15 reported previously by us.51
The Frailty Index (FI)
The FI consists of 47 items categorized in the following way: 1. requires help with eating, 2. requires help bathing, 3. requires help dressing, 4. requires help climbing stairs, 5. requires help in/out of the chair, 6. requires help with bathing/showering, grooming nail and oral care, 7. requires help toileting, 8. urinary incontinence, 9. bowel incontinence, 10. lost more than 4.5 kg in the last year, 11. health self-report, 12. history of falls, 13. TUG score, 14. impairment of vision, 15. impaired sense of hearing, 16. insomnia, 17. arterial hypertension, 18. heart failure, 19. peripheral vascular disease, 20. stroke, 21. cancer, 22. diabetes mellitus, 23. chronic lung disease, 24. constipation, 25. other psychogenic disorders, 26–27. other medical diseases, 28. difficulty speaking, 29. cardiac arrhythmia, 30. myocardial infarction, 31. arthritis, 32. kidney disease, 33. anxiety, 34. alcohol addiction, 35. hypo or hyperthyroidism, 36. measured systolic blood pressure, 37. measured diastolic blood pressure, 38. orthostatic hypotension 39. Parkinson’s disease, 40. the feeling of permanent tiredness, 41. reduced muscle strength, 42. depression, 43. MMSE score, 44–47. number of medications.
The FI-CGA and FI were scored by dividing the score for each item by the maximum possible score for the items, resulting in a final score between 0 and 1. Since 0.25 was previously proposed as a cut-off for a frailty index between robust and frail older persons,52 we chose the FI-CGA and the FI as categorical variables according to this cut-off criterion. In addition, the FI and the FI-CGA were evaluated as a continuous variable (full scales).
Individual Risk Factors for the Development of Frailty
We selected individual risk factors for the development of frailty based on pathophysiological considerations. These included cognitive decline (MMSE ≤ 23 points), affective alterations (Geriatric Depression Scale (GDS) <5 points), mobility impairment (TUG > 10 s), and difficulties within the activities of daily living (Barthel Index <100 points). In addition, co-morbidity burden (Cumulative Illness Rating Scale (CIRS) < median CIRS of the total study cohort), a history of a fall, a history of diabetes mellitus, a history of a stroke, abnormal muscle strength established in the physical examination, and restricted vision (visus < median visus of the total study cohort) were considered.
Measuring Postural Sway
The Force Plate
The trajectories of the center of pressure (CoP) in the Y-axis (horizontal trace of the anterior-posterior) plane and the X-axis (horizontal trace of the latero-lateral) plane were measured on the force plate53 (SATEL, 6, rue du Limousin, 31700 Blagnac, France). Three strain gauge force transducers were mounted and positioned as an equilateral triangle of 40 cm per side in this force plate, from whose resistors the computer calculated the instantaneous position of the CoP.26 The dimensions of the platform were 480 mm x 480 mm x 65 mm (LWH) and weighed 12 kg. For a maximum of 100 kg/sensor, the sensitivity was validated at 0.0017%. A force change of 9.81 N on the strain gauge corresponded to a change in power of 50 mV at an output range between 0 and 5 V.32 The displacement of the CoP was recorded in the anterior-posterior and latero-lateral directions, at a sampling frequency of 40 Hz. The system ran using an analogue digital 12-bit converter and a 50 Hz rejection filter. The reliability and validity of the Satel® force plate have been published in earlier papers by our research group.32,54,55
Setting
As described by Prieto et al,56 evaluations of postural steadiness typically include a separate test, with eyes open and eyes closed.19 The conditions were standardized before testing. All measurements on the force plate were performed by the same professional physical therapist (S.S.) who was blinded to the clinical characteristics of the subjects and the results were collected using the frailty instruments. The patients stood, without shoes, on the force plate, with laterally relaxed arms hanging down beside the body, for four consecutive measurements, followed by a two-minute break between each measurement (sitting on a chair). The room was constantly indirectly illuminated and a target mark which the participant was required to focus on was fixed, at a height and a distance of 1.5 m, to the wall in front of the participant.
Force-Plate-Derived Parameter
In the mobility laboratory of the Geriatrics Centre of the Malteser Waldkrankenhaus St. Marien, Erlangen, four standardised measurements on the force plate were carried out for all patients. No practice trials and no randomization were performed prior to testing. All force plate parameters were recorded according to the guidelines of the ISPGR Standardization Committee.53 The patients were instructed to stand quietly, without shoes, on the force plate in an upright position with relaxed arms hanging sideways beside the body. Participants were instructed to maintain balance and look straight ahead with their heads held focusing on a marker point on the wall. They maintained the position (first three recordings) for 30 s and for 60 s within the last trial.32 The data were recorded at a frequency of 40 Hz. The initial positions and examination conditions were: (a) wide standing (30° angle between both feet and 4 cm heel distance) with eyes open (WSEO) and (b) wide standing with eyes closed (WSEC). Tasks three and four were (c) narrow standing with eyes open (NSEO) and narrow standing with eyes closed (NSEC). The position of the feet touching one another during narrow standing was determined by a vertical line in the middle of the force plate. The following three force plate parameters were analyzed: (1) the length of sway (mm), (2) the area of sway (mm2), and (3) mean speed of CoP (mm/s).
Statistics
All statistical analyses were performed with the statistical package for the social sciences software (IBM SPSS Statistics 24). The results are presented as percent (%), mean values, ± standard deviations and 95% confidence intervals. Correlation analyses were calculated using Spearman’s Rho method. Comparisons between the groups were made using the nonparametric Mann–Whitney U-Test, the Chi-square Test or the Kruskal–Wallis test, and/or effect size, as appropriate. Effect size of the individual parameter was calculated according to the formula: (mean of experimental group – mean of control group) divided by the standard deviation.57 An effect size of 0.2, 0.5 and 0.8 might be described as “small”, “medium” and “large”, respectively.57 A two-tailed p-value <0.05 was considered statistically significant.
Results
Clinical Characteristics of the Study Participants
The clinical characteristics of the study participants (n = 123) are shown in Table 1. The participants were divided into two groups according to the median of the total cohort (median age was 82.98 ± 6.2 years): (1) Younger group (< median, n=61) and (2) Older group (≥ median, n= 62). The older individuals had lower GDS points, a lower Barthel score, a higher prevalence of renal/kidney disease, a longer length of sway during NSEO, a higher speed of sway during NSEO, higher CFS, FI-CGA and FI compared to the younger patients. No differences were found between the aforementioned two groups of patients in anthropometric data, such as gender, height, weight, or body mass index (BMI), in the functional mobility assessments such as TUG and Performance-Oriented Mobility Assessment (POMA),58 and in the diagnoses and the history of falls over the past 12 months, amongst other characteristics (Table 1).
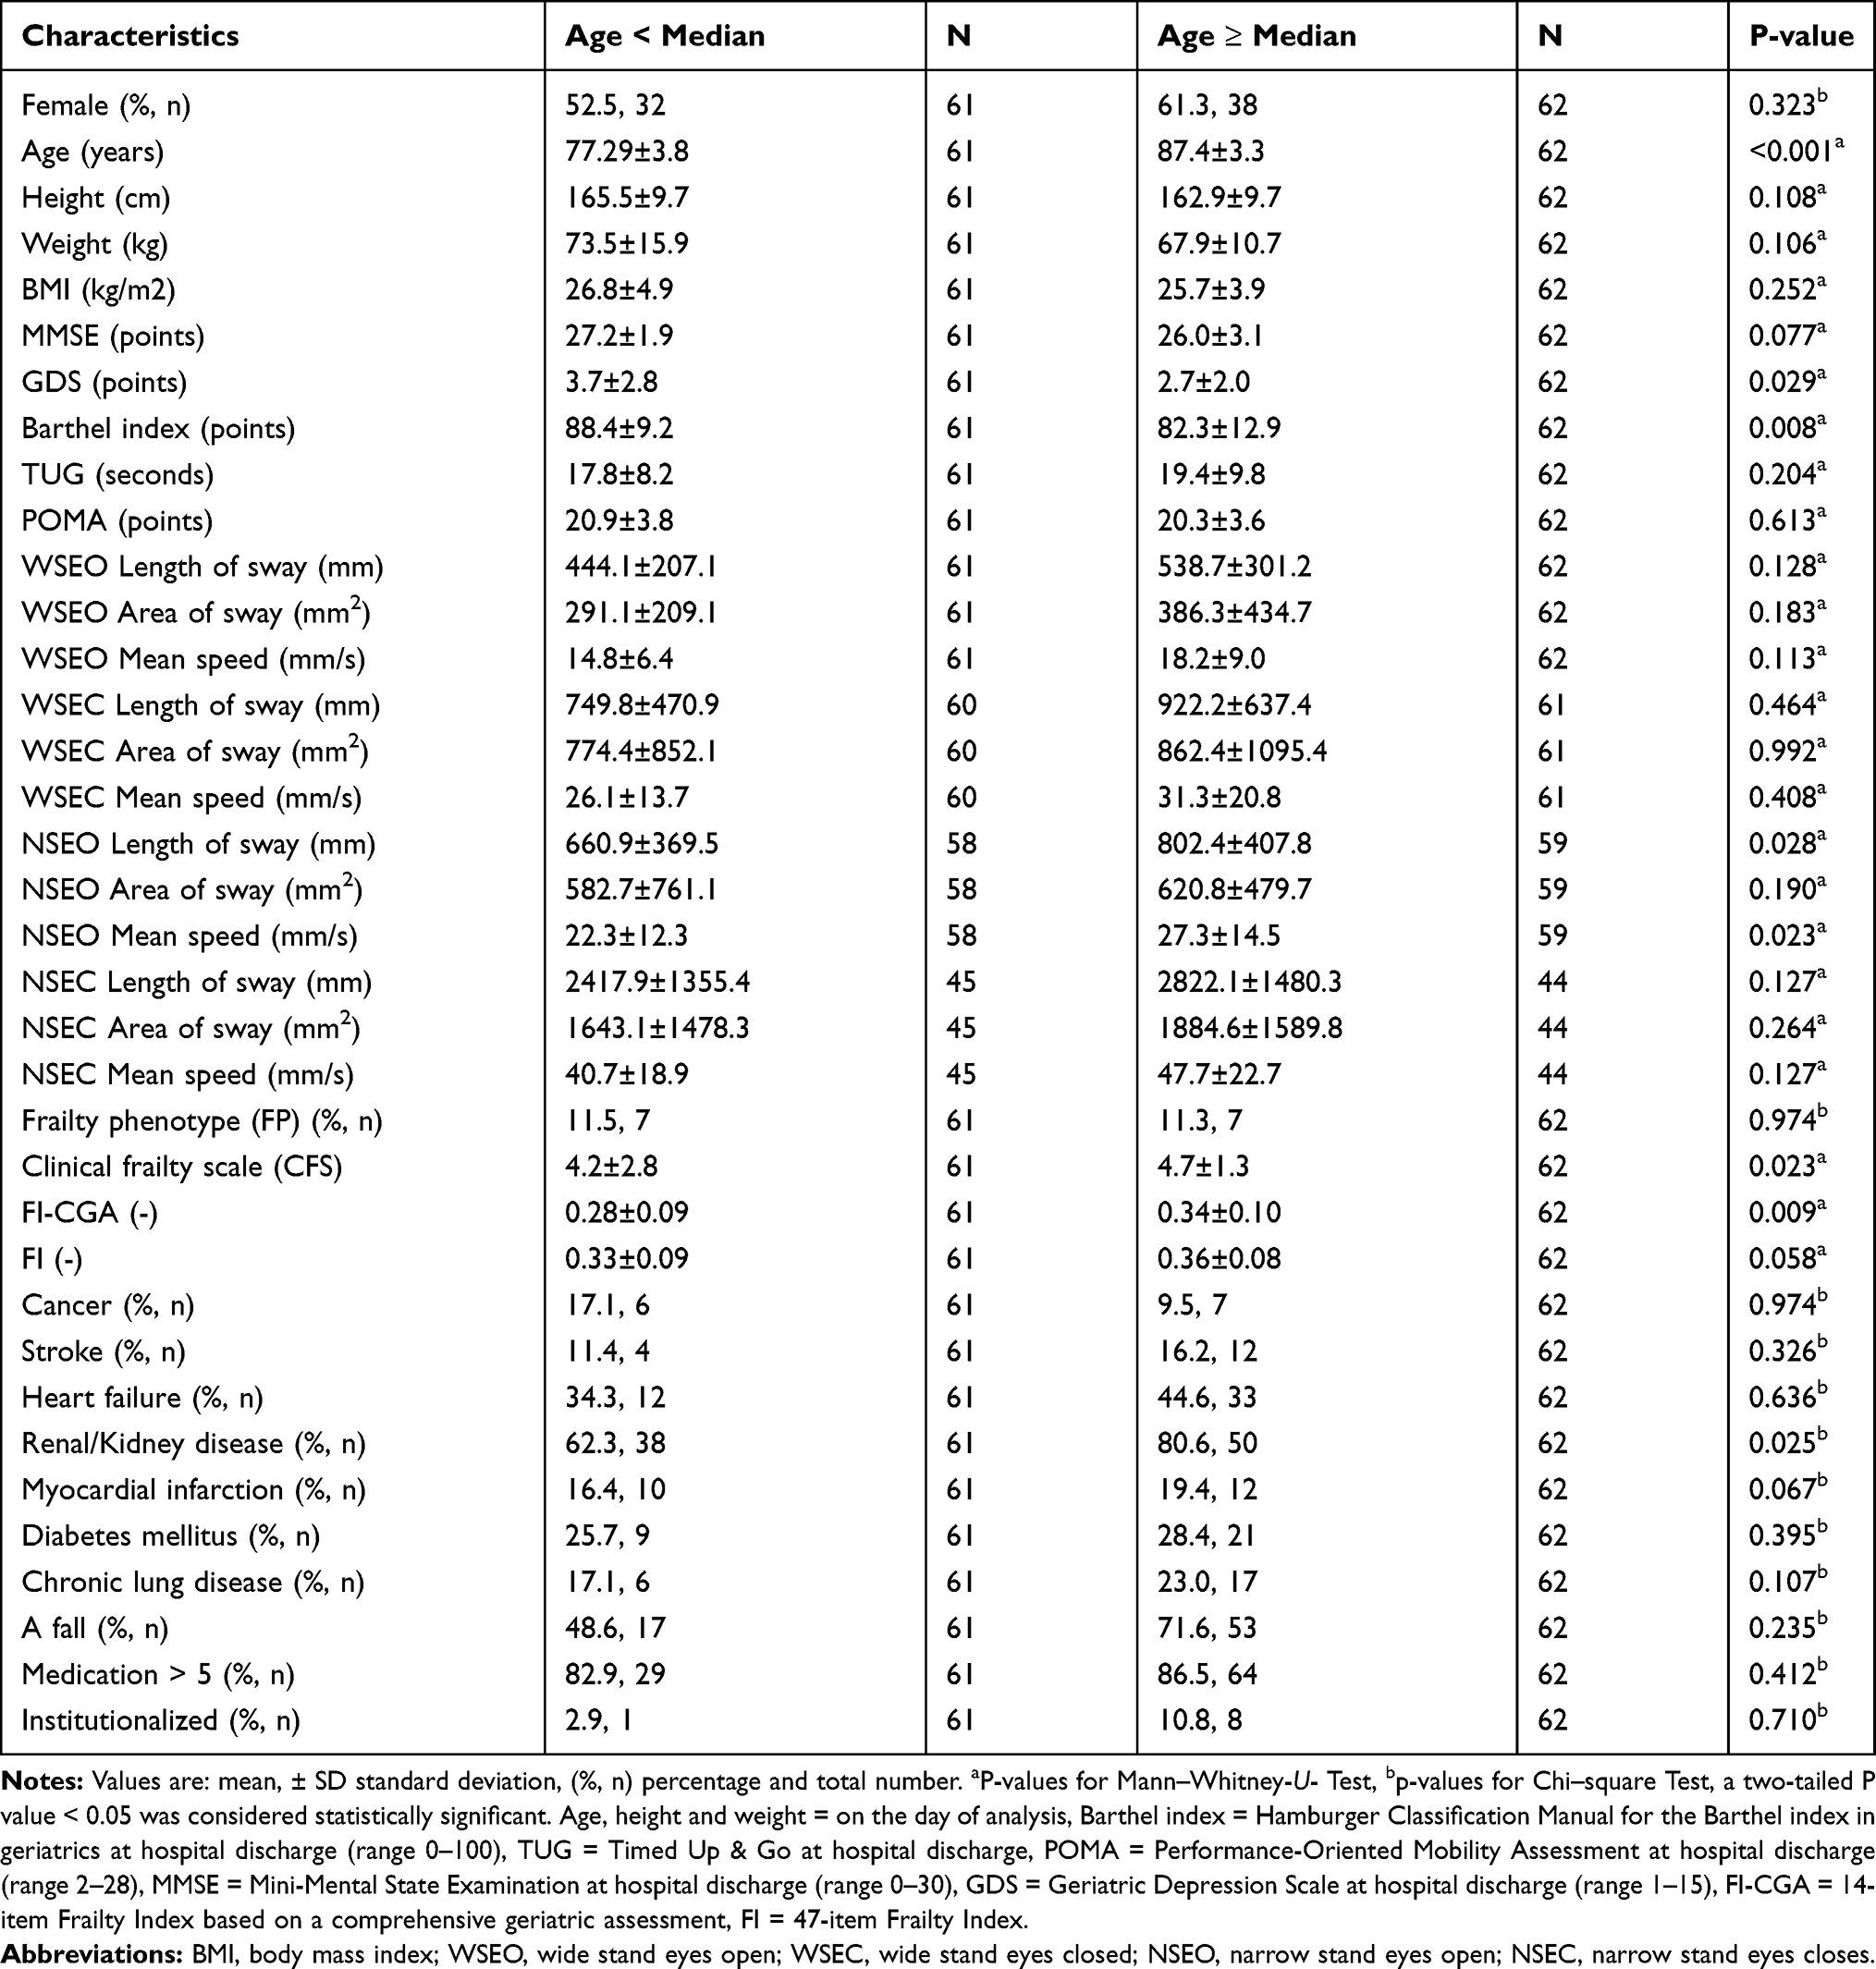 |
Table 1 Characteristics of the Patients Stratified into a Younger and an Older Group According to the Median Age of the Patients of 82.98 Years |
Completion Rate for Force Plate Measurements Under the Conditions Normal Standing and Narrow Standing with Eyes Open and Closed
The examination task WSEO was successfully completed by all participating patients. Due to the increased demands and the associated discontinuation rate, the data for three (2.4%), six (4.9%), and 43 (35%) patients from WSEC, NSEO, and NSEC could not be included in the calculations.
Linkage/Association of Postural Sway (CoP) Parameters and Frailty Status or Frailty Severity Classified According to the Four Major Measures of Frailty for the Study Participants
Associations of CoP parameters and frailty status or frailty severity with respect to the various frailty measuring instruments are shown in Tables 2–5 and Figures 1–4. WSEO – length of sway (FP, CFS and FI-CGA), – area of sway (FI-CGA), – mean speed (FP, CFS and FI-CGA); WSEC –length of sway (FI-CGA and FI); NSEO – length of sway (FP, CFS and FI), – area of sway (FI), – mean speed (CFS and FI); NSEC – length of sway (FI), – area of sway (FI), – mean speed (FI) were associated with the frailty status of the study participants according to the categories used in the four different frailty instruments (Tables 2–5 and Figures 1–4).
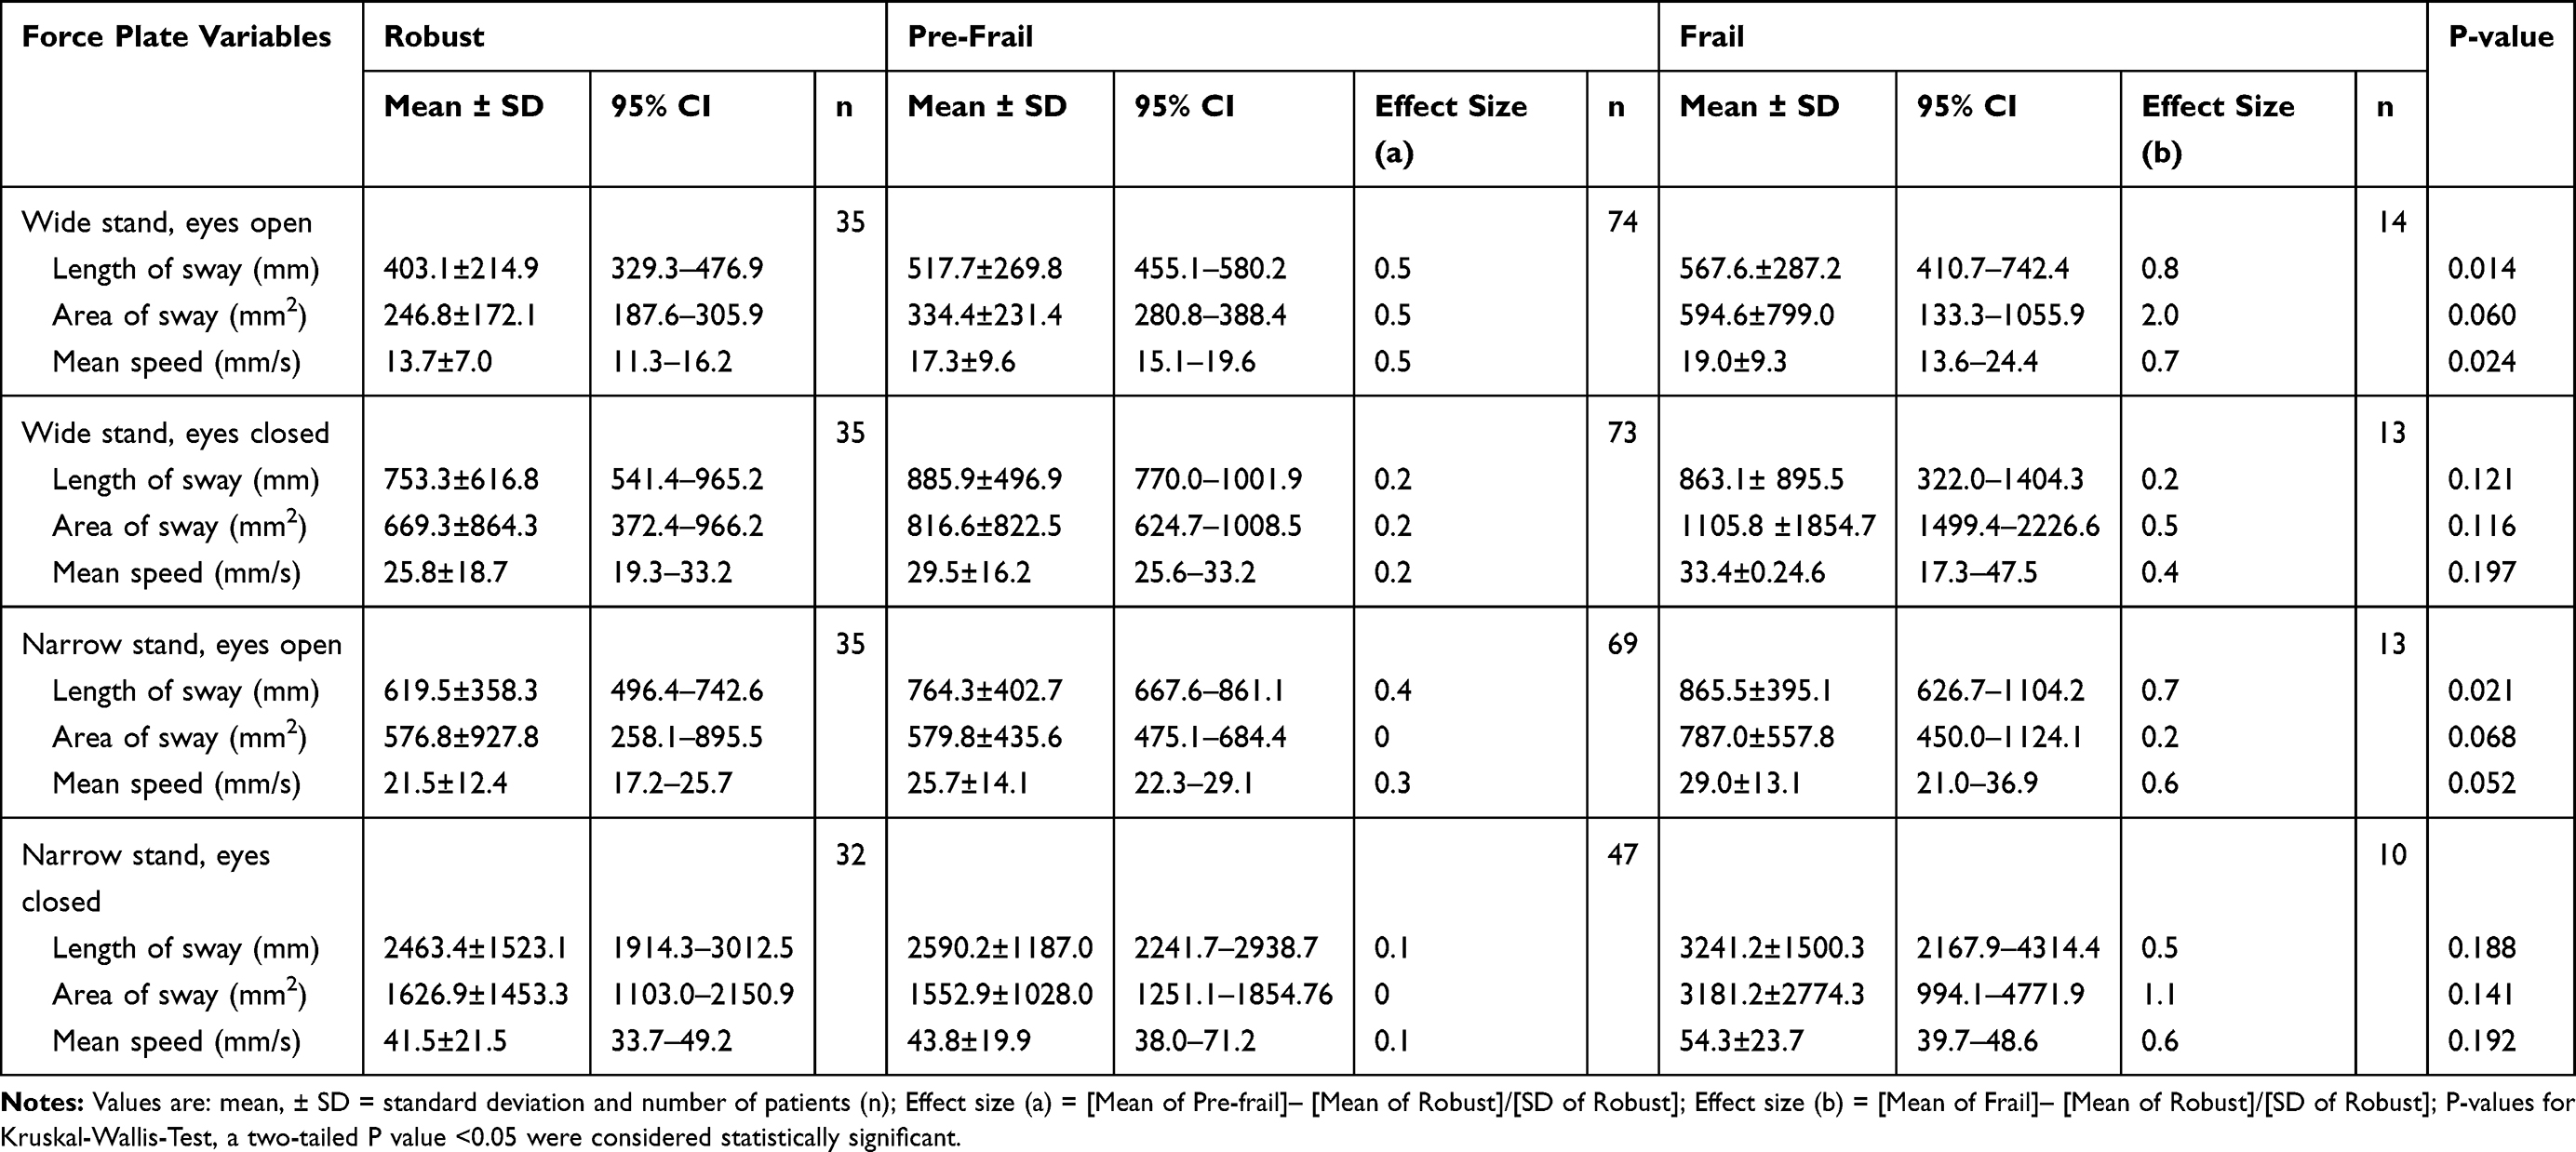 |
Table 2 Force Plate Variables and the Frailty Phenotype (FP) |
 |
Table 3 Force Plate Variables and the Clinical Frailty Scale (CFS) |
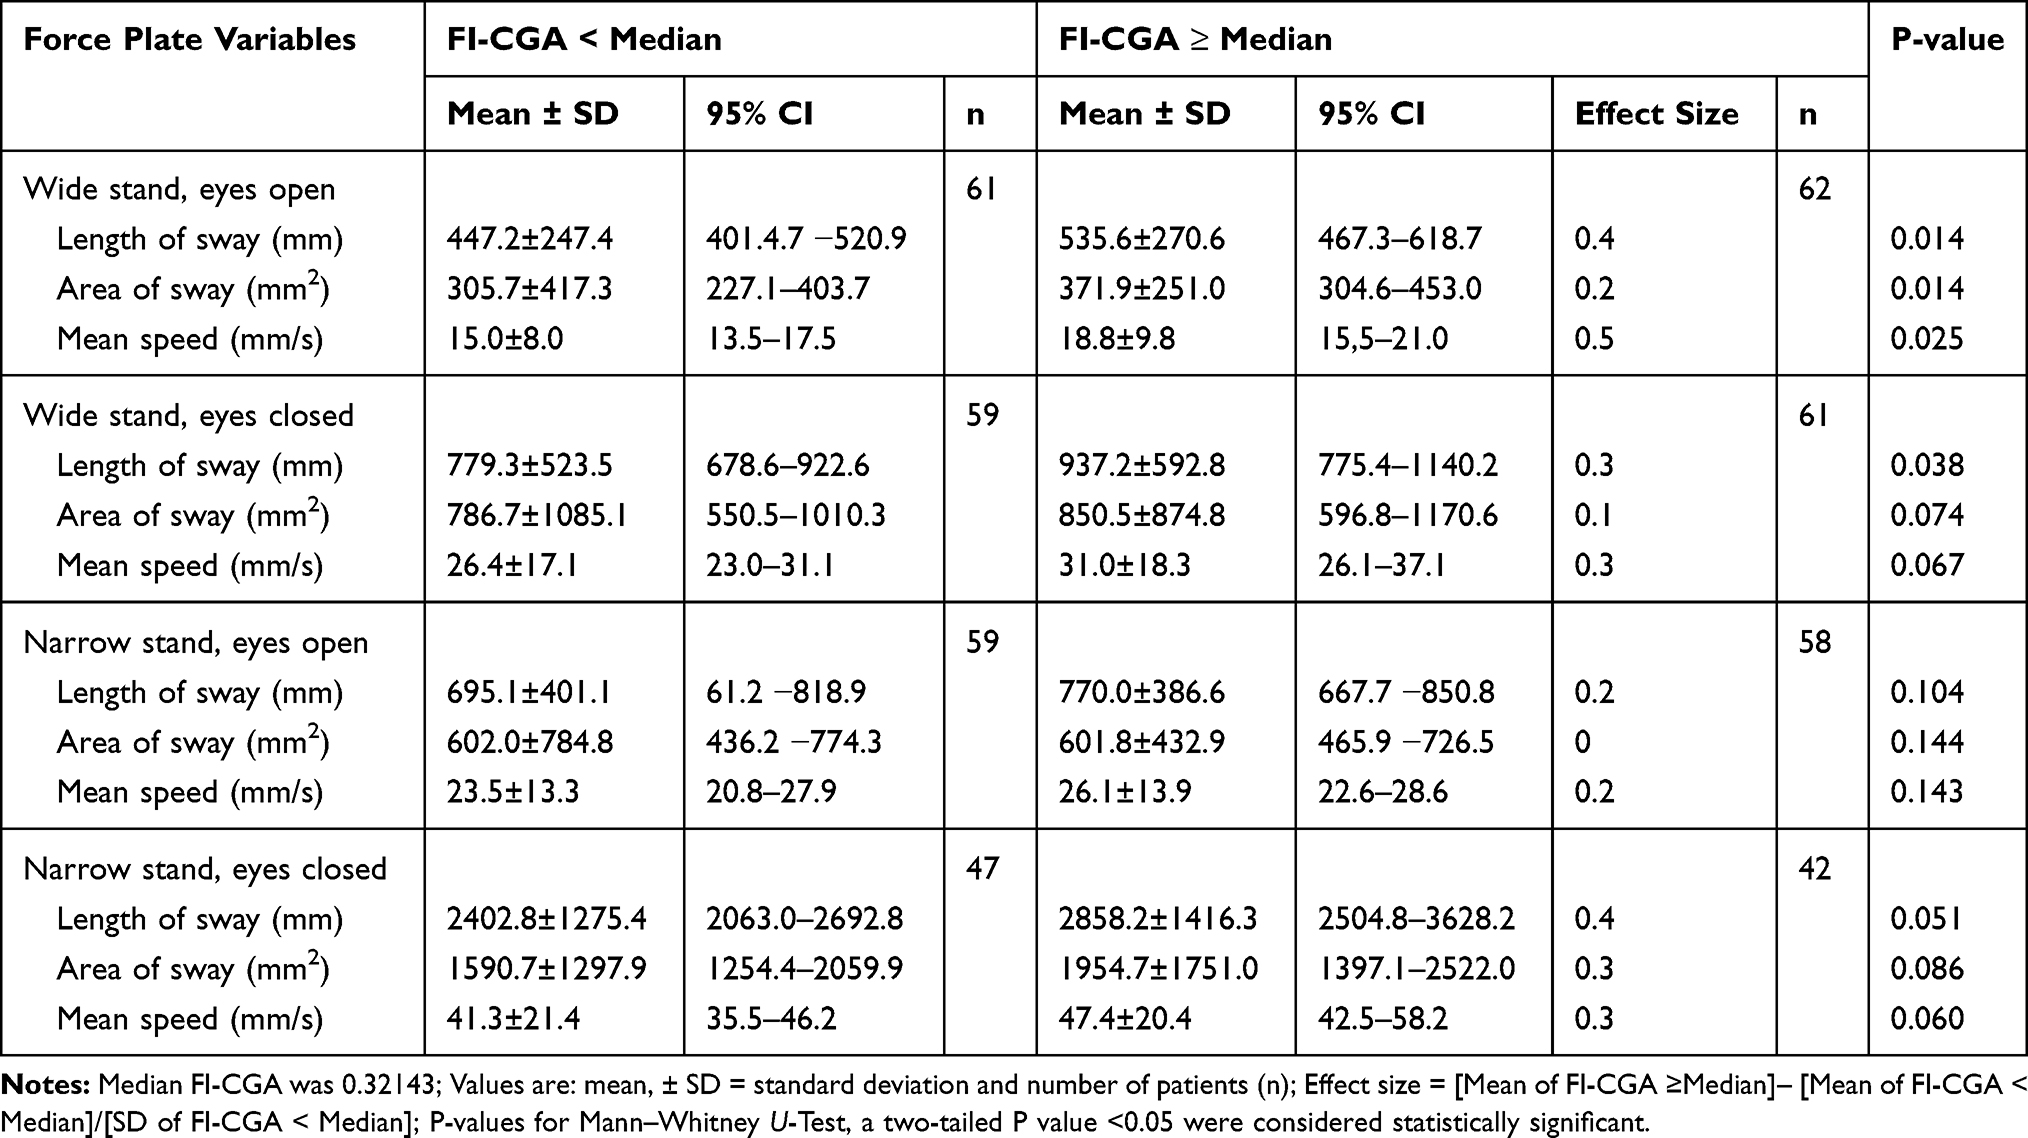 |
Table 4 Force Plate Variables and the 14-Item Frailty Index Based on a Comprehensive Geriatricassessment (FI-CGA) |
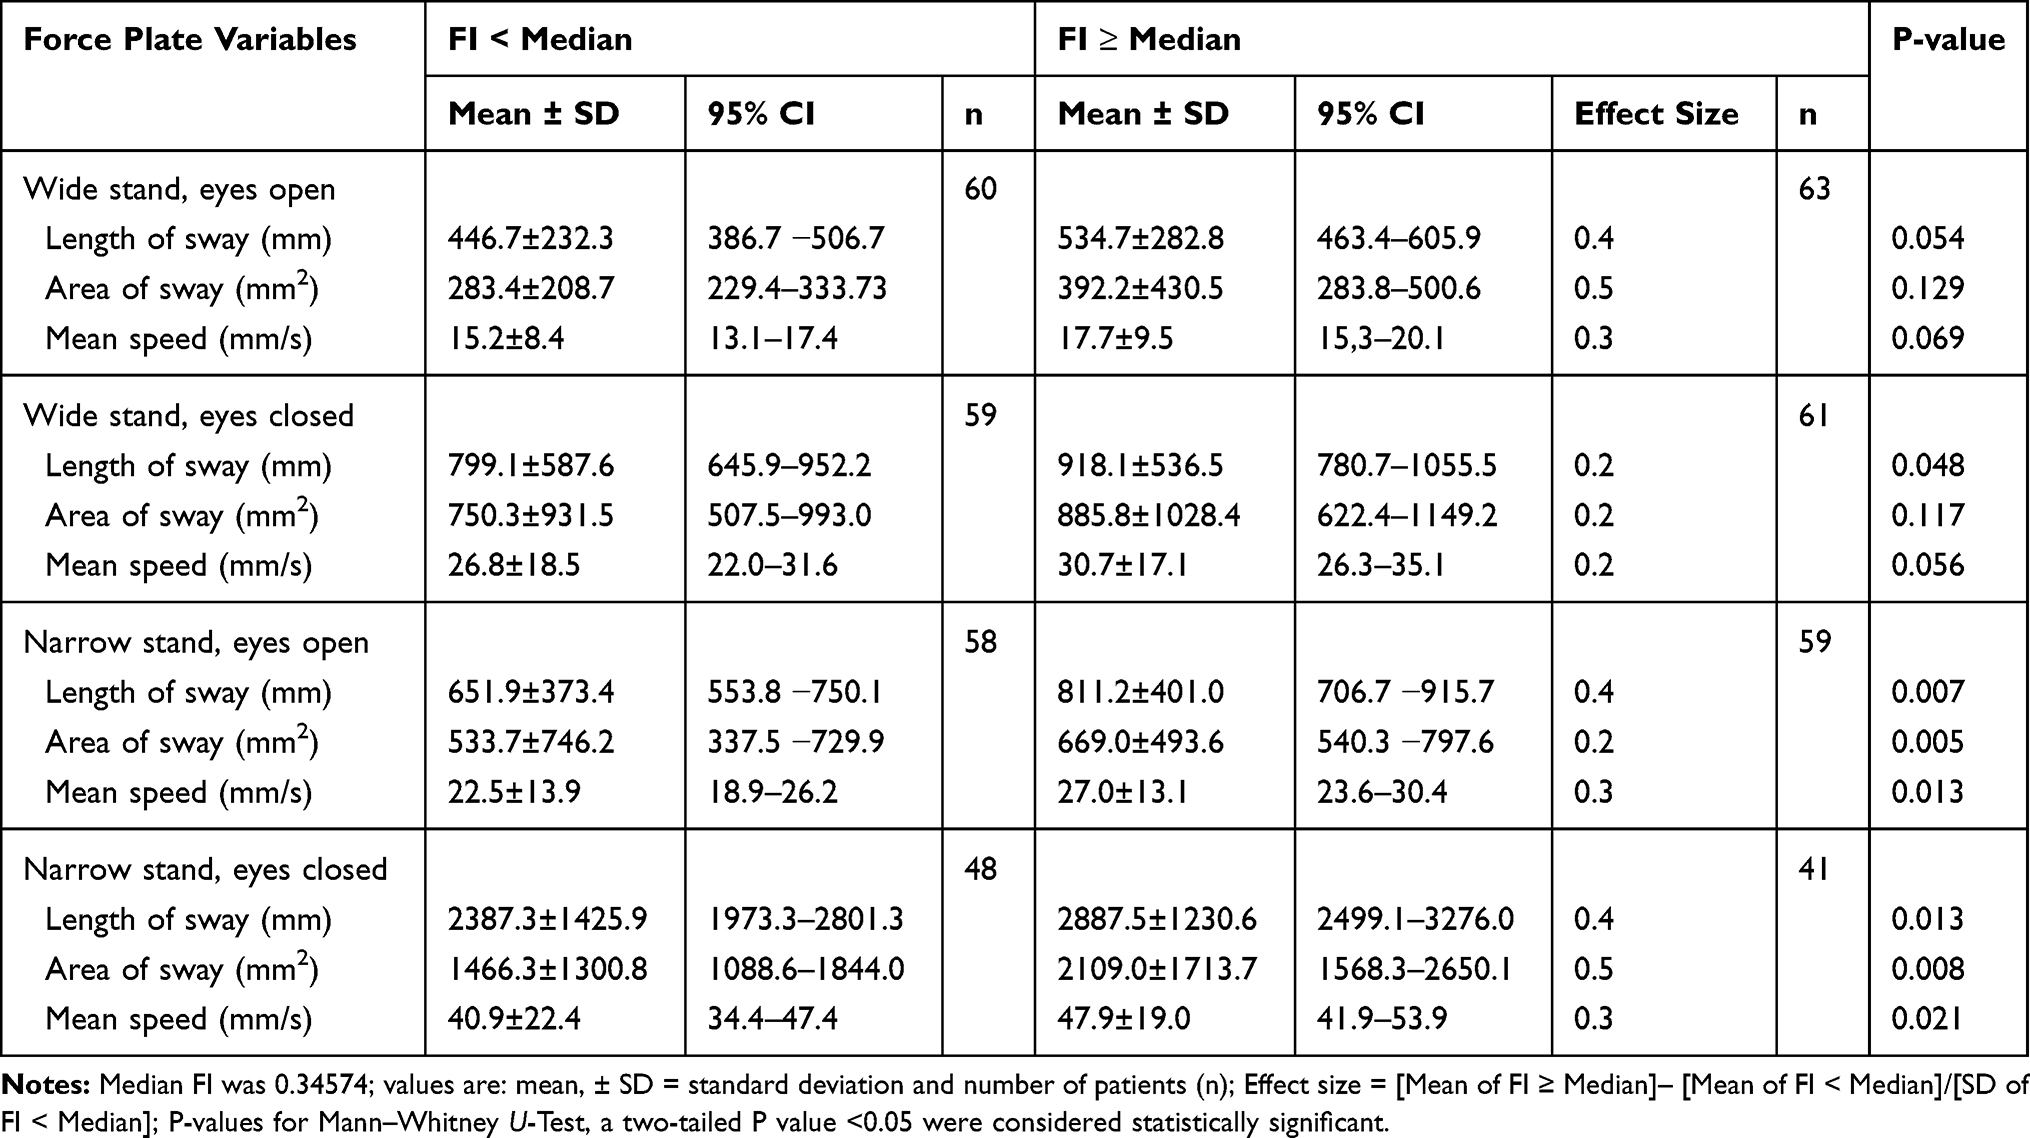 |
Table 5 Force Plate Variables and the Frailty Index (FI) |
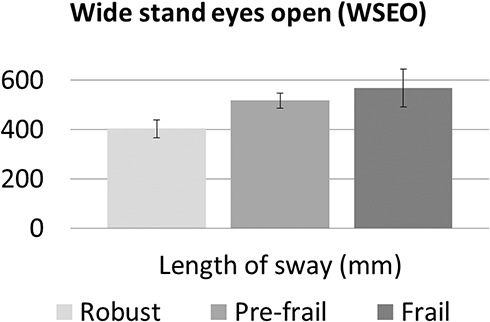 |
Figure 1 Association between length of sway during the task wide stand eyes open (WSEO) and frailty status according to the frailty phenotype (P = 0.014). |
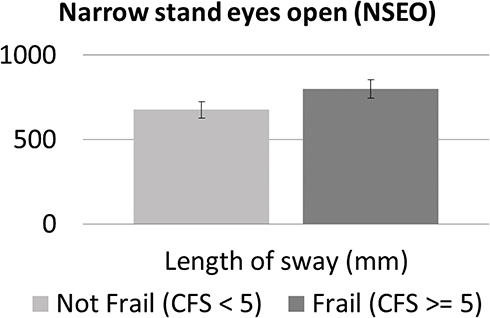 |
Figure 2 Association between length of sway during the task narrow stand eyes open (NSEO) and frailty status according to the clinical frailty scale (CFS) (P = 0.034). |
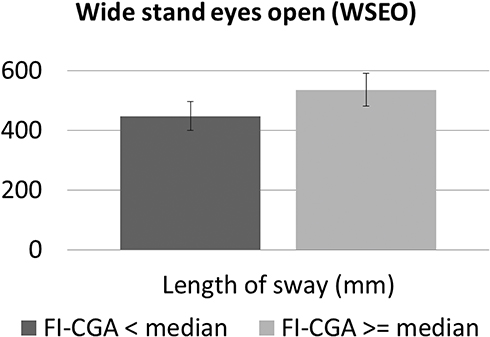 |
Figure 3 Association between length of sway during the task wide stand, eyes open (NSEO) and frailty status, according to the frailty index based on a comprehensive geriatric assessment (FI-CGA) (P = 0.014). |
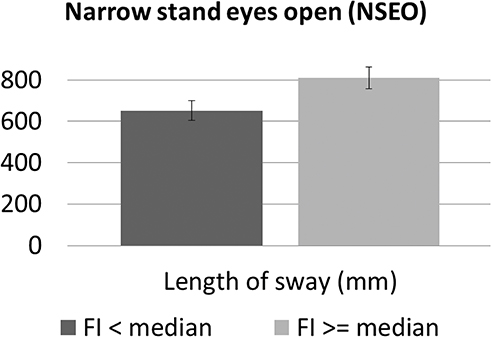 |
Figure 4 Association between length of sway during the task narrow stand, eyes open (NSEO) and frailty status according to the frailty index (FI) (P = 0.007). |
Correlation Analysis Between the Postural Sway (CoP) Parameters and the Frailty Status or Severity of Frailty of the Study Participants in Relation to the Four Different Major Frailty Measures (Full Scales)
The relationships between the CoP parameters and the frailty status of the study participants (full scales) are shown in Table 6. WSEO – length of sway (FP, CFS, FI-CGA and FI), – area of sway (FP, CFS, FI-CGA and FI), – mean speed (FP, CFS, FI-CGA and FI); WSEC – length of sway (FP, FI-CGA and FI), – area of sway (FP, FI-CGA and FI), – mean speed (FI-CGA and FI); NSEO – length of sway (FP, FI-CGA and FI), – area of sway (FP, CFS, FI-CGA and FI), – mean speed (FP, CFS, FI-CGA and FI); NSEC – length of sway (FI-CGA), – area of sway (FI-CGA), – mean speed (FI-CGA) were related to the frailty status of the study participants, in relation to the categories of the four different frailty measurement instruments (Table 6).
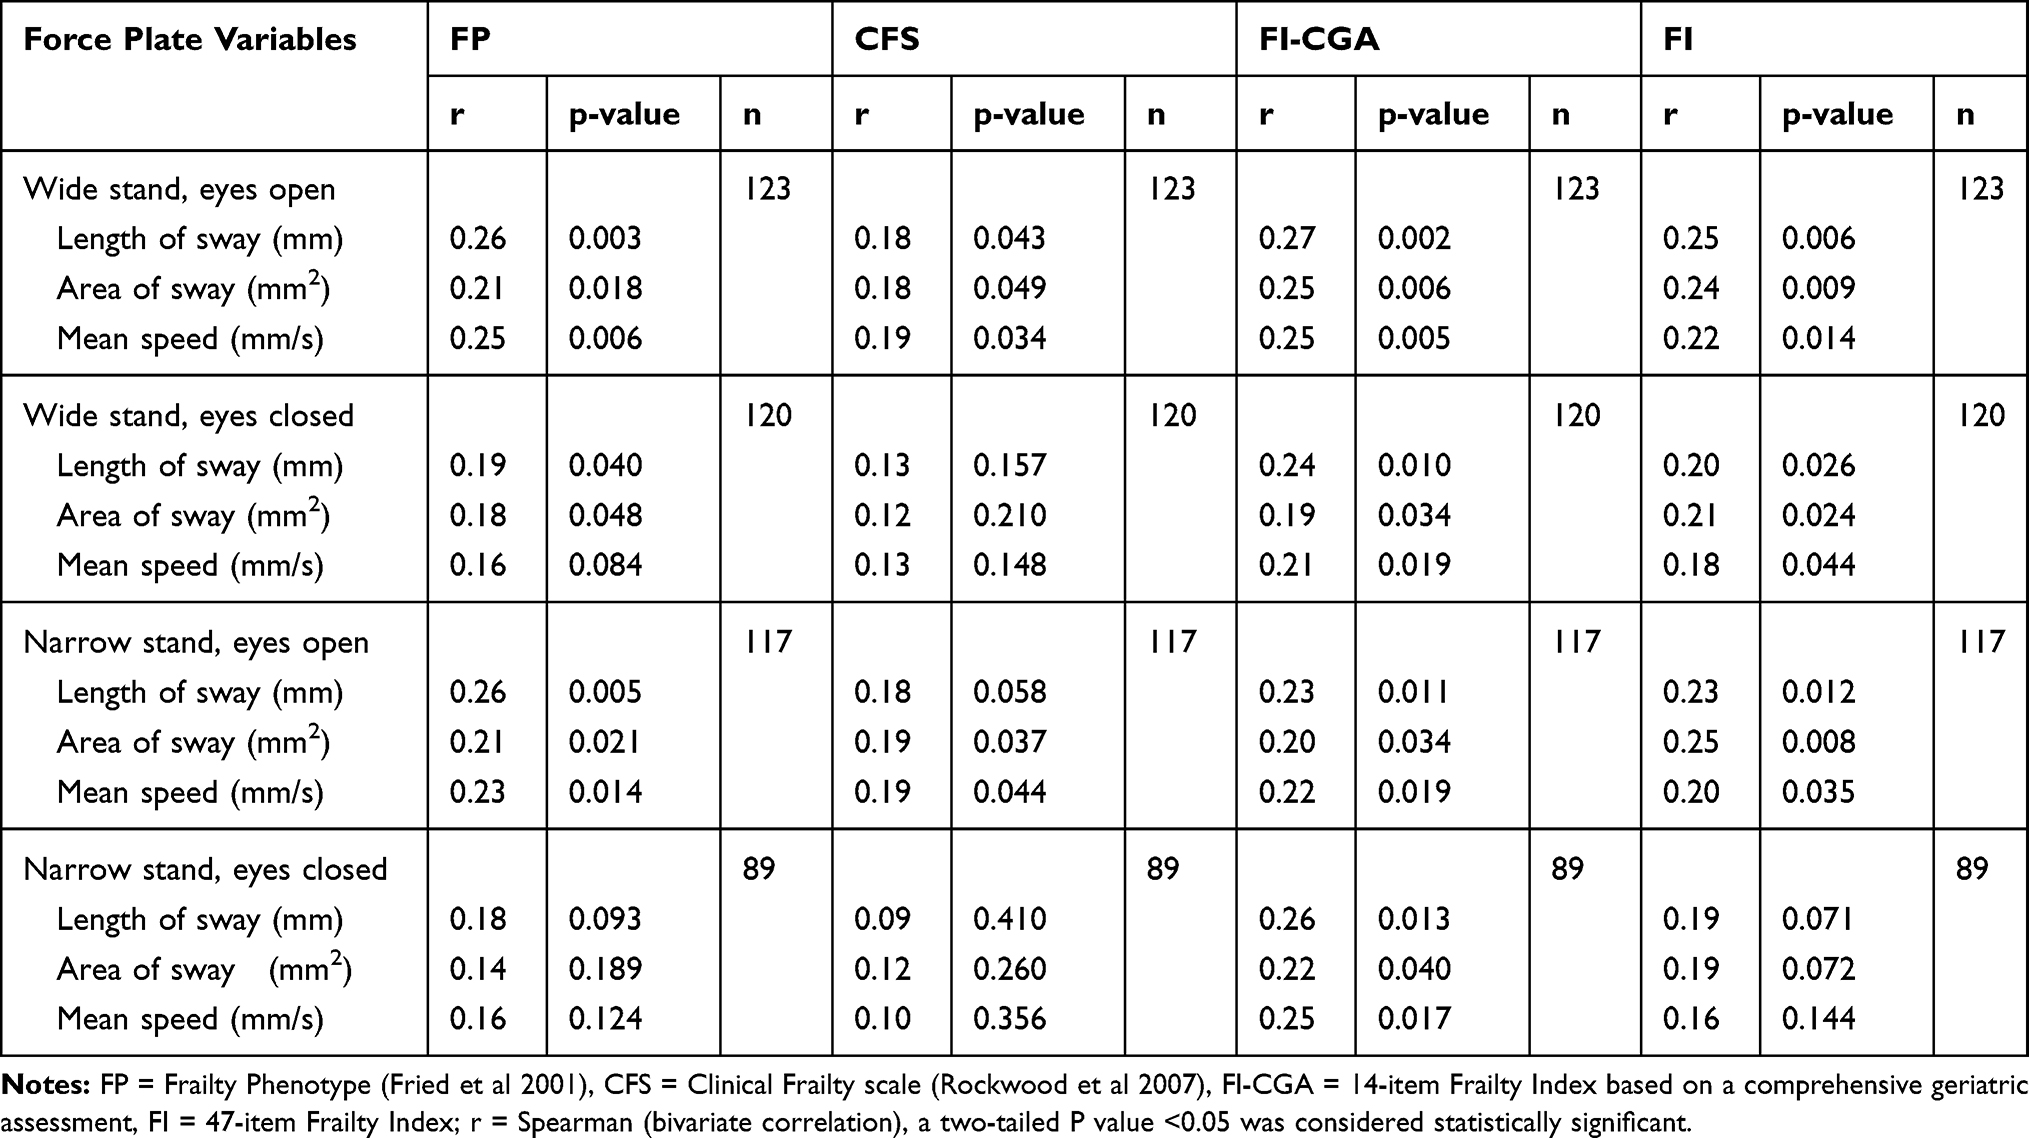 |
Table 6 Correlation Analysis Between Force Plate Variables and the Four Different Frailty Instruments |
Associations of Postural Sway (CoP) Parameters and Risk Factors for Frailty for the Study Participants
Associations between CoP parameters and risk factors in relation to the frailty status of our participants are shown in Tables 7 and 8. WSEO – length of sway (MMSE ≤ 23 points, Barthel index <100 points and TUG < 10 s, abnormal muscle strength and visus), – area of sway (Barthel index <100 points, abnormal muscle strength and visus), – mean speed (MMSE ≤ 23 points, Barthel index <100 points, and history of a fall, abnormal muscle strength and visus); WSEC –length of sway (MMSE ≤ 23 points, Barthel index <100 points, CIRS < 11 points, history of a fall, a history of diabetes mellitus, and abnormal muscle strength), – area of sway (MMSE ≤ 23 points, CIRS < 11 points, history of a fall, a history of diabetes mellitus and abnormal muscle strength), – mean speed (MMSE ≤ 23 points, Barthel index <100 points, CIRS < 11 points, a history of a fall, a history of diabetes mellitus, abnormal muscle strength and visus); NSEO – length of sway (MMSE ≤ 23 points, a history of a fall, abnormal muscle strength and visus), – area of sway (a history of a fall, abnormal muscle strength and visus), – mean speed (MMSE ≤ 23 points, a history of a fall, abnormal muscle strength and visus); NSEC – length of sway (MMSE ≤ 23 points, a history of a fall, a history of diabetes mellitus, abnormal muscle strength and visus), – area of sway (history of diabetes mellitus), – mean speed (MMSE ≤ 23 points, a history of a fall, a history of diabetes mellitus, abnormal muscle strength and visus) were associated with individual frailty risk factors for frailty.
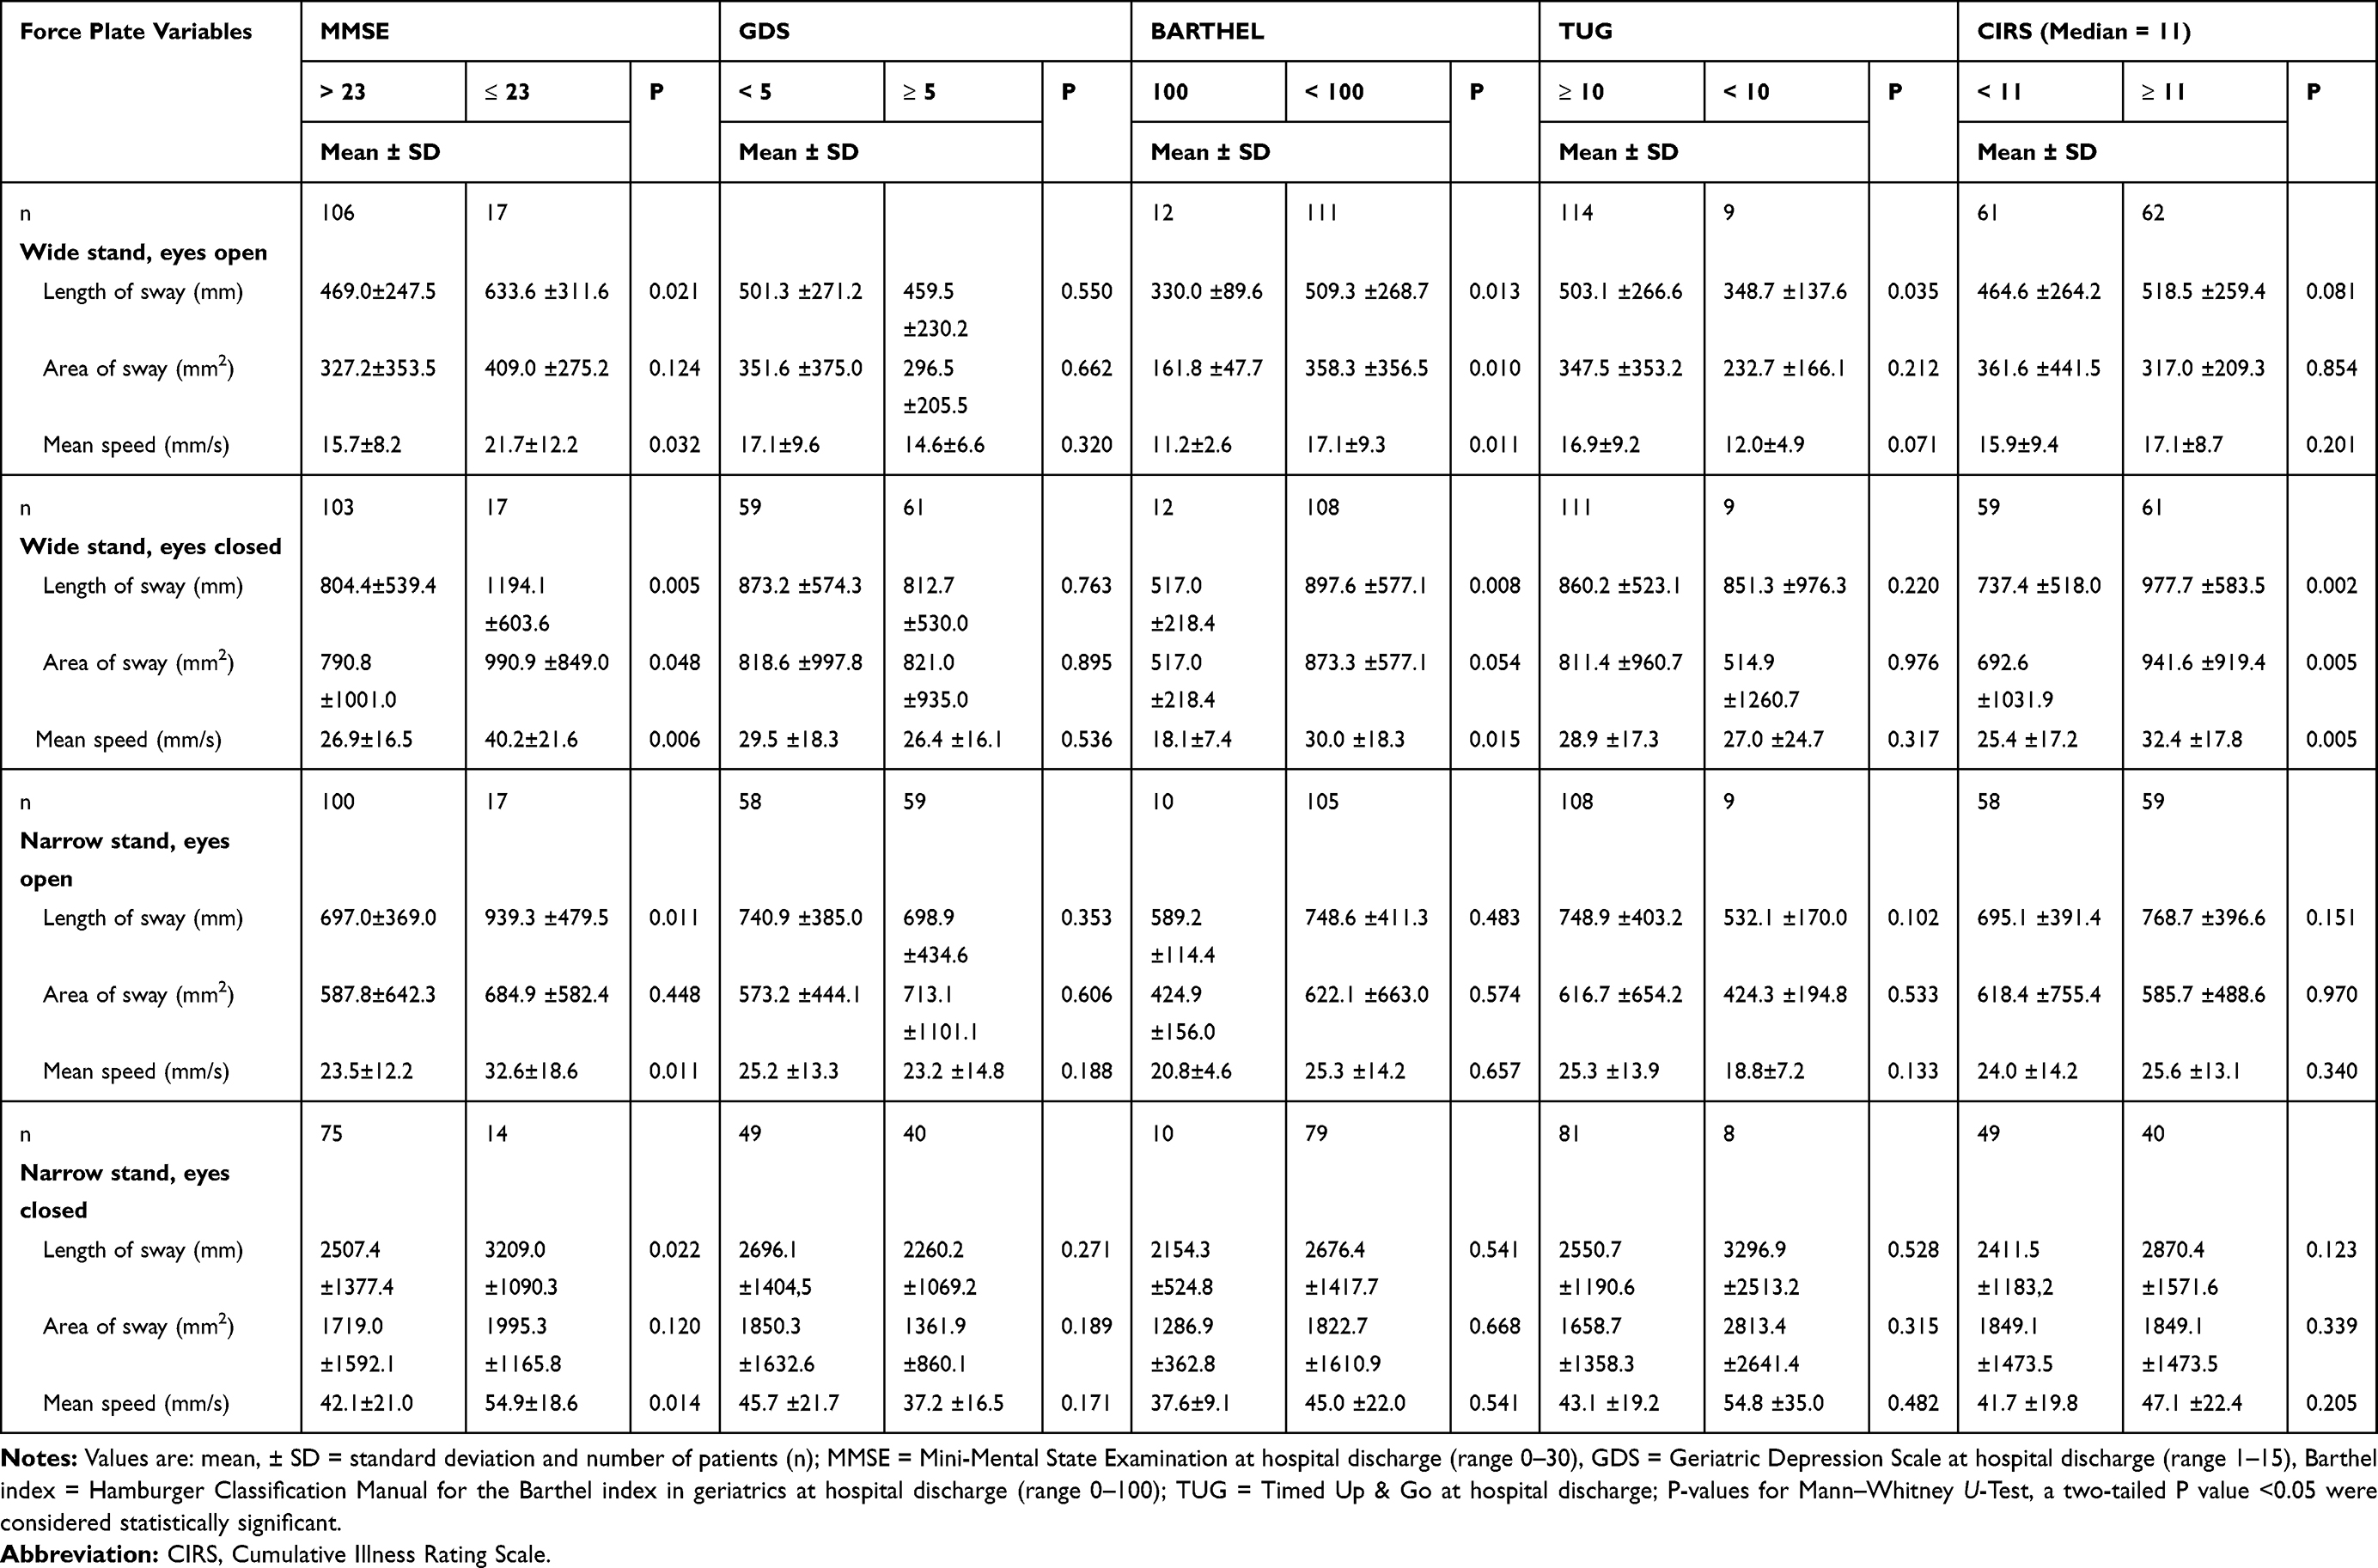 |
Table 7 Force Plate Variables and Risk Factors for Frailty Part 1 |
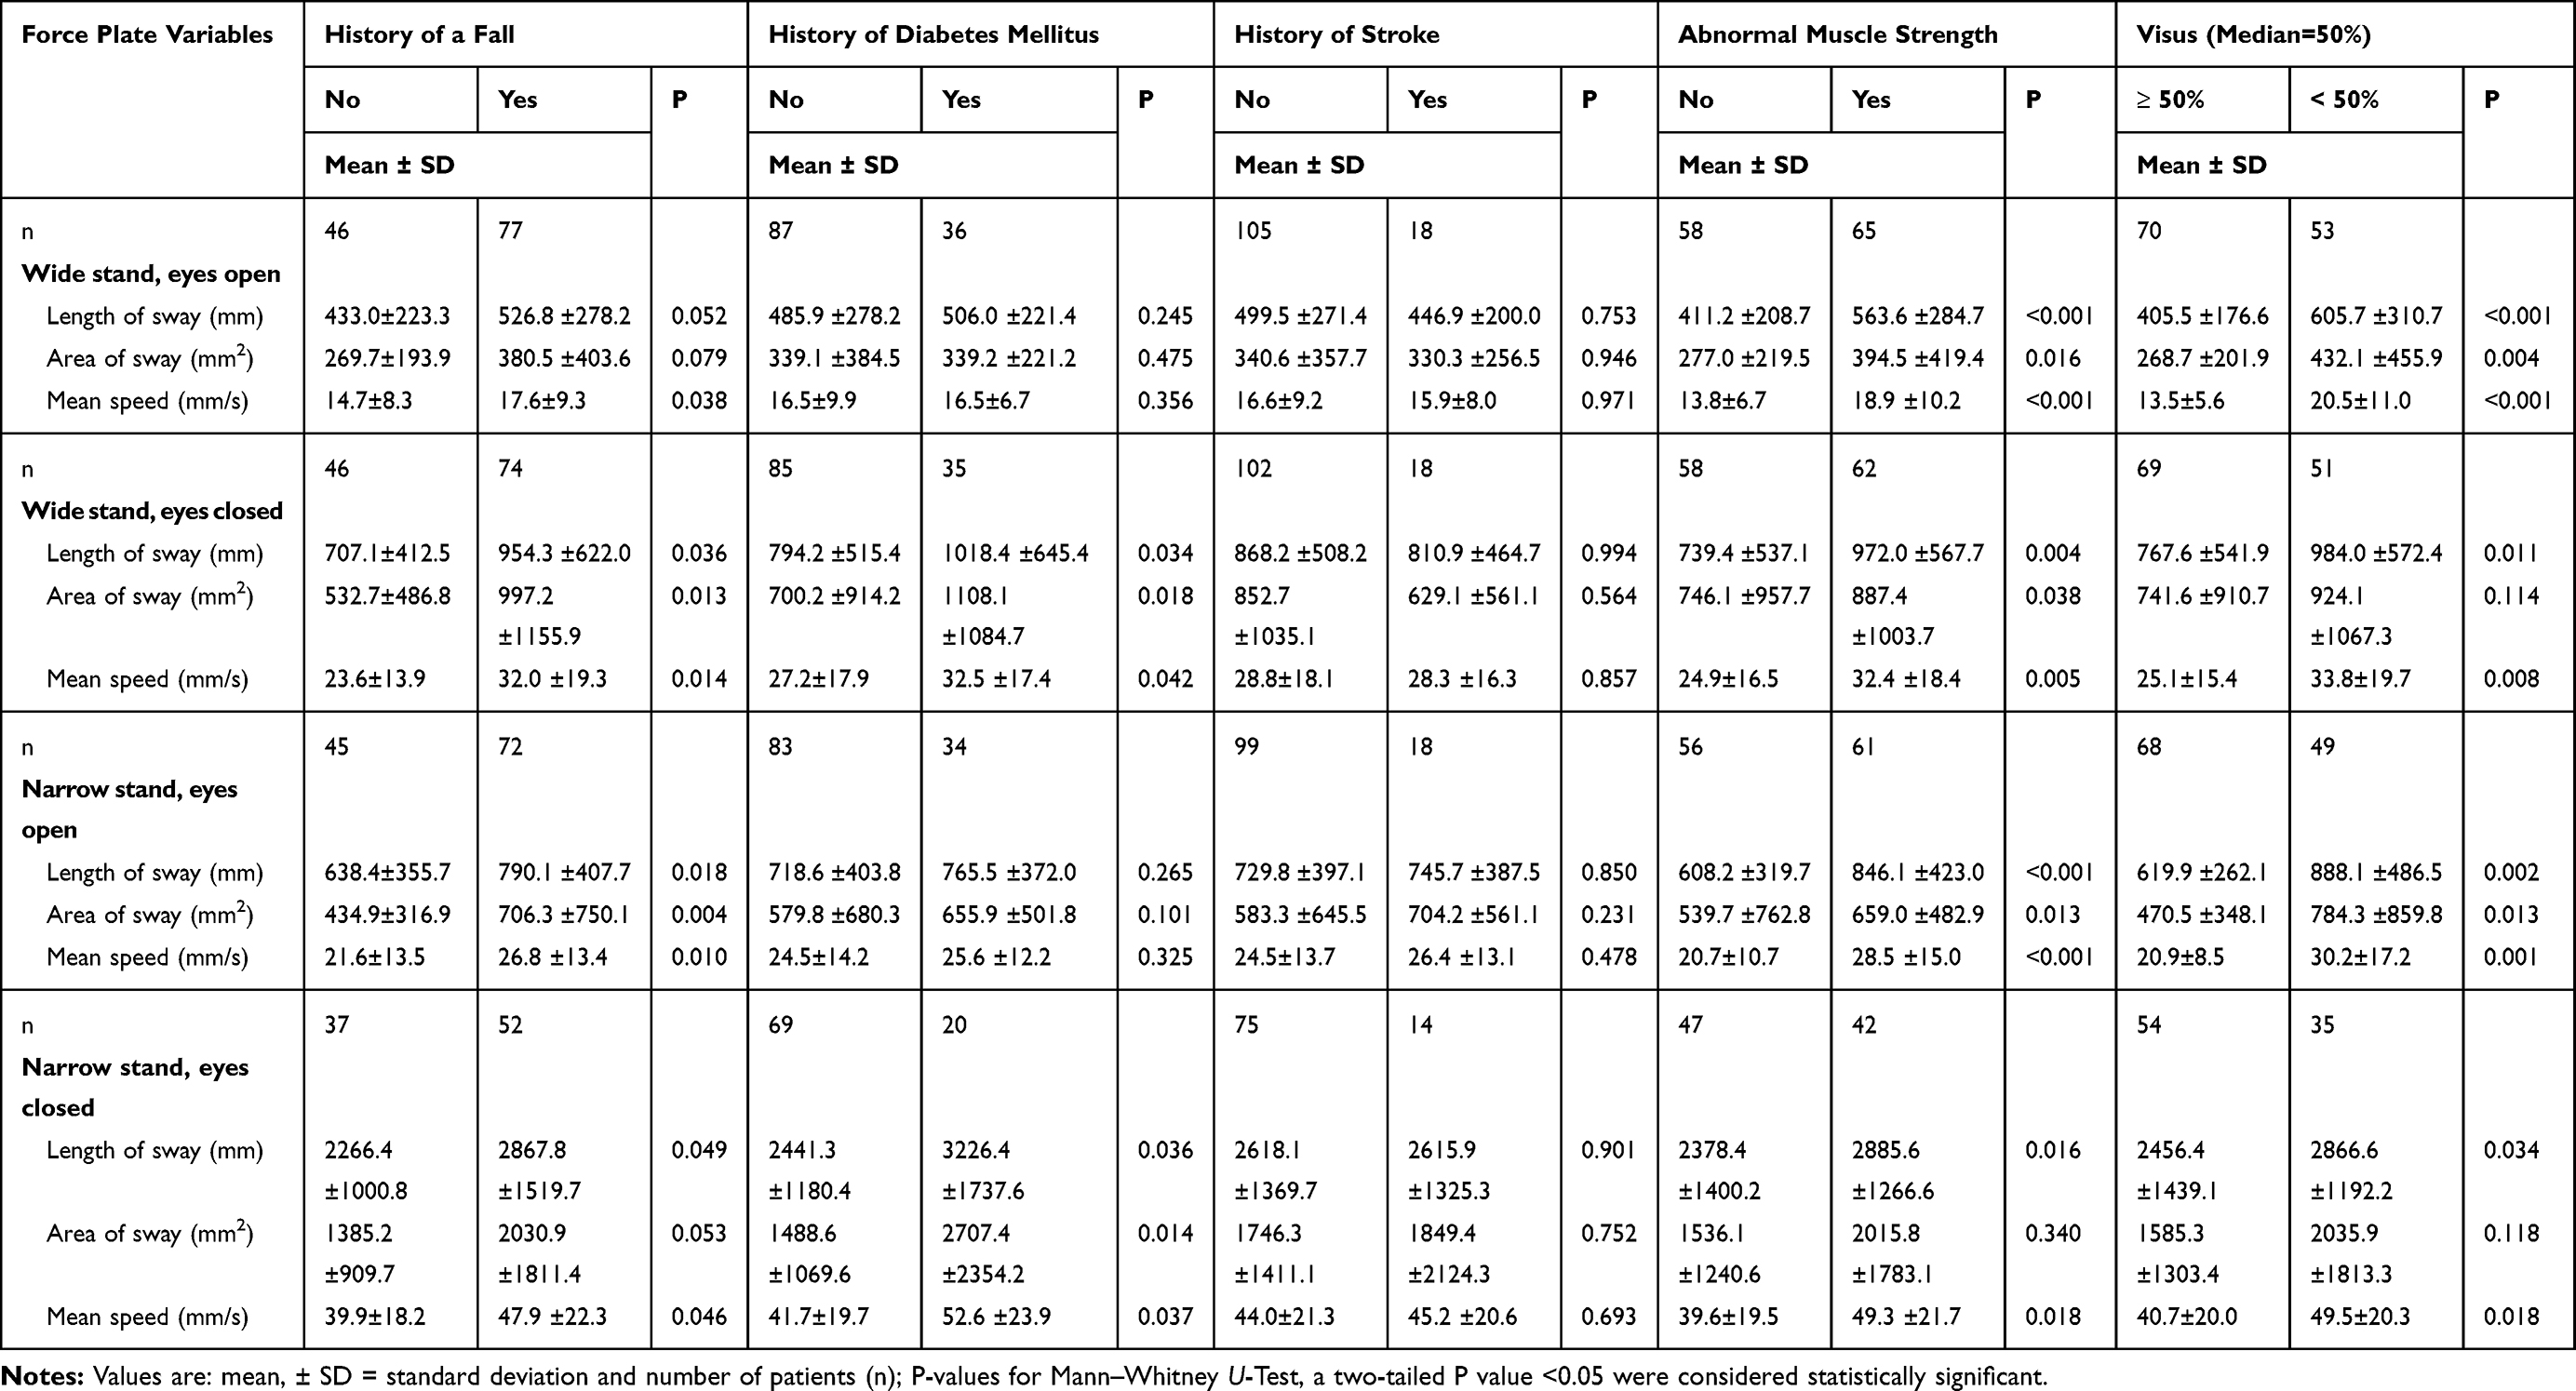 |
Table 8 Force Plate Variables and Risk Factors for Frailty Part 2 |
Correlation Analysis Between Postural Sway (CoP) and Risk Factors for Frailty (Full Scales) of the Study Participants
The relationships between the CoP parameters and the risk factors for the study participants for Frailty are shown in Table 9. WSEO – length of sway (MMSE, Barthel index, CIRS and visus), – area of sway (Barthel index and visus), – mean speed (MMSE, Barthel index, CIRS and visus); WSEC – length of sway (MMSE and CIRS), – area of sway (CIRS), – mean speed (MMSE and CIRS); NSEO – length of sway (MMSE and visus), – area of sway (TUG and visus), – mean speed (MMSE and visus); NSEC – length of sway (MMSE), – mean speed (MMSE) but not NSEC – area of sway was related with individual risk factors for frailty.
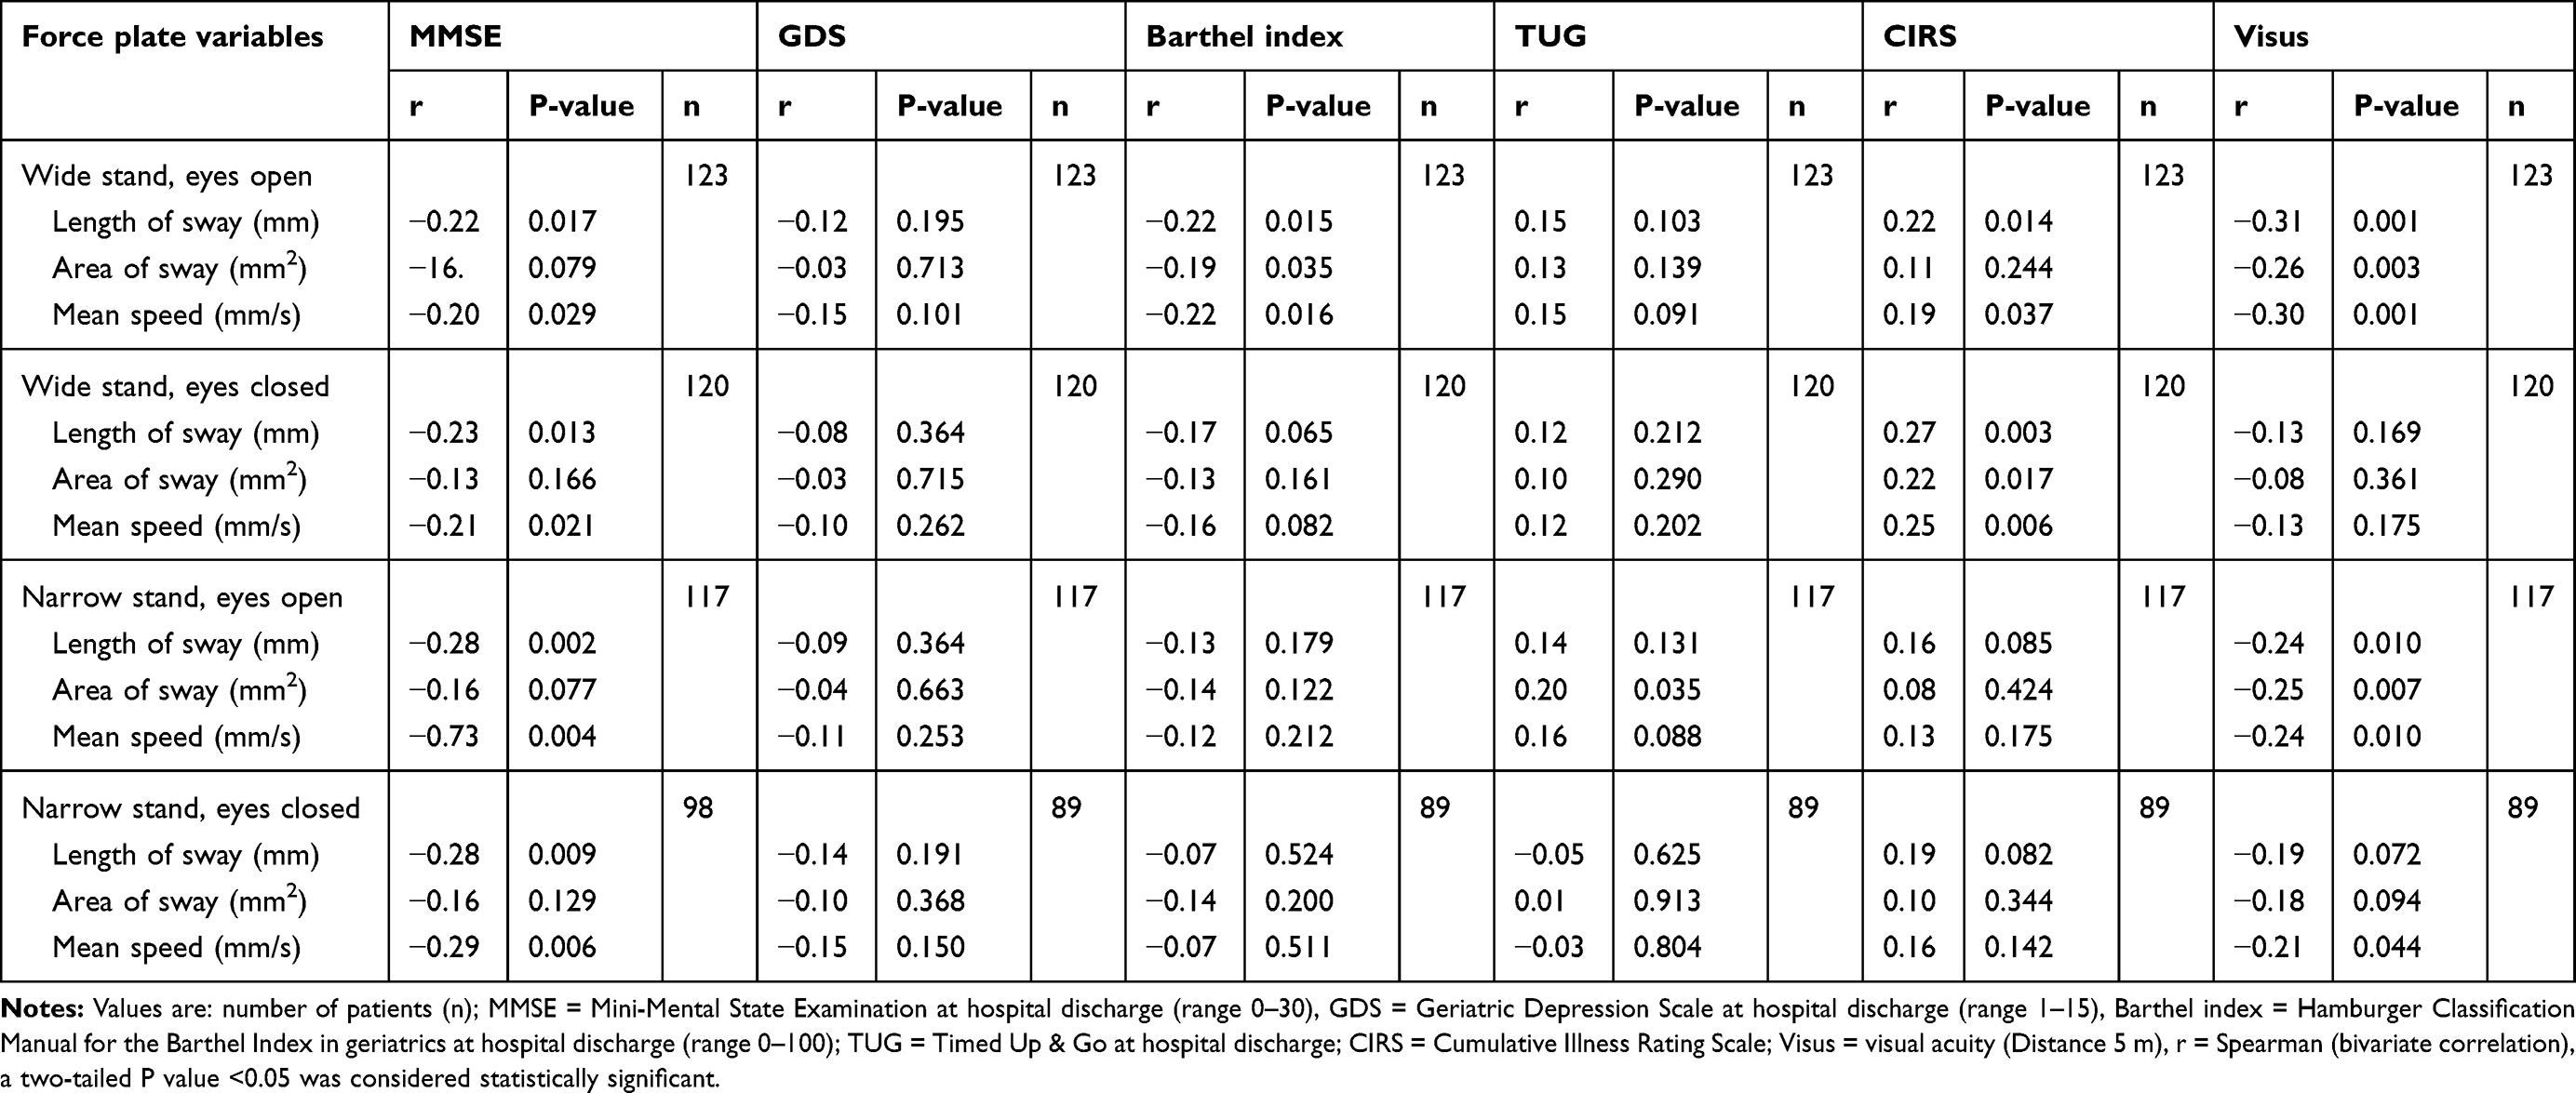 |
Table 9 Correlation Between Force Plate Variables and Risk Factors for Frailty |
Discussion
The results of our study give an insight into the parameters of postural performance measures and sway characteristics, i.e., the variation in CoP, including length of sway, area of sway, and mean speed of sway during four different positions/tasks, i.e., WSEO, WSEC, NSEO, and NSEC, in hospitalized older patients who were classified as “non-frail” and “frail”. We found that several postural sway characteristics were associated with and/or related to the frailty status and/or severity of individual frailty instruments assessed in this study. It should be emphasized that WSEO length of sway, WSEO area of sway, WSEO mean speed, NSEO area of sway, and NSEO mean speed were associated with and/or related to the frailty status and/or frailty severity in all four frailty instruments considered. Moreover, we found that WSEO length of sway, WSEO area of sway, WSEO mean speed, WSEC length of sway, WSEC area of sway, WSEC mean speed, NSEO length of sway, NSEO area of sway, NSEO mean speed, NSEC length of sway, NSEC area of sway, and NSEC mean speed were associated with or related to the quality of selected individual risk factors for frailty. This also included cognitive decline, affective alterations, mobility impairments, difficulties within activities of daily living, co-morbidity burden, a history of a fall, a history of diabetes mellitus, abnormal muscle strength, and reduced visual acuity. Based on these results, we put forward evidence that changes in postural sway parameters are associated with frailty status and/or severity and individual risk factors for frailty in the patients included in the population under study.
It should be noted that, in our study, the pattern of alterations postural sway measured in frail persons was not identical amongst the four major, different frailty measures. Certainly, the four different frailty measures employed potentially identify different individuals as being frail. The frailty phenotype is based on five physical criteria.3 In contrast, the other frailty measures also incorporated dimensions of function and co-morbidity. The Clinical Frailty Scale embodies the criteria of function, central nervous system impairment, co-morbidity, and judgment in terms of residual life expectancy. As it contains multiple items, the frailty index represents an arithmetical model, independent of pre-set items.59 Compared to the frailty index, the frailty index based on a comprehensive geriatric assessment approach, as used in our study, was founded on different domains of a standardized, comprehensive geriatric assessment and comorbidity burden rather than multiple individual items.14,15 But, there is no gold standard screening and/or assessment tool for detecting frailty or degrees of frailty.8,9 Taking this into account, we evaluated the frailty status and degree of frailty of the patients by applying four different, major frailty instruments.
Other authors have previously reported on postural sway parameters and frailty status in older individuals.36,43–45 Kang et al44 found that the CoP length of sway was higher in prefrail and frail individuals compared to robust older adults from 550 older volunteers (mean age 77.9 years). Toosizadeh et al43 showed a possible prediction of frail and pre-frail when compared to non-frail, using sensors worn on the body, in a Romberg balance assessment of 15 s with eyes open and eyes shut in 122 older adults with no major mobility disorders (age >65 years). Moreover, the aforementioned study group reported a higher prediction of frail and pre-frail status (Fried’s criteria) under eyes closed conditions. In contrast, Marques et al45 reported for 60 older adults who were divided into three groups of 20 (non-frail, pre-frail and frail), lower scores for frail in all sections and total score of the Balance Evaluation Systems Test (BESTest). At the same time, force plate measurements showed similar mean oscillation values in all three groups, indicating similar CoP behavior.45 While in subjects using sensors attached to the lower back during a 25 m walk to analyze postural sway, Thiede et al36 observed no significant differences in balance parameters based on the frailty phenotype of Fried3 in 17 participants (≥55 years) with peripheral artery disease.36 In contrast to the aforementioned studies, the patients in the study presented here were not only evaluated in relation to the frailty phenotype but, in addition, in terms of three other major frailty instruments, utilizing a different concept of frailty.
The association between postural sway changes and frailty status/severity, as well as risk factors for frailty in the study presented here and/or in previous studies by other authors,43,44 might be due to the effect of alterations in different bodily/organ systems in frail patients or individual, significant conditions that potentially impact on postural control. This might also explain the relatively low association as shown by a low correlation coefficient between frailty status/severity and CoP parameters in our study cohort. Clearly, our study cohort comprised older people with multiple morbidities and conditions that in addition to frailty each per se might impact on CoP parameters. In line with this, previous studies by other authors have found that frailty status or severity to be associated with changes in the neural and musculoskeletal systems, amongst others, that are critically involved in postural control.25,37,38,60,61
To the best of our knowledge, no other study, up until now, has provided evidence comparing postural sway parameters in relation to several different major measures of frailty, in parallel, in older individuals.
A limitation of this study is that we only included geriatric inpatients. Also, patients with an MMSE score of 20 or lower, impaired vision, or an (sub-) acute limiting disease were excluded. This means that several patients suffering from significant multi-morbidity or impairments, frequently treated and cared for at hospital geriatric wards, were excluded. Therefore, our findings may not be transferable to other patient groups or to clinical settings. As was noted, only three common measures of postural sway were analyzed. However, a more comprehensive analysis of postural sway parameters might more accurately represent “balance” which, in nature, is multifactorial. In spite of this, in order to prevent excessive stress being placed on the frail, older patients participating in the study, we chose a minimum of four trails. As previously reported by our study group4,51 and others,62 the operationalization of the individual phenotypic components used in our study differed slightly from the original operationalization by Fried et al.3 This was for practical reasons. Our operationalization was not dependent on gender, body size, or other variables. A different operationalization of the phenotypic components might have led to the identification of distinct patients in relation to the frailty status according to the frailty phenotype.62 A further limitation of this study is its cross-sectional design. Additional longitudinal studies are needed to evaluate the link between the observed postural sway parameters with frailty – status and degree.
In conclusion, the current study presents evidence that postural sway parameters are associated with frailty status and/or severity and individual risk factors for frailty in patients hospitalized on geriatric wards. We were able to identify several postural sway variables being altered in frail patients across four major, different frailty instruments and in patients showing individual risk factors for frailty. Despite an overlap in postural sway parameters across the various frailty instruments, the individual pattern of frailty-associated changes in postural sway parameters varied across the diverse frailty measures that identified different people as being frail.
Ethics Statement
The study was conducted in accordance with the Declaration of Helsinki and guidelines for Good Clinical Practice. The study was approved by the Clinical Ethics Committee of the Faculty of Medicine, Friedrich-Alexander Universität Erlangen-Nürnberg (FAU), Germany. All data were anonymous and analyzed according to the specifications of the ethics committee. A signed declaration of consent was obtained from each participant prior to measurements being taken.
Acknowledgments
We acknowledge support by Deutsche Forschungsgemeinschaft and Friedrich-Alexander-Universität Erlangen-Nürnberg (FAU) within the funding program Open Access Publishing. We would like to thank all patients who participated in this study. The authors also wish to thank the Malteser gGmbH and the hospital management of the Malteser Waldkrankenhaus St. Marien for supporting this research.
Author Contributions
SS, KGG, CCS and MR contributed to data analysis, drafting or revising the article, gave final approval of the version to be published, and agree to be accountable for all aspects of the work.
Disclosure
The authors report no conflicts of interest in this work.
References
1. Abellan van Kan G, Rolland Y, Bergman H, Morley JE, Kritchevsky SB, Vellas B. The I.A.N.A Task Force on frailty assessment of older people in clinical practice. J Nutr Health Aging. 2008;12(1):29–37. doi:10.1007/BF02982161
2. Mitnitski AB, Mogilner AJ, Rockwood K. Accumulation of deficits as a proxy measure of aging. ScientificWorldJournal. 2001;1:323–336. doi:10.1100/tsw.2001.58
3. Fried LP, Tangen CM, Walston J, et al. Frailty in older adults: evidence for a phenotype. J Gerontol a Biol Sci Med Sci. 2001;56(3):M146–M156. doi:10.1093/gerona/56.3.M146
4. Ritt M, Schwarz C, Kronawitter V, et al. Analysis of Rockwood et al’s clinical frailty scale and Fried et al’s frailty phenotype as predictors of mortality and other clinical outcomes in older patients who were admitted to a geriatric ward. J Nutr Health Aging. 2015;19(10):1043–1048. doi:10.1007/s12603-015-0667-9
5. Ritt M, Ritt JI, Sieber CC, Gaßmann KG. Comparing the predictive accuracy of frailty, comorbidity, and disability for mortality: a 1-year follow-up in patients hospitalized in geriatric wards. Clin Interv Aging. 2017;12:293–304. doi:10.2147/CIA
6. Ritt M, Bollheimer LC, Sieber CC, Gaßmann KG. Prediction of one-year mortality by five different frailty instruments: A comparative study in hospitalized geriatric patients. Arch Gerontol Geriatr. 2016;66:66–72. doi:10.1016/j.archger.2016.05.004
7. Jäger J, Sieber CC, Gaßmann KG, Ritt M. Changes of a frailty index based on common blood and urine tests during a hospital stay on geriatric wards predict 6-month and 1-year mortality in older people. Clin Interv Aging. 2019;14:473–484. doi:10.2147/CIA.S191117
8. Clegg A, Young J, Iliffe S, Rikkert MO, Rockwood K. Frailty in elderly people. Lancet. 2013;381(9868):752–762. doi:10.1016/S0140-6736(12)62167-9
9. Morley JE, Vellas B, van Kan GA, et al. Frailty consensus: a call to action. J Am Med Dir Assoc. 2013;14(6):392–397. doi:10.1016/j.jamda.2013.03.022
10. Ritt M, Schülein S, Lubrich H, Bollheimer LC, Sieber CC, Gaßmann KG. High-technology based gait assessment in frail people: associations between spatio-temporal and three-dimensional gait characteristics with frailty status across four different frailty measures. J Nutr Health Aging. 2017;21(3):346–353. doi:10.1007/s12603-016-0764-4
11. Christner S, Ritt M, Volkert D, Wirth R, Sieber CC, Gaßmann KG. Evaluation of the nutritional status of older hospitalised geriatric patients: a comparative analysis of a Mini Nutritional Assessment (MNA) version and the Nutritional Risk Screening (NRS 2002). J Hum Nutr Diet. 2016;29(6):704–713. doi:10.1111/jhn.12376
12. Ritt M, Jäger J, Ritt JI, Sieber CC, Gaßmann KG. Operationalizing a frailty index using routine blood and urine tests. Clin Interv Aging. 2017;12:1029–1040. doi:10.2147/CIA
13. Rockwood K, Song X, MacKnight C, et al. A global clinical measure of fitness and frailty in elderly people. CMAJ. 2005;173(5):489–495. doi:10.1503/cmaj.050051
14. Jones D, Song X, Mitnitski A, Rockwood K. Evaluation of a frailty index based on a comprehensive geriatric assessment in a population based study of elderly Canadians. Aging Clin Exp Res. 2005;17:465–471. doi:10.1007/BF03327413
15. Jones DM, Song X, Rockwood K. Operationalizing a frailty index from a standardized comprehensive geriatric assessment. J Am Geriatr Soc. 2004;52(11):1929–1933. doi:10.1111/jgs.2004.52.issue-11
16. Rockwood K, Rockwood MR, Mitnitski A. Physiological redundancy in older adults in relation to the change with age in the slope of a frailty index. J Am Geriatr Soc. 2010;58(2):318–323. doi:10.1111/j.1532-5415.2009.02667.x
17. Pollock AS, Durward BR, Rowe PJ, Paul JP. What is balance? Clin Rehabil. 2000;14(4):402–406. doi:10.1191/0269215500cr342oa
18. Prieto TE, Myklebust JB, Myklebust BM. Characterization and modeling of postural steadiness in the elderly: a review. IEEE Trans Rehabil Eng. 1993;1(1):26–34. doi:10.1109/86.242405
19. Prieto TE, Myklebust JB, Hoffmann RG, Lovett EG, Myklebust BM. Measures of postural steadiness: differences between healthy young and elderly adults. IEEE Trans Biomed Eng. 1996;43(9):956–966. doi:10.1109/10.532130
20. Thapa PB, Gideon P, Brockman KG, Fought RL, Ray WA. Clinical and biomechanical measures of balance as fall predictors in ambulatory nursing home residents. J Gerontol a Biol Sci Med Sci. 1996;51(5):M239–M246. doi:10.1093/gerona/51A.5.M239
21. Anne Shumway-Cook MHW. Motor Control.
22. Taglietti M, Dela Bela LF, Dias JM, et al. Postural sway, balance confidence, and fear of falling in women with knee osteoarthritis in comparison to matched controls. PM R. 2017;9(8):774–780. doi:10.1016/j.pmrj.2016.11.003
23. Kouzaki M, Masani K. Postural sway during quiet standing is related to physiological tremor and muscle volume in young and elderly adults. Gait Posture. 2012;35(1):11–17. doi:10.1016/j.gaitpost.2011.03.028
24. Sturnieks DL, St George R, Lord SR. Balance disorders in the elderly. Neurophysiol Clin. 2008;38(6):467–478. doi:10.1016/j.neucli.2008.09.001
25. Hasson CJ, van Emmerik RE, Caldwell GE. Balance decrements are associated with age-related muscle property changes. J Appl Biomech. 2014;30(4):555–562. doi:10.1123/jab.2013-0294
26. Mbongo F, Patko T, Vidal PP, Vibert N, Tran Ba Huy P, de Waele C. Postural control in patients with unilateral vestibular lesions is more impaired in the roll than in the pitch plane: a static and dynamic posturography study. Audiol Neurootol. 2005;10(5):291–302. doi:10.1159/000086081
27. Abrahamová D, Hlavacka F. Age-related changes of human balance during quiet stance. Physiol Res. 2008;57(6):957–964.
28. Woollacott MH. Systems contributing to balance disorders in older adults. J Gerontol a Biol Sci Med Sci. 2000;55(8):M424–M428. doi:10.1093/gerona/55.8.M424
29. Freiberger E, Menz HB. Characteristics of falls in physically active community-dwelling older people: findings from the “Standfest im Alter” study. Z Gerontol Geriatr. 2006;39(4):261–267. doi:10.1007/s00391-006-0394-2
30. Yelnik AP, Kassouha A, Bonan IV, et al. Postural visual dependence after recent stroke: assessment by optokinetic stimulation. Gait Posture. 2006;24(3):262–269. doi:10.1016/j.gaitpost.2005.09.007
31. Bauer C, Gröger I, Glabasnia A, Bergler C, Gassmann K-G. First results of evaluation of a falls clinic. Int J Gerontol. 2010;4(3):130–136. doi:10.1016/S1873-9598(10)70036-3
32. Bauer C, Gröger I, Rupprecht R, Meichtry A, Tibesku CO, Gassmann KG. Reliability analysis of time series force plate data of community dwelling older adults. Arch Gerontol Geriatr. 2010;51(3):e100–e105. doi:10.1016/j.archger.2010.01.009
33. Lichtenstein MJ, Shields SL, Shiavi RG, Burger MC. Clinical determinants of biomechanics platform measures of balance in aged women. J Am Geriatr Soc. 1988;36(11):996–1002. doi:10.1111/jgs.1988.36.issue-11
34. Najafi B, Horn D, Marclay S, Crews RT, Wu S, Wrobel JS. Assessing postural control and postural control strategy in diabetes patients using innovative and wearable technology. J Diabetes Sci Technol. 2010;4(4):780–791. doi:10.1177/193229681000400403
35. Timar B, Timar R, Gaiță L, Oancea C, Levai C, Lungeanu D. The impact of diabetic neuropathy on balance and on the risk of falls in patients with type 2 diabetes mellitus: a cross-sectional study. PLoS One. 2016;11(4):e0154654. doi:10.1371/journal.pone.0154654
36. Thiede R, Toosizadeh N, Mills JL, Zaky M, Mohler J, Najafi B. Gait and balance assessments as early indicators of frailty in patients with known peripheral artery disease. Clin Biomech (Bristol, Avon). 2016;32:1–7. doi:10.1016/j.clinbiomech.2015.12.002
37. Martone AM, Bianchi L, Abete P, et al. The incidence of sarcopenia among hospitalized older patients: results from the Glisten study. J Cachexia Sarcopenia Muscle. 2017;8(6):907–914. doi:10.1002/jcsm.12224
38. Anderson DE, Quinn E, Parker E, et al. Associations of computed tomography-based trunk muscle size and density with balance and falls in older adults. J Gerontol a Biol Sci Med Sci. 2016;71(6):811–816. doi:10.1093/gerona/glv185
39. Chung KA, Lobb BM, Nutt JG, McNames J, Horak F. Objective measurement of dyskinesia in Parkinson’s disease using a force plate. Mov Disord. 2010;25(5):602–608. doi:10.1002/mds.22856
40. Masui T, Hasegawa Y, Yamaguchi J, Kanoh T, Ishiguro N, Suzuki S. Increasing postural sway in rural-community-dwelling elderly persons with knee osteoarthritis. J Orthop Sci. 2006;11(4):353–358. doi:10.1007/s00776-006-1034-9
41. Suttanon P, Hill KD, Said CM, Logiudice D, Lautenschlager NT, Dodd KJ. Balance and mobility dysfunction and falls risk in older people with mild to moderate Alzheimer disease. Am J Phys Med Rehabil. 2012;91(1):12–23. doi:10.1097/PHM.0b013e31823caeea
42. Tabara Y, Okada Y, Ohara M, et al. Association of postural instability with asymptomatic cerebrovascular damage and cognitive decline: the Japan Shimanami health promoting program study. Stroke. 2015;46(1):16–22. doi:10.1161/STROKEAHA.114.006704
43. Toosizadeh N, Mohler J, Wendel C, Najafi B. Influences of frailty syndrome on open-loop and closed-loop postural control strategy. Gerontology. 2015;61(1):51–60. doi:10.1159/000362549
44. Kang HG, Costa MD, Priplata AA, et al. Frailty and the degradation of complex balance dynamics during a dual-task protocol. J Gerontol a Biol Sci Med Sci. 2009;64(12):1304–1311. doi:10.1093/gerona/glp113
45. Marques LT, Rodrigues NC, Angeluni EO, et al. Balance evaluation of prefrail and frail community-dwelling older adults. J Geriatr Phys Ther. 2017;42:176–182.
46. Podsiadlo D, Richardson S. The timed “Up & Go”: a test of basic functional mobility for frail elderly persons. J Am Geriatr Soc. 1991;39(2):142–148. doi:10.1111/j.1532-5415.1991.tb01616.x
47. Schülein S, Barth J, Rampp A, et al. Instrumented gait analysis: a measure of gait improvement by a wheeled walker in hospitalized geriatric patients. J Neuroeng Rehabil. 2017;14(1):18. doi:10.1186/s12984-017-0228-z
48. Rampp A, Barth J, Schülein S, Gaßmann KG, Klucken J, Eskofier BM. Inertial sensor-based stride parameter calculation from gait sequences in geriatric patients. IEEE Trans Biomed Eng. 2015;62(4):1089–1097. doi:10.1109/TBME.2014.2368211
49. Folstein MF, Folstein SE, McHugh PR. “Mini-mental state”. A practical method for grading the cognitive state of patients for the clinician. J Psychiatr Res. 1975;12(3):189–198. doi:10.1016/0022-3956(75)90026-6
50. Conwell Y, Forbes NT, Cox C, Caine ED. Validation of a measure of physical illness burden at autopsy: the Cumulative Illness Rating Scale. J Am Geriatr Soc. 1993;41(1):38–41. doi:10.1111/j.1532-5415.1993.tb05945.x
51. Ritt M, Rádi KH, Schwarz C, Bollheimer LC, Sieber CC, Gaßmann KG. A comparison of frailty indexes based on a comprehensive geriatric assessment for the prediction of adverse outcomes. J Nutr Health Aging. 2016;20(7):760–767. doi:10.1007/s12603-015-0644-3
52. Rockwood K, Andrew M, Mitnitski A. A comparison of two approaches to measuring frailty in elderly people. J Gerontol a Biol Sci Med Sci. 2007;62(7):738–743. doi:10.1093/gerona/62.7.738
53. Bauer CM, Gröger I, Rupprecht R, Tibesku CO, Gassmann KG. Reliability of static posturography in elderly persons. Z Gerontol Geriatr. 2010;43(4):245–248. doi:10.1007/s00391-009-0052-6
54. Searle SD, Mitnitski A, Gahbauer EA, Gill TM, Rockwood K. A standard procedure for creating a frailty index. BMC Geriatr. 2008;8:24. doi:10.1186/1471-2318-8-24
55. Rockwood K, Mitnitski A. How might deficit accumulation give rise to frailty? J Frailty Aging. 2012;1(1):8–12. doi:10.14283/jfa.2012.2
56. Prieto TE, Myklebust JB. Measures of postural sway. Clin Pharmacol Ther. 1993;54(2):228–230. doi:10.1038/clpt.1993.134
57. Coe R It´s the effect size, stupid.
58. Schülein S, Pflugrad L, Petersen H, Lutz M, Volland-Schüssel K, Gaßmann KG. German translation of the performance-oriented mobility assessment according to Tinetti. Z Gerontol Geriatr. 2016;50:498–505.
59. Andersen JL, Terzis G, Kryger A. Increase in the degree of coexpression of myosin heavy chain isoforms in skeletal muscle fibers of the very old. Muscle Nerve. 1999;22(4):449–454. doi:10.1002/(ISSN)1097-4598
60. Batista FS, Gomes GA, D’Elboux MJ, et al. Relationship between lower-limb muscle strength and functional independence among elderly people according to frailty criteria: a cross-sectional study. Sao Paulo Med J. 2014;132(5):282–289. doi:10.1590/1516-3180.2014.1325669
61. Galizia G, Langellotto A, Cacciatore F, et al. Association between nocturia and falls-related long-term mortality risk in the elderly. J Am Med Dir Assoc. 2012;13(7):640–644. doi:10.1016/j.jamda.2012.05.016
62. Theou O, Cann L, Blodgett J, Wallace LM, Brothers TD, Rockwood K. Modifications to the frailty phenotype criteria: systematic review of the current literature and investigation of 262 frailty phenotypes in the Survey of Health, Ageing, and Retirement in Europe. Ageing Res Rev. 2015;21:78–94. doi:10.1016/j.arr.2015.04.001
 © 2020 The Author(s). This work is published and licensed by Dove Medical Press Limited. The full terms of this license are available at https://www.dovepress.com/terms.php and incorporate the Creative Commons Attribution - Non Commercial (unported, v3.0) License.
By accessing the work you hereby accept the Terms. Non-commercial uses of the work are permitted without any further permission from Dove Medical Press Limited, provided the work is properly attributed. For permission for commercial use of this work, please see paragraphs 4.2 and 5 of our Terms.
© 2020 The Author(s). This work is published and licensed by Dove Medical Press Limited. The full terms of this license are available at https://www.dovepress.com/terms.php and incorporate the Creative Commons Attribution - Non Commercial (unported, v3.0) License.
By accessing the work you hereby accept the Terms. Non-commercial uses of the work are permitted without any further permission from Dove Medical Press Limited, provided the work is properly attributed. For permission for commercial use of this work, please see paragraphs 4.2 and 5 of our Terms.