")
Back to Journals » International Journal of Nanomedicine » Volume 14
Folic acid-nanoscale gadolinium-porphyrin metal-organic frameworks: fluorescence and magnetic resonance dual-modality imaging and photodynamic therapy in hepatocellular carcinoma
Authors Chen Y, Liu W , Shang Y, Cao P, Cui J, Li Z , Yin XB, Li Y
Received 21 June 2018
Accepted for publication 14 November 2018
Published 19 December 2018 Volume 2019:14 Pages 57—74
DOI https://doi.org/10.2147/IJN.S177880
Checked for plagiarism Yes
Review by Single anonymous peer review
Peer reviewer comments 4
Editor who approved publication: Dr Mian Wang
Yang Chen,1,2,* Wei Liu,3,4,* Yue Shang,1,2 Peipei Cao,1,2 Jianlin Cui,1,2 Zongjin Li,1 Xuebo Yin,3 Yuhao Li1,2
1Nankai University School of Medicine, Tianjin, China; 2Tianjin Key Laboratory of Tumor Microenvironment and Neurovascular Regulation, Medical International Collaborative Innovation Center, Nankai University, Tianjin, China; 3State Key Laboratory of Medicinal Chemical Biology and Tianjin Key Laboratory of Biosensing and Molecular Recognition, College of Chemistry, Nankai University, Tianjin, China; 4School of Science, Tianjin University, Tianjin, China
*These authors contributed equally to this work
Background: Hepatocellular carcinoma (HCC) is the most common primary liver cancer and severely threatens human health. Since the prognosis of advanced HCC remains poor, there is an urgent need to develop new therapeutic approaches. Porphyrin metal-organic frameworks are a class of porous organic-inorganic hybrid functional materials with good biocompatibility.
Methods: Gadolinium-porphyrin metal-organic frameworks were used as a skeleton for folic acid (FA) conjugation to synthesize a novel type of nanoparticle, denoted as folic acid-nanoscale gadolinium-porphyrin metal-organic frameworks (FA-NPMOFs). The FA-NPMOFs were characterized using transmission electron microscopy, Fourier transform infrared spectroscopy and thermogravimetric-differential thermal analysis. The biotoxicity and imaging capability of the FA-NPMOFs were determined using HepG2 cells and embryonic and larval zebrafish. The delivery and photodynamic therapeutic effect of FA-NPMOFs were explored in transgenic zebrafish with doxycycline-induced HCC.
Results: FA-NPMOFs were spherical in structure with good dispersion and water solubility. They showed low biotoxicity, emitted bright red fluorescence, and exhibited an excellent magnetic resonance imaging capability, both in vitro and in vivo. Meanwhile, the FA-NPMOFs exhibited a strong affinity for folate receptor (FR)-expressing cells and were delivered to the tumor site in a targeted manner. Moreover, HCC tumor cells were eliminated following laser irradiation.
Conclusion: FA-NPMOFs can be used for dual-modality imaging and photodynamic therapy in HCC and show promise for use as a carrier in new therapies for HCC and other FR-positive tumors.
Keywords: nanoscale gadolinium-porphyrin metal-organic frameworks, folic acid, hepatocellular carcinoma, dual-modality imaging, photodynamic therapy
Introduction
Hepatocellular carcinoma (HCC), arising from hepatocytes, is the most common primary liver cancer. Although the outcome of HCC diagnosed at an early stage has improved due to the implementation of screening procedures and advances in imaging, the prognosis of advanced HCC remains poor. Therefore, it is imperative to develop novel therapeutic approaches for HCC.1,2 Zebrafish is currently considered as one of the most useful models for studying human diseases, including cancers. Zebrafish are oviparous organisms with external fertilization, transparent eggs, and temporospatial development pattern.3–6 Studies have revealed that zebrafish can spontaneously develop a variety of tumors, which can be induced either by chemical mutagen exposure or with transgenic techniques.7 Several models have been generated successfully, including models of leukemia, melanoma, and rhabdomyosarcoma.8,9 Among them, the transgenic line Tg (fabp10:rtTA2s-M2; TRE2:EGFP-krasG12V) (krasG12V) serves as an ideal model for investigating HCC. krasG12V fish are tetracycline-inducible (Tet-on) transgenic fish expressing oncogenic enhanced green fluorescent protein (EGFP)-krasG12V specifically in the liver. By treatment with doxycycline, robust and homogeneous liver tumors can be induced in krasG12V fish. Moreover, the developed liver tumors resemble human HCC in both molecular biology and histopathology.10,11
Folic acid (FA), also known as vitamin B9, is a nutrient required by all living cells for nucleotide synthesis and cell growth. FA functions by binding to its specific receptor, folate receptor (FR). FR is a glycoprotein that captures its ligand from the extracellular milieu and transports it inside the cell via endocytic mechanisms. Under physiologic conditions, the FR expression level is very low on the surface of normal cells. Nevertheless, FR is overexpressed in several epithelial cancer tissues, such as ovarian, breast, cervical, colorectal, renal, and nasopharyngeal cancer, compared to the normal corresponding tissues.12,13 Hence, FA can be used as a targeting ligand for tumor-specific drug delivery.14 Metal-organic frameworks (MOFs) are a class of porous organic–inorganic hybrid functional materials composed of metal ions and organic ligands.15,16 Porphyrin MOFs (PMOFs), consisting of porphyrin and metal ions, circumvent the hydrophobic nature and aggregation of porphyrin while retaining its photophysical properties. PMOFs not only have good biocompatibility and dispersion but also emit bright red fluorescence.17,18 Meanwhile, PMOFs can also be used as a photosensitizer and have been used in photodynamic therapy (PDT).19 Gadolinium (Gd) compounds are widely used as contrast media for magnetic resonance imaging (MRI) because Gd3+ ions have a long electronic relaxation time, which enhance the T1-weighted MRI contrast.20 Recently, imaging-guided therapy systems further integrate visualization technology to exert the combination of imaging and therapy.21 However, there is still a lack of knowledge about Gd-based antitumor effect.
In the present study, nanoscale gadolinium-porphyrin MOFs (NPMOFs) were synthesized and used as a skeleton for FA conjugation and preparation of a novel type of nanoparticle, folic acid-nanoscale gadolinium-porphyrin metal-organic frameworks (FA-NPMOFs). Subsequently, we determined the following properties of the FA-NPMOFs: 1) physical and chemical characteristics; 2) cytotoxicity and in vitro fluorescence imaging capability; 3) in vivo toxicity and fluorescence and MRI capability in zebrafish embryos and larvae; and 4) capability for selective accumulation and PDT in HCC in krasG12V zebrafish. Our study not only evaluated the biotoxicity of FA-NPMOFs but also broadened their potential applications in HCC by demonstrating their capability for dual-modality imaging and PDT.
Materials and methods
Cell culture
Human HCC HepG2 cells and L02 hepatocytes were purchased from ATCC and Beijing Union Medical College Hospital, respectively. The use of L02 cell line was approved by the Institutional Ethics Committee at Nankai University. HepG2 cells and L02 cells were cultured in complete DMEM (Biological Industries [BI], Israel) and complete Roswell Park Memorial Institute 1640 medium (BI), respectively, containing 10% (v/v) FBS (BI) and 1% penicillin–streptomycin (Thermo Scientific, Waltham, MA, USA). All cells were incubated at 37°C with 5% CO2.
Experimental animals
Wild-type zebrafish (AB strain) and krasG12V transgenic zebrafish (a kind gift from Dr Gong) were used in this study. Fish were raised at 28.5°C with a 10-hour dark/14-hour light cycle.22 Wild-type embryos were incubated in E3 medium (5 mmol/L NaCl, 0.17 mmol/L KCl, 0.33 mmol/L CaCl2, 0.33 mmol/L MgSO4, pH 7.2) and staged by hours post fertilization (hpf), days post fertilization (dpf), and months post fertilization (mpf). All protocols involving animals were approved by the Institutional Animal Care Committee at Nankai University and conformed to the National Institutes of Health Guidelines.
Reagents
All reagents were of at least analytical grade. The reagents used were as follows: cetyltrimethylammonium bromide (CTAB; Fu Chen Reagent Co., Ltd., Tianjin, China); polyetherimide (PEI, molecular weight =10,000; Fu Chen); 5,10,15,20-tetrakis(4-carboxyl)-21H,23H-porphine (TCPP; TCI Chemical Development Co., Ltd., Shanghai, China); gadolinium trichloride (GdCl3; Alfa-Asha, Tianjin, China); 1-ethyl-3-(3-dimethylaminepropyl) carbodiimide (EDC; Aladdin, Shanghai, China); N-hydroxysuccinimide (NHS; Aladdin); FA (Shanghai Bu Bai Chemical Technology Co., Ltd., Shanghai, China); and N,N-dimethylformamide (DMF) and anhydrous ethanol (Concord Technology Co., Ltd., Tianjin, China).
Preparation of FA-NPMOFs
The FA-NPMOFs were prepared as follows: 8 mg of TCPP and 150 mg of CTAB were added and dissolved in 10 mL of DMF and heated to 110°C under vigorous stirring in a 50 mL beaker. Then, 6.8 mg of GdCl3 was dissolved in 5 mL of DMF and subjected to ultrasonic treatment (KQ2200; Kunshan Ultrasonic Instruments Co., Ltd., China) for 5 minutes, followed by the addition of porphyrin and another 10 minutes of sonication. Subsequently, 5 mg of PEI was dissolved in 5 mL of DMF and dispersed by 5 minutes of ultrasound treatment. Pre-MOFs were then added into the above mixture, allowed to react for 10 minutes, and removed from heat. When the temperature of the reaction system reached the room temperature, the precipitate was dispersed in 10 mL of DMF, stirred, and dissolved thoroughly in a 50 mL round-bottom flask. Then, the solution was centrifuged at 12,000 rpm for 5 minutes. The supernatant was discarded, and 25 mg of EDC, 11.2 mg of NHS, and 44 mg of FA (at a molar ratio of 1.2:0.5:1) were dissolved in 10 mL of DMF overnight. After centrifugation, the supernatant was discarded, and the precipitate was washed twice with DMF, ethanol, and water to obtain a purple-red powder. The washed powder was lyophilized to obtain FA-NPMOFs.
Characterization of the FA-NPMOFs
The morphology of the FA-NPMOFs was characterized using a transmission electron microscopy (TEM, accelerating voltage =200 kV; JEM100CXII, JEOL Japan Electronics Co., Ltd., Japan). The functionalization of the FA-NPMOFs was characterized by Fourier transform infrared spectroscopy (FTIR; 400–4,000 cm−1) on a Tensor 27 Fourier infrared spectrometer (Bruker, Germany) and thermogravimetric-differential thermal analysis (TG-DTA). TG-DTA measurements were obtained in air heated from 20°C at a ramp rate of 10°C min−1 in a PTC-10ATG-DTA thermal analyzer (Thermo plus EVO2 TG8121, Rigaku Co., Ltd., Japan). The optical properties of the FA-NPMOFs were determined by UV-Vis spectroscopy (U-3900 spectrophotometer, Hitachi, Japan). The steady-state fluorescence was performed on spectroscopy (FL-4600 fluorescence spectrometer; Hitachi, Japan) equipped with a plotter unit and a quartz cell (1×1 cm). The excitation and emission spectral slit width was 10 nm.
In vitro cytotoxicity assay
HepG2 cells and L02 cells were plated into 96-well plates at 4×10³ cells per well and incubated with 100 μL of cell culture medium or FA-NPMOFs (25, 50, 100, 200, and 400 μg/mL) for 6 hours. For the PDT test, HepG2 cells were then irradiated with a 655 nm laser for 10 minutes (300 mW cm−2). In vitro cytotoxicity was detected with an MTT kit (Keygen Biotech, Jiangsu, China) according to the manufacturer’s instructions. Three parallel replicates were measured for each sample. The absorbance (OD value) at a wavelength of 560 nm was measured using a microplate reader (Promega, Madison, WI, USA) to calculate the survival rate. In addition, HepG2 cells were plated into a six-well plate and incubated with 2 mL FA-NPMOFs at a concentration of 200 μg/mL for 3 hours. After removing FA-NPMOFs, cells were incubated in cell culture medium and the content of Gd3+ was measured in the supernatant at 3, 6, and 12 hours, respectively. The release efficiency was then calculated to evaluate the in vitro release of FA-NPMOFs.
In vitro biologic imaging
HepG2 cells were seeded in a 24-well plate at a density of 4×10⁴ in 500 μL/well and cultured for 24 hours. To assess the biologic imaging capability of the FA-NPMOFs at different concentrations, the HepG2 cells were cultured with fresh DMEM containing FA-NPMOFs at 400, 200, 100, 50, and 25 μg/mL for 3 hours. FA-NPMOF-free cells were considered the control group. NPMOFs-incubated HepG2 cells (at concentrations of 400, 200, and 100 μg/mL) were set as the negative control. The cells were washed with 0.1 M PBS (pH 7.2), fixed with 4% paraformaldehyde (PFA) for 20 minutes, and stained with DAPI (diluted at 1:1,000; Sigma-Aldrich Co., St Louis, MO, USA) for 15 minutes. After being washed with PBS-0.1% Tween three times for 5 minutes each, the cells were sealed with mounting medium. Confocal fluorescence images were captured using an FV 1000 confocal microscope (Olympus Corporation, Tokyo, Japan). Red fluorescence images of FA-NPMOFs were captured using 559 nm excitation; blue fluorescence of the DAPI staining was acquired using 405 nm excitation.
Aqueous exposure and fluorescence imaging of zebrafish embryos and larvae
Aqueous exposure was carried out according to the guidelines of the Organization for Economic Cooperation and Development.22,23 For in vivo fluorescence imaging, wild-type embryos were placed in a 12-well plate (50 embryos in 3 mL of solution/well) at 1 hpf and were soaked with FA-NPMOF-E3 medium at a concentration of 400, 200, 100, and 50 μg/mL. The same number of embryos was raised in only E3 medium as the control group. After continuous incubation for 5 hours, the embryos were returned to E3 medium. Fluorescence images of the embryos were captured with a DP72 camera mounted on an SZX16 stereomicroscope (Olympus Corporation). To observe the tissue distribution of FA-NPMOFs in larvae, wild-type fish were incubated in FA-NPMOF-Holt buffer (3.5 g/L NaCl, 0.05 g/L KCl, 0.025 g/L NaHCO3, 0.1/L CaCl2, pH 7.2) at a concentration of 200 μg/mL at 5 dpf. After 12 hours of aqueous exposure, larvae were observed under a BX51 fluorescence microscope (Olympus Corporation) every 12 hours. Larvae incubated in Holt buffer alone were used as the control group. The above aqueous exposure experiments were repeated three times.
MRI
A total of 100 embryos from each FA-NPMOF-exposed group were packed into a 1.5 mL Eppendorf tube and placed in the MRI system (1.2 T; Huantong Corporation, Shanghai, China). T1-weighted images were captured along the horizontal and sagittal planes. Juvenile fish were anesthetized in 0.016% tricaine, euthanized immediately, and then placed in a 1.5 mL Eppendorf tube to obtain T1-weighted images along the sagittal plane. The MRI parameters were TR/TE =9.7/3.0 milliseconds, flip angle =13°, field of view =100×100 mm2, matrix =256×256, slice thickness =1 mm without gaps, and 30°C.
Induction of HCC in krasG12V zebrafish
At 1 mpf, krasG12V fish were treated with doxycycline (D989 1-25 G-9; Sigma-Aldrich Co.) in the system water at a concentration of 60 μg/mL for 15 days in the dark.10 At 9 AM each day, the juveniles were allowed a 30-minute interval in doxycycline-free system water and were fed with shrimp. Then, the fish were again treated with fresh doxycycline solution.
Treatment of HCC-bearing zebrafish with FA-NPMOFs and PDT
HCC-bearing krasG12V fish were treated with FA-NPMOF-Holt buffer at a concentration of 200 μg/mL. Samples were collected at 24, 48, 72, and 96 hours post treatment (hpt). Wild-type fish were also treated with FA-NPMOF-Holt buffer to discern the potential toxicity of FA-NPMOFs at the same time points. For negative control, HCC-bearing krasG12V fish were treated with NPMOF-Holt buffer at a concentration of 200 μg/mL and collected at 24, 48, and 96 hpt. For the PDT test, HCC-bearing fish were irradiated with a 655 nm laser for 10 minutes (300 mW/cm2) after soaking in 200 μg/mL FA-NPMOFs for 48 hours. HCC-bearing fish soaked in a doxycycline solution were used as the control group.
Small animal imaging
Following FA-NPMOF treatment, HCC-bearing fish were anesthetized in 0.016% tricaine (A5040; Sigma-Aldrich Co.) and euthanized immediately. Thermal imaging was performed along the sagittal section using a NightOWL LB 983 small animal in vivo imaging system (Berthold Technologies, Germany) with the following parameters: Ex =530 nm, Em =660 nm, and exposure time =0.1 second.
Histology and immunohistochemistry
Fish were anesthetized in 0.016% tricaine and euthanized immediately. The liver was dissected, fixed in 4% PFA at 4°C overnight, and then embedded in paraffin. Sagittal sections were prepared at a thickness of 5 μm. H&E staining was performed using a standard protocol.24 The livers from HCC-bearing zebrafish were then collected and serially cryosectioned at a thickness of 8 μm. Immunohistochemistry was performed as previously described.25 For immunofluorescence staining, L02 cells or HepG2 cells were seeded into a 24-well plate at a density of 4×10⁴ in 500 μL/well for growth on glass coverslips. The cells were washed 3 times with 0.1 M PBS containing 0.5% Triton X-100 for 5 minutes, fixed in 4% PFA for 20 minutes, and stained using standard protocols.26 The primary antibody used in this study was anti-FR antibody (1:50; sc-28997, Santa Cruz Biotechnology Inc., Dallas, TX, USA). The secondary antibody was a Cy3-labeled antibody (1:200; Merck Millipore, Billerica, MA, USA). DAPI was used to counterstain the nuclei. Images of immunostaining were captured using an FV 1000 confocal microscope (Olympus Corporation).
Statistical analysis
GraphPad Prism software (version 6.0; GraphPad Software, Inc., La Jolla, CA, USA) was used for the statistical analysis. The viability of cells, the survival rate, and the hatching rate of the zebrafish embryos are expressed as a percentage (mean ± SEM) of three replicates. Before performing the threshold processing, ImageJ software (1.49×, NIH, http://rsb.info.nih.gov/ij/) was used to convert the immunostaining images into 8-bit grayscale images. Statistical analysis of differences among groups was performed by one-way ANOVA. P-values <0.05 were considered statistically significant.
Results
Synthesis and characterization of FA-NPMOFs
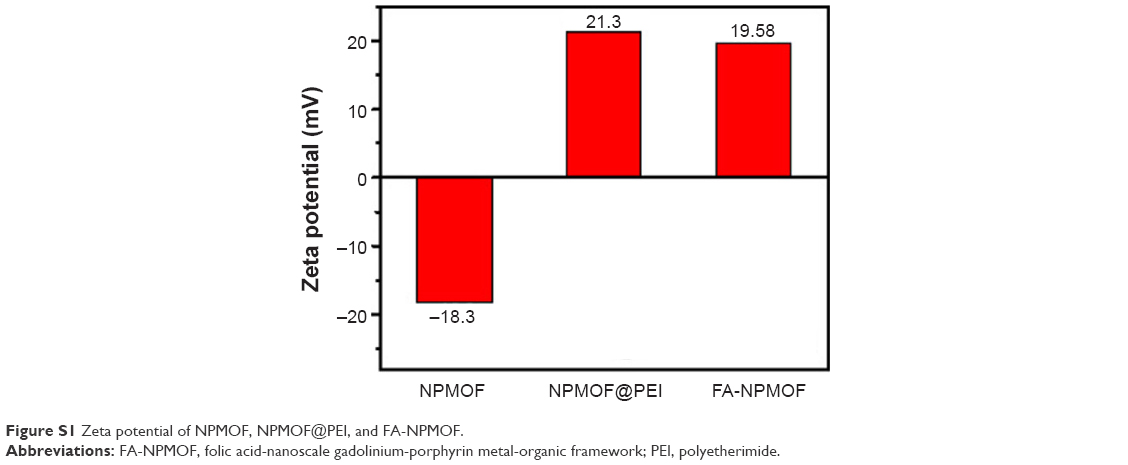
Figure 1A shows a schematic illustration of the procedure for preparing FA-NPMOFs. TEM images (Figure 1B) revealed the structure of the FA-NPMOFs to be spherical and ~200 nm in diameter with an outer PEI coating layer ~15 nm thick. FTIR showed a peak at 1,407 cm−1 from the C−N amide bonds of FA (Figure 1C, arrow) and peaks at 2,854 and 2,923 cm−1 due to the stretching vibrations of C−H of PEI (Figure 1C, circle and arrows). These findings demonstrate the immobilization of FA. The composition of the FA-NPMOFs was further characterized by thermogravimetric analysis (TGA) (Figure 1D and E). The molar ratio of FA-to-porphyrin was ~0.75:1, which shows the grafting rate of FA. The emission and excitation wavelengths of the UV absorbance (Figure 1F, black line) and normalized fluorescence (Figure 1F, blue line) provided a basis for biologic imaging. The zeta potential of NPMOFs was −18.3 mV, whereas that of the NPMOF@PEI was 21.3 mV. The conjugation with FA decreased the positive charge to 19.58 mV (Figure S1). The above data suggest that the FA-NPMOFs were synthesized successfully.
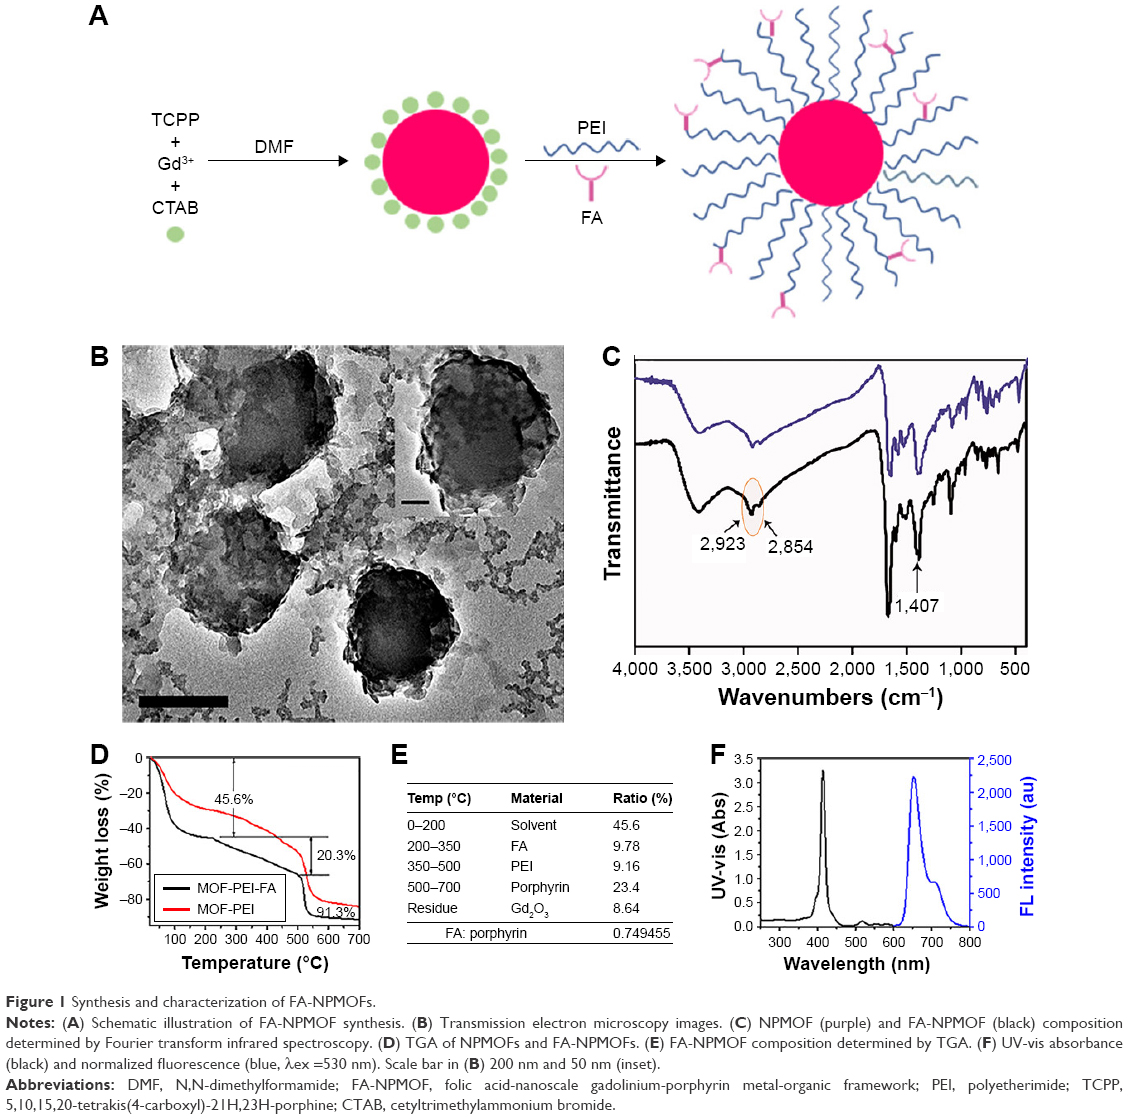 | Figure 1 Synthesis and characterization of FA-NPMOFs. |
FA-NPMOFs show bright in vitro fluorescence and low cytotoxicity
First, we checked the expression of FR in HCC cells by immunohistochemistry using L02 cells as the negative control. No positive signal was detected in L02 cells (Figure S2A). In contrast, FR was strongly expressed in the membrane and cytoplasm of HepG2 cells (Figure S2B),27,28 indicating the overexpression of FR in HepG2 cells. To test the in vitro imaging capability of the FA-NPMOFs, HepG2 cells were incubated with FA-NPMOFs at different concentrations. Following 3 hours of incubation, the red fluorescence signals were detected and intensified with increasing FA-NPMOF concentration; positive signals were localized in the cytoplasm rather than the nucleus (Figure 2A). In negative control group, weak fluorescence was detected in the cytoplasm in NPMOF-incubated HepG2 cells (Figure S3). To further quantify this finding, we scored the ratio between the area of FA-NPMOF-positive signals and the area of nuclei (stained by DAPI) in each group. These results showed that FA-NPMOF fluorescence occurred in a dose-dependent manner (Figure 2B). Moreover, similar cell shape was observed in cell groups (five exposed and one control group). The MTT assay was then performed to assess the in vitro toxicity and PDT effect of FA-NPMOFs. No significant difference in viability was found between the L02 and HepG2 groups at any concentration (Figure 2C). The viability of HepG2 cells following laser irradiation (HepG2 + PDT) at higher treatment concentrations (100, 200, and 400 μg/mL) was significantly decreased compared to L02 and HepG2 cells (Figure 2C; ANOVA, *P<0.05, ***P<0.001). The in vitro release experiment showed that the FA-NPMOFs were released gradually (Figure S4). Together, these data indicate that FA-NPMOFs not only have low cytotoxicity with a sufficient capability for cellular imaging but also enable PDT to eliminate cancer cells in vitro.
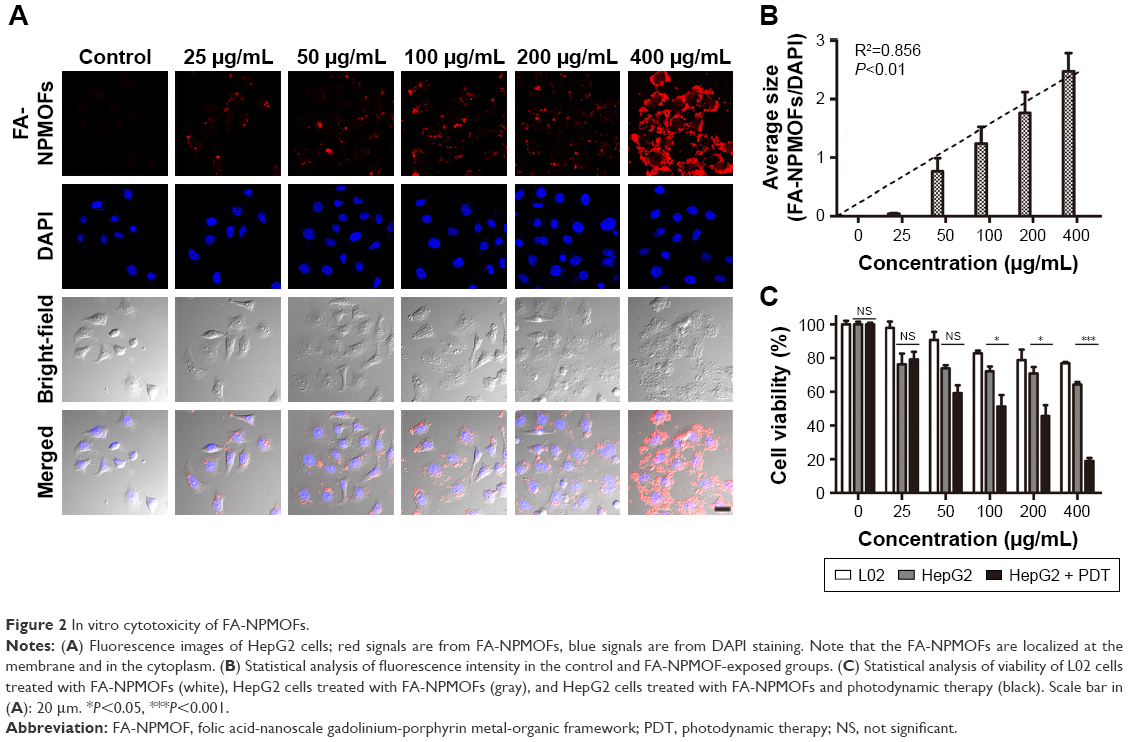 | Figure 2 In vitro cytotoxicity of FA-NPMOFs. |
FA-NPMOFs are capable of dual-modality imaging and have low in vivo toxicity
Following 5 hours of exposure to FA-NPMOFs, red fluorescence signals were observed in embryos in all exposed groups; the fluorescence intensity was in a dose-dependent manner (Figure 3A and B). For MRI, the T1-weighted signals became stronger by increasing the FA-NPMOF dose (Figure 3C and D). FA-NPMOFs were then removed, and the embryos were raised in Holt buffer regularly until 72 hpf. Compared to the control group (Figure S5A),29 no obvious malformations were observed in embryos in the exposed groups at 6, 24, 48, and 72 hpf (Figure S5A). Analysis of the survival and hatching rates showed no significant differences (Figure S5B and C). These results indicate that the as-prepared FA-NPMOFs can be used for fluorescence and MRI in vivo imaging. Additionally, short-term exposure to FA-NPMOFs does not disrupt the gross development of embryonic zebrafish.
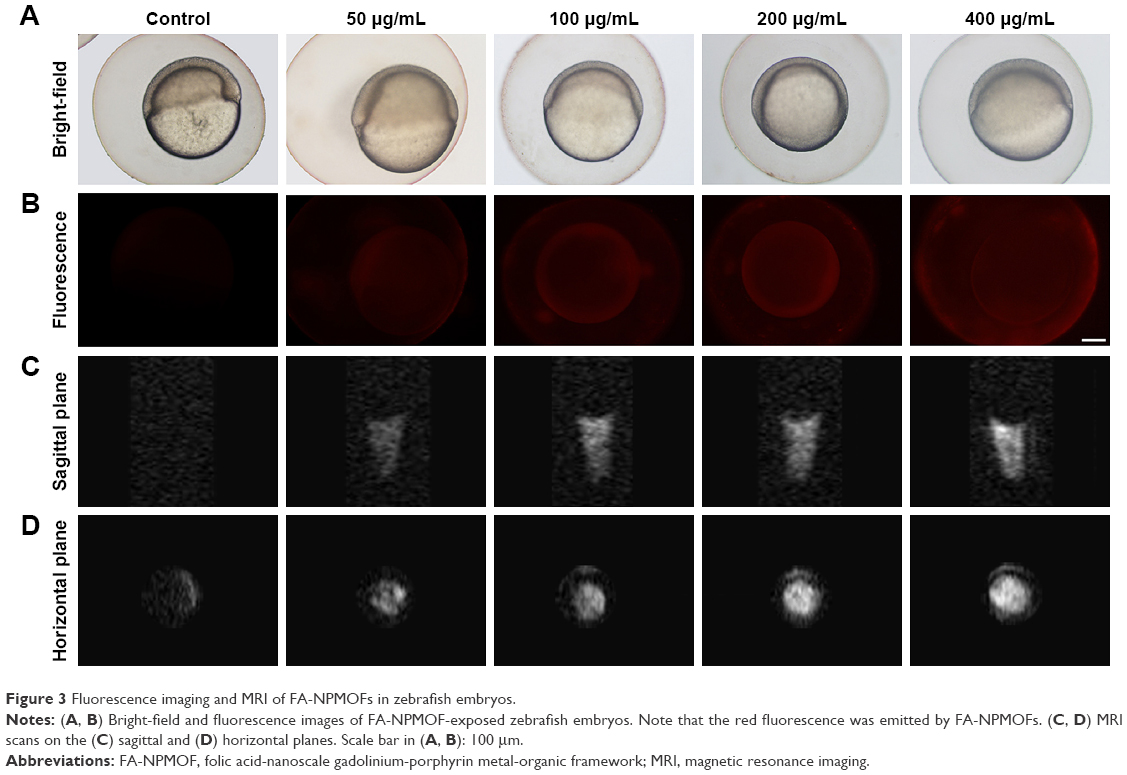 | Figure 3 Fluorescence imaging and MRI of FA-NPMOFs in zebrafish embryos. |
The distribution of FA-NPMOFs in 5-dpf larvae was assessed following exposure to FA-NPMOFs. Most of the fluorescence signals were detected in the gastrointestinal tract and decreased over time, disappearing at 60 hours post exposure (Figure 4). Interestingly, no positive signals were detected in the liver at any time point. These results indicate that FA-NPMOFs are ingested by the wild-type larvae and accumulate mainly in the gastrointestinal tract.
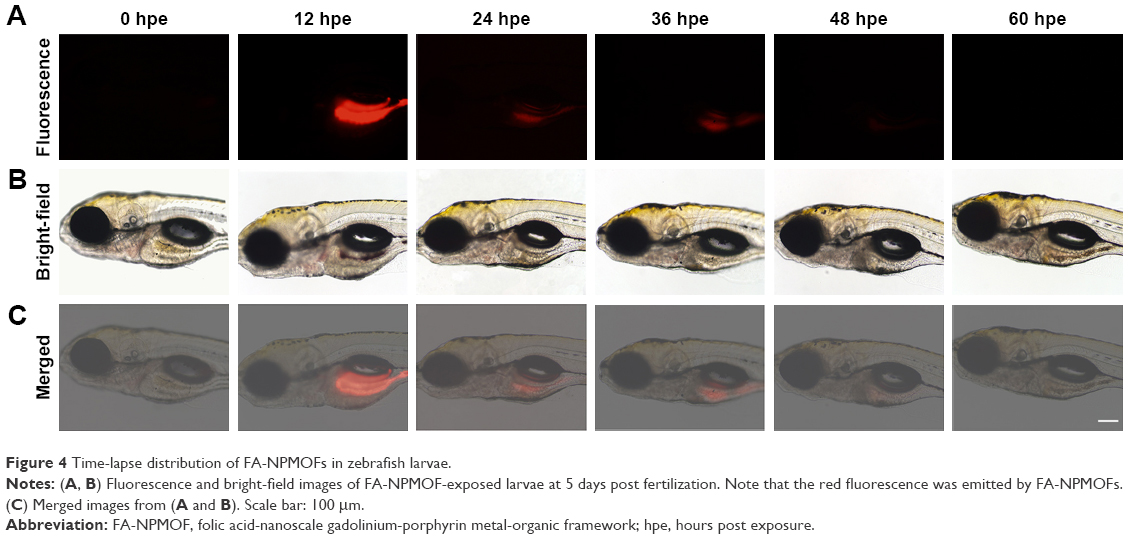 | Figure 4 Time-lapse distribution of FA-NPMOFs in zebrafish larvae. |
Tumor targeting of FA-NPMOFs in HCC-bearing krasG12V juveniles
In this study, we used doxycycline to induce HCC in one-month-old krasG12V transgenic fish and assessed its formation every 3 days (Figure S6). To eliminate the possible toxicity of FA-NPMOFs in the liver, wild-type zebrafish at 1 mpf were treated in the same way and were used as the control. No positive signals were found in the liver in the control group (Figure S6A). At 3 days post induction (dpi), low EGFP-positive signals were detected on the ventral side of the esophagus and intestinal bulb, although the liver did not show obvious enlargement (Figure S6B). From 6 to 12 dpi, the liver enlarged gradually, and the fluorescence in the liver increased. Next, we also performed H&E staining for histologic examination of the liver. From 6 to 12 dpi, cells in the liver exhibited a disordered growth arrangement with thickened plates. Over time, these cells became darkly stained and showed a higher nuclear-to-cytoplasmic ratio (Figure S6C–E).30–32 At 15 dpi, the liver showed remarkable cell pleomorphism, multinuclear cells, and vesicular nuclei with prominent nucleoli (Figure 5A). Because FR is overexpressed in HCC cells rather than normal hepatocytes, we also tested the expression of FR using immunohistochemistry in doxycycline-induced juveniles at 15 dpi. Briefly, bright red signals were detected in the membrane and cytoplasm, indicating strong FR expression (Figure 5B). HCC in krasG12V fish was defined as an EGFP-positive liver enlarged to at least twice the size of a normal liver with histologic changes, including plate disarrangement and atypical cells with an increased nuclear-to-cytoplasmic ratio.33,34 Moreover, we found that the EGFP-positive and FR-positive signals were colocalized. The above data illustrate that HCC is fully developed in krasG12V juveniles following 15 days of induction with doxycycline at 60 μg/mL, thus providing an efficient and reliable HCC model.
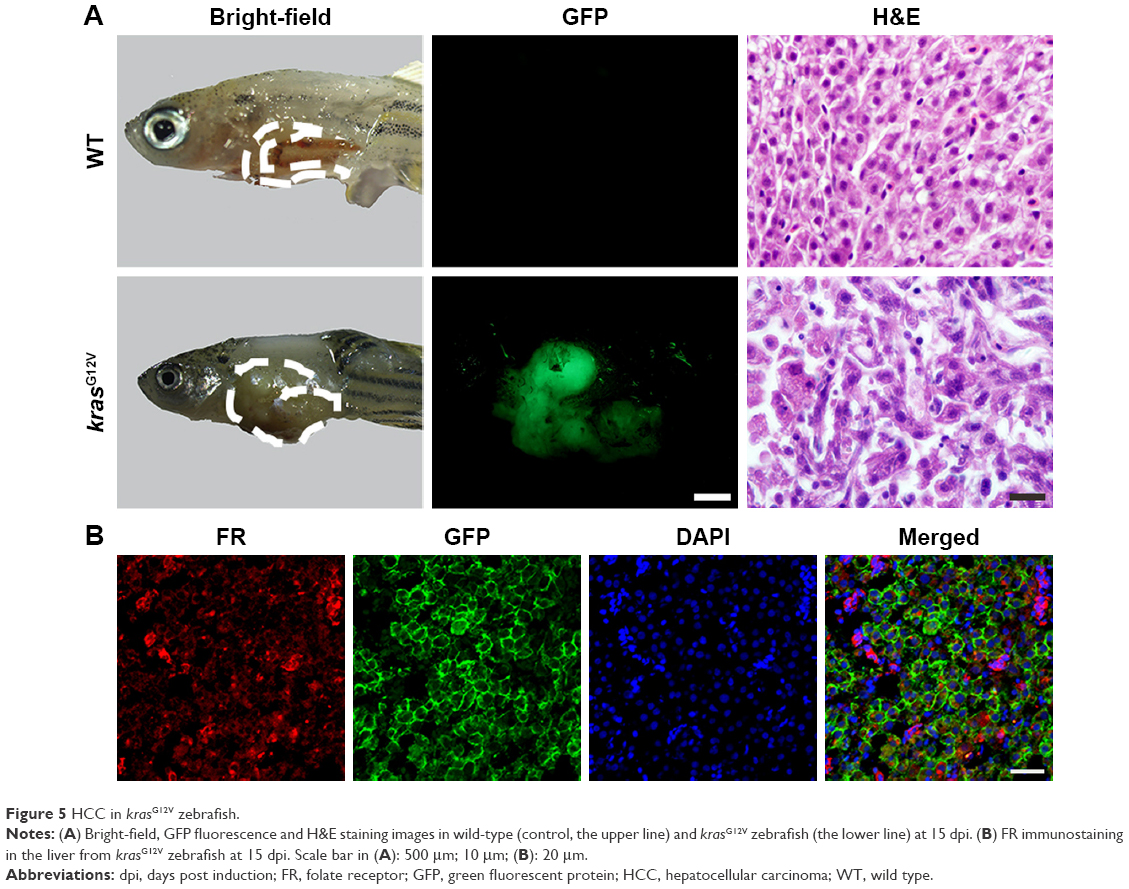 | Figure 5 HCC in krasG12V zebrafish. |
To determine the targeting ability of FA-NPMOFs in vivo, HCC-bearing juveniles were treated with FA-NPMOFs at a concentration of 200 μg/mL for 96 hours. We then dissected the liver and performed DAPI staining on cryosections. A gradual increase in fluorescence signal was observed during the first 48 hours, and then it progressively decreased (Figure 6A). The positive signals from FA-NPMOFs were observed in the cytoplasm and overlapped with the EGFP signals (Figure 6B–D). In negative control group, NPMOFs emitted faint red fluorescence, which located the cytoplasm of HCC tumor cells (Figure S7). At 48 hpt, we performed in vivo and in situ imaging on the same fish by MRI and small animal imaging. Both the T1-weighted and thermal imaging signals were detected in the abdomen of the HCC-bearing fish, respectively (Figure 6E). These data suggest that FA-NPMOFs are specifically delivered and enriched in HCC for at least 48 hours.
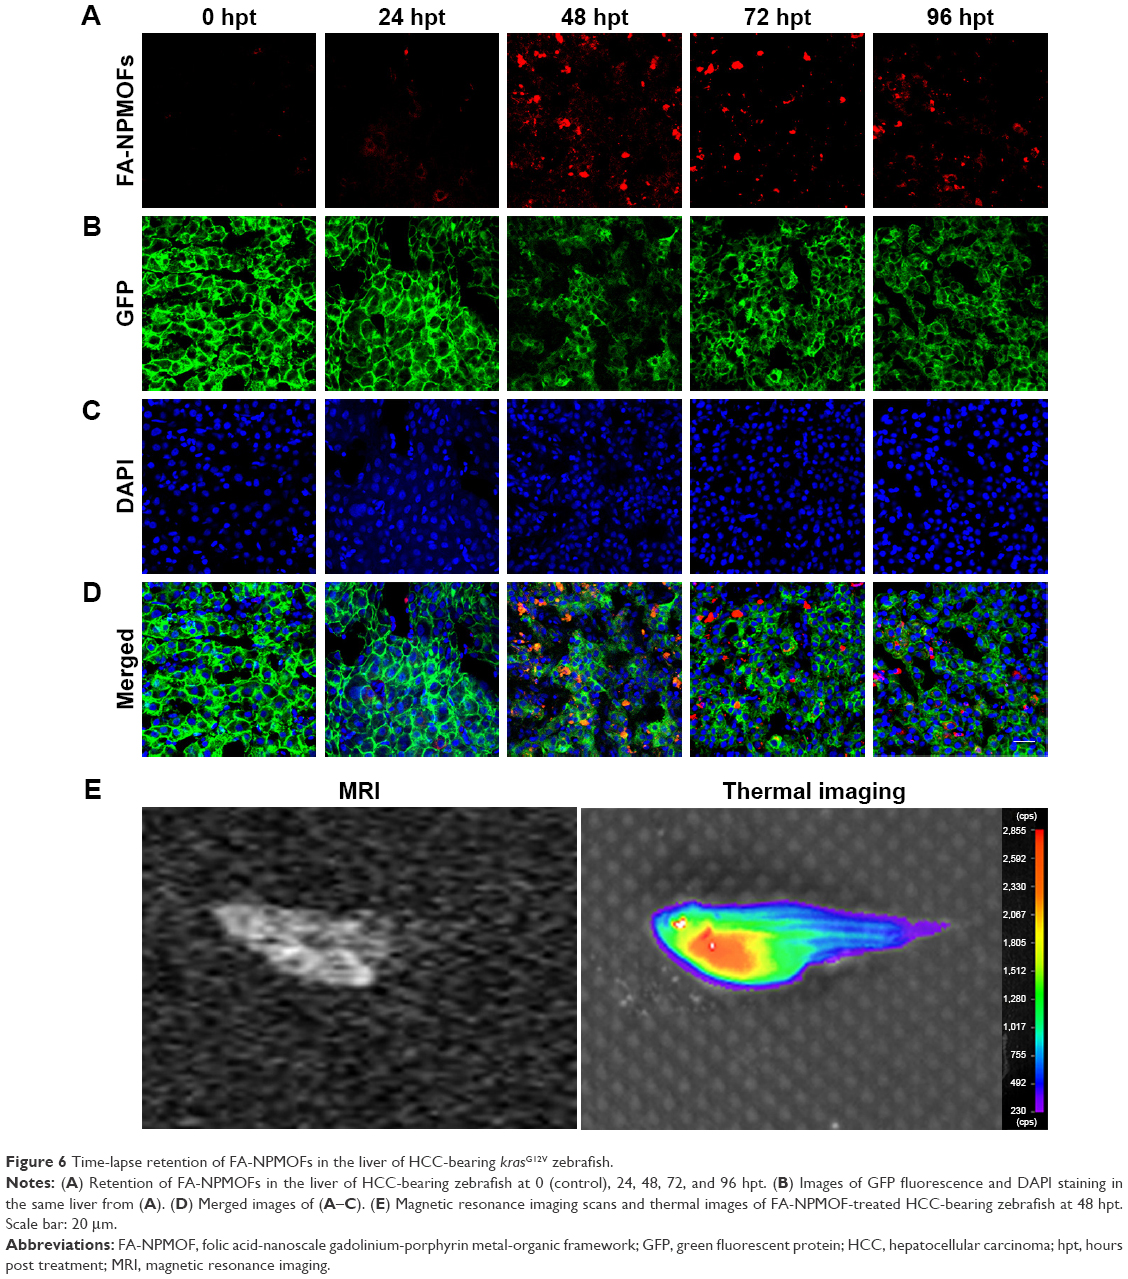 | Figure 6 Time-lapse retention of FA-NPMOFs in the liver of HCC-bearing krasG12V zebrafish. |
Significant tumor shrinkage following laser irradiation via photodynamic effect of FA-NPMOFs
Following 48 hours of treatment with FA-NPMOFs, HCC-bearing fish underwent laser irradiation. The efficiency of PDT was evaluated 48 hours later by EGFP fluorescence, thermal imaging, H&E staining, and tumor volume measurement. Compared to the fish in the FA-NPMOF group, the EGFP-positive area was decreased (Figure 7A) in the PDT group. The scope and intensity of the thermal imaging signals were also reduced in the PDT-treated fish (Figure 7B). H&E staining of liver sections from the PDT-treated fish showed patchy necrosis with inflammatory cell infiltration (Figure 7C). To quantify our findings, we measured the tumors from ten fish in each group (Figure 7D). The tumor volume (22.5±3.6 mm3) in the FA-NPMOF + PDT group was significantly lower than that (48.0±3.6 mm3) in the FA-NPMOF group (Figure 7E; Student’s t-test, ***P<0.001). The above data indicate that the photodynamic effect of FA-NPMOFs leads to tumor shrinkage.
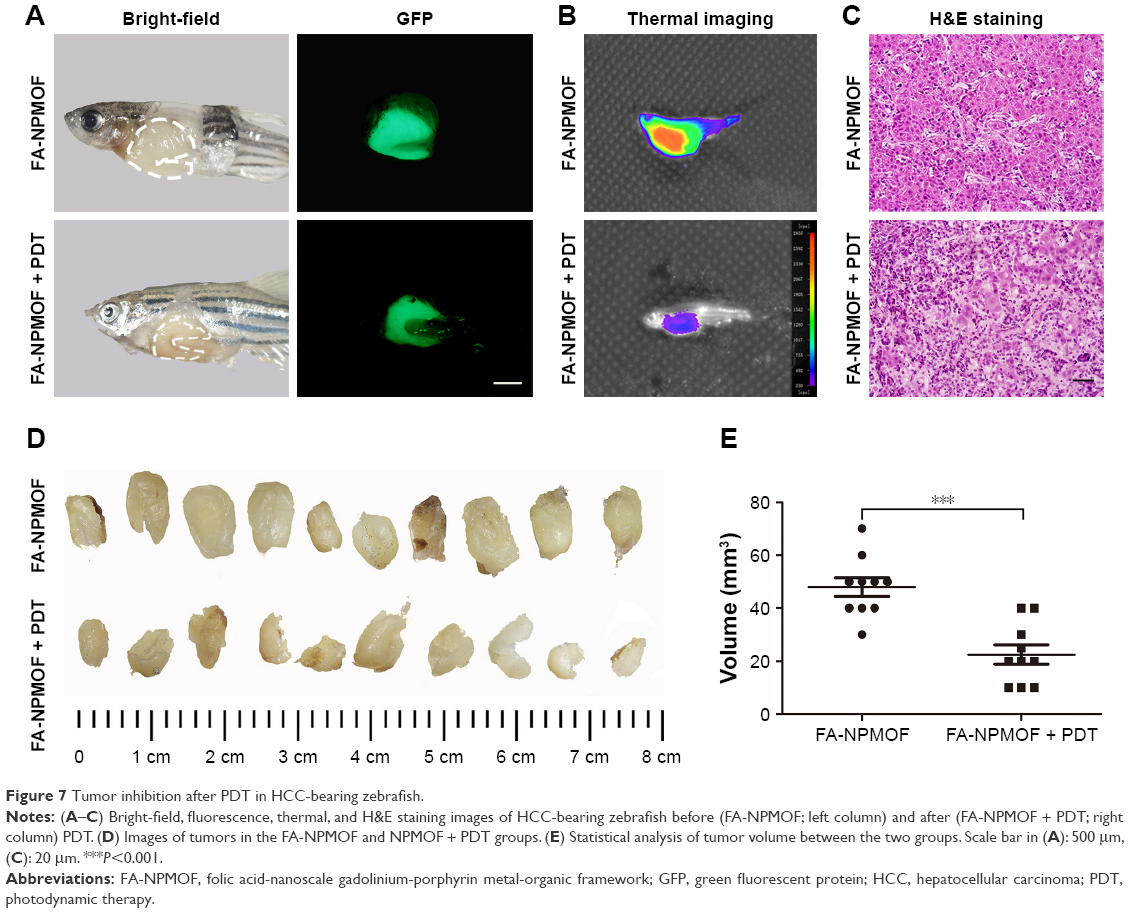 | Figure 7 Tumor inhibition after PDT in HCC-bearing zebrafish. |
Discussion
In the present study, we established and validated a novel theranostic nanoparticle consisting of FA conjugated to Gd-PMOFs for image-guided treatment of HCC. Our design strategy for the FA-NPMOFs was as follows: 1) FA-NPMOFs were synthesized with CTAB as surfactants to confine the rapid growth of MOF. Templates and auxiliary ligand methods were used to achieve nanoscale PMOFs in a microporous emulsion.21 The basic skeleton consisted of TCPP and Gd3+. 2) FA was used for active tumor targeting and selective tumor cell entry. 3) The dispersion of the FA-NPMOFs was improved using PEI-10000, which is hydrophilic and biocompatible and was used as a linker between the targeting and fluorescence units. 4) Porphyrin was used as a theranostic platform for both fluorescence-guided imaging and PDT; porphyrin can provide powerful fluorescence and generate singlet oxygen following irradiation. Previous studies have reported that targeted MOF vectors require the use of dimethyl sulfoxide as a cosolvent;35 however, the nanomaterials we constructed showed good dispersion and water solubility, allowing them to enter tissues and cells.
After confirming the high expression of FR, HepG2 cells were used as an in vitro HCC model. In vitro imaging and MTT assay data revealed two suitable features. First, the FA-NPMOFs could be used for efficient cellular imaging, as the FA-NPMOFs entered the HepG2 cells successfully with the same cellular localization as NPMOFs.36 Second, the decent morphology of FA-NPMOF-exposed cells and the MTT assay results demonstrated the low cytotoxicity of FA-NPMOFs, and the conjugation of NPMOFs with FA did not increase the cytotoxicity. Therefore, these novel nanoparticles exhibited proper cellular localization in tumor cells with minimal toxic side effects in vitro.
Pores in the chorion of zebrafish embryos are ~600 nm in diameter.25 The FA-NPMOFs are ~200 nm in diameter; thus, they can enter zebrafish embryos via the chorion pores. As there is no septum between the cells and yolk in early-stage zebrafish embryos, FA-NPMOFs invaded either the cells or yolk and dispersed throughout the embryo.37 Hence, the red fluorescence emitted from FA-NPMOFs was roughly uniformed in each embryo at all concentrations. Malformations, mortality, and hatching are the key variables used for measuring the toxicity of nanoparticles in zebrafish models.38,39 Following exposure to FA-NPMOFs, the embryos exhibited an approximately normal phenotype with no obvious changes in either the survival rate or the hatching rate. Therefore, the biotoxicity resulting from short-term exposure to FA-NPMOFs was low. The in vivo imaging of FA-NPMOFs was first evaluated in embryos. On the one hand, the synthetic FA-NPMOFs emitted red fluorescence due to the properties of porphyrin. On the other hand, the FA-NPMOFs also have potential as a T1-weighted MRI contrast agent because of the strong paramagnetism of Gd3+. Therefore, the FA-NPMOFs have an excellent capability for fluorescence and MRI dual-modality imaging. The in vivo imaging of FA-NPMOFs was further observed in larvae. Larvae at 5 dpf become active and begin to prey; meanwhile, the gastrointestinal tract has begun preliminary function.40,41 Therefore, we selected 5 dpf as the time point to observe the distribution of FA-NPMOFs. Except the kidney, normal tissues do not seem to concentrate folate conjugates.42 The expression level of FR in the heart, lungs, liver, intestines, and brain tissue is also very low.43 The FA-NPMOFs gathered in the gastrointestinal tract, similar to other MOFs.44 We speculated that the FA-NPMOFs were excreted through the digestive tract or the kidneys.
This study used the Tet-on zebrafish HCC model driven by carcinogenic kras signaling.11 The dose of doxycycline was set at 60 μg/mL because this dose did not cause the mass death of 1-month-old juveniles. The formation of HCC was confirmed in three ways: 1) following induction for 15 days, the liver was enlarged with an obvious atypical morphology. 2) FR was overexpressed in HCC cells compared to the normal hepatocytes. In our model, FR was highly expressed in the liver in doxycycline-treated juveniles. 3) In krasG12V fish, EGFP was expressed when the kras gene was activated, and only the HCC cells could spontaneously and stably exhibit strong green fluorescence. Our data illustrated that a reliable HCC model was fully developed following 15 days of induction with doxycycline.
In this study, we accomplished actively and passively targeted FA-NPMOF delivery in an HCC zebrafish model. On the one hand, we designed FA-NPMOFs based on a receptor–ligand interaction. Because FR was highly expressed in HCC, the FA-NPMOFs entered the tumor cells via receptor-mediated endocytosis, which was applied for active targeting.45 On the other hand, the enrichment of FA-NPMOFs in tumor sites partially occurred due to the enhanced permeability and retention (EPR) effect, which is a tumor-specific characteristic that contributes to the basis of delivery by passive targeting.46 In the present study, we set the negative control both in vitro and in vivo. HepG2 cells or HCC-bearing zebrafish were only exposed to NPMOFs and weak signals were detected in cells or tumor tissue. This approach was an ideal and effective way to accomplish active targeting further enhanced by the EPR effect. Whether nanoparticles could be easily taken up by the mononuclear phagocyte system is also an important factor that depends on the size and hydrophobicity of the nanoparticles.47 Nanoparticles between 10 and 200 nm in size are small enough to evade phagocytosis by the reticuloendothelial system. These particles may penetrate capillaries and exhibit long plasma circulation times, allowing them to achieve the most effective distribution in a particular tissue.48,49 Our FA-NPMOFs were equipped with a hydrophilic layer and had a size that was suitable for avoiding phagocytosis. Thus, FA-NPMOFs accumulated in the tumor site due to the combination of active targeting and the EPR effect.
PDT is a form of phototherapy that involves light and a photosensitizer and is used in conjunction with oxygen to elicit cell death. In FA-NPMOFs, porphyrin was not only used for fluorescence imaging but also acted as a photosensitizer. Tumor tissues exhibit preferential porphyrin uptake. Moreover, the retention of porphyrin in tumor tissues is longer than that in normal tissues.50 This preferential tumor accumulation with a long retention time suggested the tremendous advantage of FA-NPMOFs for clinical applications. After a sufficient amount of porphyrin accumulated in the tumor tissue, the porphyrin was activated by exposure to light at a specific wavelength, generating enough singlet oxygen to exert a toxic effect on tumor cells rather than damaging the neighboring tissue. This process is the underlying mechanism of porphyrin-based PDT.51 Remarkable HepG2 cell death was observed after PDT with the FA-NPMOFs. In the zebrafish, the HCC cells underwent necrosis, which triggered an inflammatory reaction. The therapeutic efficacy was also validated by EGFP fluorescence, thermal imaging, and tumor shrinkage. Hence, the FA-NPMOFs played therapeutic role both in vitro and in vivo.
Conclusion
In summary, we synthesized and validated novel low-toxicity nanoparticles consisting of FA conjugated to Gd-PMOFs that actively and passively target tumor tissue. The FA-NPMOFs offer a dual-theranostic platform: 1) it can be detected by both fluorescence and magnetic resonance in vitro and in vivo. 2) It can specifically recognize FR-positive cells; once in the cell it can enable PDT and induce damage to the malignant cells. This property may accelerate drug onset and reduce side effects. FA-NPMOFs are potential carriers that can be used for the development of new treatments for HCC and other FR-positive tumors.
Acknowledgments
The authors thank Dr Zhiyuan Gong (Molecular Biology Laboratory, Department of Biological Sciences, National University of Singapore, Singapore) for providing transgenic zebrafish Tg (fabp10:rtTA2s-M2; TRE2:EGFP-krasG12V) (krasG12V). This work was supported by the Chinese National Natural Science Foundation (81671179 and 81600397) and, the National Key R&D Program of China (2017YFA0103201).
Disclosure
The authors report no conflicts of interest in this work.
References
Dengler M, Staufer K, Huber H, et al. Soluble Axl is an accurate biomarker of cirrhosis and hepatocellular carcinoma development: results from a large scale multicenter analysis. Oncotarget. 2017;8(28):46234–46248. | ||
Chen JG, Zhang SW. Liver cancer epidemic in China: past, present and future. Semin Cancer Biol. 2011;21(1):59–69. | ||
Pham DH, De Roo B, Nguyen XB, et al. Use of Zebrafish larvae as a multi-endpoint platform to characterize the toxicity profile of silica nanoparticles. Sci Rep. 2016;6:37145. | ||
Li L, Bonneton F, Tohme M, Bernard L, Chen XY, Laudet V. In vivo screening using transgenic Zebrafish embryos reveals new effects of HDAC inhibitors trichostatin A and valproic acid on organogenesis. PLoS One. 2016;11(2):e0149497. | ||
Laughlin ST, Baskin JM, Amacher SL, Bertozzi CR. In vivo imaging of membrane-associated glycans in developing zebrafish. Science. 2008;320(5876):664–667. | ||
Ko SK, Chen X, Yoon J, Shin I. Zebrafish as a good vertebrate model for molecular imaging using fluorescent probes. Chem Soc Rev. 2011;40(5):2120–2130. | ||
White R, Rose K, Zon L. Zebrafish cancer: the state of the art and the path forward. Nat Rev Cancer. 2013;13(9):624–636. | ||
Ceol CJ, Houvras Y, Jane-Valbuena J, et al. The histone methyltransferase SETDB1 is recurrently amplified in melanoma and accelerates its onset. Nature. 2011;471(7339):513–517. | ||
Langenau DM, Traver D, Ferrando AA, et al. Myc-induced T cell leukemia in transgenic zebrafish. Science. 2003;299(5608):887–890. | ||
Chew TW, Liu XJ, Liu L, Spitsbergen JM, Gong Z, Low BC. Crosstalk of Ras and Rho: activation of RhoA abates Kras-induced liver tumorigenesis in transgenic zebrafish models. Oncogene. 2014;33(21):2717–2727. | ||
Nguyen AT, Emelyanov A, Koh CH, et al. A high level of liver-specific expression of oncogenic Kras(V12) drives robust liver tumorigenesis in transgenic zebrafish. Dis Model Mech. 2011;4(6):801–813. | ||
Du C, Deng D, Shan L, et al. A pH-sensitive doxorubicin prodrug based on folate-conjugated BSA for tumor-targeted drug delivery. Biomaterials. 2013;34(12):3087–3097. | ||
Crider KS, Yang TP, Berry RJ, Bailey LB. Folate and DNA methylation: a review of molecular mechanisms and the evidence for folate’s role. Adv Nutr. 2012;3(1):21–38. | ||
Zhao X, Li H, Lee RJ. Targeted drug delivery via folate receptors. Expert Opin Drug Deliv. 2008;5(3):309–319. | ||
Wu MX, Yang YW. Metal-organic framework (MOF)-based drug/cargo delivery and cancer therapy. Adv Mater. 2017;29(23):1606134. | ||
Gao W, Xing F, Zhou D, Shao M, Zhu S. Novel MOFs with tetrahedral cavity assembled from 4,4′,4″-s-triazine-2,4,6-triyltribenzoic acid (H3TATB). Inorg Chem Commun. 2011;14(4):601–605. | ||
Zheng H, Zhang Y, Liu L, et al. One-pot synthesis of metal-organic frameworks with encapsulated target molecules and their applications for controlled drug delivery. J Am Chem Soc. 2016;138(3):962–968. | ||
Cai W, Chu CC, Liu G, Wáng YX. Metal-organic framework-based nanomedicine platforms for drug delivery and molecular imaging. Small. 2015;11(37):4806–4822. | ||
Lu K, He C, Lin W. Nanoscale metal-organic framework for highly effective photodynamic therapy of resistant head and neck cancer. J Am Chem Soc. 2014;136(48):16712–16715. | ||
Rogosnitzky M, Branch S. Gadolinium-based contrast agent toxicity: a review of known and proposed mechanisms. Biometals. 2016;29(3):365–376. | ||
Liu W, Wang YM, Li YH, et al. Fluorescent imaging-guided chemotherapy-and-photodynamic dual therapy with nanoscale porphyrin metal-organic framework. Small. 2017;13(17):1603459. | ||
Buschmann J. The OECD guidelines for the testing of chemicals and pesticides. Methods Mol Biol. 2013;947:37–56. | ||
Gourmelon A, Delrue N. Validation in support of internationally harmonised OECD test guidelines for assessing the safety of chemicals. Adv Exp Med Biol. 2016;856:9–32. | ||
Monette MM, Evans DL, Krunkosky T, Camus A, Jaso-Friedmann L. Nonspecific cytotoxic cell antimicrobial protein (NCAMP-1): a novel alarmin ligand identified in zebrafish. PLoS One. 2015;10(2):e0116576. | ||
Sun Y, Zhang G, He Z, Wang Y, Cui J, Li Y. Effects of copper oxide nanoparticles on developing zebrafish embryos and larvae. Int J Nanomedicine. 2016;11:905–918. | ||
Nguyen AT, Emelyanov A, Koh CH, Spitsbergen JM, Parinov S, Gong Z. An inducible kras(V12) transgenic zebrafish model for liver tumorigenesis and chemical drug screening. Dis Model Mech. 2012;5(1):63–72. | ||
Maeng JH, Lee DH, Jung KH, et al. Multifunctional doxorubicin loaded superparamagnetic iron oxide nanoparticles for chemotherapy and magnetic resonance imaging in liver cancer. Biomaterials. 2010;31(18):4995–5006. | ||
Liang L, Zhang X, Su X, et al. 99mTc-labeled oligomeric nanoparticles as potential agents for folate receptor-positive tumor targeting. J Labelled Comp Radiopharm. 2018;61(2):54–60. | ||
Kimmel CB, Ballard WW, Kimmel SR, Ullmann B, Schilling TF. Stages of embryonic development of the zebrafish. Dev Dyn. 1995;203(3):253–310. | ||
Spitsbergen JM, Buhler DR, Peterson TS. Neoplasia and neoplasm-associated lesions in laboratory colonies of zebrafish emphasizing key influences of diet and aquaculture system design. ILAR J. 2012;53(2):114–125. | ||
Goessling W, Sadler KC. Zebrafish: an important tool for liver disease research. Gastroenterology. 2015;149(6):1361–1377. | ||
Lam SH, Wu YL, Vega VB, et al. Conservation of gene expression signatures between zebrafish and human liver tumors and tumor progression. Nat Biotechnol. 2006;24(1):73–75. | ||
Li Z, Huang X, Zhan H, et al. Inducible and repressable oncogene-addicted hepatocellular carcinoma in Tet-on xmrk transgenic zebrafish. J Hepatol. 2012;56(2):419–425. | ||
Yan C, Huo X, Wang S, Feng Y, Gong Z. Stimulation of hepatocarcinogenesis by neutrophils upon induction of oncogenic kras expression in transgenic zebrafish. J Hepatol. 2015;63(2):420–428. | ||
Qiao J, Dong P, Mu X, Qi L, Xiao R. Folic acid-conjugated fluorescent polymer for up-regulation folate receptor expression study via targeted imaging of tumor cells. Biosens Bioelectron. 2016;78:147–153. | ||
Park J, Jiang Q, Feng D, Mao L, Zhou HC. Size-controlled synthesis of porphyrinic metal-organic framework and functionalization for targeted photodynamic therapy. J Am Chem Soc. 2016;138(10):3518–3525. | ||
Stainier DYR, Raz E, Lawson ND, et al. Guidelines for morpholino use in zebrafish. PLoS Genet. 2017;13(10):e1007000. | ||
Bugel SM, Tanguay RL, Planchart A. Zebrafish: a marvel of high-throughput biology for 21st century toxicology. Curr Environ Health Rep. 2014;1(4):341–352. | ||
Dang Z, van der Ven LTM, Kienhuis AS. Fish embryo toxicity test, threshold approach, and moribund as approaches to implement 3R principles to the acute fish toxicity test. Chemosphere. 2017;186:677–685. | ||
Otis JP, Zeituni EM, Thierer JH, et al. Zebrafish as a model for apolipoprotein biology: comprehensive expression analysis and a role for ApoA-IV in regulating food intake. Dis Model Mech. 2015;8(3):295–309. | ||
de Alvarenga KAF, Sacramento EK, Rosa DV, Souza BR, de Rezende VB, Romano-Silva MA. Effects of antipsychotics on intestinal motility in zebrafish larvae. Neurogastroenterol Motil. 2017;29(5):e13006–e13006. | ||
Low PS, Henne WA, Doorneweerd DD. Discovery and development of folic-acid-based receptor targeting for imaging and therapy of cancer and inflammatory diseases. Acc Chem Res. 2008;41(1):120–129. | ||
Chen C, Ke J, Zhou XE, et al. Structural basis for molecular recognition of folic acid by folate receptors. Nature. 2013;500(7463):486–489. | ||
Li SY, Cheng H, Qiu WX, et al. Cancer cell membrane-coated biomimetic platform for tumor targeted photodynamic therapy and hypoxia-amplified bioreductive therapy. Biomaterials. 2017;142:149–161. | ||
Glasgow MD, Chougule MB. Recent developments in active tumor targeted multifunctional nanoparticles for combination chemotherapy in cancer treatment and imaging. J Biomed Nanotechnol. 2015;11(11):1859–1898. | ||
Bertrand N, Wu J, Xu X, Kamaly N, Farokhzad OC. Cancer nanotechnology: the impact of passive and active targeting in the era of modern cancer biology. Adv Drug Deliv Rev. 2014;66:2–25. | ||
Pombo García K, Zarschler K, Barbaro L, et al. Zwitterionic-coated “stealth” nanoparticles for biomedical applications: recent advances in countering biomolecular corona formation and uptake by the mononuclear phagocyte system. Small. 2014;10(13):2516–2529. | ||
Nicolas J, Mura S, Brambilla D, Mackiewicz N, Couvreur P. Design, functionalization strategies and biomedical applications of targeted biodegradable/biocompatible polymer-based nanocarriers for drug delivery. Chem Soc Rev. 2013;42(3):1147–1235. | ||
Yu M, Zheng J. Clearance pathways and tumor targeting of imaging nanoparticles. ACS Nano. 2015;9(7):6655–6674. | ||
Muhanna N, Jin CS, Huynh E, et al. Phototheranostic porphyrin nanoparticles enable visualization and targeted treatment of head and neck cancer in clinically relevant models. Theranostics. 2015;5(12):1428–1443. | ||
Celli JP, Spring BQ, Rizvi I, et al. Imaging and photodynamic therapy: mechanisms, monitoring, and optimization. Chem Rev. 2010;110(5):2795–2838. |
Supplementary materials
 | Figure S1 Zeta potential of NPMOF, NPMOF@PEI, and FA-NPMOF. |
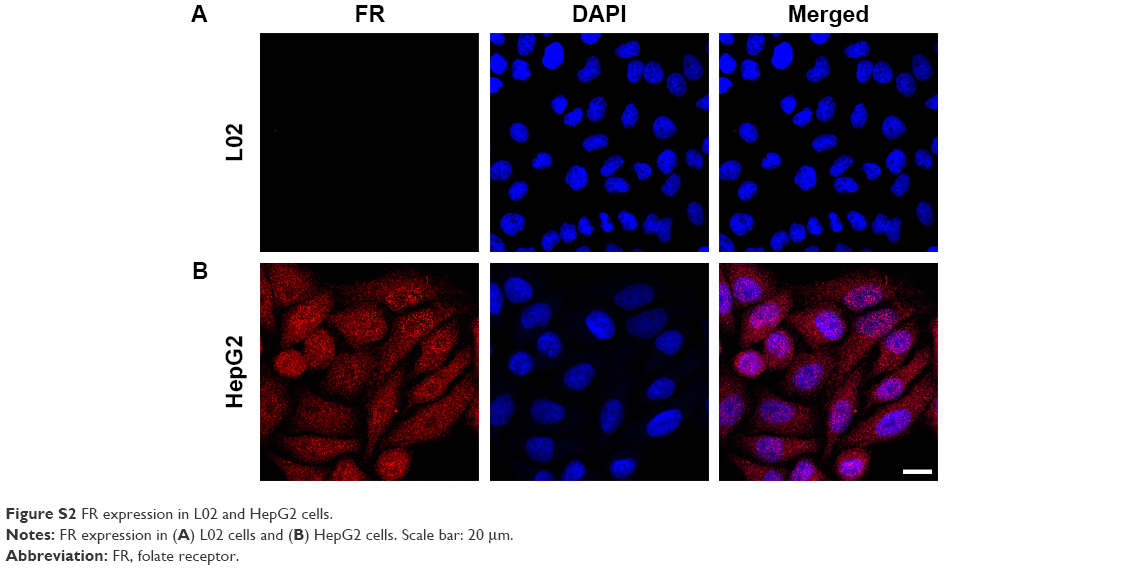 | Figure S2 FR expression in L02 and HepG2 cells. |
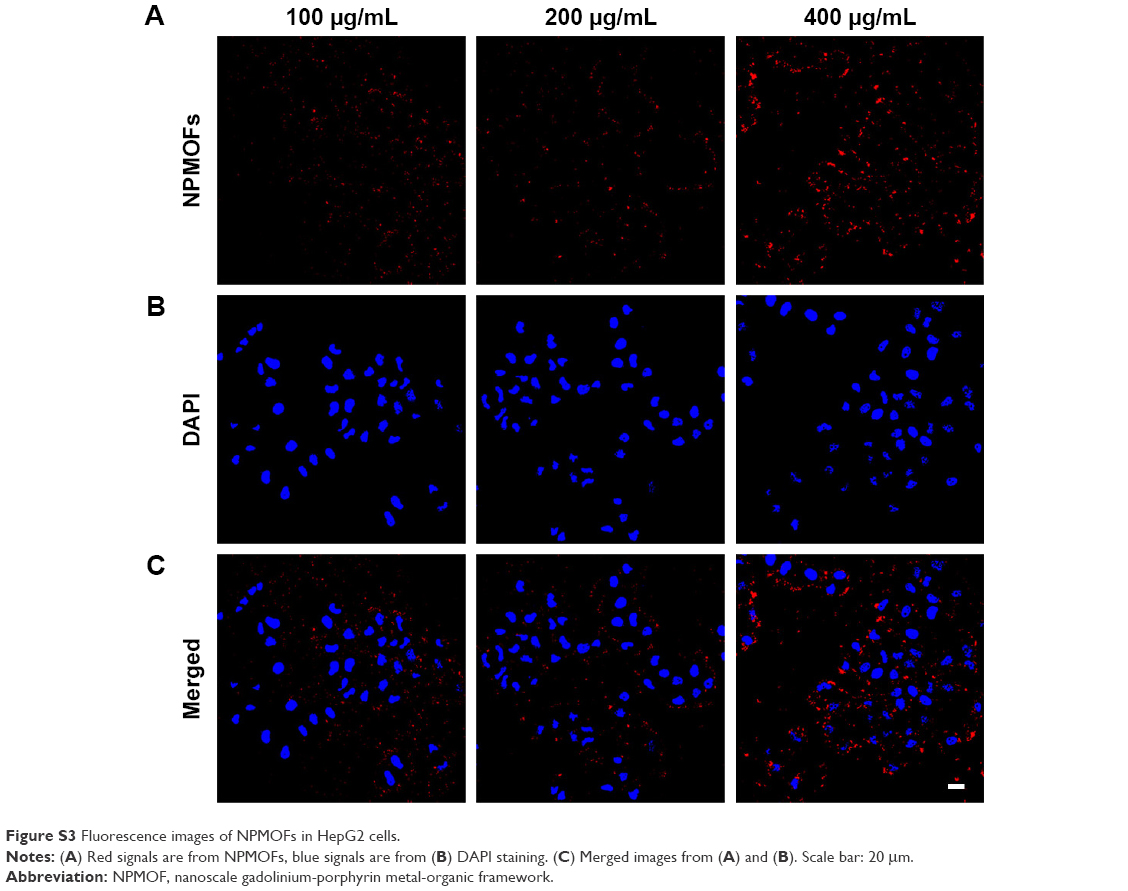 | Figure S3 Fluorescence images of NPMOFs in HepG2 cells. |
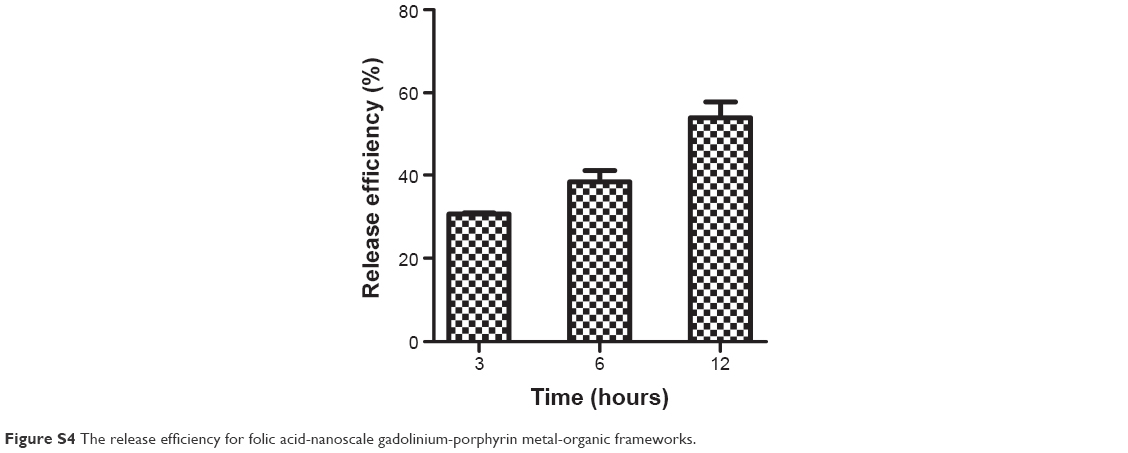 | Figure S4 The release efficiency for folic acid-nanoscale gadolinium-porphyrin metal-organic frameworks. |
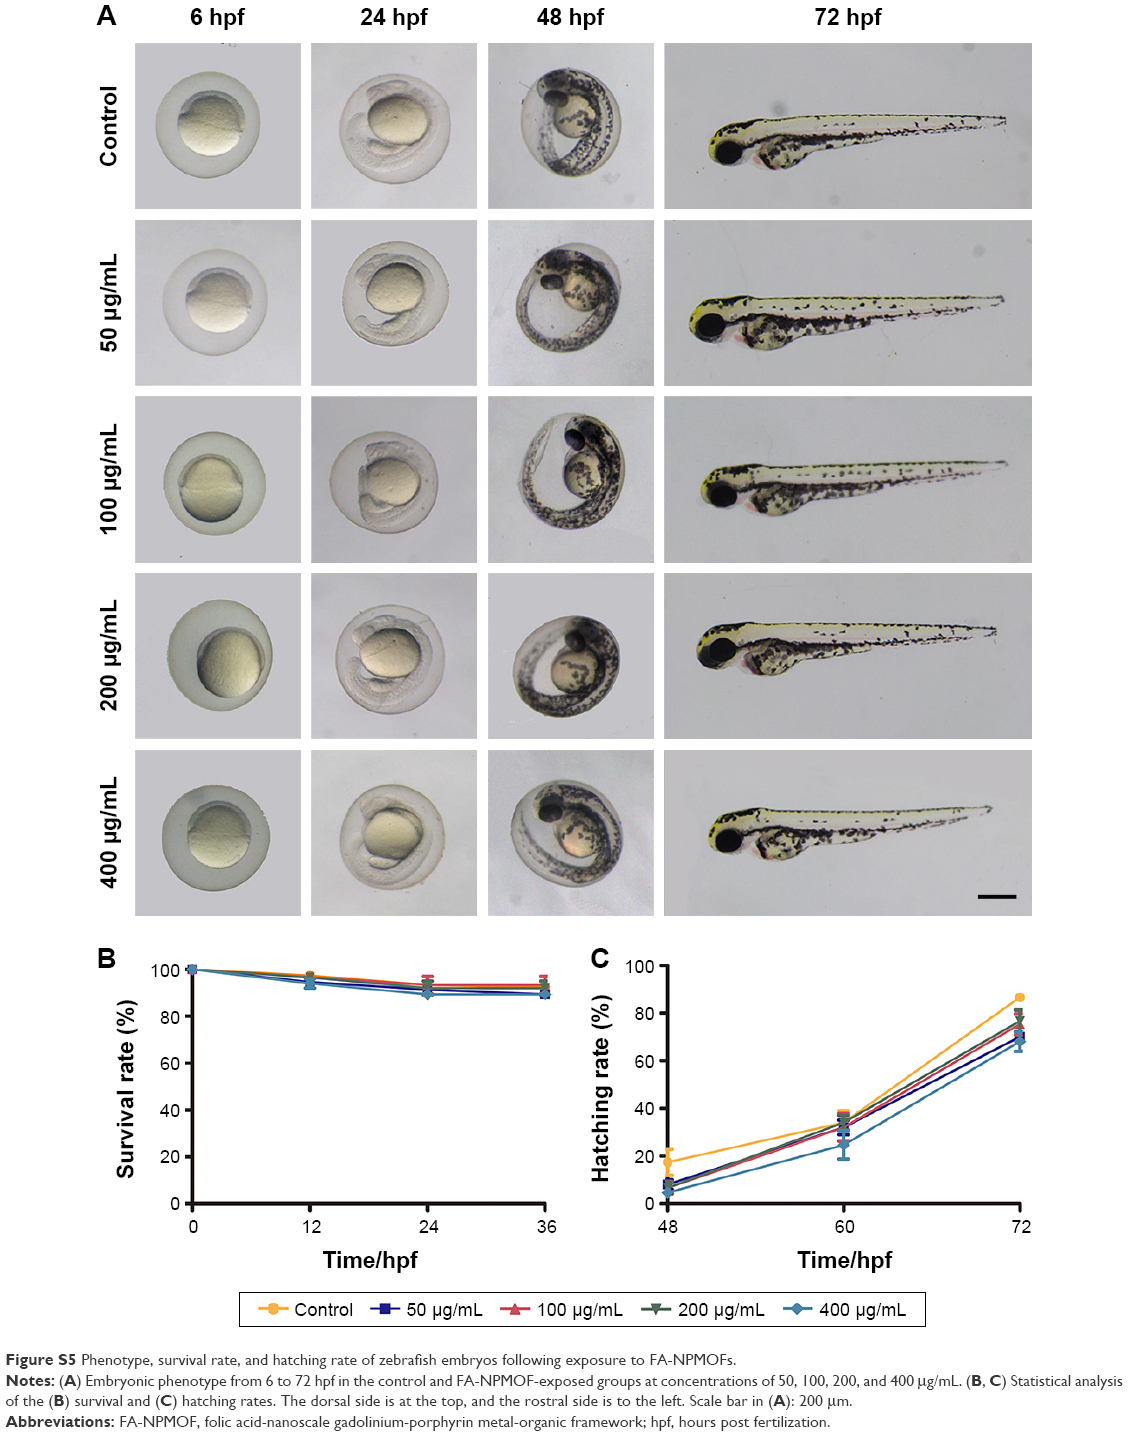 | Figure S5 Phenotype, survival rate, and hatching rate of zebrafish embryos following exposure to FA-NPMOFs. |
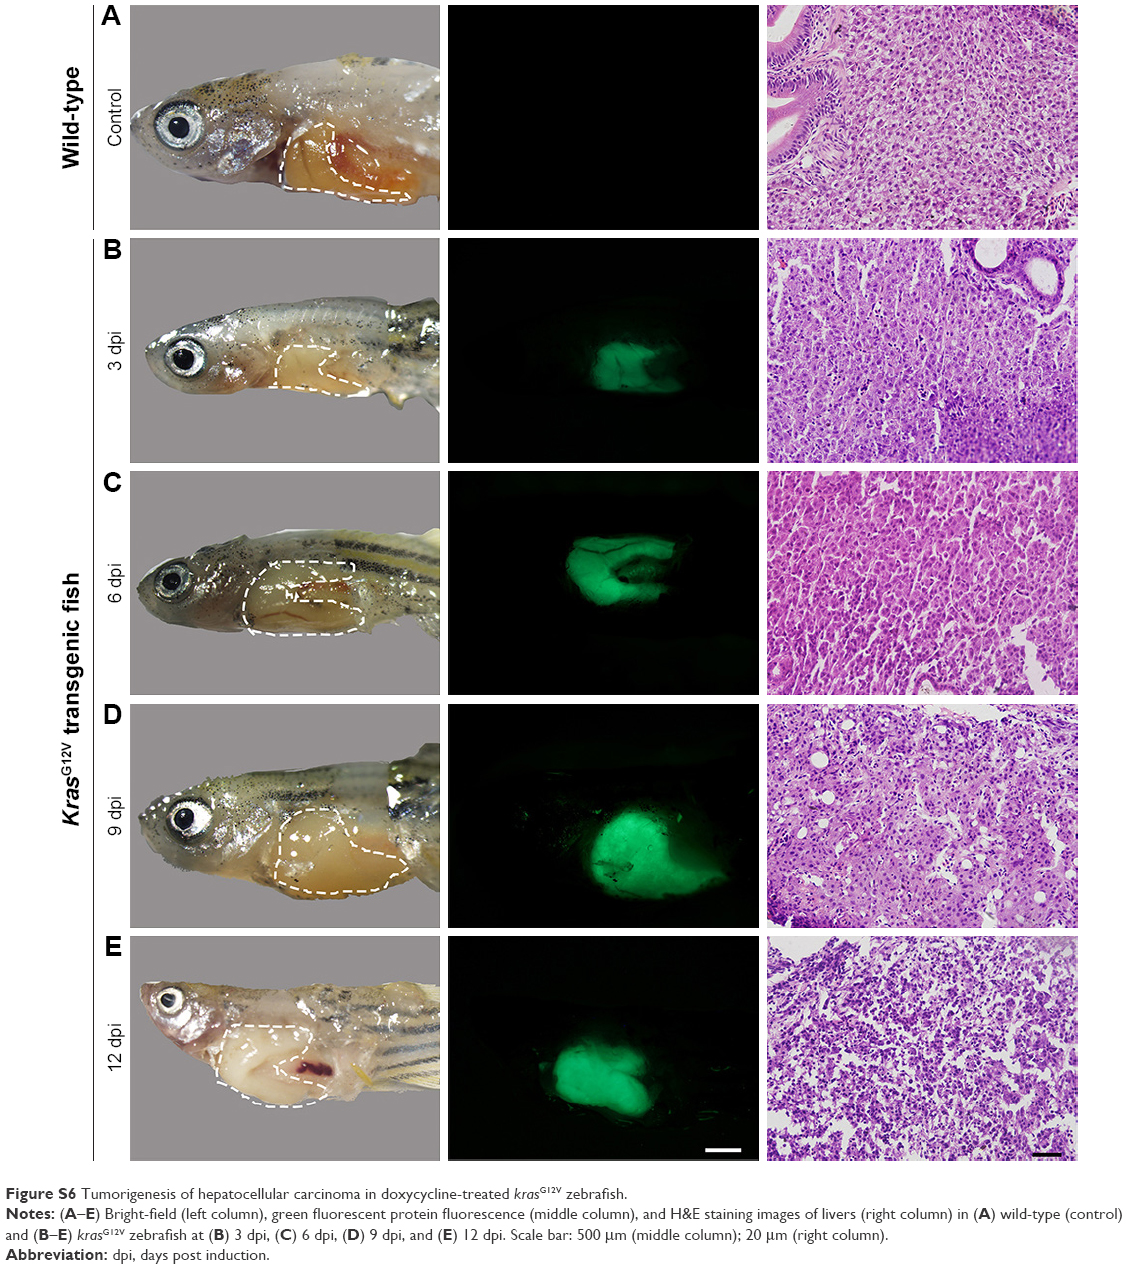 | Figure S6 Tumorigenesis of hepatocellular carcinoma in doxycycline-treated krasG12V zebrafish. |
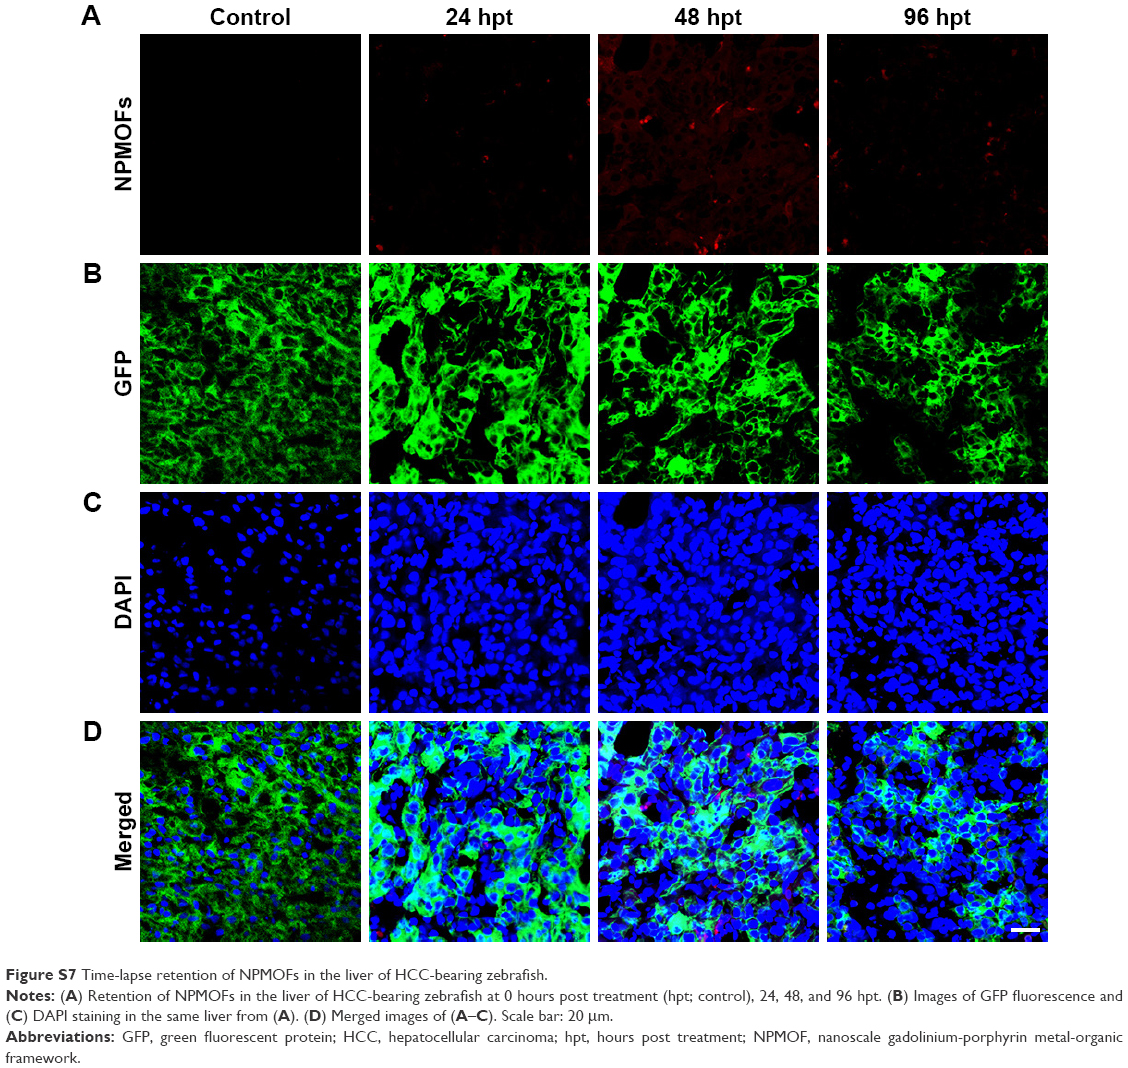 | Figure S7 Time-lapse retention of NPMOFs in the liver of HCC-bearing zebrafish. |
 © 2018 The Author(s). This work is published and licensed by Dove Medical Press Limited. The full terms of this license are available at https://www.dovepress.com/terms.php and incorporate the Creative Commons Attribution - Non Commercial (unported, v3.0) License.
By accessing the work you hereby accept the Terms. Non-commercial uses of the work are permitted without any further permission from Dove Medical Press Limited, provided the work is properly attributed. For permission for commercial use of this work, please see paragraphs 4.2 and 5 of our Terms.
© 2018 The Author(s). This work is published and licensed by Dove Medical Press Limited. The full terms of this license are available at https://www.dovepress.com/terms.php and incorporate the Creative Commons Attribution - Non Commercial (unported, v3.0) License.
By accessing the work you hereby accept the Terms. Non-commercial uses of the work are permitted without any further permission from Dove Medical Press Limited, provided the work is properly attributed. For permission for commercial use of this work, please see paragraphs 4.2 and 5 of our Terms.