")
Back to Journals » Drug Design, Development and Therapy » Volume 9
Exposure–response model for sibutramine and placebo: suggestion for application to long-term weight-control drug development
Authors Han S , Jeon S, Hong T, Lee J, Bae SH, Park W, Park G, Youn S, Jang DY, Kim K, Yim D
Received 25 March 2015
Accepted for publication 29 May 2015
Published 9 September 2015 Volume 2015:9 Pages 5185—5194
DOI https://doi.org/10.2147/DDDT.S85435
Checked for plagiarism Yes
Review by Single anonymous peer review
Peer reviewer comments 4
Editor who approved publication: Prof. Dr. Wei Duan
Seunghoon Han,1,2 Sangil Jeon,1,2 Taegon Hong,1,2 Jongtae Lee,1,2 Soo Hyeon Bae,1,2 Wan-su Park,1,2 Gab-jin Park,1,2 Sunil Youn,1,2 Doo Yeon Jang,1,2 Kyung-Soo Kim,3 Dong-Seok Yim1,2
1Department of Pharmacology, College of Medicine, The Catholic University of Korea, 2Pharmacometrics Institute for Practical Education and Training, 3Department of Family Medicine, Seoul St Mary’s Hospital, Seochogu, Seoul, Republic of Korea
Abstract: No wholly successful weight-control drugs have been developed to date, despite the tremendous demand. We present an exposure–response model of sibutramine mesylate that can be applied during clinical development of other weight-control drugs. Additionally, we provide a model-based evaluation of sibutramine efficacy. Data from a double-blind, randomized, placebo-controlled, multicenter study were used (N=120). Subjects in the treatment arm were initially given 8.37 mg sibutramine base daily, and those who lost <2 kg after 4 weeks’ treatment were escalated to 12.55 mg. The duration of treatment was 24 weeks. Drug concentration and body weight were measured predose and at 4 weeks, 8 weeks, and 24 weeks after treatment initiation. Exposure and response to sibutramine, including the placebo effect, were modeled using NONMEM 7.2. An asymptotic model approaching the final body weight was chosen to describe the time course of weight loss. Extent of weight loss was described successfully using a sigmoidal exposure–response relationship of the drug with a constant placebo effect in each individual. The placebo effect was influenced by subjects’ sex and baseline body mass index. Maximal weight loss was predicted to occur around 1 year after treatment initiation. The difference in mean weight loss between the sibutramine (daily 12.55 mg) and placebo groups was predicted to be 4.5% in a simulation of 1 year of treatment, with considerable overlap of prediction intervals. Our exposure–response model, which included the placebo effect, is the first example of a quantitative model that can be used to predict the efficacy of weight-control drugs. Similar approaches can help decision-making during clinical development of novel weight-loss drugs.
Keywords: weight-reducing drugs, obesity, pharmacokinetics, pharmacodynamics
Introduction
Pharmaceutical companies have made numerous attempts over several decades to develop weight-control drugs because obesity is a major health problem that is increasing in prevalence in many countries.1–3 Unfortunately, efforts thus far have not been completely successful; only orlistat remains prescribable after withdrawal of sibutramine due to its cardiovascular toxicity that was ruled to overweigh its clinical effectiveness in 2010.4,5 Recently, however, the limits to treatment duration with Belviq® (lorcaserin HCl) and Qsymia® (phentermine and topiramate extended release) were lifted by the US Food and Drug Administration to enable long-term prescription.
Nevertheless, because of the large market size, many pharmaceutical companies still believe that the production of weight-control drugs is promising and they have active weight loss drug development pipelines. By 2012, more than ten candidates were under clinical development with targeted approval as either monotherapy or combination drugs.6 However, judging from the failures in the past, we argue that the weight-control drug development process needs to be more productive and efficient. A learn-confirm paradigm based on exposure–response models7–9 may help, but have never been reported for weight-control drugs.
In this context, we provide an example of an exposure–response model that takes the placebo effect into account and describes the time course of weight reduction in response to drug treatment. We used existing data for sibutramine that were obtained in a clinical trial to assess the effect of a salt-replaced formulation of sibutramine (sibutramine mesylate), a centrally acting serotonin–norepinephrine reuptake inhibitor, on weight reduction in obese patients. Sibutramine was selected because the drug was the most widely used long-term weight-control drug in Korea until the time of withdrawal, which had relatively abundant clinical data and empirical reevaluation on the clinical effectiveness may be meaningful for the risk–benefit considerations on the withdrawal is still controversial.4,5 By doing so, we were to also exemplify the application of model for the prediction of clinical outcome using data from relatively short or small clinical trials.
Methods and procedures
Inclusion and exclusion criteria
Abdominal obesity (waist circumference ≥90 cm in men or ≥85 cm in women, by the Korean Society for the Study of Obesity) patients with metabolic syndrome according to the adult treatment panel (ATP) III definition, aged 18–65 years, without clinically significant hypertension, diabetes, or any underlying disease causing obesity were eligible for inclusion. Subjects taking any drugs that can affect body weight or the pharmacokinetic (PK) or pharmacodynamic (PD) properties of sibutramine were excluded. Finally, 120 subjects were enrolled (Table 1).
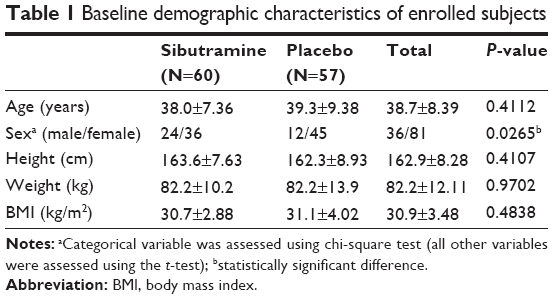 | Table 1 Baseline demographic characteristics of enrolled subjects |
Study design
A double-blind, randomized, placebo-controlled, multicenter clinical study was conducted in eight hospitals (Seoul St Mary’s Hospital, Yeouido St Mary’s Hospital, St Paul’s Hospital, Uijeongbu St Mary’s Hospital, St Vincent’s Hospital, Daejeon St Mary’s Hospital, Bucheon St Mary’s Hospital, and Incheon St Mary’s Hospital). The study had a parallel design with two arms and an equal number of subjects were initially allocated to each arm. The treatment arm received 11.51 mg sibutramine mesylate daily (equivalent to 8.37 mg sibutramine base, identical amount included in Reductil® 10 mg tablet as sibutramine hydrochloride monohydrate) for 4 weeks initially, and this dose was maintained if body weight decreased by ≥2 kg. If weight loss was insufficient (<2 kg), the dose was escalated to 17.26 mg daily (equivalent to 12.55 mg sibutramine base and 15 mg sibutramine hydrochloride monohydrate) until study completion (24 weeks). This titration scheme was also applied to patients receiving placebo. Subjects’ body weights were assessed every 4 weeks from the initiation of treatment until study completion. The trial was designed and monitored in accordance with the good clinical practice guidelines of Korea and with the principles of the Declaration of Helsinki. Independent institutional review boards at each study site approved the protocol before execution of the trial, and all participants provided written informed consent.
Study procedures
Subject control
All subjects maintained their usual exercise and physical activity during the study period. Dietary guidelines (500–600 kcal/day less than initial intake for each subject) were provided to subjects and the entire dietary intake was recorded using the 24-hour dietary recall method. Concomitant use of drugs that could affect the PK or PD of sibutramine, including any CYP3A4 inhibitors, cimetidine, monoamine oxidase inhibitors (MAO-Is), antidepressants, antidiabetics except biguanides, and other oral anorexiants, was prohibited.
Blood sampling
Whole-blood samples were obtained for PK analysis. Samples consisting of 10 mL peripheral venous blood were collected into heparinized tubes just before the initial dose and the dose given at week 24. At weeks 4 and 8, single sampling (before noon at week 4, in the afternoon at week 8) was performed after drug administration in the morning, and the exact dosing and sampling times were recorded. Samples were immediately shaded and cooled in an ice bath. After centrifugation (3,000 rpm, 4°C, 10 minutes), 4 mL of plasma from each sample was stored in microtubes (1 mL each) at −20°C until assayed.
Plasma concentration measurements
Plasma samples were analyzed using liquid chromatography coupled with tandem mass spectrometry (API 3200, ABSciex, Framingham, MA, USA) according to the method of Jain et al.10 Because sibutramine is an inactive prodrug that is rapidly converted through first-pass metabolism to its main active metabolites M1 (N-{1-[1-(4-chlorophenyl)cyclobutyl]-3-methylbutyl}-N-methylamine) and then M2 (1-[1-(4-chlorophenyl)cyclobutyl]-3-methylbutylamine) to exert its pharmacological activity,11–13 only the concentrations of M1 and M2 were measured. Quality control (QC) samples were prepared with nominal concentrations of 0.15 ng/mL, 2.5 ng/mL, 40 ng/mL M1 and 0.3 ng/mL, 2.5 ng/mL, and 40 ng/mL M2. Lower limit of quantification was 0.05 ng/mL for M1 and 0.1 ng/mL for M2. The correlation coefficients of calibration curves for M1 and M2 were 0.9996 and 0.9992, respectively. Intra- and interbatch precision (>10% coefficient of variation [CV]) and accuracy (90.9%–107.0%) were acceptable at all QC concentrations.
Model development
A mixed effect analysis was performed using NONMEM (version 7.2; Icon Development Solution, Ellicott City, MD, USA).
Dataset
The dataset for PK analysis basically consisted of the concentration observations from the clinical study (422 observations from 61 subjects – 211 for each metabolite). To facilitate PK model development, data from a previous full PK study (416 observations from 16 young healthy subjects – 208 for each metabolite) for the same formulation were added to the PK dataset to address the sparseness of our observations.14 Due to the heterogeneity of subjects included in the merged dataset, an indicator variable (ISP) to differentiate between patients and healthy subjects was used. This variable was then tested for its effect on PK and PD parameters like other covariates in the model-building process. For PD evaluation, all body weight measurements over the 24-week study period were used as dependent variables. Demographic characteristics (except body weight) of the subjects, such as height, body mass index (BMI), age, and sex (Table 1) as well as subject genotypes for 5-HT2C receptor, 5-HT transporter, G protein β3, and α2-adrenoceptor were tested during model building.
Model building
PK models for sibutramine metabolites were built based on the metabolic pathway of sibutramine. Instead of sibutramine, the inactive prodrug M1 was assumed to be given orally and converted to M2 thereafter. For each metabolite, one-compartment vs multicompartment models were compared. Drug disposition was assumed to follow first-order kinetics. Between-subject variability (BSV, ηi) to find individual parameters (Pi) in relation to population parameters for each PK and PD parameter was tested in the model building process, where the BSV (ηi) for each parameter followed a Gaussian distribution with a mean of 0 and different variance values (described using the symbol ω2). A combined (ie, additive and proportional) error model was initially applied to describe the residual error, including intraindividual variability and measurement error, as follows:
DVij = DVipred,ij (1+ εprop,ij) + εadd,ij |
where DVij is the jth measured metabolite concentration in the ith individual, DVipred,ij is the jth predicted value in the ith individual, and εprop,ij and εadd,ij are the residual variability with means of 0 and variances of σprop2 and σadd2, respectively. Correlations between random variables in the model were explored using the $COVARIANCE block. PD model was developed to describe the relationship between the sum of the estimated area under the concentration curve at steady state (AUCss,sum) of M1 and M2 from the PK model and weight loss as the drug effect. AUCss,sum was calculated as follows:
|
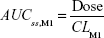
|
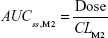
AUCss,sum = AUCss,M1 + AUCss,M2 |
where CLM1 and CLM2 are the clearance of M1 and M2, respectively. Final PD model was chosen after comparing several different drug and placebo effect models to explain the relationship between AUCss,sum and body weight changes over time. BSV and residual error were included and the appropriateness of the model was evaluated using the same scheme as that used for the PK model.
As the next step, covariate analysis was performed using the basic PK–PD model built as described earlier. First, all demographic and genetic variables included in the dataset were screened visually and numerically. Visual screening was done via parameter versus covariate scatterplots and the numerical step used general additive modeling procedures. Variables selected from one of the screening steps were included in the model and then we tested whether the model was significantly improved when a candidate covariate was assumed to have a certain relationship with any PK–PD parameter. A forward selection–backward elimination procedure was implemented with a significance level of 0.05.
First-order conditional estimation with interaction approximation method was chosen for all estimation processes. Appropriateness of models was evaluated comprehensively based upon various goodness-of-fit criteria, including visual comparison of diagnostic scatter plots, likelihood ratio tests, and measures of model stability or adequacy (ie, condition number, successful convergence, significant digits, matrix singularity). Likelihood ratio tests results were considered statistically significant if decreases in the objective function value were more than the cut-off points equivalent to a P-value of 0.05 (ie, 3.84 for df=1, 5.99 for df=2, etc).
Model evaluation and simulation
To evaluate parameter values obtained from the final model, bootstrap-resampled datasets (250 for the PK model and 500 for the PD model) from the original dataset were estimated sequentially, using the final PK and PD model. Ninety-percent confidence intervals (CIs, five percentile and 95 percentile) of parameters from this step were compared with the final parameter estimates. In addition, a visual predictive check using a total of 1,000 simulated datasets for time courses of weight change was performed. With this simulated data, 90% prediction intervals of body weight at each observation time were overlaid with the observed raw time-weighted data.
After we evaluated the robustness and predictive performance of the model, we performed a simulation study of 10,000 virtual subjects to predict drug efficacy at 1 year.
Results
Pharmacokinetic model
Distribution characteristics of M1 and M2 were described with a two-compartment and one-compartment model, respectively. Absorption of the parent drug and its turnover to M1 were explained using a single parameter (first-order absorption rate constant, ka). M1 was assumed to be eliminated via metabolism to M2 only. Thus, elimination of the drug from the body was explained solely by the clearance of M2 (CLM2). BSVs for each parameter were optimally explained when they were applied exponentially (eg, × exp (ηi)). For both metabolites, only a proportional error model was chosen to explain the discrepancy between individual predicted and observed concentrations. Age of subjects was the only significant covariate related with clearance of M1 (CLM1) as per the following equation:
CLM1 = CLM1,t × (1 +CAGE × [age − 35]) |
where CLM1,t is the typical value in a patient aged 35 years and CAGE is the proportionality constant between age and CLM1. ISP was not significant, which indicated that no PK difference between healthy subjects and patients existed. The overall structure of the PK and PD model is given in Figure 1 and the basic goodness-of-fit plots for each metabolite are presented in Figure 2. Final parameter estimates are summarized in Table 2.
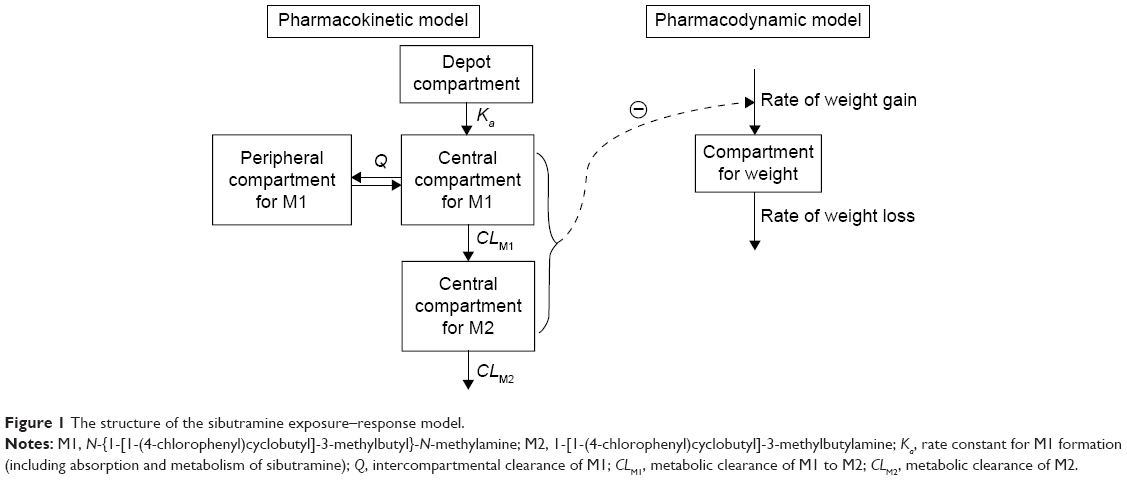 | Figure 1 The structure of the sibutramine exposure–response model. |
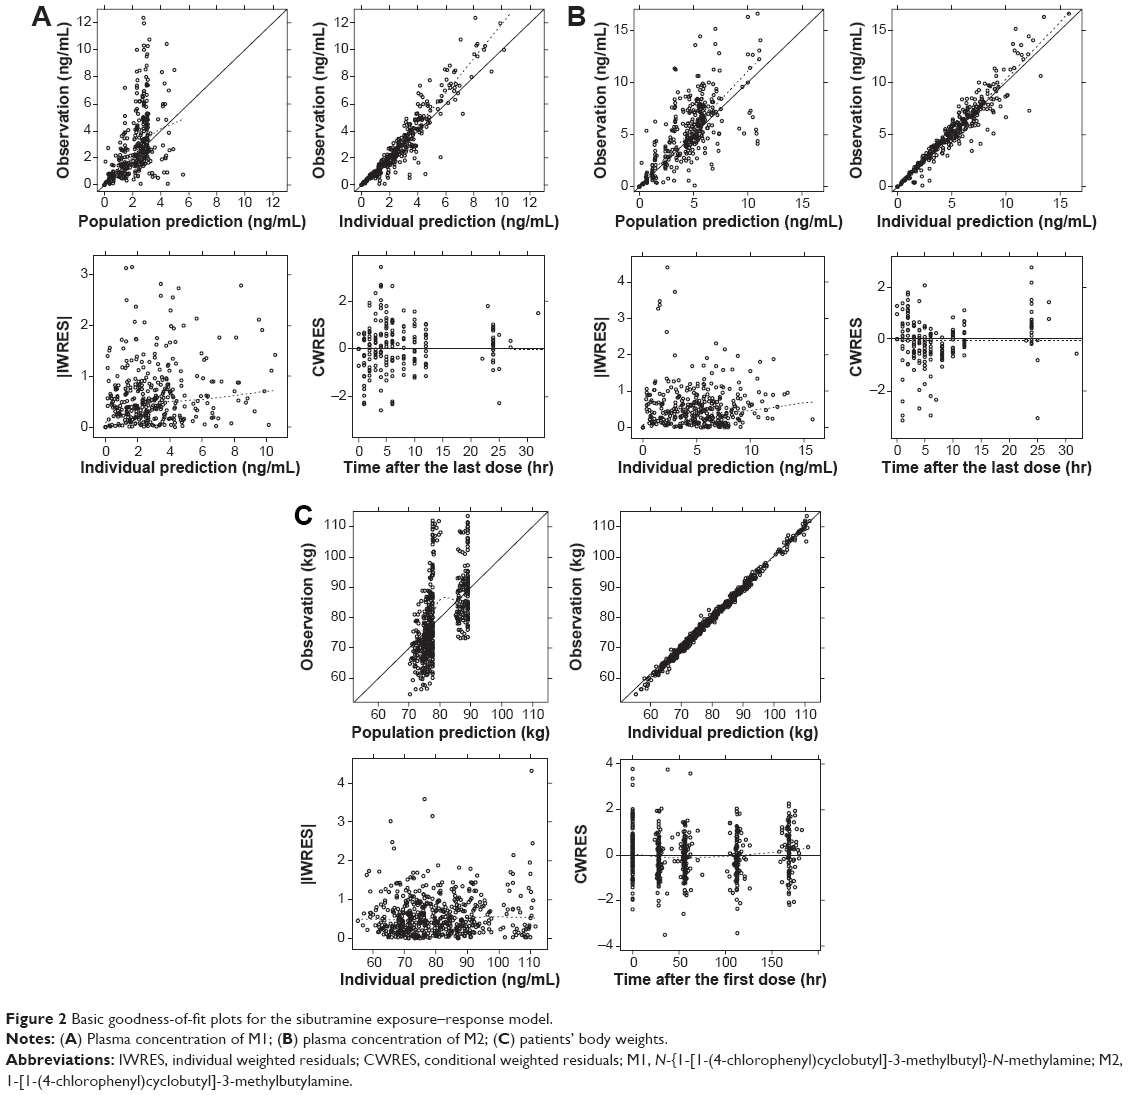 | Figure 2 Basic goodness-of-fit plots for the sibutramine exposure–response model. |
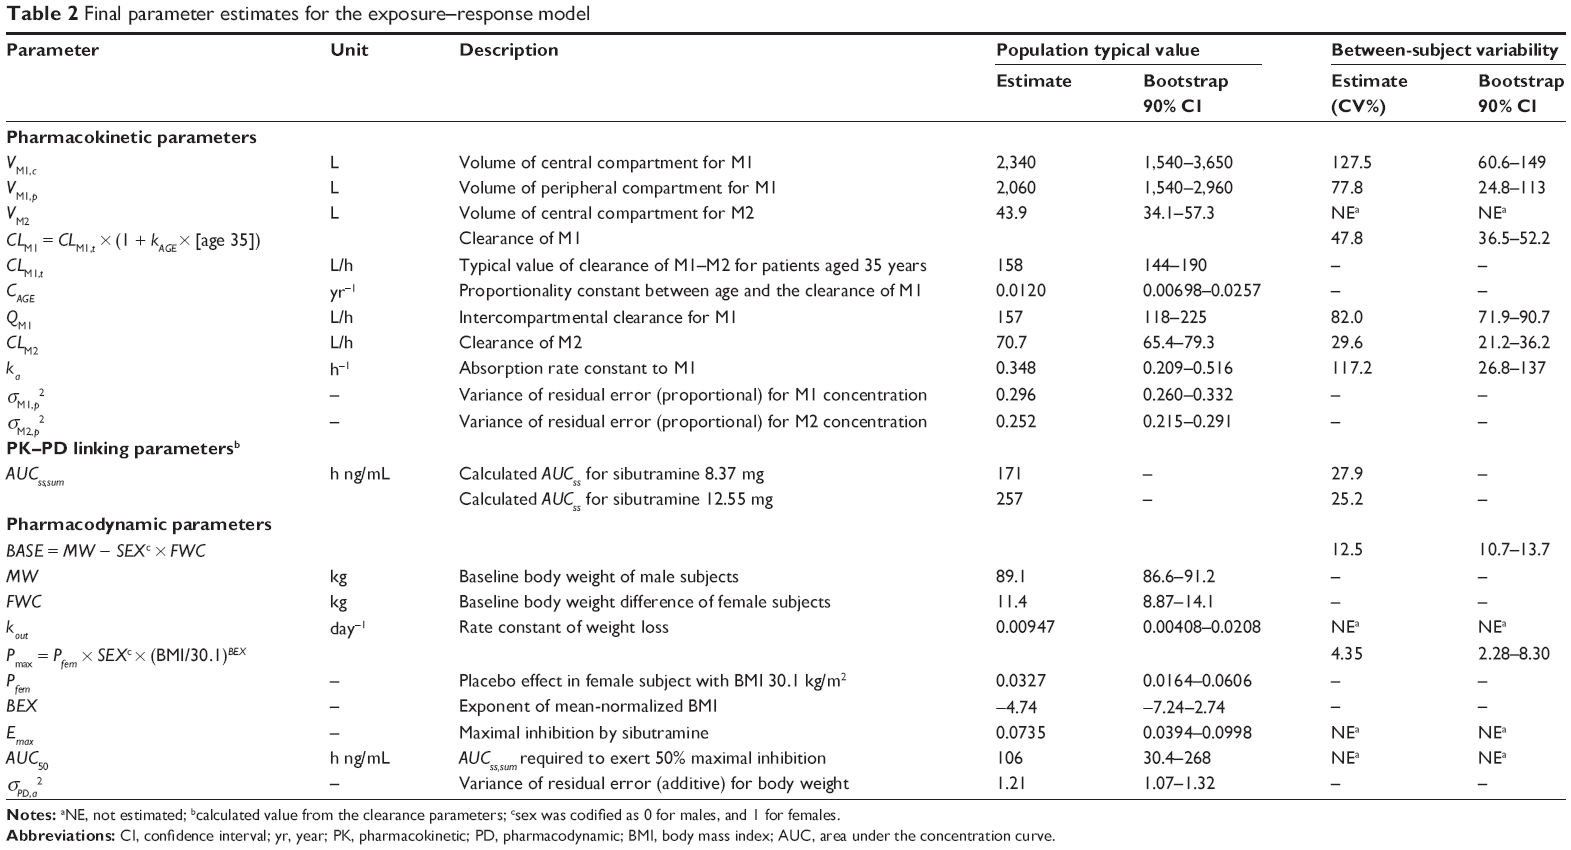 | Table 2 Final parameter estimates for the exposure–response model |
Pharmacodynamic model
The turnover model shown in Figure 1 was chosen for its description of a delayed drug effect compared with fluctuation of drug concentration. In this model, a patient’s body weight is determined by the equilibrium between rates of gaining and losing body weight:
Rate of weight change = Rate of weight gain − rate of weight loss |
In our model, the effect of the drug was to inhibit the rate of weight gain. In addition, the placebo effect was incorporated as constant inhibition of weight gain. The overall model for the rate of weight gain was as follows:
|
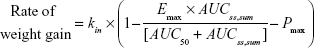
where kin is the baseline rate of weight gain, Emax is maximal inhibition (a value between 0 and 1), AUC50 is the AUCss,sum required for 50% maximal inhibition, and Pmax is a constant placebo effect.
The rate of weight loss was modeled following first-order kinetics, which is proportional to body weight at each measurement:
Rate of weight loss = kout × body weight |
where kout is the rate constant of weight loss. kin was not estimated but calculated from the relationship between baseline body weight (BASE) and rate constant of weight loss as follows:
kin = BASE × kout |
In the final model, sex (SEX) was selected as a meaningful covariate for BASE and Pmax (placebo effect was acknowledged only in female subjects). BMI at baseline was also chosen as a factor affecting Pmax:
|
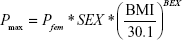
where Pfem is the extent of the placebo effect in female subjects with a BMI of 30.1 kg/m2, SEX is coded as 0 for males and 1 for females, BMI is the baseline BMI value, and BEX is the exponent of mean-normalized BMI.
BSVs were estimated for BASE and Pmax. For Pmax, an additive BSV (eg, +η) was determined to be the best structure. The final structure and parameter estimates are summarized in Table 2.
Model evaluation and simulation
Bootstrap 90% CIs for PK–PD parameters were successfully estimated and all final parameter estimates were within those intervals. This indicated that the model parameters were robust. Visual predictive check results also showed appropriate predictive performance of the model in that 89.4% of actual observations lay within the simulated 90% CI at each observation time (Figure 3).
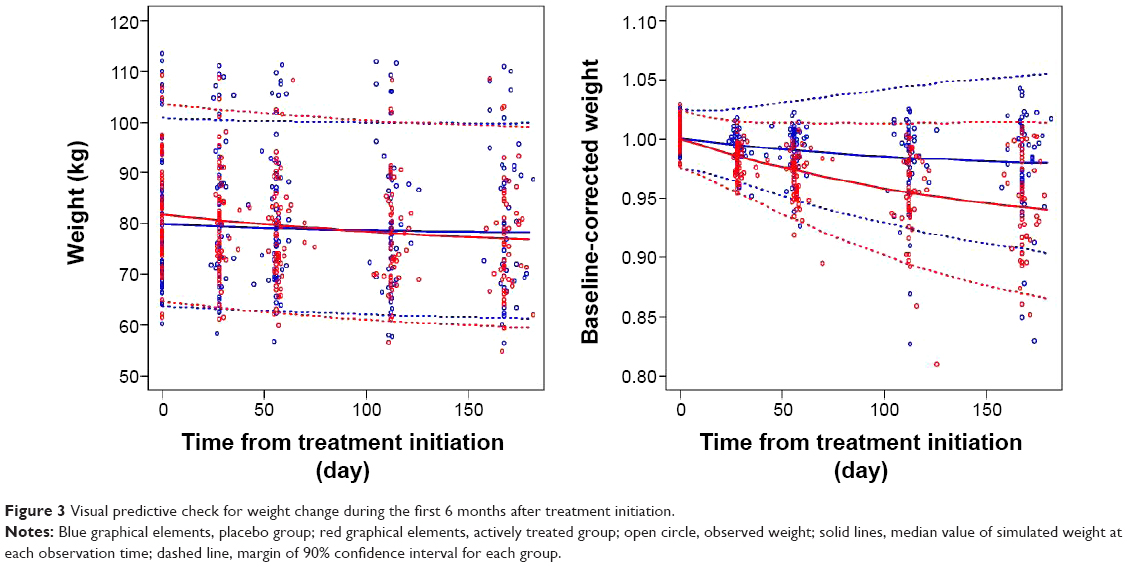 | Figure 3 Visual predictive check for weight change during the first 6 months after treatment initiation. |
Simulated body weight changes after placebo or high-dose (daily 12.55 mg as sibutramine base) sibutramine demonstrated the influence of sex and BMI on the extent of weight loss (Figure 4). The difference in mean weight loss between the high-dose and placebo-treated groups was expected to be 4.5% (7.1% for the high-dose group and 2.6% for the placebo group) and the proportion of subjects who lost more than 5% of their baseline body weight in the high-dose group was 63.4%±13.7%, whereas that in the placebo group was 33.5%±8.6% (all mean ± standard deviation). The degrees of weight loss were widely distributed and the prediction intervals for weight loss in both groups overlapped considerably. For the low-dose regimen (8.37 mg sibutramine base daily), the proportion was predicted to be 46.9%±10.1%.
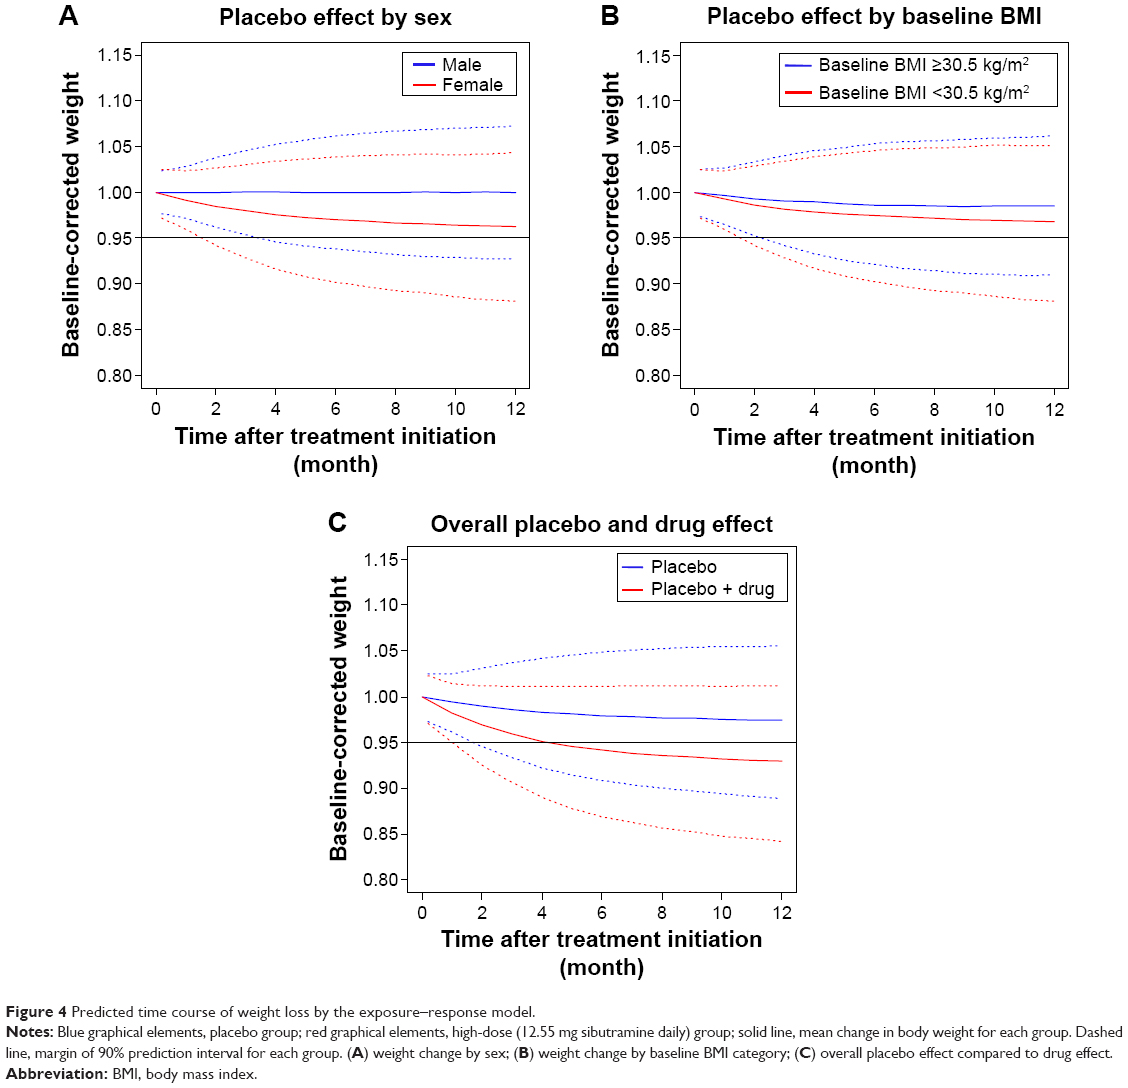 | Figure 4 Predicted time course of weight loss by the exposure–response model. |
Discussion
We successfully developed an exposure–response model describing the extent and time course of weight loss in response to sibutramine treatment. We did this by utilizing pharmacological knowledge of the drug and data obtained from previous clinical studies with some assumptions. Despite the relatively short study duration, we made several important findings. With regard to the PK model, we supplemented the clinical trial data with data obtained previously from healthy volunteers through a heterogeneity test using an indicator variable. The concentration ranges for both M1 and M2 were similar to those reported for healthy male Korean subjects14 and their difference between patients and healthy subjects was not acknowledged. The PK model explained the time–concentration relationship within this concentration range well, despite some assumptions irrelevant to actual metabolic pathways.11,12 By estimating CLM1, we found that formation of M2 from M1 is positively correlated with age. A similar result was reported in a previous study by Hind et al15 in which the ratios between AUCs of M1 and M2 were 5.98 and 6.58 for young and elderly subjects, respectively. The underlying reason for this observation is not clear; however, it might be due to age-related changes in the activity of enzymes involved in the relevant metabolic pathways.
The goodness-of-fit and predictive performance of the final model were satisfactory, which implied that the use of AUCss,sum as an exposure variable was acceptable. Using this approach, our model highlighted several points that should be considered when evaluating weight-control drugs. We found that the length of time required for efficacy assessment, which is currently 1 year, was appropriate. In the asymptotic weight loss model, saturation was obtained after 4–5 half-lives of weight loss. The half-life was calculated from the estimate of kout using the following formula, because weight loss is assumed to follow first-order kinetics:
|
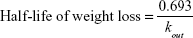
The half-life obtained in this analysis was 73.2 days, and the drug effect was expected to reach a plateau at around 300 days after treatment initiation. Our placebo model indicated that the placebo effect was not dependent on the type of placebo (matching low dose or high dose), and thus, we selected a constant placebo effect over the entire treatment period. We also found that the placebo effect was more pronounced in female and relatively less obese patients than other patients. We attributed this to a combination of social and personal characteristics. This implies that nonphysiological factors may be involved in weight loss and that those factors should be considered when evaluating the placebo effect. However, these findings need further assessment through studies in other cultural areas or countries because we only examined Koreans in our study. Possible genetic differences in sibutramine response were included in this analysis, but are not described in detail because the genotypes had no meaningful influence on the PK–PD parameters. Wide variability in lifestyle factors other than those recorded as demographic characteristics might be one possible explanation for this lack of effect of genotypes.
As a secondary outcome of this study, we evaluated the clinical effectiveness of sibutramine. Despite our short study period (longer than 6 months), which was the required duration of treatment to prove efficacy according to Korean regulations at the time the study was conducted, we extrapolated our results to 1 year of treatment. In this simulation, we found that sibutramine did not show sufficient effectiveness to meet the current criteria for approval16,17 for weight-control drugs even though we presumed that a high dose of the drug was given and that patient compliance was 100%. Empirical maximal efficacy was 7.35% (Emax); however, the AUCss,sum obtained in the target population (257 h ng/mL on average) was not high enough to achieve sufficient effectiveness.
Using our modeling–simulation approach, we were able to quantitatively evaluate the time–concentration relationship, representative exposure variables, extent of response to the drug and placebo, time course of weight loss, and several other factors influencing weight loss. Since the model was built based upon some mathematical assumptions and does not included all of the influential factors occurring in the real-world settings, the utility of the model may be limited. Thus, the prediction on effectiveness of sibutramine using our exposure–response model may not be inconsistent with the actual findings obtained so far, and this study was not involved in any developmental processes. However, it was our intent to exemplify an exposure–response model for weight loss including placebo effect focusing on the quantification ability of existing data, and to describe the possible role of modeling and simulation which may aid the decision-making in drug development providing with fit-for-purpose predictions. Therefore, we suggest that weight-control drug development could potentially be more efficient if a model building and utilization process similar to that described in this study was implemented early in drug development based on a quick win–fast fail paradigm.18
Acknowledgment
This study was supported by a grant of the Korean Health Technology R&D Project, Ministry of Health & Welfare, Republic of Korea (HI14C1731).
Disclosure
The authors report no conflicts of interest in this work.
References
Flegal KM, Carroll MD, Kit BK, Ogden CL. Prevalence of obesity and trends in the distribution of body mass index among US adults, 1999–2010. JAMA. 2012;307(5):491–497. | ||
James PT, Rigby N, Leach R; International Obesity Task Force. The obesity epidemic, metabolic syndrome and future prevention strategies. Eur J Cardiovasc Prev Rehabil. 2004;11(1):3–8. | ||
Kim MH, Kim MK, Choi BY, Shin YJ. Prevalence of the metabolic syndrome and its association with cardiovascular diseases in Korea. J Korean Med Sci. 2004;19(2):195–201. | ||
Scheen AJ. Sibutramine on cardiovascular outcome. Diabetes Care. 2011;34(suppl 2):S114–S119. | ||
Arterburn DE, Crane PK, Veenstra DL. The efficacy and safety of sibutramine for weight loss. Arch Intern Med. 2004;164(9):994–1003. | ||
Rodgers RJ, Tschöp MH, Wilding JP. Anti-obesity drugs: past, present and future. Dis Model Mech. 2012;5(5):621–626. | ||
Zhang L, Sinha V, Forgue ST, et al. Model-based drug development: the road to quantitative pharmacology. J Pharmacokinet Pharmacodyn. 2006;33(3):369–393. | ||
Lalonde RL, Kowalski KG, Hutmacher MM, et al. Model-based drug development. Clin Pharmacol Ther. 2007;82(1):21–32. | ||
Meibohm B, Derendorf H. Pharmacokinetic/pharmacodynamic studies in drug product development. J Pharm Sci. 2002;91(1):18–31. | ||
Jain DS, Subbaiah G, Sanyal M, et al. Liquid chromatography/electrospray ionization tandem mass spectrometry validated method for the simultaneous quantification of sibutramine and its primary and secondary amine metabolites in human plasma and its application to a bioequivalence study. Rapid Commun Mass Spectrom. 2006;20(23):3509–3521. | ||
Bae SK, Cao S, Seo KA, et al. Cytochrome P450 2B6 catalyzes the formation of pharmacologically active sibutramine (N-{1-[1-(4-chlorophenyl)cyclobutyl]-3-methylbutyl}-N,N-dimethylamine) metabolites in human liver microsomes. Drug Metab Dispos. 2008;36(8):1679–1688. | ||
Link M, Hakala KS, Wsol V, Kostiainen R, Ketola RA. Metabolite profile of sibutramine in human urine: a liquid chromatography-electrospray ionization mass spectrometric study. J Mass Spectrom. 2006;41(9):1171–1178. | ||
Padwal RS, Majumdar SR. Drug treatments for obesity: orlistat, sibutramine, and rimonabant. Lancet. 2007;369(9555):71–77. | ||
Park JY, Kim KA, Park PW, Suh KH, Lee GS. Relative bioavailability and pharmacokinetics of a new sibutramine formulation in healthy male subjects: a randomized, open-label, two-period, comparative crossover study. Clin Ther. 2004;26(12):2092–2101. | ||
Hind ID, Mangham JE, Ghani SP, Haddock RE, Garratt CJ, Jones RW. Sibutramine pharmacokinetics in young and elderly healthy subjects. Eur J Clin Pharmacol. 1999;54(11):847–849. | ||
Center for Drug Evaluation and Research (CDER), Food and Drug Administration, U.S. Department of Health and Human Services. Guidance for Industry (Draft) – Developing products for weight management. Revision 1; 2007. Available from http://www.fda.gov/downloads/Drugs/.../Guidances/ucm071612.pdf. | ||
Committee for Medicinal Products for Human Use (CHMP), European Medicines Agency. Guideline on Clinical Evaluation of Medicinal Products Used in Weight Control; 2007. Available from: https://www.google.co.nz/url?sa=t&rct=j&q=&esrc=s&source=web&cd=1&cad=rja&uact=8&ved=0CB0QFjAAahUKEwja7vLR2pDHAhUinqYKHZ5KB2E&url=http%3A%2F%2Fwww.ema.europa.eu%2Fema%2Fpages%2Fincludes%2Fdocument%2Fopen_document.jsp%3FwebContentId%3DWC500170278&ei=v1vBVZqTNqK8mgWelZ2IBg&usg=AFQjCNGaBoZJFB9F_8lptwb4wdfeui7rxA&sig2=Yfr5TH9PAe-f8jYLXMVu3A&bvm=bv.99261572,d.dGY. | ||
Paul SM, Mytelka DS, Dunwiddie CT, et al. How to improve R&D productivity: the pharmaceutical industry’s grand challenge. Nat Rev Drug Discov. 2010;9(3):203–214. |
 © 2015 The Author(s). This work is published and licensed by Dove Medical Press Limited. The full terms of this license are available at https://www.dovepress.com/terms.php and incorporate the Creative Commons Attribution - Non Commercial (unported, v3.0) License.
By accessing the work you hereby accept the Terms. Non-commercial uses of the work are permitted without any further permission from Dove Medical Press Limited, provided the work is properly attributed. For permission for commercial use of this work, please see paragraphs 4.2 and 5 of our Terms.
© 2015 The Author(s). This work is published and licensed by Dove Medical Press Limited. The full terms of this license are available at https://www.dovepress.com/terms.php and incorporate the Creative Commons Attribution - Non Commercial (unported, v3.0) License.
By accessing the work you hereby accept the Terms. Non-commercial uses of the work are permitted without any further permission from Dove Medical Press Limited, provided the work is properly attributed. For permission for commercial use of this work, please see paragraphs 4.2 and 5 of our Terms.