")
Back to Journals » International Journal of Nanomedicine » Volume 14
Exosomal microRNA profiling in early and late onset preeclamptic pregnant women reflects pathophysiology
Authors Pillay P , Vatish M, Duarte R , Moodley J , Mackraj I
Received 15 March 2019
Accepted for publication 30 April 2019
Published 23 July 2019 Volume 2019:14 Pages 5637—5657
DOI https://doi.org/10.2147/IJN.S208865
Checked for plagiarism Yes
Review by Single anonymous peer review
Peer reviewer comments 2
Editor who approved publication: Dr Thomas Webster
Preenan Pillay,1 Manu Vatish,2 Raquel Duarte,3 Jack Moodley,4 Irene Mackraj5
1Discipline of Human Physiology, School of Laboratory Medicine and Medical Sciences, College of Health Sciences, University of Kwazulu-Natal, Durban, South Africa; 2Nuffield Department of Women’s and Reproductive Health, Women’s Centre, John Radcliffe Hospital, University of Oxford, Oxford, UK; 3Department of Internal Medicine, Faculty of Health Sciences, University of the Witwatersrand, Johannesburg, South Africa; 4Women’s Health and HIV Research Group, Department of Obstetrics and Gynaecology, University of Kwazulu-Natal, Durban, South Africa; 5School of Laboratory Medicine and Medical Sciences, University of Kwazulu-Natal, Durban, South Africa
Background: Preeclampsia is the leading cause of maternal and fetal mortality due to the inability to diagnose and treat the disorder early in pregnancy. This is attributed to the complex pathophysiology and unknown etiology of the disorder, which is modulated by several known and unknown factors. Exosomes have recently been implicated as possible mediators of the pathogenesis of preeclampsia, with, however, no evidence linking these nanovesicles to the pathophysiology of preeclampsia and its subtypes.
Methods: To better understand the pathophysiological role of exosomes in preeclampsia, we have analyzed the exosomal microRNA in early and late onset preeclamptic women in comparison to their gestationally matched normotensive controls using Digital Direct Detection (NanoString Technologies).
Results: For the first time, distinct exosomal microRNA signatures in early and late onset preeclampsia have been identified. Moreover, these signatures indicate that exosomes are involved in key pathological features associated with preeclampsia and differentiate between the subtypes.
Conclusion: This study forms the basis for the diagnostic and functional validation of the identified signatures as biomarkers of preeclampsia and its subtypes.
Keywords: biomarkers, preeclampsia, exosomes, microRNA
Introduction
Preeclampsia (PE), a hypertensive disorder of pregnancy (HDP), remains one of the leading causes of maternal and neonatal mortality and morbidity, affecting 5–8% of pregnancies globally.1–3 The clinical management of this disorder is complicated, partly due to the heterogeneity of the disease which is attributed to its complex etiopathophysiology, caused by the dysregulation of a host of unknown and known factors. Even though the exact etiology of PE remains unknown, the placenta is central in the pathogenesis of PE. The functional unit of the placenta, the chorionic villous, is a vascular projection of fetal tissue surrounded by the chorion. The embryonic-derived chorion consists of an inner cytotrophoblast layer and outer syncytiotrophoblast layer which, importantly, forms the interface between maternal blood from the fetal vasculature and may be a potential source of circulating factors.
Preeclampsia is commonly categorized into early onset-PE (EOPE) and late onset-PE (LOPE), which can manifest with or without clinical features, such as epigastric pain, visual disturbances, persistent headache, nausea and vomiting, culminating in eclampsia if untreated.4 Notably, early onset-PE occurs at ≤33 weeks of gestation and is associated with greater risk of maternal and fetal complications in comparison to late onset-PE,5–7 which is reflective of the differences in the pathogenesis between the subtypes. The pathophysiology of early onset-PE is characterised as a two-stage disorder, namely, (1) improper placentation due to shallow trophoblast invasion, impacting upon spiral artery remodelling leading to decreased uteroplacental blood flow (due to the under-perfused placenta) and oxygenation,5 which results in (2) enhanced placental oxidative stress which is a precursor to the maternal systemic inflammatory response observable later in pregnancy6 with lasting effects. Late onset PE occurs at ≥34 weeks of gestation and manifests as a result of villous overcrowding at term, leading to competitive inhibition of cellular growth due to limited gaseous exchange and nutrient supply which culminates in placental oxidative stress,7 leading to the clinical disease state. Late onset-PE is often not associated with significant fetal involvement, but commonly, in both early and late onset-PE, there are two principle features: (1) syncytiotrophoblast stress occurring in the placenta and (2) systemic endothelial dysfunction affecting the mother.
Although the key events and factors initiating the pathophysiology of PE remain largely unclear, biologically-derived nanovesicles, termed exosomes, have emerged as potential mediators of this process8-11 partly due to their increased levels in maternal circulation.8 Furthermore, in a recent study, we identified differences between early and late onset-PE in the levels of total and placenta-derived exosomes in maternal circulation,12 alluding to the possible role of exosomes in the pathophysiology of early and late onset-PE and their subsequent application as biomarkers.8
Exosomes (20–130 nm) derived from multivesicular bodies contain nucleic acids, proteins and lipid rafts, which have been reported to promote physiological function through autocrine, paracrine and endocrine signaling mechanisms.8,13 Exosomes can bind to target cells or organs, reprogramming them, either by direct signaling via surface proteins or by depositing their vesicular cargo intracellularly.14 Hence, in disease states, it is this property which confers the ability for these vesicles to directly mediate end-organ damage; forming ideal candidate biomarkers for early disease diagnosis/prognosis. More recently, exosomal microRNAs (exomiRNA), in particular, have emerged as key biomarkers of several other disease states, as they are selectively packaged into exosomes15 and are subsequently released by the cell, destined to participate in cellular reprogramming.16,17 A few studies have described the key physiological role of miRNAs in regulating normal placental development, as well as the pathogenesis of PE,18–22 leading to our proposal that a comprehensive understanding of exosomal miRNA will provide key functional insights into the role of these nanovesicles in the pathophysiology of PE.
Evidence of miRNA as a constituent of exosomal RNA cargo has been reported in PE using next-generation sequencing (NGS).23 However, there is still a lack of information regarding the pathophysiological role of exomiRNA in early and late onset-PE, especially given its powerful role in the modification of gene expression. Importantly, the analysis of exomiRNA is complicated by the limitations of this technology given the small amounts of exomiRNA present. Therefore, studies involving the detection and quantification of exomiRNA would require more specific, rapid analytical strategies for easy clinical application. NanoString technology fulfils this criterion because of its digital precision, enhanced sensitivity, reproducibility and technical robustness using small amounts of starting RNA, without the need for further validation.24,25 Importantly, standard assessment of small amounts of RNA involves amplification which can skew the relative abundance of short RNA sequences.24 NanoString technology does not utilise amplification processes thus enabling a more accurate representation of resident miRNA expression levels. Therefore, in this study, we aimed to identify exomiRNA signatures associated with the pathophysiology of early and late onset-PE using the NanoString nCounter platform (Seattle, WA, USA). We highlight the contrasting exomiRNA profiles associated with the pathophysiology of early and late onset-PE as well as the possible overlapping miRNA target-related pathways linked to preeclampsia pathology.
Methods
Ethics statement
Regulatory ethical and institutional approval were obtained from the Biomedical Research Ethics Committee of the University of KwaZulu-Natal (BE310/15), South Africa. Patients were recruited from the Prince Mshiyeni Hospital, Kwa-Zulu Natal, South Africa. All participants were recruited via written informed consent, and the study was conducted in accordance with the Declaration of Helsinki.
Study group
Controls [Gestationally matched normotensive pregnant woman (N)] and experimental groups [Early onset-PE (EOPE) and late onset-PE patients (LOPE)], were enrolled in this study (n=15 per group). Normotensive patient controls were gestationally matched to the EOPE and LOPE groups (Table 1), and, identified as blood pressure of 120±10/80±5 (systolic/diastolic mm Hg) with absent proteinuria as detected by a rapid urine dipstick test (Markomed®, South Africa). Early onset preeclampsia was classified as new-onset hypertension (diastolic blood pressure of ≥90 mm Hg and systolic blood pressure of ≥140 mm Hg) and proteinuria (≥300 mg) at ≤33 weeks. Late onset-preeclampsia was defined by new-onset hypertension (diastolic blood pressure of >90 mm Hg and systolic blood pressure of >140 mm Hg) and proteinuria (≥300 mg) at ≥34 weeks gestational age. All recruited women had singleton pregnancies with no evidence of any infections or medical, surgical or other obstetric complications. Blood from maternal circulation was collected at the time of clinical diagnosis of PE as specified above together with gestationally matched normotensive [BD Vacutainer Tubes (EDTA), Becton Dickinson and Company, South Africa] and the plasma samples were stored at −80 °C for analyses.27,28 Samples were processed according to the accepted guidelines pertaining to exosomes.24
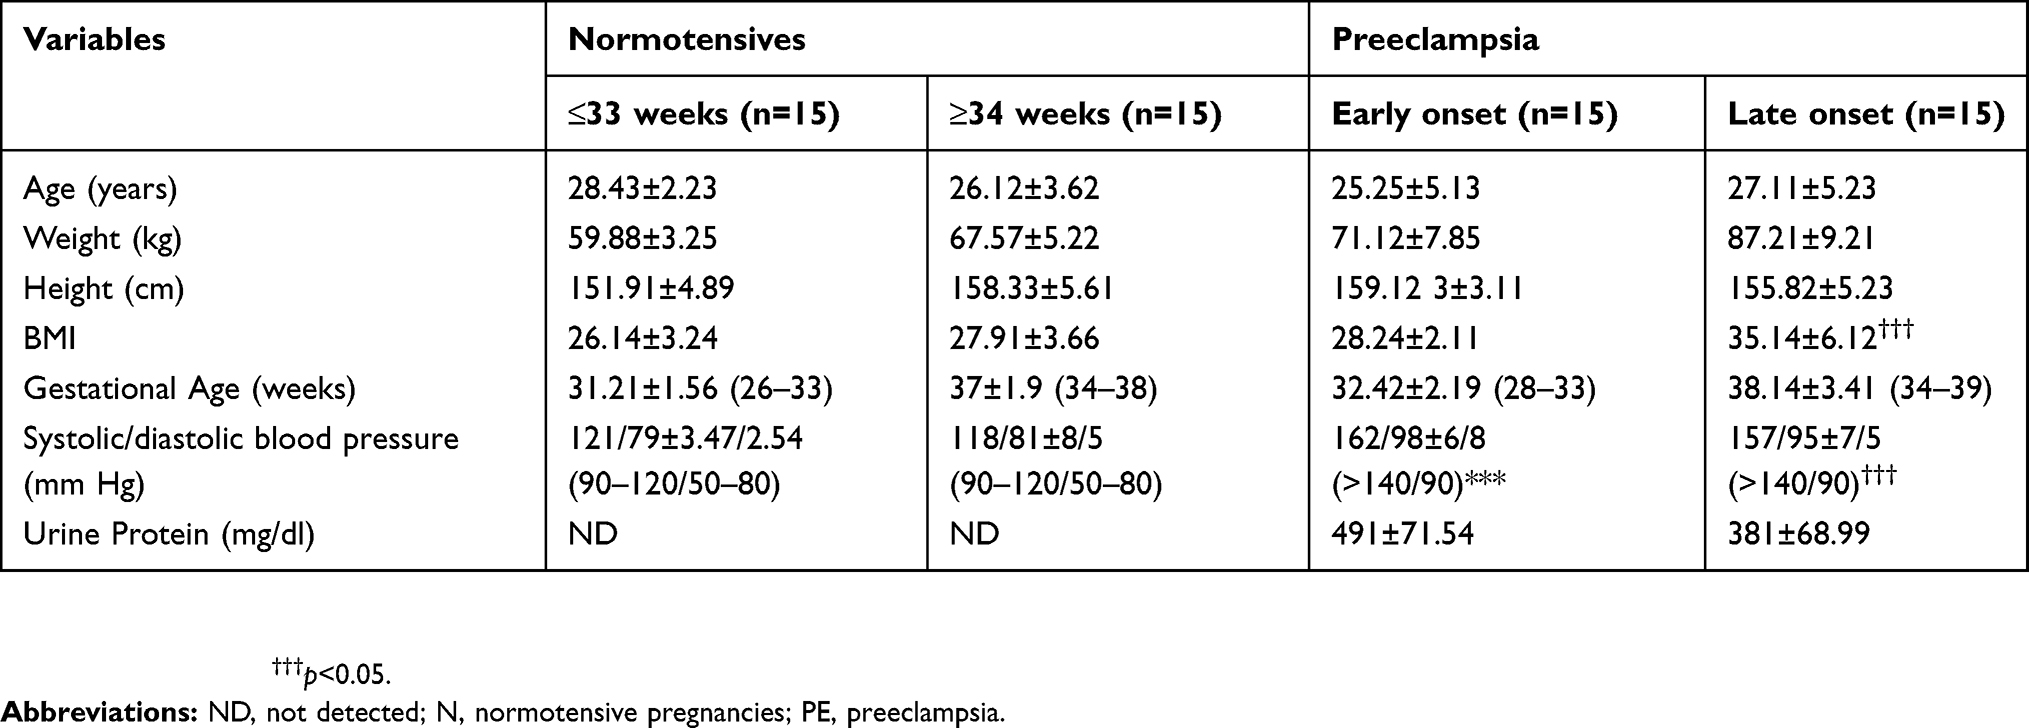 |
Table 1 Clinical characteristics of participants |
Exosome isolation
Exosomes were isolated using the exosome miRCURY isolation kit (Qiagen, USA) according to the manufacturer’s instruction with modifications. Briefly, plasma was centrifuged at 300 g for 10 min the supernatant was then centrifuged at 2000 g for 30 min to remove dead cells. Thereafter the recovered supernatant was centrifuged at 12,000 g for 45 min to remove cell debris. To ensure removal of all unwanted cells and debris the supernatant was further purified using a 0.22 µm spin column (Corning, USA). Thrombin was then added to the filtrate for de-fibrination. This was followed by centrifugation at 10 000 g for 5 min. Precipitation buffer was thereafter added to the recovered supernatant and incubated at 4 ºC for 4hrs. Post incubation the exosomes were recovered by centrifugation at 500 g for 5min at 20 ºC. The exosomal pellet was resuspended in exosome resuspension buffer as prescribed by the total exosomal Protein and RNA isolation kit (Life Technologies).
Exosomal protein and RNA isolation
Exosomal RNA was isolated using the total exosome RNA and protein isolation kit (Life Technologies) as per the manufacturer’s instructions. The total RNA concentration was measured using the NanoDrop 2000 spectrophotometer (Thermo Scientific, Waltham, MA, USA). Isolated exosomes were re-suspended in exosome resuspension buffer as per the total exosomal protein and RNA isolation kit (Life Technologies). The total protein concentration was determined using the RC DC Protein Assay as per manufacturer’s instructions (Bio-Rad Laboratories, Hercules, CA, USA).
Exosome characterization
Nanoparticle tracking analysis
Quantification and size distribution of exosomes were determined using Nanoparticle Tracking Analysis as described in our previous publication (NanoSight500 NTA 3.0 Nanoparticle Tracking Analysis Release, Version Build 0069).12 In Brief, samples were diluted with PBS in order to obtain particle distribution of between 10 and 100 particles per image (optimal, 50 particles per image). Samples were introduced into the instrument using the following script: PUMPLOAD, REPEATSTART, PRIME, DELAY 10, CAPTURE 60, REPEAT 5. Videos were recorded at a camera level of 10, a camera shutter speed of 20 ms and camera gain of 600, these settings were kept constant between samples. Each video was then analyzed to give the mean particle size together with the concentration of particles. The size of the exosomes was represented as the mean particle size ± SEM.
Western blotting
Exosomes isolated from plasma samples were lysed with RIPA buffer (1X) at room temperature and the protein content determined using the RC DC Protein Assay (Bio-Rad Laboratories, Hercules, CA, USA). Laemmli buffer (2X) was added to the samples and incubated at 95 °C for 5 min. Thirty micrograms of exosomal protein per well were separated by sodium dodecyl sulfate-polyacrylamide gel electrophoresis (SDS-PAGE) and transferred onto polyvinylidene fluoride membranes. Polyvinylidene fluoride membranes were probed with the primary antibody, CD63 (ExoAB, System Biosciences, Mountain View, CA) and Placental Alkaline Phosphatase (PLAP) monoclonal antibody (5B1) (Thermo Fisher Scientific). Post incubation at room temperature for 1 h, membranes were washed in Tris buffer saline (pH 7.6) and incubated for 1 h at room temperature with the exosome validated secondary conjugated horseradish peroxidase antibody (System Biosciences, Mountain View, CA). Membranes were incubated with the chemiluminescent substrate and visualised with the ChemiDoc® Gel Documentation System (Bio-Rad Laboratories, Hercules, CA, USA).
Transmission electron microscopy
Exosomes were placed onto a continuous carbon grid and negatively stained with 2% uranyl acetate. The morphology of the particles was examined using a JEOL 1010 transmission electron microscope (JEOL, Peabody, MA, USA).
Quantification of total and placenta-derived exosomes
Total and placenta-derived exosomes were determined as per our previous publication.12 Total exosomes in maternal circulation were determined by the quantification of total immunoreactive exosomal CD63 via an enzyme-linked immune absorbency assay (ExoELISA™, System Biosciences, Mountain View, CA), as per manufacturer’s instructions. In brief, 30 µg of isolated exosomal protein was immobilised onto a microtiter plate overnight at 37 °C using exosome binding buffer supplied the manufacturer (System Biosciences). Plates were washed and incubated at room temperature for 1 h with exosome specific primary antibody (CD63), followed by a wash step and incubation with secondary antibody (1:5000) at room temperature for 1 h with agitation. Plates were thereafter washed and incubated with Tetramethylbenzidine ELISA substrate at room temperature for 45 min with agitation. The reaction was thereafter terminated using stop buffer and the absorbance was measured at 450 nm. The number of exosomes/ml, (ExoELISA™ kit) was obtained using an exosomal CD63 standard curve that was generated using the calibrated exosome standard that was supplied.
The relative concentration of placenta-derived exosomes was determined by the quantification of human placental alkaline phosphatase in the exosomal fraction using a commercial ELISA kit (Elabscience, E-EL-H1976, WuHan, P.R.C), as per manufacturers instruction. In brief, 30 µg of exosomal protein was allowed to bind to the primary PLAP specific antibody coated plates by incubation at 37 °C for 90 min. Plates were washed with buffer and 50 μl of HRP-conjugate was added to each well and incubated at 37 °C for 20 min. Plates were washed and incubated with 50 μl of substrate A and 50 μl of substrate B at 37 °C for 15 min. The incubation was terminated using 50 μl of stop solution at room temperature for 2 min under agitation. Absorbance was measured at 450 nm. Exosomal PLAP was expressed as pg/ml plasma. The quantification of PLAP in the exosomal fraction indicates the relative concentration of placenta-derived exosomes (PLAP+ exosomes) in maternal circulation.
Nanostring ncounter system miRNA assay
One hundred nanograms of exosomal RNA from each sample group (n=15 per group, pooled into 3 technical replicates) was analyzed using the NanoString nCounter SPRINT Profiler (NanoString Technologies®, Inc., Seattle, WA, USA). Briefly, miRNAs were ligated to a species-specific tag sequence (nCounter miRtag) through a thermally controlled splinted ligation. Un-ligated miRtags was removed by enzymatic purification, and the miRtagged mature miRNAs were then hybridized with the nCounter Human (V3) miRNA Expression Assay Code Set overnight at 65 °C. Samples were then injected into the nCounter SPRINTTM cartridge and read using the nCounter® SPRINT Profiler (NanoString Technologies®, Inc., Seattle, WA, USA). The instrument performed the necessary magnetic bead separation, liquid transfers and immobilization of molecular labels on the sample surface before being finally analyzed by the system. The counts of the reporter probes were documented for each sample by the nCounter Digital Analyzer, which was subsequently analyzed using the nSolver Software (V 4.0). Before data normalization was performed, the nCounter data imaging QC metrics were assessed using the nSolver program, using the following parameters; imaging, binding density, positive control linearity, and positive control limit of detection. No significant discrepancy between the fields of view attempted and the fields of view counted were obtained. The binding density for the samples ranged between 0.20 and 0.74 within the recommended range. The normalisation factor by the nSolver program accounts for technical noise such as; variations in hybridization, purification, binding efficiency. The geometric mean of the positive controls was utilised for code count normalization, and the background was estimated using the mean of the negative controls. Input amounts of RNA were normalized to the geometric mean of five housekeeping miRNA controls (RPLP0, RPL19, B2M, GAPDH, and ACTB) and spike-in miRNA (osa-miR422, osa-miR414, osa-miR254, osa-miR248 and osa-miR159a) included in the assay, which was finally normalised to total miRNA count.
Statistical data analysis
All data analyses and graphical representations were performed and generated in GraphPad Prism 6.0 (CA, La Jolla) and nSolver Analysis Software 4.0.7 (NanoString Technologies Inc, USA). Exosomal miRNA ratio analysis between groups was selected based on an arbitrary |fold change|≥1 and False Discovery Rate (FDR) ≤0.05 with all expression data represented in Log2 scale using the nSolver analysis software. Subsequently, advanced analysis of the data was done using average-linked hierarchical clustering of a Spearman’s Rank correlation similarity matrix of the PE and normotensive samples using the nSolver analysis software. All functional Kyoto Encyclopedia of Genes and Genomes (KEGG) and Gene Ontology (GO) analysis was performed using Descriptive Intermediate Attributed Notation for Ada (DIANA) miRPATH (V 3.0) together with DIANA-microT-CDS 5.0 algorithms (interactions with a p-value<0.00001 was considered).
Results
Participant clinical characteristics
Early and late onset-PE groups were gestationally matched as shown in Table 1 below. Proteinuria was elevated in EOPE (491±71.54 mg/dl) and LOPE (381±68.99mg/dl). As expected, a significant increase in blood pressure was observed in EOPE (162/98±6/8 mm Hg) and LOPE (157/95±7/5 mm Hg) in comparison to the N groups (≤33 weeks: 121/79±3.47/2.54, ≥34 weeks: 118/81±8/5, p<0.001, Table 1) respectively. However, there was no significant difference in blood pressure and proteinuria between the N (≤33 weeks) and N (≥34 weeks) groups. It is notable that the BMI of the early onset-PE group was significantly greater than the late onset-PE group (35.14±6.12 vs 28.24±2.11 p<0.001).
Isolation and characterization of exosomes in maternal circulation
Isolated exosomes from each group were analyzed for size distribution using Nanoparticle Tracking Analysis and transmission electron microscopy. Isolated exosomes were within the accepted exosomal size range (20–130 nm, Figure 1E–G). The total number of exosomes in maternal circulation was quantified using an exosome validated ELISA kit which detected the exosome CD63 marker. Total exosomes in EOPE (8.9±0.5×10¹⁰ total exosomes/ml) and LOPE (5.3±0.5×10¹⁰ total exosomes/ml) were significantly higher than total exosomes in N (≤33 weeks: 1.06±0.2×10¹⁰ total exosomes/ml, p<0.0001) and N (≥34 weeks: 2.54±0.32×10¹⁰ total exosomes/ml, p<0.0001) respectively. Additionally, the exosome concentration in EOPE was significantly higher in comparison to LOPE (Figure 1A, p<0.0001). In conjunction with the ELISA, the Western blot analysis was positive for the exosomal CD63 marker (Figure 1B).
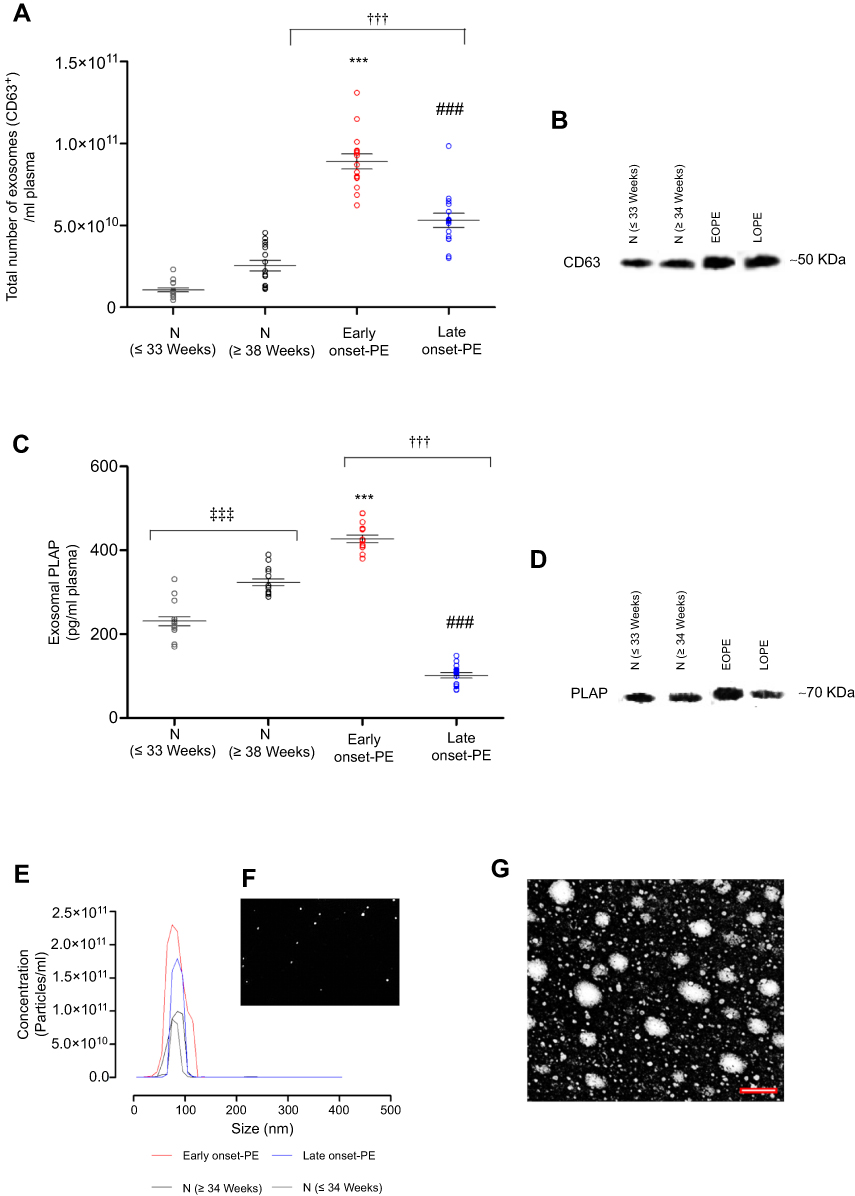 |
Figure 1 Identification and Characterization of Exosomes from Maternal Circulation. Exosomes from early onset-PE, late onset-PE and normotensive pregnant women were isolated and characterized. (A) Total exosome concentration was determined by the quantification of exosomal CD63 marker per ml of plasma using ELISA. (B) Western blot analysis for the CD63 exosome enriched marker. (C) Placenta-derived exosomes (ie exosomal placental alkaline phosphatase (PLAP) was quantified per ml of plasma by ELISA. (D) Western blot analysis for the exosomal PLAP marker. (E) Nanoparticle Tracking Analysis (NTA) illustrating the representative vesicle size distribution (nm). (F) Representative NTA video frame of the isolated exosomes. (G) Electron micrograph of isolated exosomes, scale bar 100 nm. In A and C the data is expressed as aligned dot plot and values are mean ± SEM. ***p<0.0001 early onset-PE vs N (≤33 weeks), p<0.0001 late onset PE vs N (≥34 weeks), †††p<0.001 early onset-PE vs late onset-PE, ‡‡‡p<0.0001 N (≤33 weeks) vs N (≥34 weeks).Abbreviations: N - Normotensive Pregnant Women, PE - Preeclampsia, ELISA - Enzyme-Linked Immunosorbent Assay. |
In order to determine the contribution of placenta-derived exosomes present in maternal plasma, the PLAP content per exosome was determined using ELISA (Figure 1C). Placental alkaline phosphatase is a marker of the syncytiotrophoblast and therefore its presence confirms placental origin.26 A significant increase in placenta-derived exosomes was observed in early onset-PE in comparison to N (≤33 weeks) (427.1±8.9 vs 231±10.92 pg/ml, p<0.0001). Additionally, a significant decrease in placenta-derived exosomes in LOPE compared to N (≥34 weeks) was observed (323.6±8.01 vs 101.4±6.22 pg/ml, p<0.0001). Moreover, a significant decrease in placenta-derived exosomes in LOPE in comparison to early onset-PE was observed (427.1±8.9 vs 101.4±6.22 pg/ml, p<0.0001). Furthermore, isolated exosomes were positive for membrane-bound PLAP marker by Western blot analysis (Figure 1D).
Exosomal miRNA expression profiles in early and late onset preeclampsia
In order to determine the profile of exomiRNA detected by the NanoString Human miRNA reference panel, we performed hierarchical clustering using all detected miRNAs within the specified range (FDR ≤0.05) in the EOPE vs N (33≤weeks, Figure 2) and LOPE vs N (≥34 weeks, Figure 3) groups. Average-linked hierarchical clustering of a Spearman’s Rank correlation similarity matrix of the data was performed using the NanoString nSolver analysis software (Version 4.0). As expected, two distinct patient clusters were identified (early and late onset-PE vs gestationally matched controls) and distinct gene clusters indicated by the colour bar represented in the heat map (Figures 2 and 3). In its entirety, there were 578 and 611 differentially expressed exomiRNA in EOPE vs N (33≤weeks) and LOPE vs N (≥34 weeks) respectively. Moreover, the KEGG pathway enrichment analysis of each cluster was performed using DIANA miRPath (V 3.0) together with DIANA-microT 5.0 algorithms. Significantly enriched KEGG pathways (p-value <0.00001), indicated that differentially expressed exomiRNA are involved in key signaling pathways associated with PE pathophysiology (Rap1, ErbB, TGF-β, Ras, Hippo, FOX, adrenergic cardiomyocyte and Thyroid hormone signaling, Figures 2 and 3). Interestingly, the differential expression of exomiRNA mirrors the molecular pathways associated with cancer biology (glioma, renal cell carcinoma, pancreatic cancer, proteoglycans and pathways in cancer, Figures 2 and 3) which links placental development with cancer biology.27 Further analysis of the significantly dysregulated exomiRNA in each comparison explores these relationships in more detail.
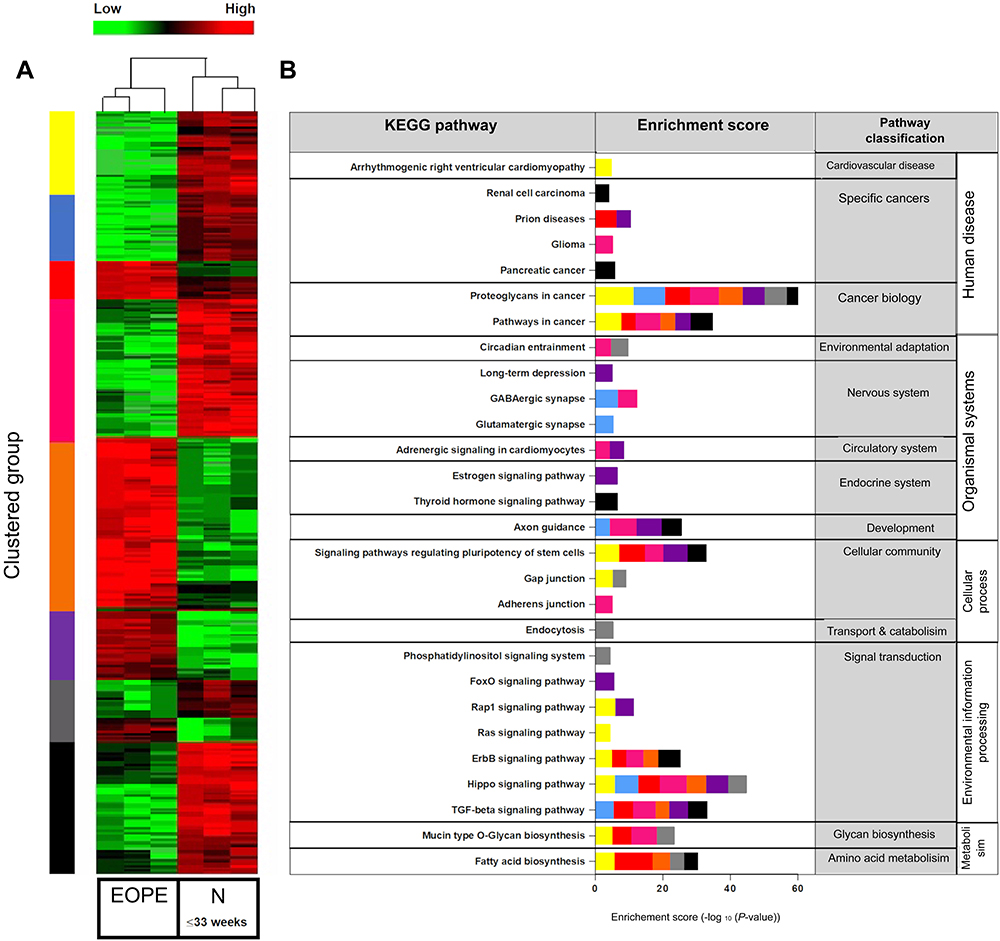 |
Figure 2 Comparison of exomiRNA expression profiles of Early onset Preeclamptic (EOPE) vs Normotensive derived exosomes. (A) Heatmap representing hierarchical clustering of differentially expressed miRNAs in EOPE (n=15, pooled into three technical replicates) and normotensive (n=15, pooled into three technical replicates) derived exosomes using average linkage clustering and Spearman Rank as distance metrics. miRNA profiles are clustered in 7 different subgroups (as indicated by the color bar on the right of the heatmap) defined by the miRNA expression patterns. Samples are shown in columns, miRNA in rows. Heat map from green to red represents relative miRNA expression as indicated in the key bar above the dendrogram. (B) KEGG (Kyoto Encyclopedia of Genes and Genomes) pathway mapping for top canonical pathways represented by the differentially expressed miRNA within each cluster, as determined by Descriptive Intermediate Attributed Notation for Ada (DIANA) miRPATH V.3.0 software. |
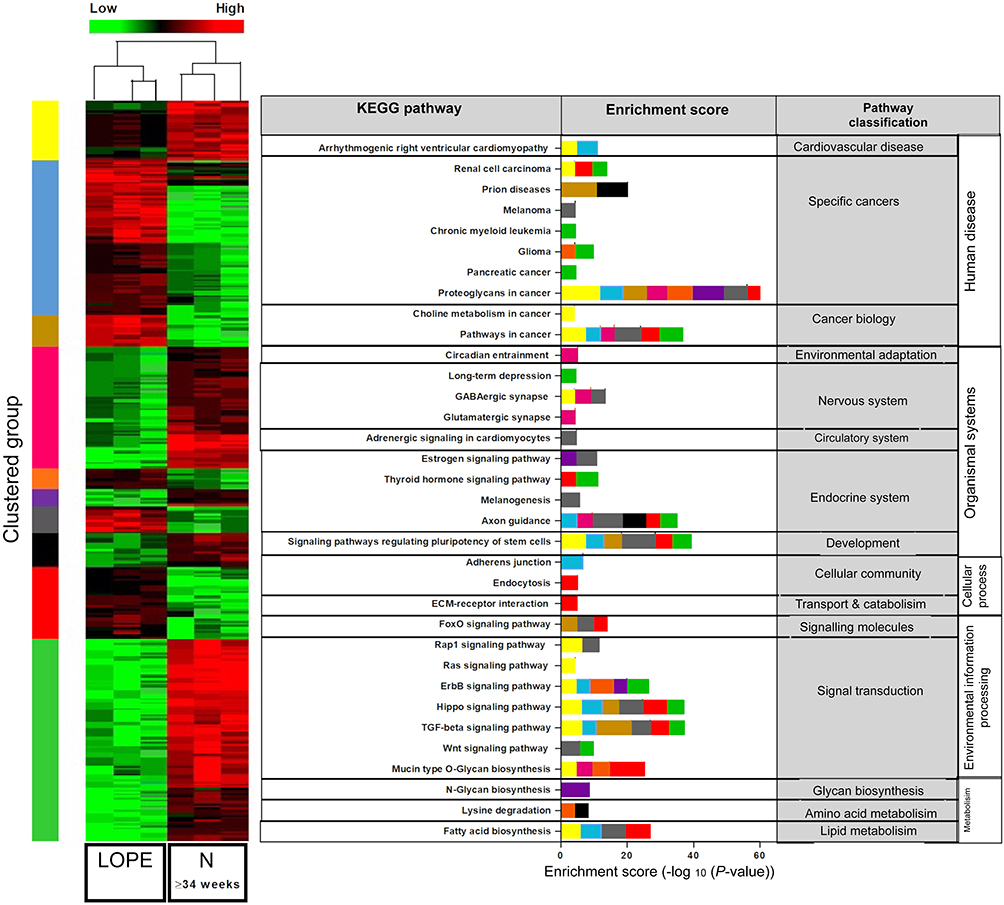 |
Figure 3 Comparison of exomiRNA expression profiles of Late onset Preeclamptic (LOPE) vs Normotensive derived exosomes. (A) Heatmap representing hierarchical clustering of differentially expressed miRNAs in LOPE (n=15, pooled with three technical replicates) and normotensive (n=15, pooled with three technical replicates) derived exosomes using average linkage clustering and Spearman Rank as distance metrics. miRNA profiles are clustered in 8 different subgroups (as indicated by the color bar on the right of the heatmap) defined by the miRNA expression patterns. Samples are shown in columns, miRNA in rows. Heat map from green to red represents relative miRNA expression as indicated in the key bar above the dendrogram. (B) KEGG (Kyoto Encyclopedia of Genes and Genomes) pathway mapping for top canonical pathways represented by the differentially expressed miRNA within each cluster determined using microT-CDs target predicting with (Descriptive Intermediate Attributed Notation for Ada) DIANA miRPATH V.3.0 software. |
Dysregulated exomiRNA in early and late onset preeclampsia in comparison to gestationally matched normotensive pregnant women
Differential expression of exomiRNA was identified using the nSolver Analysis Software (V 4.0). All fold changes (FC) are represented in log 2 scale (log FC). Statistically significant exomiRNAs were selected based on an arbitrary |FC|≥1 and FDR ≤0.05 (Figure 4B–D). To evaluate the function of the significantly dysregulated exomiRNA within the complementary and intersecting group comparisons (Figure 4A), KEGG pathway and GO: Biological process target enrichment analysis was done using DIANA mirPATH together with DIANA-microT-CD 5.0 algorithms (Figure 5A and B respectively). These findings directly linked the identified exomiRNAs to validated pathways and biological functions involved in the pathophysiology of preeclampsia.
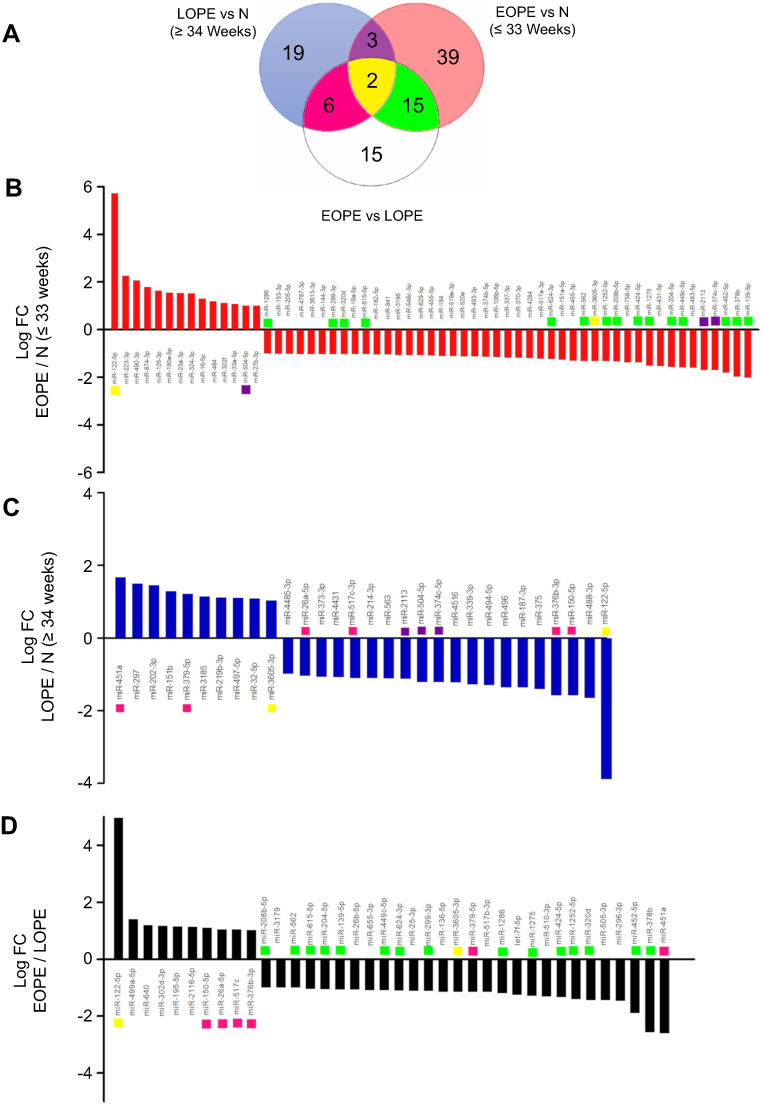 |
Figure 4 Differential expression analysis of exosomal miRNA in early and late onset preeclampsia. (A) Venn diagram representing differentially expressed exomiRNA observed in the comparisons amongst Early-onset Preeclampsia (EOPE), Late-onset Preeclampsia (LOPE) and the respective gestationally matched controls (|fold-change| ≥ 1.0, FDR ≤ 0.05). (B) Log FC values of differentially expressed miRNA in EOPE in comparison to N (≤33 Weeks). (C) Log FC values of differentially expressed miRNA in LOPE in comparison to N (≥34 Weeks). (D) Log FC values of differentially expressed miRNA in EOPE in comparison to LOPE. In B, C and D the x-axis represents the LogFC of differentially expressed miRNA. In B, C and D, respective colors indicate the common miRNA between intersecting groups: |


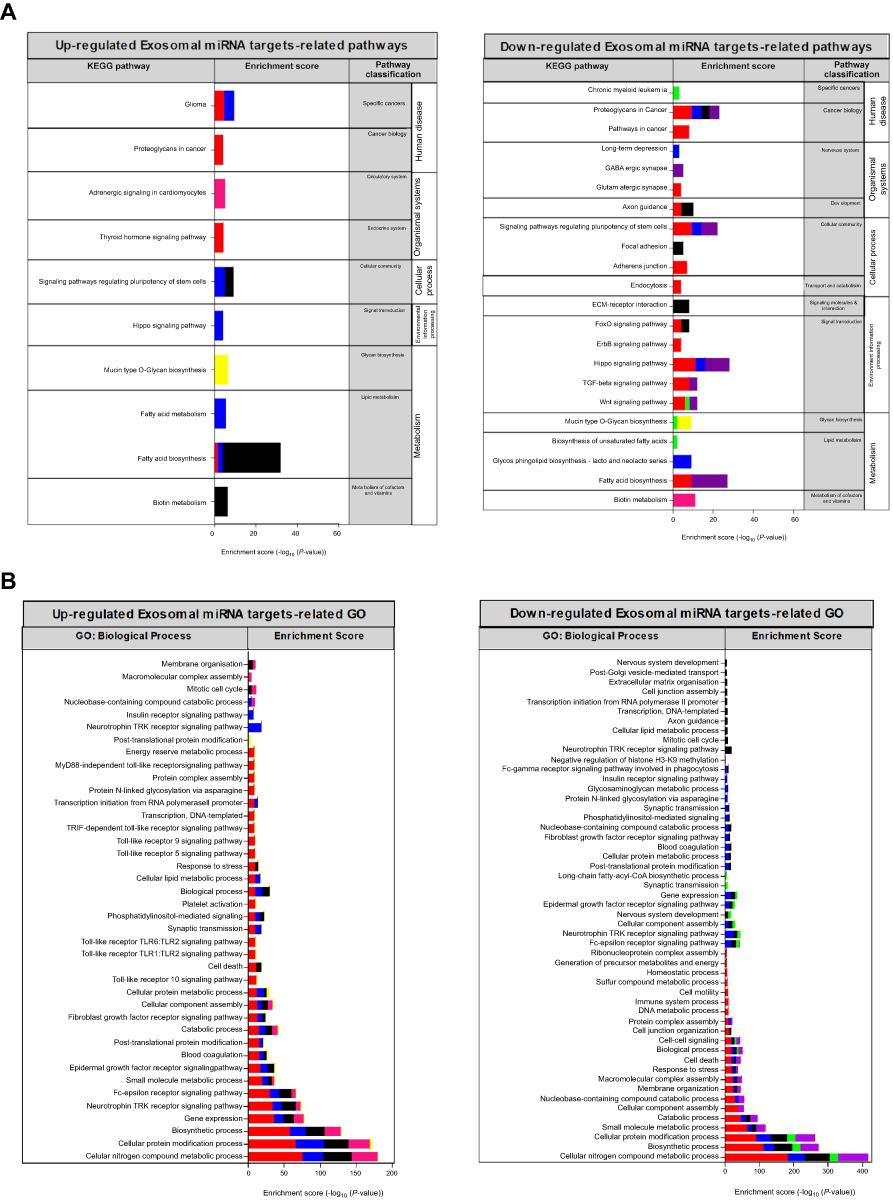 |
Figure 5 Pathway and Gene Ontology enrichment analysis of the exosomal miRNA targets differentially expressed in early and late onset preeclampsia. (A) KEGG (Kyoto Encyclopedia of Genes and Genomes) pathway mapping for top canonical pathways and (B) Biological process of Gene Ontology (GO) enrichment analysis represented by the differentially up and downregulated exosomal miRNAs within each group determined using microT-CDs target predicting with Descriptive Intermediate Attributed Notation for Ada (DIANA) miRPATH V.3.0 software. Each group is represented by the following respective colors: |


Complement analysis
In [EOPE vs N (≤33 weeks)] and [LOPE vs N (≥34 weeks)], 59 and 30 exomiRNAs in total were differentially expressed respectively, of which 39 were unique to EOPE and 19 LOPE with 3 common miRNAs between the groups (Figure 4, Supplementary file 1). In EOPE vs N (≤33 weeks), of the 39 uniquely expressed exomiRNA, KEGG pathway enrichment of the 14 upregulated exomiRNA (Figure 4, Supplementary file 1) represented involvement in lipid metabolism (Fatty acid biosynthesis), endocrine system functioning (Thyroid signaling pathway) and biological processes associated with tumor progression (Proteoglycans in cancer and Glioma) (Figure 5A, p<0.00001). Furthermore, GO: biological process target enrichment indicated that the upregulated EOPE exomiRNA is involved in several key biological processes associated with the pathophysiology of EOPE, these include; platelet activation, blood coagulation, cell death and protein modification, Figure 5B, p<00001). In contrast, KEGG enrichment of the downregulated exosomal miRNAs in EOPE in comparison to N (≤33 weeks) indicate dysregulation in key signaling pathways (Hippo, TGF-beta, Wnt, ErbB, FoxQ signaling pathways), cellular processes (Endocytosis, Adherens junction, Regulation of the pluripotency of stem cells) and organismal systems (Axon guidance, Glutamatergic synapse) (Figure 5A, p<00001).
Of the 19 exclusively dysregulated exomiRNA in [LOPE vs N (≥34 weeks)], KEGG enrichment of the 7 upregulated exomiRNAs (Figures 4 and 5, Supplementary file 1) represented involvement in lipid metabolism (Fatty acid metabolism and fatty acid biosynthesis), signaling pathways (Hippo signaling pathway and signaling pathways regulating pluripotency of stem cells) and cancer biology (Glioma) (Figure 5A, p<0.00001). GO target enrichment of the upregulated exomiRNA in LOPE indicates involvement in several signaling pathways (phosphatidylinositol-mediated, fibroblast growth factor receptor, epidermal growth factor, Fc-epsilon receptor and Neurotrophin TRK signaling pathways) and cellular processes (Cellular lipid metabolism, biological process, synaptic transmission, cellular protein metabolism, cellular component assembly, catabolism, blood coagulation, small molecule metabolism, gene expression, biosynthesis and cellular protein modification) associated with EOPE with however no involvement in cell death, platelet activation, response to stress and Toll-like receptor signaling pathways as displayed in EOPE which distinguishes the pathology of EOPE vs LOPE (Figure 5B, p<0.00001). KEGG pathway enrichment of the downregulated exomiRNA in LOPE vs N (≥34 weeks) indicates dysregulation in cell survival, migration and invasion associated with tumor progression (proteoglycans in cancer) and signaling pathways (Hippo and regulation of pluripotency of stem cells) (Figure 5A, p<0.00001).
Intersect analysis
In the intersect between [EOPE vs N (≤33 weeks)] and [LOPE vs N (≥34 weeks)] exosomal miR-2113 (logFC −1.69 vs −1.12 respectively) and miR-374c-5p (logFC −1.7 vs −1.21) were downregulated. KEGG enrichment indicated that exosomal miR-2113 regulates fatty acid biosynthesis which is a key biological process in lipid metabolism and miR-374c regulates inflammation (KEGG pathways: TGF-beta signaling, Hippo and Wnt signaling pathway) which are key biological processes commonly linked to the pathophysiology of EOPE and LOPE (Figure 5A, p<00001).
In [EOPE vs LOPE] vs [LOPE vs N (≥34 weeks)] and [EOPE vs LOPE] vs [EOPE vs N (≤33 weeks)] 6 and 15 commonly dysregulated exomiRNA (Figure 4, Supplementary file 1) were identified between the groups respectively, suggesting the pathophysiological role of exosomes in EOPE and LOPE in comparison to their respective normotensive controls. In EOPE vs LOPE and EOPE vs N (≤33 weeks), KEGG pathway enrichment (Figure 5A) of the 15 dysregulated exomiRNAs (Figure 4, Supplementary file 1) specifies participation of exosomes in the dysregulation of; protein glycosylation (Mucin type O-Glycan biosynthesis pathway), lipid metabolism (Biosynthesis of unsaturated fatty acids pathway) and signal transduction during cell proliferation and migration (Wnt signaling pathway). This is related to GO biological process targets (Figure 5B) which regulate key cellular (cellular nitrogen compound metabolism, cellular protein modification) and signaling processes (Fc-epsilon receptor signaling pathway, Neurotrophin TRK receptor signaling pathway, Epidermal growth factor receptor signaling pathway, cell-cell signaling) (Figure 5, p<0.00001). Intersecting exomiRNAs (hsa-miR-451a and hsa-379-5p) in the EOPE vs LOPE and LOPE vs N (≥34 weeks) comparisons indicate exosomal involvement in cardiomyocyte adrenergic signaling; a direct association with impaired cardiac function which is a key feature of PE.
Importantly in all comparisons 2 distinct exomiRNAs were identified, both of which indicated involvement in mucin-type O-Glycan biosynthesis pathway (KEGG enrichment p<0.00001, Figure 5A). Coupled to this finding these exomiRNAs were linked to posttranslational protein modification and cellular protein metabolic processes (GO: Biological process target enrichment p<0.00001).
Exosomal miRNA signatures associated with the pathophysiology of early and late onset preeclampsia
In addition to the KEGG and GO enrichment analysis we further analyzed the differentially expressed exomiRNA in each comparison (Figure 4A), for their biological function and gene targets using NCBI gene databases (Tables 2 and 3). This linked the identified exomiRNAs to the validated pathophysiological functions involved in preeclampsia.
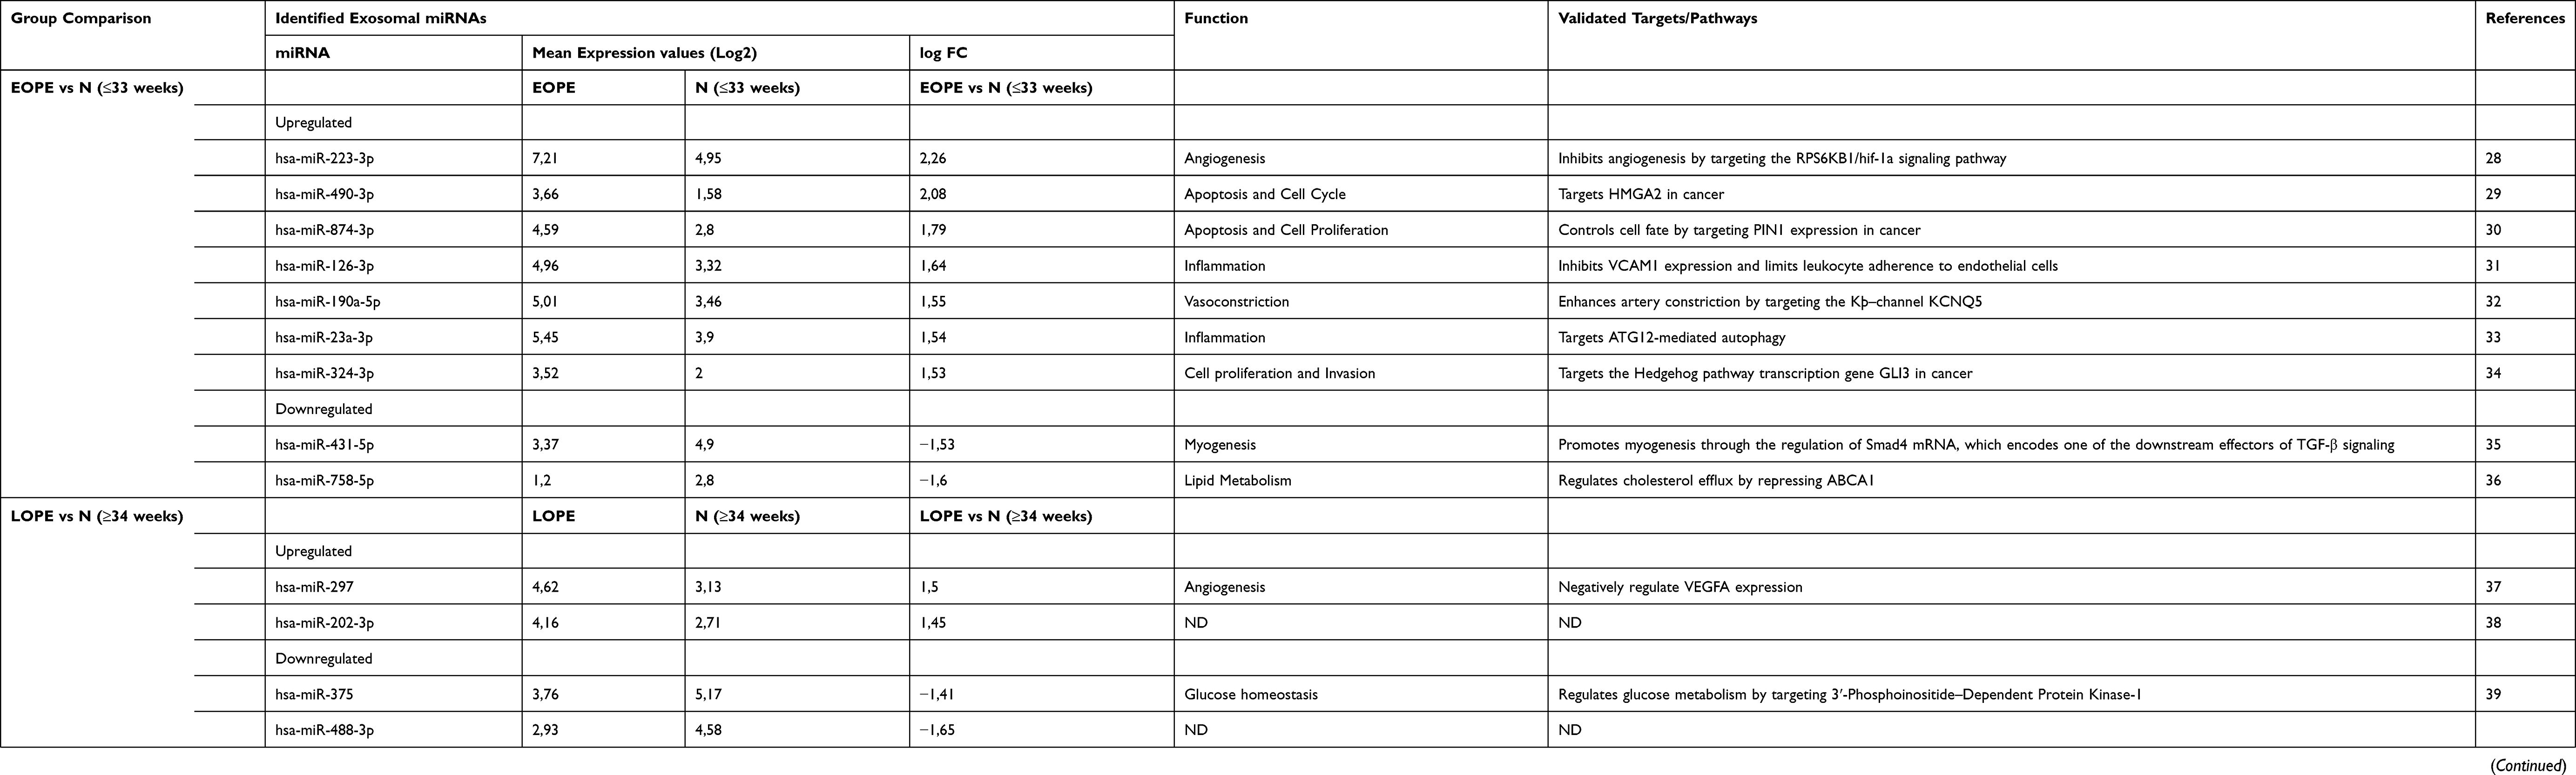 |
Table 2 Functional roles and validated targets of unique exomiRNA identified between group comparisons |
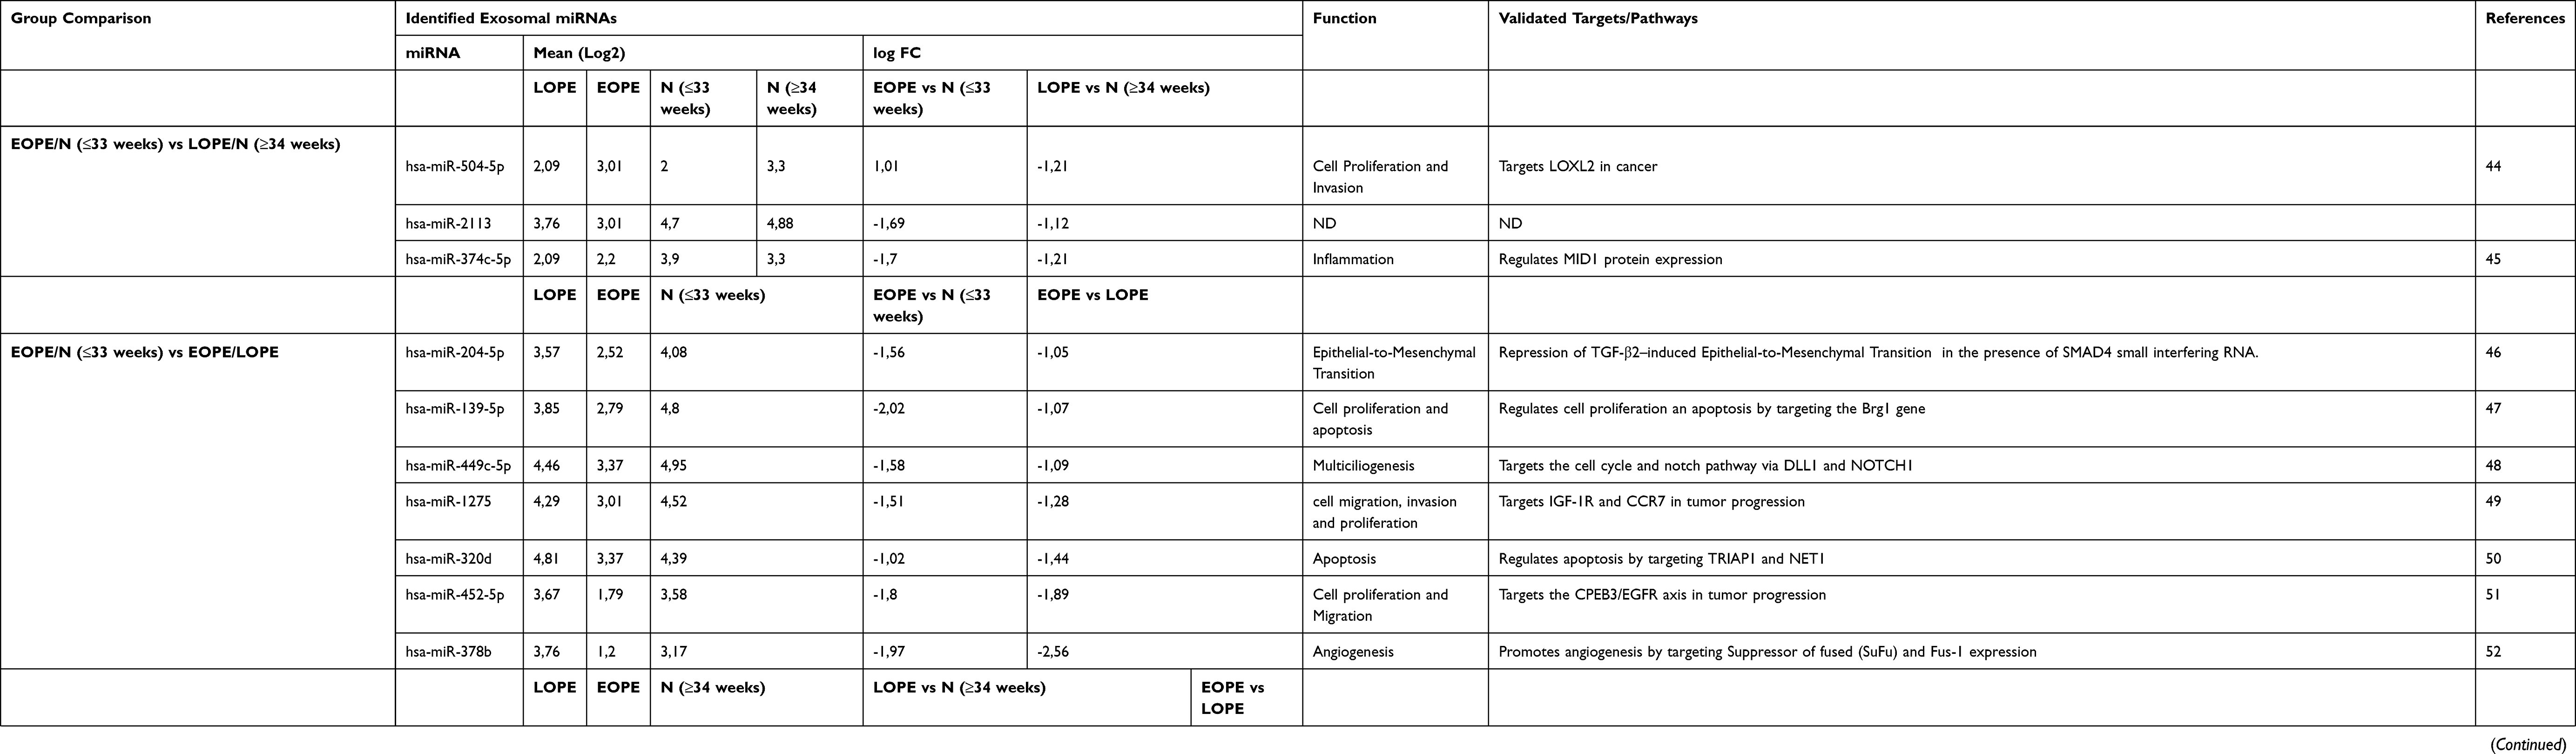 |
Table 3 Functional roles and validated targets of interesting exomiRNA identified between group comparisons |
Complement analysis
In the complement analysis of EOPE vs N (≤33 weeks) and LOPE vs N (≥34 weeks) and EOPE vs LOPE, exomiRNA with an arbitrary |fold change|≥1.0 and FDR ≤0.05 were selected for further evaluation. It was confirmed that the significantly dysregulated exomiRNA unique to the EOPE vs N (≤33 weeks) comparison is associated with key pathophysiological features related to the more severe clinical outcomes of EOPE, such as angiogenesis, cell proliferation, inflammation, vasoconstriction, cell invasion, myogenesis and lipid metabolism (Table 2). Furthermore, in LOPE vs N (≤33 weeks) the dysregulated exomiRNA indicates the role of exosomes in the misregulation of angiogenesis and glucose homeostasis (Table 2), which is associated with the decreased probability of adverse maternal and fetal complications when compared to EOPE. Exosomal miRNA in the EOPE vs LOPE comparison indicated a physiological role in inflammation, angiogenesis, cell proliferation, blood pressure regulation and electrolytic homeostasis, which are features associated with the pathology of PE (Table 2).
Intersect analysis
In the intersect analysis of comparisons, exomiRNA with an arbitrary |fold change|≥1.0 and FDR ≤0.05 were selected for further evaluation of their physiological function and targets (Table 3). Intersecting exomiRNA in the EOPE vs N (≤33 weeks) and LOPE vs N (≥34 weeks) comparisons indicated three statistically significantly dysregulated exomiRNA which have confirmed biological roles in cell proliferation, invasion and inflammation (Table 3). Intersecting exomiRNA in the EOPE vs N (≤33 weeks) and EOPE vs LOPE comparisons indicated a downregulation of the identified exomiRNA in EOPE in comparison to LOPE and N (≤33 weeks) (Table 3). These exomiRNA play a role in the dysregulation of cell migration and invasion, cell proliferation apoptosis, mesenchymal transition, multiciliogenesis and angiogenesis. Furthermore, the enhanced downregulation of exomiRNAs in EOPE in comparison to LOPE and N (≤33 weeks) suggests that exosomes contribute to the more severe maternal and fetal complications associated with EOPE in comparison to LOPE.
In contrast, intersecting exomiRNA between the LOPE vs N (≥34 weeks) and EOPE vs LOPE comparisons indicate that the pathological association between LOPE in comparison to EOPE and N (≥34 weeks) (Table 3) is linked to cell survival, glucose secretion, angiogenesis, autophagy, cell proliferation and migration and trophoblast invasion. Moreover, the dysregulation of hsa-miR-379-5p in LOPE exosomes in comparison to EOPE and N (≥34 weeks) (Log2: 3.93 vs 2.79 and 2.71 respectively) signifies a possible association with the maternal metabolic syndrome in LOPE through the suppression of glucose-induced insulin secretion. In all intersecting comparisons [EOPE vs N (≤33 weeks) and LOPE vs N (≥34 weeks) and EOPE vs LOPE] two exomiRNA; hsa-miR-122-5p and has-miR-3605-3p were common (Table 3). hsa-miR-122-5p has been confirmed to have a function in cholesterol metabolism by targeting CAT1 which directly links to dyslipidemia in PE.
Discussion
Whilst studies have supported the role of exomiRNA as potential biomarkers of PE, their role in the etiopathophysiology of PE and its subtypes remains unclear. Therefore, for the first time, this study has profiled exomiRNA and determined the pathophysiological role of dysregulated exomiRNA in early and late onset-PE using Direct Digital Detection and computational algorithms.
The data observed from the characterisation and quantification of total and placenta-derived exosomes are consistent with our previous study12 reinforcing that differential levels of placenta-derived exosomes in maternal circulation are attributed to the differences in the pathophysiology of the disease subtypes. Moreover, the significant increase of placenta-derived exosomes in EOPE vs N (≤33 Weeks) and decrease in LOPE vs N (≥34 Weeks), which may reflect the role of the placenta in the pathogenesis of PE.
Exosomal miRNA expression profiles in EOPE vs N (≤33 weeks) and LOPE vs N (≥34 weeks) indicate a clear dysregulation and difference in exomiRNA expression between the PE subtypes and the matched normotensive controls. KEGG pathway enrichment of clusters of dysregulated exomiRNA (Figures 2 and 3) reveal top canonical pathways which are associated with cellular signaling, cancer biology, metabolism, cellular processes, cardiovascular disease and organismal systems. Further analysis of highlighted KEGG target genes indicates that exomiRNA in maternal circulation are likely to be involved in modulating key biological processes involved in cell proliferation, invasion, migration and apoptosis, which are known to be dysregulated in PE. Our findings, therefore, support the role of exosomes in reprogramming adjacent or distant cells through autocrine and paracrine signaling mechanisms thereby facilitating the pathogenesis of preeclampsia. Moreover, we identified specific clusters of exomiRNA in both EOPE and LOPE, which are linked to arrhythmogenic right ventricular cardiomyopathy (Figures 2 and 3) indicating that exosomes in maternal circulation may be involved in the dysregulation of cardiac function – a known complication of the disease.60
Computational analysis of statistically significant fold changes in exomiRNA (LogFC ≥1, FDR ≤0.05) between the EOPE vs N (≤33 weeks), LOPE vs N (≥34 weeks) and EOPE vs LOPE groups supports the pathophysiological role of exomiRNA in PE. Enrichment of exclusively upregulated exomiRNA in EOPE vs N (≤33 weeks) indicates that the dysregulation of exomiRNA in EOPE in comparison to N (≤33 weeks) is responsible for the irregular expression of proteoglycans (KEGG pathway: Proteoglycans in cancer, p-value ≤0.00001), which concomitantly contribute to placental proteoglycan deficiency, resulting in placental thrombotic lesions: a key morphological feature of PE placentas.61 Additionally, this pathway interaction indicates that the upregulated exomiRNA in EOPE induces a micro-environment which favours abnormal metastatic-related properties resulting in abnormal cell growth, adhesion, migration and invasion. Moreover, the pathway interactions of significantly upregulated exomiRNA in EOPE are associated with dysregulation of the thyroid hormone signaling pathway by targeting the thyroid hormone receptor-β (THRE), a regulator of calcineurin 1(RCAN1) and Ca2+ transporting ATPase (ATP2A2), which controls cardiac muscle contraction and angiogenesis. Therefore, our findings highlight the potential cardiovascular involvement of exomiRNA in preeclampsia which we are further investigating.
In contrast, the enrichment of exclusively upregulated exomiRNA in LOPE (LogFC ≥1, FDR ≤0.05) indicated a dysregulation in lipid metabolism by targeting fatty acid synthase (FASN) expression which indicates that LOPE exosomes enhance a state of adipogenic trans-differentiation which promotes oxidative stress, chronic inflammation, and, potentially, insulin resistance in LOPE; which are key metabolic features which may be linked to pathophysiology of LOPE or reflective of the increased BMI in LOPE in comparison to EOPE (38.14±3.41 vs 32.42±2.19, p<0.001).62 Moreover, KEGG enrichment of upregulated exomiRNA in EOPE vs N (≤33 weeks) and LOPE vs N (≥34 weeks) indicates a significant involvement in the glioma cancer pathway (p<0.00001), suggesting that EOPE- and LOPE-derived exosomes have the ability to target glial cells through a network of genes responsible for signaling in glial progenitor cells (KEGG highlighted target genes: TGFA, PDGFA, SOS1, AKT3, PTEN and IGF1R) which may provide the possible links to placental branching and vasculogenic, abnormalities that occur during the development of EOPE and LOPE.63
Intersecting exomiRNA hsa-miR-122-5p and hsa-miR-3605-3p were common in [EOPE vs N (≤33 weeks)], [LOPE vs N (≥34 weeks)] and [EOPE vs LOPE]. Exosomal hsa-miR-122-5p expression in all groups may target the polypeptide N-acetylgalactosaminyltransferase gene which regulates the biosynthesis of mucin-type O-glycosylated antigen (Tn antigen); a tumor-associated carbohydrate antigen which is not normally expressed in peripheral tissues or blood cells.64 It is possible that exosomal mediated dysregulation of Tn antigen synthesis may be an important recognition element, mediating cell-cell interactions involved in placental organotrophic metastasis.27,64 Additionally, the upregulation of exosomal hsa-miR-122-5p in EOPE vs LOPE (LogFC 5.72 vs 0.76) could indicate that this exomiRNA in EOPE is associated with the aberrant glycosylation of the Tn antigen which is linked to the enhanced maternal systemic inflammatory response which is commonly observed in PE with severe features.59 Moreover, recent studies have identified that the aberrant glycosylation of proteins in PE is linked to the synthesis of novel proteins involved in hepatic and renal dysfunction65 which suggests that total and placenta-derived exosomes may be involved in causing end-organ complications associated with severe forms of PE.
The identification of unique signatures of exomiRNA in [EOPE vs N (≤33 weeks)], [LOPE vs N (≥34 weeks)] and [EOPE vs LOPE]; revealed key pathophysiological differences between the groups. Significantly dysregulated exomiRNA (LogFC ≤1.4) in [EOPE vs N (≤33 weeks)] were confirmed to have a pathophysiological role in cellular maintenance, inflammation, vasoconstriction, myogenesis and lipid metabolism, all of which are associated with the more adverse pathological features of EOPE in comparison to LOPE.65 In contrast, since significantly dysregulated exosomal hsa-miR-297 and hsa-miR-375 (LogFC ≤1.0) in LOPE vs N (≥34 weeks) has been previously shown to negatively regulate VEGFA expression and glucose homeostasis36,38 suggests that this could contribute to more favourable maternal and neonatal outcomes in comparison to EOPE.66 Furthermore, dysregulated (LogFC ≤1.0) exomiRNAs in EOPE vs LOPE but not in comparison to their physiologic controls (Table 3) indicate that differential severity of EOPE compared to LOPE is mediated by exomiRNAs which modulate cell proliferation and migration, angiogenesis, inflammation and blood pressure regulation. These events and factors are central to the pathogenesis of PE. Interestingly even though no confirmed targets are available for hsa-miR-3605-3p, it has been shown to be linked to Multiple System Atrophy (MSA), a sporadic neurodegenerative disorder characterized by a combination of various degrees of Parkinson cerebellar ataxia and autonomic dysfunction, which might provide a link to the autonomic nervous system control of key physiological processes such as blood pressure regulation in EOPE and LOPE.
Moreover, we found that the exomiRNAs in normotensive and preeclamptic maternal circulation is linked to biological pathways associated with cancer biology. This concurs with a current theory that placental trophoblast and cancer cells can develop a microenvironment which supports immunologic privilege and angiogenesis through molecular mechanisms which regulate hyper-proliferation, invasion, angiogenesis and immunoevasion.27 Therefore, our future studies would seek to compare and integrate the pathophysiological role of exomiRNA in pregnancy, PE and cancer biology to identify possible interrelated mechanisms to better understand the intriguing and natural phenomenon of pregnancy.
This study highlights the possible roles of exomiRNA in the pathophysiology of preeclampsia and its subtypes which warrants further validation of their biomarker potential with a larger and dynamic patient cohort. Furthermore, this study is limited by the unknown cellular origin of the exosomal miRNA identified therefore it becomes challenging to understand the diverse exosome-mediated interactions involved in the pathophysiology. The NanoString Direct Digital Detection technology used in this study has proven to be valuable in a clinical setting due to rapid detection, precision and accuracy. Therefore, future studies will focus on (1) identifying the specific origin of the sub-populations of exosomes for in-depth analysis and (2) validating exosomes and their molecular cargo as biomarkers of preeclampsia and their subtypes.
Conclusion
This novel study identifies exomiRNA signatures in EOPE and LOPE which are implicated in the dysregulation of key physiological processes associated with the etiopathology of PE. Importantly, the interconnectedness of cancer biology and PE is revealed through pathway associations which supports the notion that exomiRNAs in pregnancy and its associated complications, including PE, is related to the “pseudo-malignant like” physiological processes. Furthermore, the discovery of distinct exomiRNA signatures in EOPE and LOPE support the existence of the differential pathophysiology between the subtypes. Therefore, the observations made in this study warrant the diagnostic and functional validation of the signatures as biomarkers of PE and its subtypes.
Acknowledgments
We would like to acknowledge Dr Karminee Maduray and Miss Z Mkhize for the collection of the blood samples, Dr Kogie Moodley for review of the manuscript, Professor Vivienne Russell for the statistical evaluation support, Dr Gerald Kimbi for NanoString technical support, and Dr Caroline Dickens and Miss Therese Dix-Peek for assistance with the nCounter. This project was funded by the National Research Foundation, South Africa (Grant Number: 91544) and the South African Medical Research Council.
Author contributions
All authors contributed towards data analysis, drafting and critically revising the paper, gave final approval of the version to be published, and agreed to be accountable for all aspects of the work.
Disclosure
The authors report no conflicts of interests in this work.
References
1. American College of Obstetricians and Gynaecologists.Hypertension in Pregnancy. Report of the American College of Obstetricians and Gynecologists. Obstet Gynecol. 2013;122:1122–1131.
2. Kuklina E, Ayala C, Callaghan W. Hypertensive disorders and severe obstetric morbidity in the United States. Obstet Gynecol. 2009;113:1299–1306. doi:10.1097/AOG.0b013e3181a45b25
3. Wagner LK. Diagnosis and management of pre-eclampsia. Am Fam Physician. 2004;70:2317–2324.
4. Brown MA, Magee LA, Kenny LC, et al. Hypertensive disorders of pregnancy: ISSHP classification, diagnosis, and management recommendations for international practice. Hypertension. 2018;72(1):24–43. doi:10.1161/HYPERTENSIONAHA.117.10803
5. Redman CW. Current topic: pre-eclampsia and the placenta. Placenta. 1991;12:301–308.
6. Uzan J, Carbonnel M, Piconne O, Asmar R, Ayoubi J-M. Pre-eclampsia: pathophysiology, diagnosis, and management. Vasc Health Risk Manag. 2011;7:467–474.
7. Redman CW. Early and Late onset preeclampsia: two sides of the same coin. Pregnancy Hypertens. 2017;7:58.
8. Pillay P, Moodley K, Moodley J, Mackraj I. Placenta-derived exosomes: potential biomarkers of preeclampsia. Int J Nanomedicine. 2017;12:8009–8023. doi:10.2147/IJN.S142732
9. Southcombe J, Tannetta D, Redman C, Sargent I. The immunomodulatory role of syncytiotrophoblast microvesicles. PLoS One. 2011;6:e20245. doi:10.1371/journal.pone.0020245
10. Tannetta D, Masliukaite I, Vatish M, Redman C, Sargent I. Update of syncytiotrophoblast derived extracellular vesicles in normal pregnancy and preeclampsia. J Reprod Immunol. 2017;119:98–106. doi:10.1016/j.jri.2016.08.008
11. Tannetta D, Collett G, Vatish M, Redman C, Sargent I. Syncytiotrophoblast extracellular vesicles: circulating biopsies reflecting placental health. Placenta. 2017;52:134–138. doi:10.1016/j.placenta.2016.11.008
12. Pillay P, Maharaj N, Moodley J, Mackraj I. Placental exosomes and pre-eclampsia: maternal circulating levels in normal pregnancies and early and late onset pre-eclamptic pregnancies. Placenta. 2016;46:18–25. doi:10.1016/j.placenta.2016.08.078
13. Valadi H, Ekström K, Bossios A, Sjöstrand M, Lee -J-J, Lötvall JO. Exosome-mediated transfer of mRNAs and microRNAs is a novel mechanism of genetic exchange between cells. Nat Cell Biol. 2007;9:654–659. doi:10.1038/ncb1596
14. Thery C, Zitvogel L, Amigorena S. Exosomes: composition, biogenesis and function. Nature Rev Immunol. 2002;2(8):569. doi:10.1038/nri855
15. Zhang J, Li S, Li L, et al. Exosomal MicroRNA: trafficking, sorting, and function. Genomics Proteomics Bioinformatics. 2015;13(1):17–24. doi:10.1016/j.gpb.2015.02.001
16. Nedaeinia R, Manian M, Jazayeri MH, et al. Circulating exosomes and exosomal microRNAs as biomarkers in gastrointestinal cancer. Cancer Gene Ther. 2017;24:48–56. doi:10.1038/cgt.2016.77
17. Jung-Hee Kim J-H, Kim E, Lee MY. Exosomes as diagnostic biomarkers in cancer. Mol Cell Toxicol. 2018;14(2):113–122. doi:10.1007/s13273-018-0014-4
18. Wang Y, Yang X, Yang Y, et al. High-throughput deep screening and identification of four peripheral leucocyte microRNAs as novel potential combination biomarkers for preeclampsia. J Perinatol. 2016;36(4):263–267. doi:10.1038/jp.2015.192
19. Williams Z, Ben-Dov IZ, Elias R, et al. Comprehensive profiling of circulating microRNA via small RNA sequencing of cDNA libraries reveals biomarker potential and limitations. Proc Natl Acad Sci U S A. 2013;110(11):4255–4260. doi:10.1073/pnas.1214046110
20. Mouillet JF, Ouyang Y, Coyne CB, Sadovsky Y. MicroRNAs in placental health and disease. Am J Obstet Gynecol. 2015;4:S163–72. doi:10.1016/j.ajog.2015.05.057
21. Gormley M, Ona K, Kapidzic M, Garrido-Gomez T, Zdravkovic T, Fisher SJ, Preeclampsia: novel insights from global RNA profiling of trophoblast subpopulations. Am J Obstet Gynecol. 2017;(2):
22. Fu G, Brkić J, Hayder H, Peng C. MicroRNAs in human placental development and pregnancy complications. Int J Mol Sci. 2013;14(3):5519–5544. doi:10.3390/ijms14035519
23. Salomon C, Guanzon D, Scholz-Romero K, et al. Placental exosomes as early biomarker of preeclampsia: potential role of exosomal microRNAs across gestation. J Clin Endocrinol Metab. 2017;102(9):3182–3194. doi:10.1210/jc.2017-00672
24. Chatterjee A, Leichter AL, Fan V, et al. A cross comparison of technologies for the detection of microRNAs in clinical FFPE samples of hepatoblastoma patients. Sci Rep. 2015;5:10438. doi:10.1038/srep10438
25. Geiss GK, Bumgarner RE, Birditt B, et al. Direct multiplexed measurement of gene expression with color-coded probe pairs. Nat Biotechnol. 2008;26(3):317–325. doi:10.1038/nbt1385
26. Leitner K, Szlauer R, Ellinger I, Ellinger A, Zimmer KP, Fuchs R. Placental alkaline phosphatase expression at the apical and basal plasma membrane in term villous trophoblasts. J Histochem Cytochem. 2001;49(9):1155–1164. doi:10.1177/002215540104900909
27. Costanzo V, Bardelli A, Siena S, Abrignani S. Exploring the links between cancer and placenta development. Open Biol. 2018;8:180081. doi:10.1098/rsob.180081
28. Ding Q, Shenb L, Nie X, et al. MiR-223-3p overexpression inhibits cell proliferation and migration by regulating inflammation-associated cytokines in glioblastomas. Pathol Res Pract. 2018;214(9):1330–1339. doi:10.1016/j.prp.2018.05.012
29. Liu W, Xu G, Liu H, Li T. MicroRNA‐490‐3p regulates cell proliferation and apoptosis by targeting HMGA2 in osteosarcoma. FEBS Lett. 2015;589(20):3148–3153. doi:10.1016/j.febslet.2015.08.034
30. Leong K-W, Cheng, Wai TC, et al. miR-874-3p is down-regulated in hepatocellular carcinoma and negatively regulates PIN1 expression. Oncotarget. 2017;8(7):
31. Harris TA, Yamakuchi M, Ferlito M, Mendell JT, Lowenstein CJ. MicroRNA-126 regulates endothelial expression of vascular cell adhesion molecule 1. Proc Natl Acad Sci U S A. 2008;105(5):1516–1521. doi:10.1073/pnas.0707493105
32. Li -S-S, Ran Y-J, Zhang -D-D, Li S-Z, Zhu D. MicroRNA-190 regulates hypoxic pulmonary vasoconstriction by targeting a voltage-gated k+ channel in arterial smooth muscle cells. J Cell Biochem. 2014;115(6):1196–1205. doi:10.1002/jcb.24771
33. Si X, CAO D C, Nie J, et al. miR-23a downregulation modulates the inflammatory response by targeting ATG12‑mediated autophagy. Mol Med Rep. 2018;18:1524–1530.
34. Zhang H-Q, Sun Y, Li J-Q, et al. The expression of microRNA-324-3p as a tumor suppressor in nasopharyngeal carcinoma and its clinical significance. Onco Targets Ther. 2017;10:4935–4943. doi:10.2147/OTT.S144223
35. Lee KP, Shin YJ, Panda AC, et al. miR-431 promotes differentiation and regeneration of old skeletal muscle by targeting Smad4. Genes Dev. 2015;29(15):1605–1617. doi:10.1101/gad.263574.115
36. Ramirez CM, Dávalos A, Goedeke L, et al. MicroRNA-758 regulates cholesterol efflux through posttranscriptional repression of ATP-binding cassette transporter A1. Arterioscler Thromb Vasc Biol. 2011;31:2707–2714. doi:10.1161/ATVBAHA.111.232066
37. Jafarifar F, Yao P, Eswarappa SM, Fox PL. Repression of VEGFA by CA-rich element-binding microRNAs is modulated by hnRNP L. Embo J. 2011;30:1324–1334. doi:10.1038/emboj.2011.38
38. Singh K, Williams J, Brown J, et al. Up-regulation of microRNA-202-3p in first trimester placenta of pregnancies destined to develop severe preeclampsia, a pilot study. Pregnancy Hypertens. 2017;10:7–9. doi:10.1016/j.preghy.2017.04.002
39. Ouaamari AE, Nadine Baroukh GA, Martens PL, Pipeleers D, van Obberghen E. miR-375 targets 3′-phosphoinositide–dependent protein kinase-1 and regulates glucose-induced biological responses in pancreatic β-cells. Diabetes. 2008;57(10):2708–2717. doi:10.2337/db07-1614
40. Zhiliang X, Han Y, Liu J, et al. MiR-135b-5p and MiR-499a-3p promote cell proliferation and migration in atherosclerosis by directly targeting MEF2C. Sci Rep. 2015;5:12276. doi:10.1038/srep12276
41. Zhou Y, Xing-Hui L, Zhang -C-C, et al. Hydrogen sulfide promotes angiogenesis by downregulating miR-640 via the VEGFR2/mTOR pathway. Am J Cell Physiol. 2016;310(4):C305–C317. doi:10.1152/ajpcell.00230.2015
42. Escate R, Mata P, Cepeda JM, Padró T, Badimon L. miR-505-3p controls chemokine receptor up-regulation in macrophages: role in familial hypercholesterolemia. Faseb J. 2018;32:2. doi:10.1096/fj.201700518R
43. Mao J, Chunyi L, Zhang Y, Yinghui L, Zhao Y. Human with-no-lysine kinase-4 3′-UTR acting as the enhancer and being targeted by miR-296. Int J Biochem Cell Biol. 2010;42(9):1536–1543. doi:10.1016/j.biocel.2010.06.006
44. Ye MF, Zhang JG, Guo TX, Pan XJ. MiR-504 inhibits cell proliferation and invasion by targeting LOXL2 in non-small cell lung cancer. Biomed Pharmacother. 2018;97:1289–1295. doi:10.1016/j.biopha.2017.11.005
45. Unterbruner K, Matthes F, Schilling J, et al. MicroRNAs miR-19, miR-340, miR-374 and miR-542 regulate MID1 protein expression. PLoS One. 2018;13(1):e0190437. doi:10.1371/journal.pone.0190437
46. Wang Y, Wenfeng L, Zang X, Chen N, Ting Liu PA, Tsonis YH. MicroRNA-204-5p regulates epithelial-to-mesenchymal transition during human posterior capsule opacification by targeting SMAD4. Invest Ophthalmol Vis Sci. 2013;54(1):323–332. doi:10.1167/iovs.12-10904
47. Zhang H, Sun Z, Yu L, Sun J. MiR-139-5p inhibits proliferation and promoted apoptosis of human airway smooth muscle cells by downregulating the Brg1 gene. Respir Physiol Neurobiol. 2017;246:9–16. doi:10.1016/j.resp.2017.07.004
48. Mercey O, Popa A, Cavard A, et al. Characterizing isomiR variants within the microRNA-34/449 family. FEBS Lett. 2017;591:693–705. doi:10.1002/1873-3468.12595
49. Liu MD, Wu H, Wang S, et al. MiR-1275 promotes cell migration, invasion and proliferation in squamous cell carcinoma of head and neck via up-regulating IGF-1R and CCR7. Gene. 2018;10(646):1–7.
50. Hong S, Shuyang L, Lili D, et al. hsa-miR-320d and hsa-miR-582, miRNA biomarkers of aortic dissection, regulate apoptosis of vascular smooth muscle cells. J Cardiovasc Pharmacol. 2018;71(5):275–282. doi:10.1097/FJC.0000000000000568
51. Tang H, Zhang J, Yu Z, et al. Mir-452-3p: a potential tumor promoter that targets the CPEB3/EGFR axis in human hepatocellular carcinoma. Technol Cancer Res Treat. 2017;16(6):1136–1149. doi:10.1177/1533034617735931
52. Templin C, Volkmann J, Emmert MY, et al. Increased proangiogenic activity of mobilized CD34+ progenitor cells of patients with acute ST-segment-elevation myocardial infarction: role of differential microRNA-378 expression. Arterioscler Thromb Vasc Biol. 2017;37(2):341–349. doi:10.1161/ATVBAHA.116.308695
53. Zhu H, Zhang L, Jianmin X, et al. AntogomiR-451 protects human gastric epithelial cells from ethanol via activating AMPK signaling. Biochem Biophys Res Commun. 2018;497(1):339–346. doi:10.1016/j.bbrc.2018.02.082
54. Poy MN, Eliasson L, Krutzfeldt J, et al. A pancreatic islet-specific microRNA regulates insulin secretion. Nature. 2004;432(7014):226–230. doi:10.1038/nature03076
55. Müller-Deile J, Schröder P, Beverly-Staggs L, et al. Overexpression of preeclampsia induced microRNA-26a-5p leads to proteinuria in zebrafish. Sci Rep. 2018;8:3621. doi:10.1038/s41598-018-22070-w
56. Korkmaz G1, le Sage C, Tekirdag KA, Agami R, Gozuacik D. miR-376b controls starvation and mTOR inhibition-related autophagy by targeting ATG4C and BECN1. Autophagy. 2012;8(2):165–176. doi:10.4161/auto.8.2.18351
57. Chen M, Shen C, Zhang Y, Shu H. MicroRNA-150 attenuates hypoxia-induced excessive proliferation and migration of pulmonary arterial smooth muscle cells through reducing HIF-1α expression. Biomed Pharmacother. 2017;93:861–868. doi:10.1016/j.biopha.2017.07.028
58. Anton L, Olarerin-George AO, Hogenesch JB, Elovitz MA. Placental Expression of miR-517a/b and miR-517c Contributes to Trophoblast Dysfunction and Preeclampsia. PLoS One. 2015;10(3):e0122707. doi:10.1371/journal.pone.0122707
59. Bhattacharyya SN, Habermacher R, Ursula Martine EI, Closs WF. Relief of microRNA-mediated translational repression in human cells subjected to stress. Cell. 2006;125(6):1111–1124. doi:10.1016/j.cell.2006.04.031
60. Melchiorre K, Thilaganathan B. Maternal cardiac function in preeclampsia. Curr Opin Obstet Gynecol. 2011;23(6):440–447. doi:10.1097/GCO.0b013e32834cb7a4
61. Chui A, Murthi P, Brennecke SP, Ignjatovic V, Monagle PT, Said JM. The expression of placental proteoglycans in pre-eclampsia. Gynecol Obstet Invest. 2012;73(4):277–284. doi:10.1159/000333262
62. Carreras-Badosa G, Prats-Puig A, Puig T, et al. Circulating Fatty acid synthase in pregnant woman: relationship to blood pressure, maternal metabolism and newborn parameters. Sci Rep. 2016;6:24167. doi:10.1038/srep24167
63. Siqueira M, Francis D, Gisbert D, Gomes FCA, Stipursky J. Radial glia cells control angiogenesis in the developing cerebral cortex through TGF-β1 signaling. Mol Neurobiol. 2018;55(5):3660–3675. doi:10.1007/s12035-017-0557-8
64. Ju T, Aryal RP, Kudelka MR, Wang Y, Cummings RD. The Cosmc connection to the Tn antigen in cancer. Cancer Biomark. 2014;14(1):63–81. doi:10.3233/CBM-130375
65. Ransanen J, Quinn MJ, Laurie A. Maternal serum glycosylated fibronectin as a point-of-care biomarker for assessment of preeclampsia. Am J Obstet Gynecol. 2015;212(1):
66. Raymond R, Peterson E. A critical review of early-onset and late-onset preeclampsia. Osterical Gynecological Surv. 2011;66(8):497–506. doi:10.1097/OGX.0b013e3182331028
 © 2019 The Author(s). This work is published and licensed by Dove Medical Press Limited. The full terms of this license are available at https://www.dovepress.com/terms.php and incorporate the Creative Commons Attribution - Non Commercial (unported, v3.0) License.
By accessing the work you hereby accept the Terms. Non-commercial uses of the work are permitted without any further permission from Dove Medical Press Limited, provided the work is properly attributed. For permission for commercial use of this work, please see paragraphs 4.2 and 5 of our Terms.
© 2019 The Author(s). This work is published and licensed by Dove Medical Press Limited. The full terms of this license are available at https://www.dovepress.com/terms.php and incorporate the Creative Commons Attribution - Non Commercial (unported, v3.0) License.
By accessing the work you hereby accept the Terms. Non-commercial uses of the work are permitted without any further permission from Dove Medical Press Limited, provided the work is properly attributed. For permission for commercial use of this work, please see paragraphs 4.2 and 5 of our Terms.