")
Back to Journals » Drug Design, Development and Therapy » Volume 11
Evaluation of the stability of linezolid in aqueous solution and commonly used intravenous fluids
Authors Taylor R , Sunderland B , Luna G, Czarniak P
Received 11 March 2017
Accepted for publication 2 May 2017
Published 10 July 2017 Volume 2017:11 Pages 2087—2097
DOI https://doi.org/10.2147/DDDT.S136335
Checked for plagiarism Yes
Review by Single anonymous peer review
Peer reviewer comments 3
Editor who approved publication: Dr Georgios Panos
Rachel Taylor, Bruce Sunderland, Giuseppe Luna, Petra Czarniak
School of Pharmacy, Faculty of Health Sciences, Curtin University, Bentley, WA, Australia
Purpose: The aim was to evaluate the stability of linezolid in commonly used intravenous fluids and in aqueous solution to determine the kinetics of degradation and shelf-life values at alkaline pH values.
Methods: Forced degradation studies were performed on linezolid in solution to develop a validated high-performance liquid chromatography analysis. Sodium chloride 0.9%, sodium lactate, and glucose 5% and glucose 10% solution containing 2.0 mg/mL linezolid were stored at 25.0°C (±0.1°C) for 34 days. The effect of temperature on the stability of linezolid in 0.1 M sodium hydroxide solution was investigated to determine the activation energy. The degradation rates of linezolid at selected pH values at 70.0°C and the influence of ionic strength were also examined. Activation energy data were applied to determine the shelf-life values at selected pH values, and a pH rate profile was constructed over the pH range of 8.7–11.4. The stability of intravenous linezolid (Zyvox®) solution was evaluated by storing at 70.0°C for 72 hours.
Results: Linezolid was found to maintain >95.0% of its initial concentration after storage at 25.0°C for 34 days in sodium lactate, 0.9% in sodium chloride, and 5% and 10% in glucose solutions. Linezolid was degraded at alkaline pH values by first-order kinetics. Activation energy data showed that temperature, but not ionic strength, influenced the degradation rate significantly. An activation energy of 58.22 kJ/mol was determined for linezolid in 0.1 M sodium hydroxide solution. Linezolid was least stable at high pH values and at elevated temperatures. It was determined that linezolid has adequate stability for the preparation of intravenous fluids for clinical administration.
Conclusion: Linezolid was found to have a shelf life of 34 days at 25°C when added to sodium lactate, 0.9% sodium chloride, and 5% and 10% glucose solutions. It was least stable at high pH values and at elevated temperatures.
Keywords: linezolid, stability, kinetics, aqueous solution, HPLC
Introduction
As antibiotic resistance continues to rise, there is an urgent need for the development of effective treatments for serious infections.1 Due to its unique mechanism of action, linezolid resistance does not develop often, and it can therefore be used to treat infections when other antibiotics may be ineffective.2,3 In general, linezolid targets Gram-positive aerobic bacteria, including methicillin-resistant Staphylococcus aureus2 and vancomycin-resistant Enterococci;4 however, it has also been shown to have an activity against multiresistant Mycobacterium tuberculosis, as well as certain Gram-negative and anaerobic infections.5,6
Linezolid is a synthetic oxazolidinone antimicrobial agent. It is a weak base with a pKa of 1.87 and contains an amide attached to the oxazolidinone unit, which being labile may be responsible for linezolid’s instability in acidic and especially in basic environments, as indicated in recent forced degradation studies.8,9 Forced degradation studies have also reported that linezolid underwent photodegradation and oxidation.8,9 Linezolid has a solubility of 3.0 mg/mL7 and a melting point of 181°C.10
The lack of shelf-life data on linezolid in solution limits the use of linezolid solutions beyond the currently marketed intravenous formulation.2 Flexibility in the selection of the base intravenous solution, volume, and pH can be advantageous in the hospital and in the “hospital in the home” settings as it broadens the population of patients where intravenous treatment with linezolid would be advantageous and suitable. In addition, treatment at home lowers the costs for patients and governments as well as the demand on hospital beds and enables patients to be treated in the comfort of their own home.
The aim of this study was to determine the stability of linezolid in commonly used intravenous fluids, including sodium chloride 0.9%, sodium lactate (Hartmann’s solution), glucose 5%, and glucose 10% solution. In addition, the study aimed to establish the stability parameters of linezolid over a pH range of 8.7–11.4 and its activation energy parameters. High-performance liquid chromatography (HPLC) was reported as a suitable analytical method for linezolid assays and was utilized in the study.11
Methods and materials
Materials
Linezolid test powder was purchased from Hangzhou Royal Import and Export Co. Ltd. (batch number PZ0014, China); linezolid (Zyvox®) 600 mg/300 mL solution for injection (batch number 15G02U04, expiry July 2018; Pfizer, Australia) and United States Pharmacopoeia (USP) reference standard of Linezolid stated as 99.8% (Lot R02930, Cat number 1367561; US Pharmacopoeia, Rockville, MD, USA) were obtained commercially.
Orthophosphoric acid 85% (batch number 10173, Analar grade; Australia), sodium hydroxide (batch number 1823; Thermo Fisher Scientific Pty Ltd, Australia), methanol (Lot 154; Fisher Chemical, Belgium) of HPLC grade, and water from a Milli-Q Ultrapure Water System (EMD Millipore, Billerica, MA, USA) consisting of a four-bowl ultrapure cartridge kit with a conductivity of 0.05 μs were used for all experiments.
The forced degradation studies utilized 1 M hydrochloric acid, freshly prepared from concentrated hydrochloric acid 32% (batch number 1404100006; Ajax Finechem Pty Ltd, Australia); 1 M sodium hydroxide, prepared using sodium hydroxide pellets (batch number 1823; Thermo Fisher Scientific Pty Ltd); and hydrogen peroxide 6%, prepared using hydrogen peroxide 30% (Univar Analytical Reagent, batch number AF412330; Ajax Finechem Pty Ltd).
Sodium chloride 0.9% intravenous infusion (batch number S98X2, expiry September 2017; Baxter Healthcare Pty Ltd, Australia); compound sodium lactate intravenous infusion BP (Hartmann’s solution) (batch number S99L4, expiry October 2017; Baxter Healthcare Pty Ltd, Australia); glucose 5% intravenous infusion BP (Lot 140348143, expiry December 2016; B. Braun Australia Pty Ltd); and glucose 10% solution (manufactured on February 17, 2016; expiry May 17, 2016, Curtin University, Australia) were prepared from D-glucose anhydrous (Ajax Finechem Pty Ltd; Grade AR) dissolved in distilled water and sterilized by autoclaving at 121°C for 15 minutes, and were used for intravenous fluid stability testing.
Sodium chloride analytical reagent (batch number 06040301, expiry April 2009; Lab-Scan Analytical Sciences), disodium hydrogen orthophosphate anhydrous (Product number 10249, Analar; BDH Chemicals Australia Pty. Ltd, Kilsyth, VIC, Australia), anhydrous sodium carbonate (LOT 88H0463; Sigma, Australia), and analytical grade sodium hydrogen carbonate (batch number 242953, Lab serv; BioLab Ltd, Australia) were used for preparation of buffers for pH reaction rate profile testing.
Assay of linezolid
A PerkinElmer, Lambda 25 UV/VIS Spectrometer was used to determine the optimum wavelength using mobile phase as the blank and a 9.0 μg/mL USP standard linezolid in mobile phase solution. The wavelength was scanned from 200 to 600 nm.
HPLC used an Agilent pump and a photodiode array detector from the 1100 series and an injector of the 1200 series (Agilent Technologies, Santa Clara, CA, USA). Agilent ChemStation® software and an Apollo C18 reverse phase HPLC column (150×4.6 mm particle size 5 μm, Lot No 0511000135) were used for the analysis.
A wavelength of 253 nm was used with a filtered degassed mobile phase of 40.0% methanol and 60.0% phosphate buffer (pH 7; 0.011 M) at a flow rate of 1.0 mL/min and a sample volume of 10.0 μL, as modified by Patel et al.12 USP standard linezolid solutions at concentrations from 2.0 to 10.0 μg/mL were analyzed to produce a calibration curve for the USP linezolid standard. In a similar manner, test linezolid solutions were analyzed and a calibration curve was constructed. The purity (%) of 10.0 μg/mL test linezolid was determined using Equation 1, where AUC is the area under the curve. A Gilson Pipetman Pipette (Middleton, WI, USA) was used for measuring small volumes in order to reduce error:
| (1) |

Forced degradation studies used four 10.0 mL volumetric flasks containing 2.0 mg/mL linezolid solutions with 0.1 M hydrochloric acid, 0.1 M sodium hydroxide, 0.6% hydrogen peroxide, or Milli-Q water. Flasks were stored in a Grant Instruments Ltd water bath (Model JB1, Serial number 609501003; Cambridge) at 75.0°C (±0.1°C) and a Brannan 76 mm immersion thermometer was used to monitor the water bath temperature. Samples were taken regularly over 24 hours, neutralized and diluted to a nominal 10.0 μg/mL, and analyzed using the HPLC. An ultrasonic water bath (ACN: 001768396m; John Morris Scientific Pty Ltd, Australia) was used to dissolve test linezolid into solution. Based on their final concentrations, the samples were spiked back to their nominal 2.0 mg/mL concentrations and assayed by HPLC accordingly.
An 8.0 μg/mL linezolid solution in mobile phase was analyzed in triplicate by HPLC to evaluate assay reproducibility. Intraday and interday reproducibility was established by analyzing six samples of the 8.0 μg/mL solution over 3 days. The mean and SD of the AUC results were calculated to determine intraday and interday reproducibility.
Compound analysis
Water content of linezolid was determined using a Thermoline Scientific Laboratory hot air oven (Wetherill Park, NSW, Australia) to heat an accurately weighed sample of the test linezolid at 100°C for 3 hours. The moisture percentage was determined from Equation 2. The sample was then left to cool to room temperature and weighed. Linezolid was stored in a Jencons Dry Seal Desiccator (B.34 BSS572) and anhydrous calcium chloride was used as the desiccant.
| (2) |
Samples of test linezolid and USP standard linezolid underwent 1H nuclear magnetic resonance (NMR) spectroscopy and 13C NMR spectroscopy. Results were recorded on a Bruker Avance III UltraShield™ 400 MHz spectrometer using deuterated dimethyl sulfoxide as the solvent.
USP standard linezolid and test linezolid were assayed separately using a PerkinElmer DSC8000 Differential Scanning Calorimeter to assess thermal events. Pyris™ software was used to analyze and compare the melting points of the two compounds. The purge gas was nitrogen at a flow rate of 20.0 mL/minute, and testing was completed at an initial temperature of 50.0°C. This was held for 1 minute and then heated to 200.0°C at a rate of 10.0°C/minute.
A Perkin Elmer® Spectrum 2™ IR spectrometer was used for infrared spectroscopy analysis of USP standard linezolid and test linezolid. USP standard linezolid was placed onto crystal and underwent attenuated total reflectance correction to allow for Fourier transform infrared reporting. Perkin-Elmer Spectrum software was used for the analysis. The process was repeated with the test linezolid and results were compared.
Linezolid in aqueous intravenous solutions
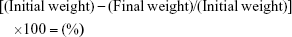
Intravenous fluid stability studies involved four 2.0 mg/mL linezolid solutions stored in 200.0 mL volumetric flasks sealed with polypropylene stoppers and made to volume with one of each of the following intravenous solutions: glucose 5%, glucose 10%, Hartmann’s solution, and sodium chloride 0.9% solution. The solutions were placed into a Hetofrig water bath (model CB60, Serial number: 8308495; Denmark) set at 25.0°C (±0.1°C), and triplicate samples were taken from each flask and diluted to produce a nominal 10.0 μg/mL solution initially and after 4, 7, 14, 21, and 34 days. Samples were then analyzed in triplicate using the established HPLC method, and the percentage degradation was determined using Equation 3. A 1.0-mL Terumo Syringe and an Acrodisc syringe filter 0.2 μm were used to filter the linezolid in glucose 10% solution samples prior to analysis after day 14 to prevent any microbial growth entering the HPLC.
| (3) |

Activation energy determination
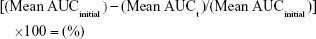
Double strength sodium hydroxide solution containing 0.2 M sodium hydroxide and 0.8 M sodium chloride was prepared. In a separate flask, a 2.0 mg/mL aqueous linezolid solution was prepared. Equal 25.0 mL proportions of each solution were equilibrated at the required temperature (±0.1°C) in a Grant Instruments Ltd water bath (Model JB1. Serial number: 609501003) using a Brannan 76-mm immersion thermometer to monitor the temperature. Solutions were combined in a 50.0 mL volumetric flask and sealed with a polypropylene stopper and mixed well. The flask was sampled regularly until at least 30% of the linezolid had degraded. Each sample was neutralized with 0.1 M hydrochloric acid and diluted to a nominal 10.0 μg/mL solution and assayed by HPLC. The procedure was performed at 48.0°C, 55.0°C, 63.0°C, and 70.0°C. Least-squares analysis was used to determine the order of the reaction, rate constants, and the activation energy for linezolid degradation. Concentration (%) was determined from Equation 4.
| (4) |
Kinetics studies and influence of pH and ionic strength on stability
The following systems were evaluated at 70.0°C: 50.0 mL 0.01 M sodium hydroxide with 1.0 mg/mL linezolid solution and ionic strength adjusted to 0.5 M; 50.0 mL 0.1572 M pH 11 phosphate buffer containing 1.0 mg/mL linezolid and ionic strength adjusted to 0.5 M; 50.0 mL 0.086 M pH 10 bicarbonate buffer containing 1.0 mg/mL linezolid and ionic strength adjusted to 0.5 M; and 50.0 mL 0.056 M pH 9 bicarbonate buffer containing 1.0 mg/mL linezolid and ionic strength adjusted to 0.5 M. Based on the elevated testing temperature of 70.0°C, pH adjustments were made to the pH values measured at room temperature, and a pH reaction rate profile was created. Each of the 0.1 M sodium hydroxide solutions with ionic strength adjusted to 0.2 and 0.4 M, containing 1.0 mg/mL linezolid, was analyzed using the same procedure to assess the influence of ionic strength on the degradation rate of linezolid. All ionic strength adjustments used sodium chloride. The pH of each buffer solution was measured at room temperature using a digital Hanna Instruments pH meter (HI8519N; Portugal).
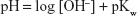
The pH values of sodium hydroxide solutions at elevated temperatures were determined from the ionic product of water in sodium chloride at an ionic strength of 0.5 M, using the data of Busey and Mesmer,13 which gave a pKw =12.4, and pH values were determined from Equation 5.
| (5) |
In buffer solution, the pH is determined by the Henderson–Hasselbalch equation (Equation 6).
| (6) |

At the same salt-to-acid ratios, the change in pH with temperature is controlled by the effect of temperature on the pKa of the acid. Data for the effect of temperature on the pKa3 value for phosphoric acid and for the pKa2 of carbonic acid were determined by Mesmer et al14 and Millero et al.15
Calculation of rate constants, activation energy, and shelf life
Methods for the determination of rate constants are discussed in detail in the work of Martin.16
Consider a reaction of the type:
| (7) |

where A and B are the reactants and the forward reaction is assumed to go to completion.
Then,
| (8) |

where A and B are the reactants at concentrations c.
If cB is in excess, then the first-order kinetics are obeyed and Equation 8 becomes
| (9) |

and the integrated rate expression is
| (10) |
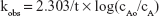
where kobs is the observed first-order rate constant; cAo is the initial concentration and cA is the concentration at time = t.
A plot of Equation 10 should give a straight line of slope = −kobs/2.303.
Activation energy data were determined using the Arrhenius temperature dependence theory.
In logarithm form, the relationship is
| (11) |

where k is the rate constant, A the frequency factor, Ea the activation energy, R the universal gas constant, and T the temperature in Kelvin (K).
Therefore, a plot of log k versus 1/T provides a slope of −Ea/2.303 from which the activation energy could be determined.
When calculating the shelf life for pH values at 70.0°C, Equation 12 was used based on the reaction rate constants (k) determined from the first-order relationship with respect to each pH:
| (12) |

Equation 13 was used to estimate the reaction rate at 25.0°C. Equation 12 was then used to calculate the shelf life.
| (13) |

where t90 is equal to the time to reach 90.0% of the initial concentration, k the reaction rate constant, Ea the activation energy, R the universal gas constant, and T is the temperature in Kelvin.
Intravenous linezolid (commercially prepared) solution
Intravenous linezolid (commercially prepared) solution was placed into a 100.0 mL volumetric flask sealed with a polypropylene stopper and stored at 70.0°C for 3 days. Samples were taken regularly in triplicate, diluted to a nominal 10.0 μg/mL solution, and assayed in triplicate using the established HPLC method. Degradation (%) was based on Equation 4.
Results
Linezolid assay development and analysis
The peak absorbance of linezolid using UV spectrophotometry was at 253 nm, and at this wavelength, HPLC analysis produced superior separation of peaks with a linezolid retention time of ~7 minutes achieved using a mobile phase containing 40.0% methanol and 60.0% pH 7 phosphate buffer. The USP standard linezolid data sheet stated 99.8% purity. A calibration curve of standard USP linezolid was used to determine the amount of linezolid in the test sample. A linear relationship for a concentration range of 2.0–10.0 μg/mL was obtained and produced the equation y =0.0292x +0.0369 (R2=0.9999) using concentrations calculated from AUC results. The calibration curve developed for the test linezolid over the concentration range of 2.0–12.0 μg/mL had an equation of y =0.0327x +0.0393 (R2=1). No additional peaks were identified during analysis, and the retention time remained at ~7 minutes. Percentage purity of the test linezolid was calculated from average peak areas and Equation 1, and found to be 98.09%.
The overall SD of interday results was 1.40, and the coefficient of variation was 0.63% (being <2.0% the result is acceptable). Intraday SD testing indicated the average SD values of 1.20 and 1.27, and the coefficient of variation values of 0.54% and 0.57%, which are below 2% and therefore considered acceptable.
During forced degradation studies, linezolid completely degraded after 1 hour in 0.1 M sodium hydroxide solution, producing a yellow solution. Linezolid showed minimal degradation in hydrochloric acid, hydrogen peroxide, or water. Degradation peaks were clearly separated from the initial linezolid peak compared with degradation at 24 hours, as shown in Figure 1 (retention time ~7 minutes). Following the testing, solutions were left at room temperature for 1 week, and it was noted that the sodium hydroxide solution became a deeper yellow color, and the hydrogen peroxide solution turned light pink, possibly indicating slight oxidation.
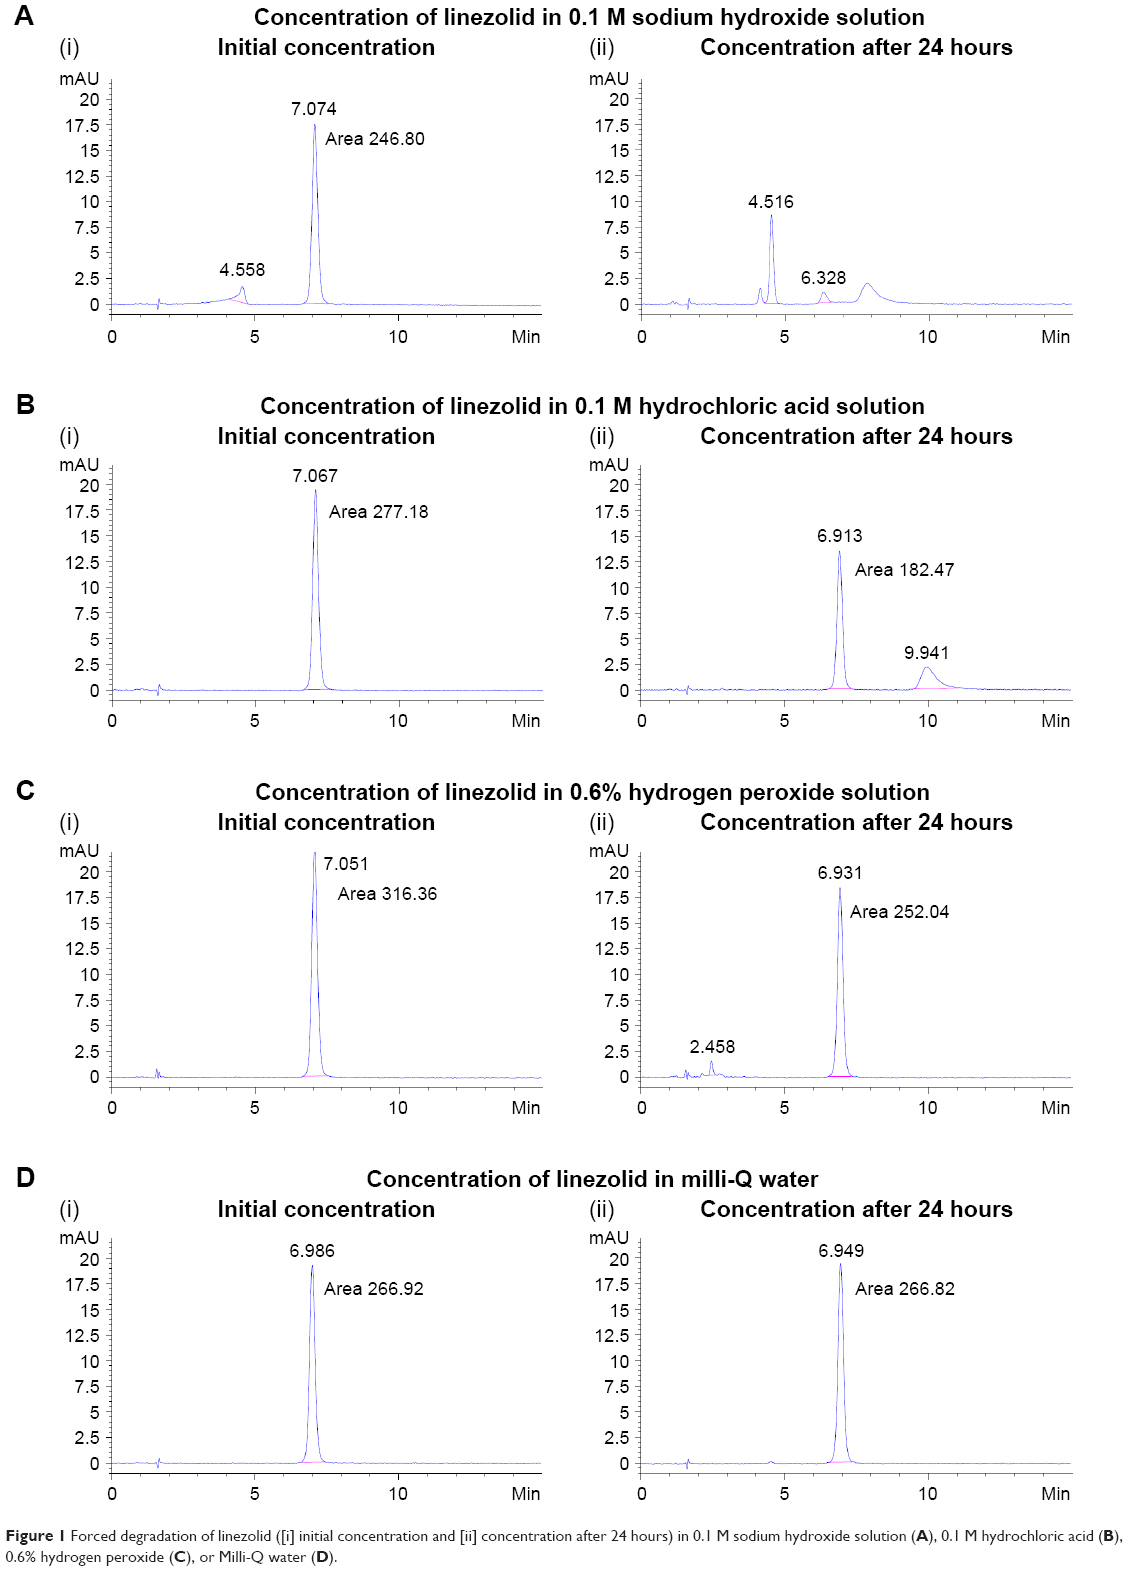 | Figure 1 Forced degradation of linezolid ([i] initial concentration and [ii] concentration after 24 hours) in 0.1 M sodium hydroxide solution (A), 0.1 M hydrochloric acid (B), 0.6% hydrogen peroxide (C), or Milli-Q water (D). |
Drying linezolid powder in the hot air oven for 3 hours resulted in a total weight loss of 0.0035 g and an overall loss of 0.07%; hence, the sample was essentially dry.
NMR analysis of USP standard and test linezolid showed similar results with the total number of protons detected in the NMR proton analysis, and the number of carbons detected using the 13C method corresponded to those in the linezolid structure (Figure 2A and B).
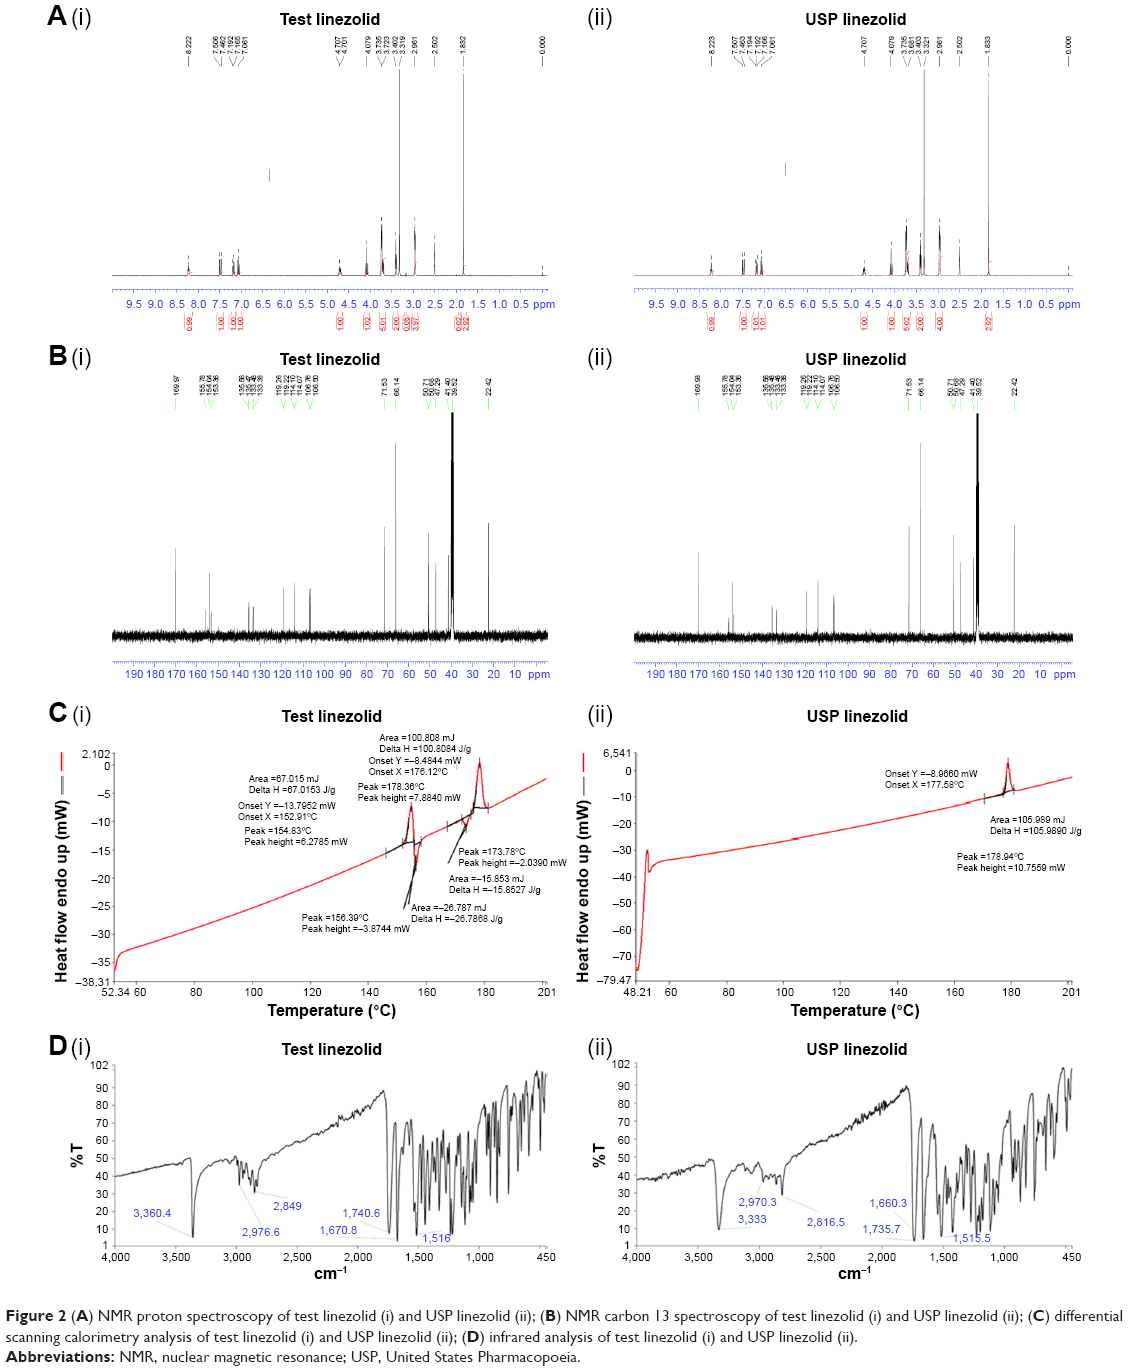 | Figure 2 (A) NMR proton spectroscopy of test linezolid (i) and USP linezolid (ii); (B) NMR carbon 13 spectroscopy of test linezolid (i) and USP linezolid (ii); (C) differential scanning calorimetry analysis of test linezolid (i) and USP linezolid (ii); (D) infrared analysis of test linezolid (i) and USP linezolid (ii). |
Differential scanning calorimetry (DSC) identified four thermal events for the test linezolid sample (Figure 2C). An endothermic event at 154.83°C and exothermic events at 156.39 and 173.78°C in addition to a single endothermic melting point at 178.36°C also identified in the USP linezolid standard analysis (178.94°C). This potentially indicates the presence of polymorphic structures of linezolid present in the solid state of the test sample; however, polymorphism does not influence the liquid state.
Infrared analysis showed no differences between USP standard and test linezolid (Figure 2D).
Stability testing in intravenous solutions
Intravenous fluid stability testing data (Table 1) indicated that linezolid maintained a concentration >95.0% in all intravenous solutions examined when stored at 25.0°C for 34 days.
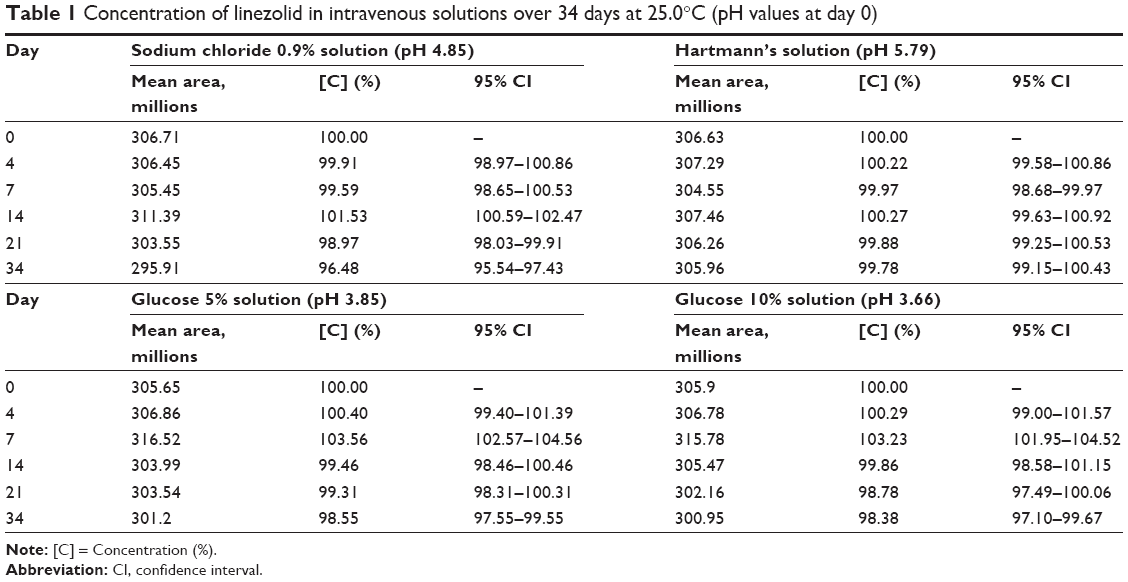 | Table 1 Concentration of linezolid in intravenous solutions over 34 days at 25.0°C (pH values at day 0) |
Activation energy determination
Kinetic runs in 0.1 M sodium hydroxide solution all showed linear first-order relationships when log (concentration) was plotted against time. The rate constants obtained are shown in Table 2. Degradation rate decreased monotonically as temperature was lowered, and based on the Arrhenius equation (Figure 3), an activation energy was calculated to be 58.22 kJ/mol.
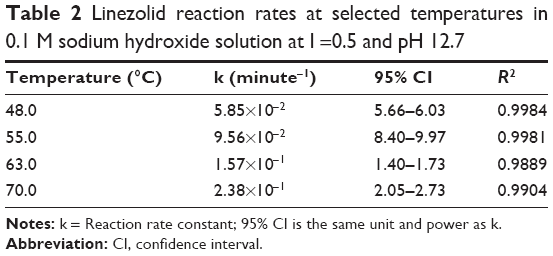 | Table 2 Linezolid reaction rates at selected temperatures in 0.1 M sodium hydroxide solution at I =0.5 and pH 12.7 |
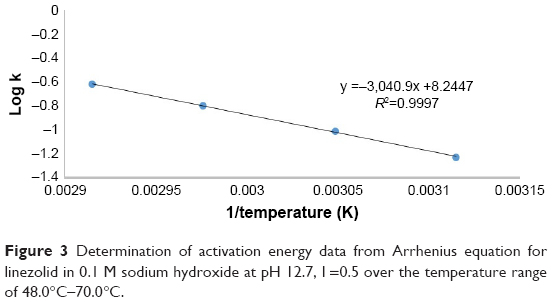 | Figure 3 Determination of activation energy data from Arrhenius equation for linezolid in 0.1 M sodium hydroxide at pH 12.7, I =0.5 over the temperature range of 48.0°C–70.0°C. |
Kinetic studies in alkaline solution
Studies were carried out at 70.0°C over the pH range of 8.7–11.4. These data are reported in Figure 4 and Table 3, and show that the first-order kinetics was observed and the respective shelf-life values were calculated at 70.0°C and 25.0°C between pH 8.7 and 11.4. Adjustments to pH data measured at 25.0°C and 70.0°C were based on literature data, and enabled a log reaction rate versus pH profile to be constructed, which provided a linear relationship fitting the equation y =1.1812x −14.307 (R2=0.9761) (Figure 5). At 70.0°C, the pKa2 of carbonic acid changes from 10.315 to 10.115 at 25.0°C; pH 9, therefore, approximates pH 8.7 and pH 10 approximates pH 9.7. Between 25.0°C and 70.0°C, the pH of phosphoric acid falls by ~0.75;14 therefore, a pH 11 solution at 25.0°C adjusts to pH 10.3 at 70.0°C. At room temperature, the pH of 0.1 M sodium hydroxide solution is 12.7 but becomes 11.4 at 70.0°C because of the effect of temperature on the ionic product of water (pKw), which at 70.0°C is equal to 12.4.13 Hence, the pH of 0.01 M sodium hydroxide solution is 11.7 at room temperature, but at 70.0°C, the pH value decreases to 10.4. It is evident that the slope of the log pH reaction rate relationship is close to +1 indicating specific OH− catalysis over this pH range (Figure 5).
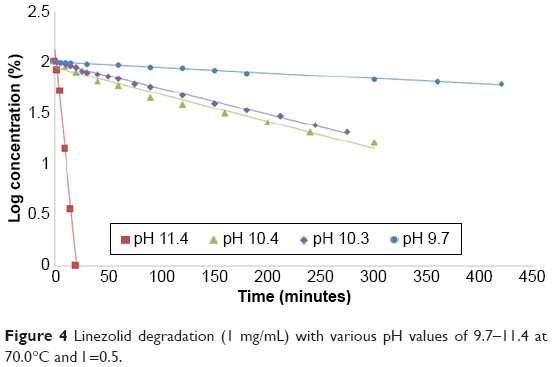 | Figure 4 Linezolid degradation (1 mg/mL) with various pH values of 9.7–11.4 at 70.0°C and I =0.5. |
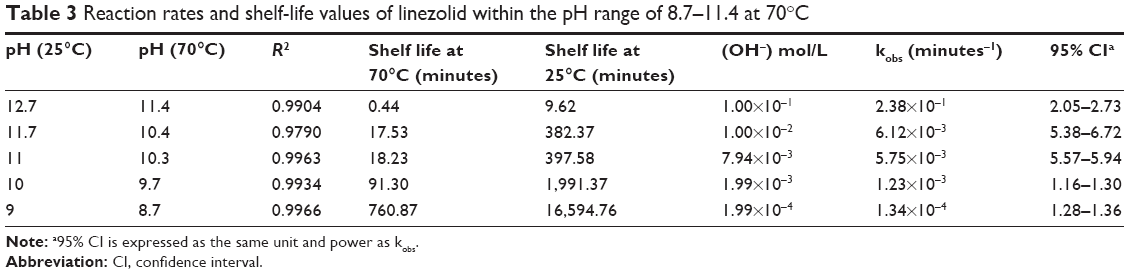 | Table 3 Reaction rates and shelf-life values of linezolid within the pH range of 8.7–11.4 at 70°C |
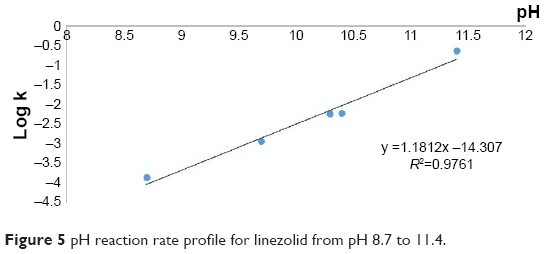 | Figure 5 pH reaction rate profile for linezolid from pH 8.7 to 11.4. |
When the rate data are fitted to the linear equation kobs = k0 + kOH[OH−], the second-order rate constant for OH− catalysis of linezolid over the pH range of 8.7–11.4 was determined. This gave a slope of 2.455 and had an intercept of −0.009, and R2=0.996. The second-order rate constant of OH− catalysis was, therefore, 2.46%−1 minute−1.
Ionic strength analysis
Degradation rates of linezolid in 0.1 M sodium hydroxide at I =0.2, 0.4, and 0.5 total ionic strength values gave the rate constants of 2.25×10⁻¹ minute−1 (R2=0.9901), 2.03×10⁻¹ minute−1 (R2=0.9814), and 2.38×10⁻¹ minute−1 (R2=0.9904), respectively. These were for the solutions of 1.0 mg/mL linezolid and showed degradation rates in solution within experimental error and, therefore, showed no ionic strength effect on the reaction rate.
Marketed linezolid (commercially prepared) solution
The pH of commercially prepared linezolid intravenous solution was found to be 4.59 at 25.0°C prior to analysis, and after 72 hours stored at 70.0°C, no noticeable degradation occurred based on the HPLC analysis employed.
Discussion
These are the first data to become available on the stability of linezolid in aqueous solution. In commonly used intravenous solutions in the hospital setting, linezolid was stable in sodium chloride 0.9% solution, Hartmann’s solution, glucose 5% solution, and glucose 10% solution for 34 days at 25.0°C. It was noted that the pH of these solutions was similar to that of the commercially available linezolid intravenous formulation, which remained stable in this study for 72 hours at 70.0°C. In alkaline solution, linezolid degraded by the first-order kinetics and demonstrated specific OH− catalysis between pH 8.7 and 11.4. The activation energy for linezolid degradation at pH 11.4 was calculated to be 58.22 kJ/mol. This enabled the shelf-life values to be estimated at 25.0°C over the pH range of 8.7–11.4.
There are currently no parameters for the assignment of the shelf life of linezolid available in the USP or the British Pharmacopoeia. A 90%–110% concentration of linezolid was used as the standard for determining linezolid shelf life based on a draft monograph for the USP.17 When placed in sodium chloride 0.9% solution, Hartmann’s solution, glucose 5% solution, and glucose 10% solution, linezolid maintained >95% of the initial concentration over the 34-day test period, and all solutions had pH values between 3.5 and 6. This indicates the potential for multiple patient groups to be treated with linezolid as an additive in a selection of common intravenous fluids and its suitability for hospital in the home usage.
Both the intraday and interday analyses of the average peak area of linezolid resulted in a coefficient of variation <2.0% and thus could be considered sufficiently precise, indicating that the HPLC analysis methodology was reproducible and reliable.
Kinetic runs at elevated temperatures indicated that linezolid degradation occurred via the first-order kinetics. As the temperature decreased, the reaction rate slowed. An activation energy for linezolid of 58.22 kJ/mol was determined and indicated that increasing the temperature by 10°C would appropriately double the rate of degradation of linezolid in solution. A pH rate profile for linezolid degradation showed a specific OH− catalysis over the pH range of 8.7–11.5, with the rate of linezolid degradation slowing as the pH decreased. As linezolid is a weak base with a pKa value of 1.8, it would be predicted the Ea value would be similar over the whole of the OH− reaction pH range as no ionic transformations occur. Additionally, when the temperature was maintained and sodium hydroxide concentration was decreased, the degradation rate of linezolid also decreased, indicating the dependence on OH− concentration.
When considering the effect of ionic strength, the impact appears negligible. Degradation rates at ionic strengths of 0.2 and 0.4 M solutions reflected that of the 0.5 M ionic strength sodium hydroxide solution, indicating that linezolid would be equally stable in an ionic sodium chloride solution and a nonionic glucose solution.
Currently, intravenous linezolid is only available as a single inflexible formulation, restricting the usage to patients who are suitable for all constituents. The formulation is expensive and is the only option for hospitals because of a lack of data on linezolid stability in standard intravenous fluids. Using this solution would also cause difficulties where, for example, a patient requiring both intravenous glucose solution and linezolid could be coadministered rather than risking fluid overload with the use of glucose solution and the commercially available intravenous linezolid solution simultaneously. The commercially available linezolid intravenous solution showed minimal degradation after 3 days at 70.0°C, and with a pH of ~4.59, the formulation appears to be initially stable despite the elevation of temperature. Despite being stable in this intravenous formulation, results have indicated that linezolid can be stable in common intravenous fluids for up to 34 days. Base solution selection can be made to suit the individual patient and broaden the number of patients able to be treated with the antibiotic. Intravenous linezolid in commonly used intravenous fluids could be prepared within the hospital as required and highlights possible cost savings for the hospital and the community.
There were, however, limitations to this study as testing was only completed in four intravenous fluids. Despite these being common intravenous fluids, there are other solutions that could have been tested to further expand the application of the study. In addition, the intravenous study was not run long enough to obtain any significant level of degradation, and thus, while results indicate a shelf life of 34 days, no extrapolated shelf life could be obtained. To achieve a significant amount of degradation, the experiment would have needed to be completed for an extended period of time that was not possible within the scope of this study.
In addition, stability with respect to pH was only completed over a range of pH 8.7–11.4 as the reaction had slowed significantly and testing at lower pH values would have been beyond the scope of the study. A prolonged study at lower pH values would have given an indication as to the behavior of linezolid over the whole pH range.
Forced degradation results showed that linezolid rapidly degraded in sodium hydroxide at a high temperature, which has been reported in other studies.8,9 In hydrochloric acid, a small degradation peak developed within 24 hours, and while in the hydrogen peroxide solution, the linezolid did not develop any measurable degradation peak, a pink coloration of the solution appeared after 1 week at room temperature potentially indicating oxidation and has also been reported by other researchers.8,9
It was found that 3.0 mg/mL solutions of linezolid were quite difficult to dissolve, supporting the literature indicating maximum solubility at 3.0 mg/mL.7 Extensive compound analysis was completed to confirm the nature of the test linezolid sample. Linezolid did not contain moisture, and the two infrared results showed values <1,000 cm−1 to be similar. NMR proton analysis and 13C NMR results showed similarities between samples and confirmed results expected from the chemical structure of linezolid. The melting point of the USP standard linezolid corresponded with one melting point identified in the test linezolid sample during the DSC and was similar to that stated in the literature (181.0°C).10 An additional three peaks were identified in the test linezolid sample: two exothermic and one endothermic. It is possible that these indicated polymorphic forms of the linezolid with melting points correlating to those identified in the DSC results and potentially indicating that the USP analytical grade linezolid sample contained one form of linezolid, whereas the test linezolid consisted of polymorphs, which have previously been reported.10 While the second exothermic peak may indicate a polymorph, the endothermic peaks could be polymorphic transformations. However, polymorphic forms present in the solid state have no effect in solution and would not influence the results of the study.
Conclusion
Linezolid was stable when stored at 25.0°C for 34 days in commonly used intravenous fluids: 0.9% sodium chloride solution, Hartmann’s solution, 5% glucose solution, and 10% glucose solution, providing cost-effective alternatives to the commercially available intravenous formulation. In addition, the degradation reaction was found to undergo the first-order kinetics. The study found that linezolid was unstable at high pH values, and a moderate activation energy value for linezolid, indicating that the rate of degradation was affected by temperature change. In addition, linezolid degradation rate in solution was relatively unaffected by ionic strength variation.
Disclosure
The authors report no conflicts of interest in this work.
References
Laxminarayan R, Matsoso P, Pant S, et al. Access to effective antimicrobials: a worldwide challenge. Lancet. 2016;387(10014):168–175. | ||
Paladino JA. Linezolid: an oxazoladinone antimicrobial agent. Am Health Syst Pharm. 2002;59(24):2413–2425. | ||
Perry CM, Jarvis B. Linezolid: a review of its use in the management of serious Gram-positive infections. Drugs. 2001;61(4):525–551. | ||
Stalker DJ, Jungbluth GL. Clinical pharmacokinetics of linezolid, a novel oxazolidinone antibacterial. Clin Pharmacokinet. 2003;42(13):1129–1140. | ||
Sotgiu G, Centis R, D’Ambrosio L, et al. Efficacy, safety and tolerability of linezolid containing regimens in treating MDR-TB and XDR-TB: systematic review and meta-analysis. Eur Respir J. 2012;40(6):1430–1442. | ||
Clemett D, Markham A. Linezolid. Drugs. 2000;59(4):815–827; discussion 828. | ||
Zeng J. Clinical pharmacology and biopharmaceutics review. Centre Drug Evaluation and Res. 1999. | ||
Agrawal H, Mahadik KR, Paradkar AR, Kaul N. Stability indicating HPTLC determination of linezolid as bulk drug and in pharmaceutical dosage form. Drug Devel Ind Pharm. 2003;29(10):1119–1126. | ||
Bebawy LI. Stability-indicating methods for the determination of linezolid in the presence of its alkaline-induced degradation products. Talanta. 2003;60(5):945–953. | ||
Enna SJ, Bylund DB. Linezolid. xPharm: the Comprehensive Pharmacology Reference. New York: Elsevier; 2007:1–4. | ||
Saviano AM, Madruga ROG, Lourenco FR. Measurement uncertainty of a UPLC stability indicating method for determination of linezolid in dosage forms. Measurement. 2015;59:1–8. | ||
Patel NS, Tandel FB, Patel YD, Thakkar KB. Development and validation of stability indicating HPLC method for simultaneous estimation of cefixime and linezolid. Indian J Pharm Sci. 2014;76(6):535–540. | ||
Busey RH, Mesmer RE. Thermodynamic quantities for the ionization of water in sodium chloride media to 300.degree.C. J Chem Eng Data. 1978;23(2):175–176. | ||
Mesmer RE, Baes CF. Phosphoric acid dissociation equilibria in aqueous solutions to 300°C. J Solution Chem. 1074;3(4):307–322. | ||
Millero F, Huang F, Graham T, Pierrot D. The dissociation of carbonic acid in NaCl solutions as a function of concentration and temperature. Geochimica et Cosmochimica Acta. 2007;71(1):46–55. | ||
Martin AN, Sinko PJ, Singh Y. Martin’s Physical Pharmacy and Pharmaceutical Sciences: Physical Chemical and Biopharmaceutical Principles in the Pharmaceutical Sciences. 6th ed. Baltimore, MD: Lippincott Williams & Wilkins; 2011. | ||
Linezolid. Authorised USP Pending Monograph Version 1; 2013:1–2. |
 © 2017 The Author(s). This work is published and licensed by Dove Medical Press Limited. The full terms of this license are available at https://www.dovepress.com/terms.php and incorporate the Creative Commons Attribution - Non Commercial (unported, v3.0) License.
By accessing the work you hereby accept the Terms. Non-commercial uses of the work are permitted without any further permission from Dove Medical Press Limited, provided the work is properly attributed. For permission for commercial use of this work, please see paragraphs 4.2 and 5 of our Terms.
© 2017 The Author(s). This work is published and licensed by Dove Medical Press Limited. The full terms of this license are available at https://www.dovepress.com/terms.php and incorporate the Creative Commons Attribution - Non Commercial (unported, v3.0) License.
By accessing the work you hereby accept the Terms. Non-commercial uses of the work are permitted without any further permission from Dove Medical Press Limited, provided the work is properly attributed. For permission for commercial use of this work, please see paragraphs 4.2 and 5 of our Terms.