")
Back to Journals » Drug Design, Development and Therapy » Volume 12
Evaluation of methotrexate-conjugated gadolinium(III) for cancer diagnosis and treatment
Authors Xu D , Lu ST, Li YS, Baidya A , Mei H, He Y, Wu B
Received 28 June 2018
Accepted for publication 14 September 2018
Published 5 October 2018 Volume 2018:12 Pages 3301—3309
DOI https://doi.org/10.2147/DDDT.S178569
Checked for plagiarism Yes
Review by Single anonymous peer review
Peer reviewer comments 2
Editor who approved publication: Dr Tuo Deng
Dan Xu,1 Shu-Ting Lu,2 Yu-Shuang Li,2 Aju Baidya,2 Hao Mei,2 Yong He,1 Bo Wu2
1Department of Nuclear Medicine, Zhongnan Hospital of Wuhan University, Wuhan University, Wuhan 430071, PR China; 2Department of Radiology, Zhongnan Hospital of Wuhan University, Wuhan University, Wuhan 430071, PR China
Background: Gliomas are one of the most common types of primary brain tumors. It is usually evaluated by gadolinium(III)-based contrast agents by magnetic resonance imaging (MRI) in the clinic. Methotrexate (MTX), as a type of folate analog that inhibits the enzyme dihydrofolate reductase, is widely used as a chemotherapeutic agent to treat gliomas in the experiment.
Purpose: In this study, a novel theranostic agent MTX-DOTA-Gd (MTX-Gd) was synthesized, which integrates magnetic resonance imaging (MRI) with anticancer treatment.
Methods: MTX-Gd was synthesized by connecting MTX and Gd through 1,4,7,10-tetraazacyclododecane-1,4,7,10-tetraacetic acid (DOTA). The characterization of MTX-Gd was detected by ultraviolet (UV) and infrared spectroscopy (IR). To confirm the antitumor effect of MTX-Gd, the cytotoxicity of MTX-Gd was examined by the MTT assay. The contrast enhancement of the MTX-Gd was measured through MRI in vitro. Then, nude mice bearing C6 tumor xenografts were used to study in vivo imaging capabilities.
Results: The ultraviolet-visible-near infrared radiation (UV-NIR) absorption curve indicated that MTX-Gd had a broad absorption in the region of 500-700 nm. The formation of MTX-Gd was confirmed from the characteristic bands of MTX-DOTA-Gd in the 1413 cm-1 (C-N), 1577 cm-1 (-NH2), and 3429 cm-1 (N-H), in the fourier-transform infrared (FTIR) spectra. MTX-Gd showed little difference in the cell viability compared with MTX, except for the highest concentration (270 μM). In vitro, the imaging of MTX-Gd was significantly brighter than Gd-DOTA at the same concentration, and the brightness and signal intensity of MRI were increased followed by the increased concentration of MTX-Gd. And it also showed that MTX was not visualized on MRI. The other images revealed that the concentration of 4 mM MTX-Gd had the same imaging effect with the concentration of 10 mM Gd-DOTA. Then, MTX-Gd was injected in nude mice bearing C6 tumor xenografts through the tail vein. Significant contrast enhancement was observed at the tumor site from 0.5 h to 3 h. The signal of tumor area was strongest at 3 h due to accumulation by size effect of macromolecules.
Conclusion: A novel stable and unique theranostic agent(MTX-Gd) was successfully synthesized, and it has good stability, strong anticancer ability and excellent magnetic capacity. The methotrexate component of MTX-Gd, as a chemotherapeutic agent, played an important role in targeted therapies of cancer. The DOTA-Gd component of MTX-Gd performed as the MRI contrast agent. The superior MRI imaging performance and synergetic chemical antineoplastic ability of MTX-Gd was revealed, and it has great potential in the diagnosis and treatment of glioma and potentially other cancers, with prospects of clinical application in the near future.
Keywords: methotrexate, gadolinium, glioma, theranostics
Introduction
Methotrexate (MTX) is a folate analog that inhibits the enzyme dihydrofolate reductase. It is widely used to treat psoriasis, rheumatoid arthritis, and other autoimmune diseases. In addition, malignant diseases such as acute lymphoblastic leukemia (ALL), lymphoma, medulloblastoma, and osteosarcoma are treated with high doses of MTX or intrathecal injection of MTX.1,37–39 MTX at a dose of ≥1 g/m2 (high-dose MTX, HDMTX) is the most efficient treatment against primary central nervous system lymphoma (PCNSL) and is the most widely used drug in prospective clinical trials.2,27–32 Numerous studies suggest that HDMTX (1 g/m2) has a moderate blood–brain barrier (BBB) permeability (approximately 5% of plasma levels).3
Glioma is a common type of primary brain tumor that has high morbidity and mortality due to its location and locally invasive growth. Currently, gadolinium(III)-based contrast-enhanced magnetic resonance imaging (MRI) is a preferred choice for the clinical diagnosis of glioma and preoperative localization.1,33 Some studies have reported that MRI can make a good evaluation for the grading of gliomas.4,5,34–36 Measurement of relative cerebral blood volume (rCBV) can be used to improve the sensitivity of grading a tumor; the preoperative distinction between high-grade and low-grade gliomas showed that rCBV in intratumoral and peritumoral regions was significantly different. The combination of intratumoral and peritumoral rCBV provided overall better diagnostic accuracy and helped to reduce invasive interventions for nonsurgical candidates.4–9 Moreover, longitudinal relaxation rate, transverse relaxation rate (R1, R2), and rCBV decreased as the distance from the contrast enhancement portion of the tumor increased. There was a significant increase in the R1 gradient after contrast agent injection (P<0.0001). There was a heterogeneous pattern of relaxation values in the peritumoral edema adjacent to the contrast enhancement portion of the tumor. This pattern might reflect an invisible tumor infiltrating into the surrounding tissue. This information might be useful for the planning of surgery and radiotherapy.8 In addition to rCBV, diffusion kurtosis imaging (DKI) and neurite orientation dispersion and density imaging (NODDI) scalar markers could be used effectively as glioma grade biomarkers and had a significant difference (P<0.05) for grading between low-grade and high-grade gliomas, especially for glioma II vs glioma III and glioma III vs glioma IV.5 According to the abovementioned reports, MRI is a very good method for the clinical diagnosis of glioma.
In MRI, MRI contrast agents can enhance the relaxation rates of water molecules and can therefore be used to provide additional information in the image relative to the areas that have not been treated with the agent.10 Currently, gadolinium(III)-based contrast agents have been used for >40% MRI scans in clinical practice and play an important role in angiography-enhanced MRI studies.11–13 There are several MRI contrast agents that have been successfully used for the clinical diagnosis of specific diseases, including Dotarem (Gd-DOTA), ProHance (Gd-HP-DO3A), and Gadovist (Gd-DO3A-burol).14,15 Gd-DOTA, a complex prepared with the chelating agent 1,4,7,10-tetraazacyclododecane-1,4,7,10-tetraacetic acid (DOTA), exhibits the fastest rate of bound water.16 Therefore, many studies currently use Gd-DOTA as a target for drug synthesis studies.17–23,40–42
Theranostics, which combines diagnostic and therapeutic effects, is a promising method of personalized medicine, especially for cancer.24,25 On the basis of the advantage of permeating the BBB with HDMTX, Gd-DOTA was conjugated to MTX. The fabricated drug, MTX-Gd, would have a broad impact on cancer diagnosis and treatment.
Materials and methods
Materials
All chemicals were obtained from commercial suppliers and were used as received. MTX was purchased from Sigma-Aldrich Co. (St Louis, MO, USA). Dimethyl sulfoxide (DMSO) was purchased from Shanghai Chemical Co. Ltd, Shanghai, PR China. All solutions were of analytical grade in this study. The C6 glioma cell line was purchased from the China Center for Type Culture Collection (Wuhan University, Wuhan, PR China) and cultured in DMEM (Beijing Dingguo Changsheng Biotechnology Co. Ltd, Beijing, PR China), supplemented with 10% FBS and 1% antibiotics (100 U/mL penicillin and 100 mg/mL streptomycin) at 37°C in a 5% CO2 atmosphere.
Synthesis and characterization of MTX-Gd
Tri-tert-butyl-2,2′,2″-(10-(2-ethoxy-2-oxoethyl)-1,4,7,10-tetraazacyclododecane-1,4,7-triyl) triacetate (Tris-DOTA) (1.447 g, 2.4 mmol) and MTX (2.3 g, 4.8 mmol) were dissolved in N,N-dimethylformamide (DMF), placed in a bottle for mixing, and stirred at room temperature for 48 hours. After that, the resulting mixture was evaporated to obtain a light yellow solid. Then, the solid mixture was dissolved in 22 mL HCl aqueous solution (37%), and the solution was stirred for 30 minutes at room temperature. HCl and water were removed under vacuum to obtain a light yellow solid. Light-yellow solid was added to 20 mL acetone, and the suspension was stirred for 1 hour at room temperature. The white precipitates were filtered and washed with 10 mL acetone three times. The solvent was removed under reduced pressure to gain the product MTX-DOTA as a light yellow powder.
MTX-Gd was prepared according to the reported procedure in the literature.18 In short, the 10 mL DMF solution without metal MTX-DOTA (346 mg, 0.3 mmol) and gadolinium acetate hydrate (352 mg, 1 mmol) was stirred for 24 hours at 50°C. The solvent was removed and dissolved in water. The precipitates were filtered and washed with acetone three times and then purified by alumina column chromatography (toluene acetone–DMSO as eluent, DMSO/H2O =1/0–8/2 fraction).
In vitro cytotoxicity assay by the MTT assay
C6 cells were plated in 96-well plates at 5.0×10⁴ cells/well and cultured in 100 µL DMEM with 10% FBS at 37°C in 5% CO2 atmosphere for 24 hours. Subsequently, the cells were incubated under concentrations of 0.04–270 µM of MTX or MTX-Gd for 48 hours. After incubation, the media were removed, and the cells were washed with PBS. To each well, 20 µL MTT solution (5 mg/mL in PBS) and 80 µL DMEM were added and incubated for 3–4 hours. The media were then completely removed, and 150 µL of DMSO was added to each well; as a result, the color changed from yellow to blue. The absorbance of the solution was measured using a microplate reader at 450 nm. The degree of cell viability in each sample was calculated by the following formula: cell viability (%) = Asample/Acontrol×100%, where Asample and Acontrol are the absorbance values for the treated cells and the untreated control cells, respectively. The Asample and Acontrol values were obtained after subtracting the absorbance of DMSO. Data are presented as the average ± SD (n=4).
T1-weighted and T1-mapping images of MTX-Gd in vitro and in vivo
All animals received care in compliance with the guidelines outlined in the Guide for the Care and Use of Laboratory Animals, and the procedures were approved by the Wuhan University of China Animal Care and Use Committee. Female BALB/c mice were obtained from Beijing Huafukang Bioscience Co. Ltd, Beijing, PR China. with weights of 14–16 g and provided and maintained with free access to food and water.
The T1-weighted and T1-mapping images of MTX-Gd were measured at 37°C using the Siemens Prisma 3T MRI scanner. MTX-Gd was dispersed in double-distilled H2O (ddH2O) at different concentrations. For MRI measurements, each of the 96-well plates was filled with 150 µL solution to achieve T1-weighted and T1-mapping images. For in vivo MRI, tumor-bearing BALB/c nude mice were injected with 200 µL of MTX-Gd solution (2 mM) through the tail vein. Then, the mice were scanned using the Siemens Prisma 3T MRI scanner at 30 minutes, 1 hour, 2 hours, and 3 hours after the injection. The T1-weighted image parameters were described as follows: echo time, 12 ms; repetition time, 700 ms; field of view, 120×120 mm; matrix size, 400×400; slice thickness, 2.0 mm; and the number of acquisitions, 14. The T1 mapping parameters were described as follows: repetition time, 15 ms; echo time, 2.7 ms; field of view, 160×160 mm; image size, 768×768; slice thickness, 2.0 mm; and the number of acquisitions, 14. The T1-mapping value was measured three times at each MTX-Gd concentration, and the mean of the T1 values was recorded. Taking the longitudinal relaxation time (r1) as the abscissa and the inverse longitudinal relaxation time (1/T1) as the ordinate, a fitting curve was made to represent the MTX-Gd function. The control groups of MTX or Gd-DOTA also used the abovementioned method for data collection.
Results and discussion
Synthesis and characterization of MTX-Gd
MTX-Gd was prepared as shown in Figure 1, and MTX-Gd was synthesized by connecting MTX and Gd through DOTA. To detect whether the MTX-Gd was synthesized successfully, it was detected by ultraviolet (UV) and infrared radiation (IR) spectroscopy. The ultraviolet-visible-near infrared radiation (UV-NIR) absorption curve indicated that MTX-Gd had a broad absorption in the NIR region (500–700 nm; Figure 2A). The formation of MTX-Gd was confirmed from the characteristic bands of MTX-DOTA-Gd in the 1,413 cm−1 (C−N), 1,577 cm−1 (−NH2), and 3,429 cm−1 (N−H), in the Fourier transform IR (FTIR) spectra (Figure 2B).
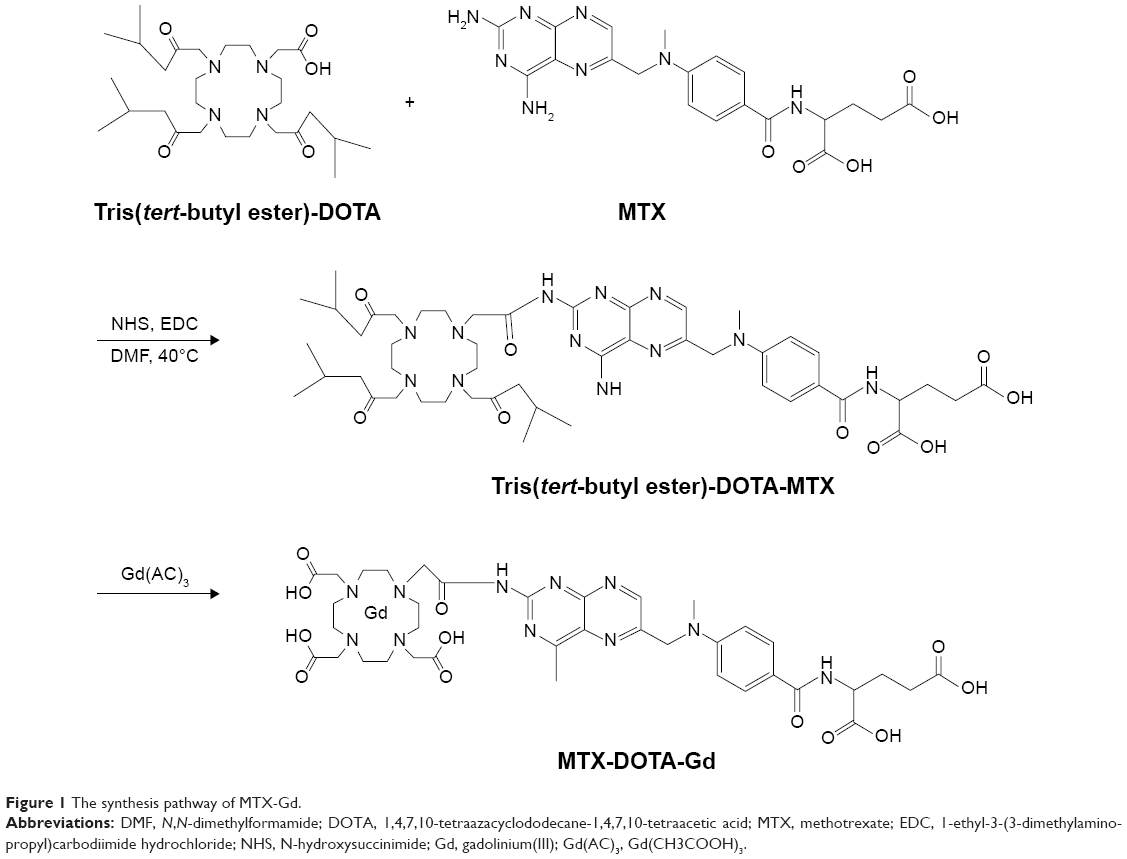 | Figure 1 The synthesis pathway of MTX-Gd. |
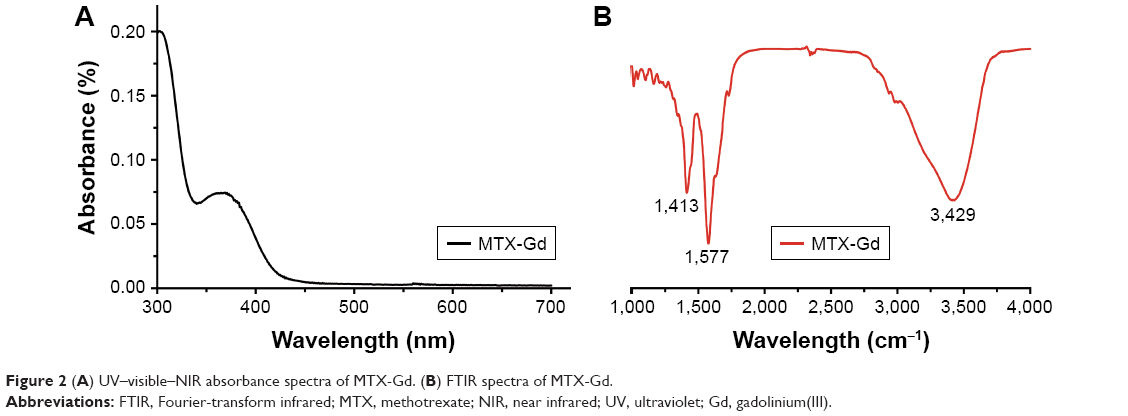 | Figure 2 (A) UV–visible–NIR absorbance spectra of MTX-Gd. (B) FTIR spectra of MTX-Gd. |
In vitro cytotoxicity analysis by the MTT assay
To confirm the antitumor effect of MTX-Gd, the cytotoxicity of MTX-Gd was examined by the MTT assay. C6 cells were cultured in 96-well plates. At 24 hours after incubation, MTX-Gd or MTX was added to the cells, and the complex was incubated for 48 hours. Subsequently, the absorbance of the solution was measured using a microplate reader at 450 nm. Figure 3 shows that the MTX-Gd showed little difference in the cell viability compared with the control group, except for the highest concentration. The cytotoxicity experiments demonstrated that the synthesis of MTX-Gd had the same treatment effect as MTX at the same dose. However, the reason why MTX-Gd had more cytotoxicity than MTX at the highest concentration still needs to be explored. In addition, it is also revealed that the MTX-Gd conjugates do not lose the function of MTX after they are linked to DOTA-Gd. Furthermore, a previous study reported that Gd-DOTA is generally not toxic to normal cells at low concentrations. The data showed that it had cytotoxicity to normal cells when the concentration of Gd-DOTA was above 400 µM, otherwise it showed no toxicity.26
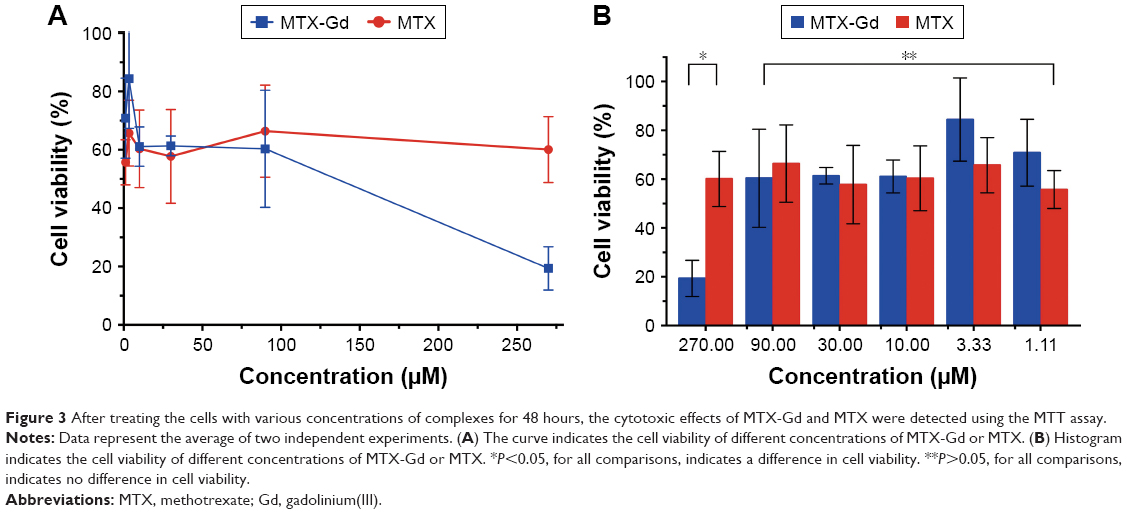 | Figure 3 After treating the cells with various concentrations of complexes for 48 hours, the cytotoxic effects of MTX-Gd and MTX were detected using the MTT assay. |
T1-weighted and T1-mapping images of MTX-Gd in vitro and in vivo
To investigate the contrast enhancement of the MTX-Gd, MRI was measured in vitro. As expected, due to the paramagnetic relaxivity enhancement (PRE) effect, MTX-Gd showed high proton relaxivity (r1) in ddH2O under the 3T MRI system (Figure 4). As shown in Figure 4B, the imaging of MTX-Gd was significantly brighter than the control groups at the same concentration, and the brightness and signal intensity of MRI were increased followed by the increased concentration of MTX-Gd. In addition, it also showed that MTX was not visualized on MRI. In Figure 4D, the images revealed that the concentration of 4 mM MTX-Gd had the same imaging effect with the concentration of 10 mM Gd-DOTA. The images demonstrated that MTX-Gd at the low concentration could obtain a high signal intensity, while Gd-DOTA needed a high concentration. Moreover, as a key parameter of the contrast agent, r1 was obtained from the slope of the fit linear of the reciprocal of the T1 relaxation time. As shown in Figure 4F, when MTX-Gd and Gd-DOTA had the same signal intensity, the r1 of MTX-Gd was 7.7 mM−1 s−1, while the r1 of the commercial imaging agent Gd-DOTA was 2.8 mM−1 s−1. Then, nude mice bearing C6 tumor xenografts were used to study in vivo imaging capabilities. After the tail vein injection of MTX-Gd, significant contrast enhancement was observed at the tumor site from 0.5 to 3 hours (Figure 5); the signal of tumor area was strongest at 3 hours due to accumulation by the size effect of macromolecules. This finding provided a longer viewing window than the clinic contrast agent such as Gd-DOTA, which will rapidly metabolize within 30 minutes. The results revealed that MTX-Gd had a better MRI contrast effect than Gd-DOTA, which further suggests that MTX-Gd has a good MRI contrast characteristic.
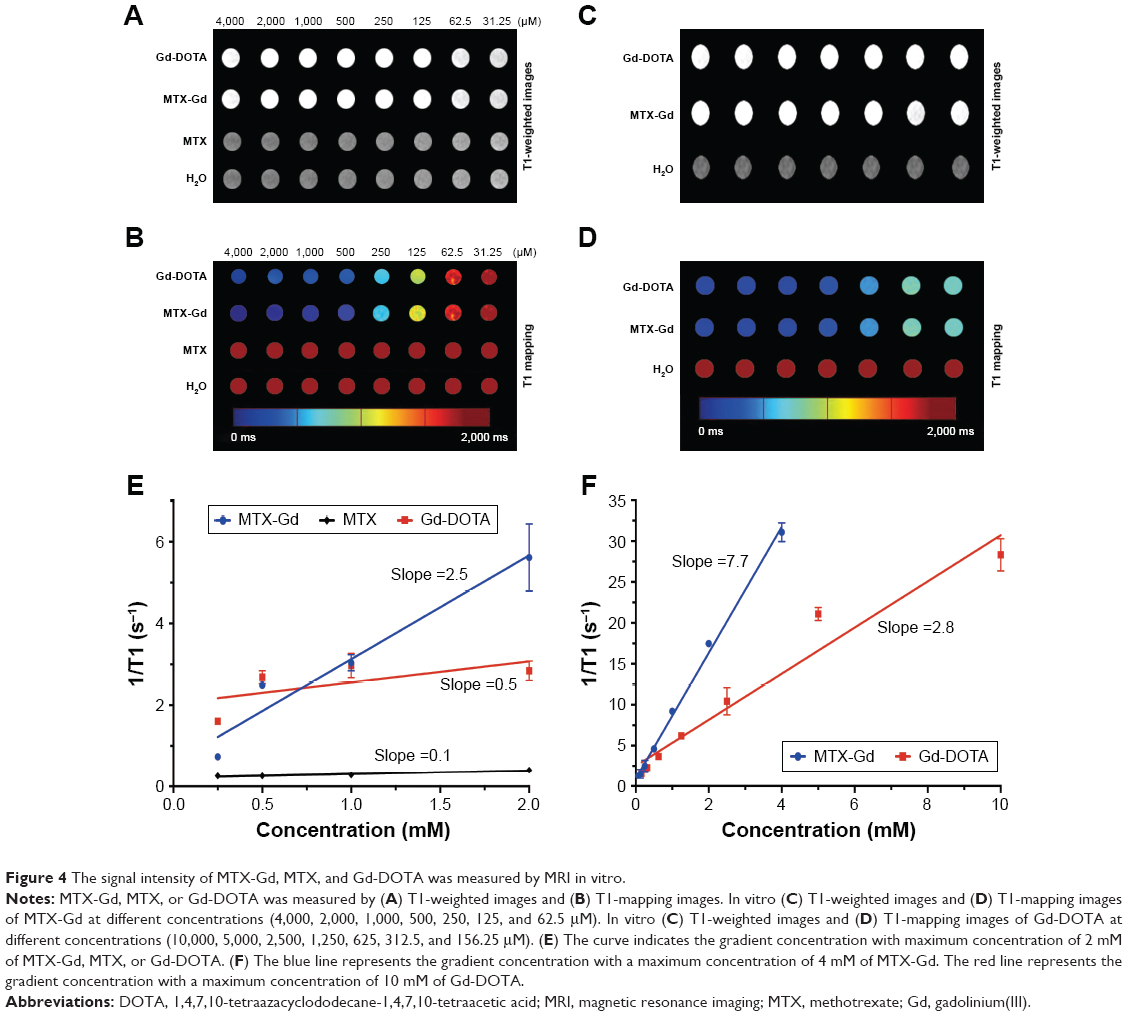 | Figure 4 The signal intensity of MTX-Gd, MTX, and Gd-DOTA was measured by MRI in vitro. |
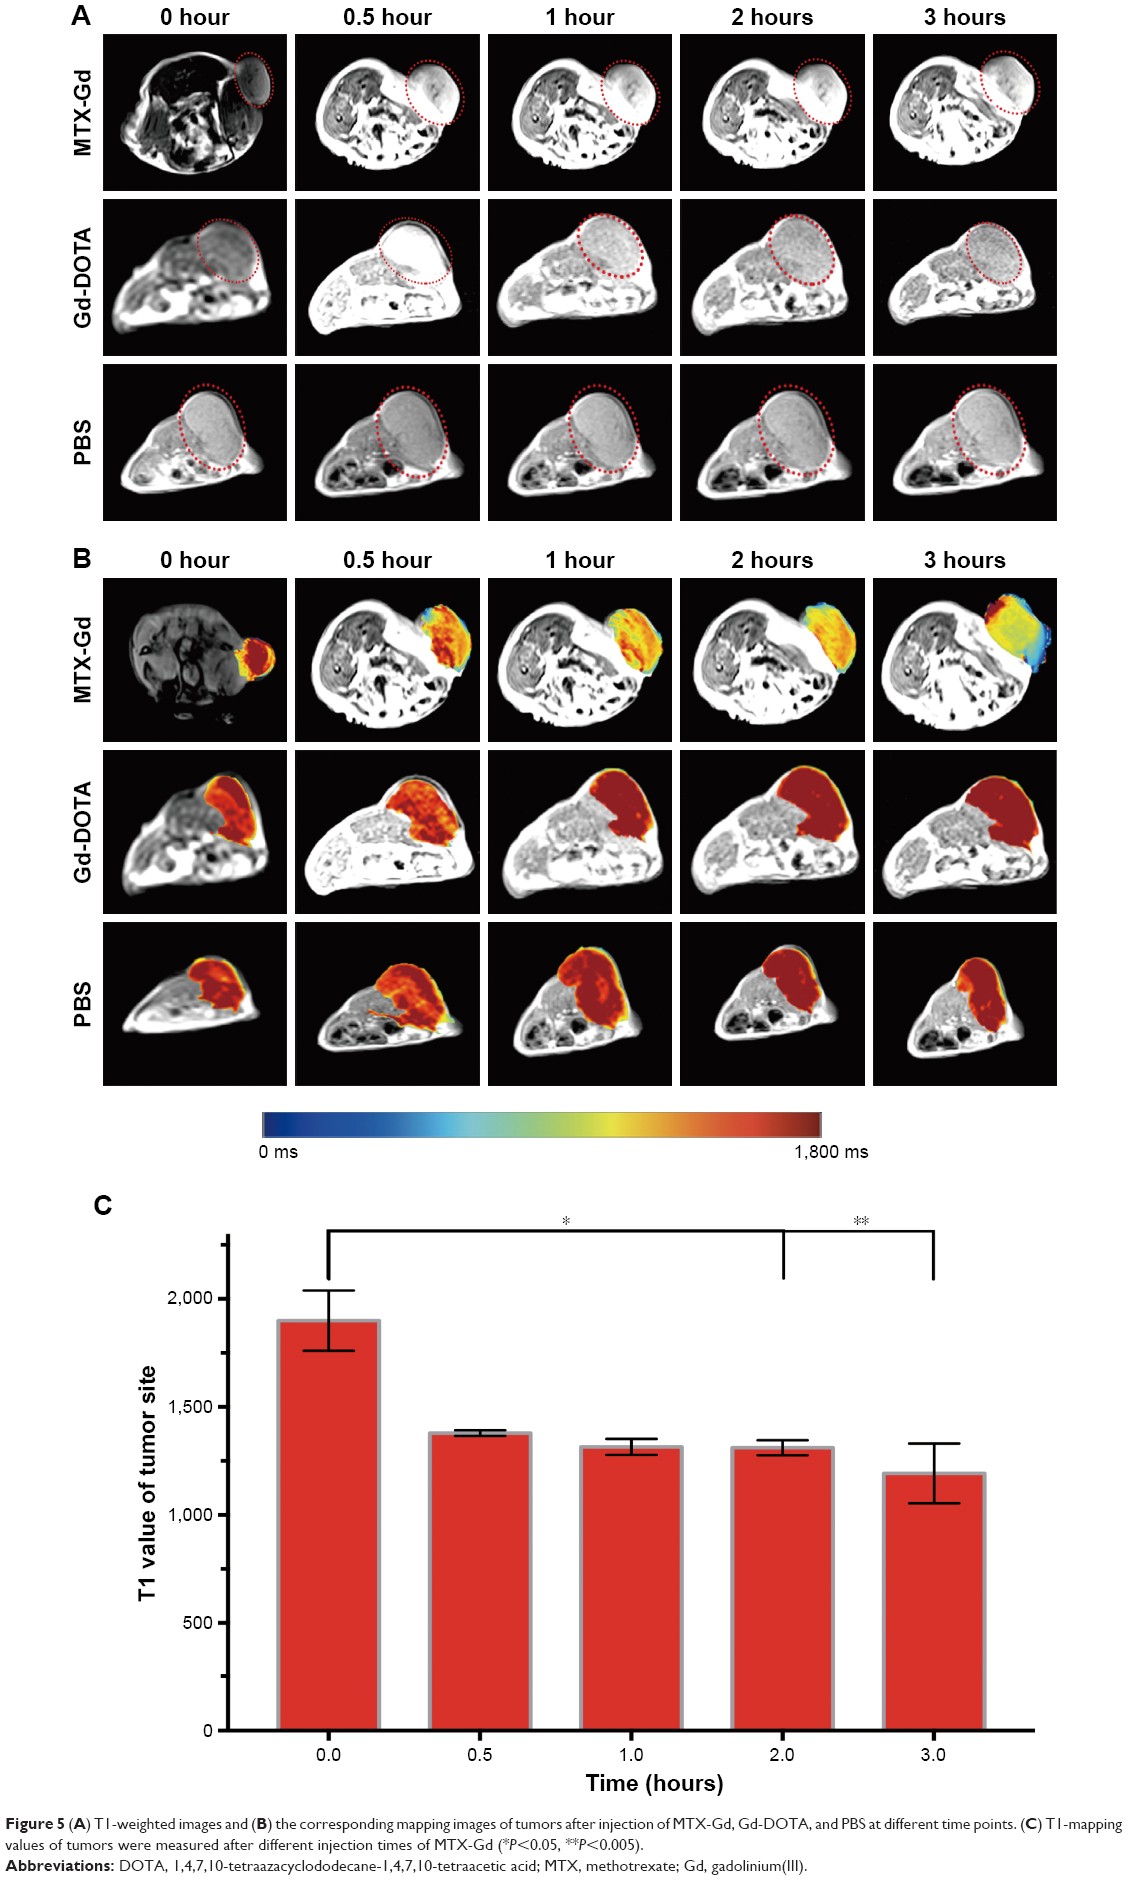 | Figure 5 (A) T1-weighted images and (B) the corresponding mapping images of tumors after injection of MTX-Gd, Gd-DOTA, and PBS at different time points. (C) T1-mapping values of tumors were measured after different injection times of MTX-Gd (*P<0.05, **P<0.005). |
Conclusion
A novel stable and unique theranostic agent (MTX-Gd) was successfully synthesized, which was specifically designed for cancer diagnosis and treatment. The data showed that MTX-Gd has good stability, strong anticancer ability, and excellent magnetic capacity. The MTX component of MTX-Gd, as a chemotherapeutic agent, played an important role in targeted therapies of cancer. The DOTA-Gd component of MTX-Gd performed as the MRI contrast agent. The superior MRI performance and synergetic chemical antineoplastic ability of MTX-Gd were revealed, and it has great potential in the diagnosis and treatment of gliomas and potentially other cancers, with prospects of clinical application in the near future.
Acknowledgments
This work was financially supported by the National Natural Science Foundation of China (81701685, 81771819), the National Key Research and Development Project (2017YFC0108803), the Fundamental Research Funds for the Central Universities (2042018kf0245), and Zhongnan Hospital of Wuhan University Science, Technology and Innovation Seed Fund (Project cxpy20160058, cxpy20160011).
Disclosure
The authors report no conflicts of interest in this work.
References
Stone JB, Deangelis LM. Cancer-treatment-induced neurotoxicity – focus on newer treatments. Nat Rev Clin Oncol. 2016;13(2):92–105. | ||
Joerger M, Huitema AD, Illerhaus G, Ferreri AJ. Rational administration schedule for high-dose methotrexate in patients with primary central nervous system lymphoma. Leuk Lymphoma. 2012;53(10):1867–1875. | ||
Angelov L, Doolittle ND, Kraemer DF, et al. Blood-brain barrier disruption and intra-arterial methotrexate-based therapy for newly diagnosed primary CNS lymphoma: a multi-institutional experience. J Clin Oncol. 2009;27(21):3503–3509. | ||
Soliman RK, Gamal SA, Essa AA, Othman MH. Preoperative Grading of Glioma Using Dynamic Susceptibility Contrast MRI: Relative Cerebral Blood Volume Analysis of Intra-tumoural and Peri-tumoural Tissue. Clin Neurol Neurosurg. 2018;167:86–92. | ||
Maximov II, Tonoyan AS, Pronin IN. Differentiation of glioma malignancy grade using diffusion MRI. Phys Med. 2017;40:24–32. | ||
Narang AK, Chaichana KL, Weingart JD, et al. Progressive Low-Grade Glioma: Assessment of Prognostic Importance of Histologic Reassessment and MRI Findings. World Neurosurg. 2017;99:751–757. | ||
Firouznia S, Sabetrasekh P, Ahmadian A. Multimodal MRI Techniques and Their Importance in Frameless Navigation Biopsy for Brain Glioma. Iran J Radiol. 2017;14(4):e65721. | ||
Blystad I, Warntjes JBM, Smedby Ö, Lundberg P, Larsson EM, Tisell A. Quantitative MRI for analysis of peritumoral edema in malignant gliomas. PLoS One. 2017;12(5):e0177135. | ||
Leu K, Ott GA, Lai A, et al. Perfusion and diffusion MRI signatures in histologic and genetic subtypes of WHO grade II–III diffuse gliomas. J Neurooncol. 2017;134(1):177–188. | ||
Chan K, Wong W. Small molecular gadolinium(III) complexes as MRI contrast agents for diagnostic imaging. Coord Chem Rev. 2007;251(17–20):2428–2451. | ||
Werner EJ, Datta A, Jocher CJ, Raymond KN. High-relaxivity MRI contrast agents: where coordination chemistry meets medical imaging. Angew Chem Int Ed Engl. 2008;47(45):8568–8580. | ||
Major JL, Meade TJ. Bioresponsive, cell-penetrating, and multimeric MR contrast agents. Acc Chem Res. 2009;42(7):893–903. | ||
Cheng W, Haedicke IE, Nofiele J, et al. Complementary strategies for developing Gd-free high-field T1 MRI contrast agents based on Mn(III) porphyrins. J Med Chem. 2014;57(2):516–520. | ||
Chong HS, Song HA, Lim S, et al. A novel cholic acid-based contrast enhancement agent for targeted MRI. Bioorg Med Chem Lett. 2008;18(7):2505–2508. | ||
Li Y, Liu G, Lou X, Chen Z, Ma L. Intra-individual comparison of different gadolinium-based contrast agents in the quantitative evaluation of C6 glioma with dynamic contrast-enhanced magnetic resonance imaging. Sci China Life Sci. 2017;60(1):11–15. | ||
Aydin Tekdaş D, Garifullin R, Şentürk B, et al. Design of a Gd-DOTA-phthalocyanine conjugate combining MRI contrast imaging and photosensitization properties as a potential molecular theranostic. Photochem Photobiol. 2014;90(6):1376–1386. | ||
Wu B, Lu ST, Zhang LJ, Zhuo RX, Xu HB, Huang SW. Codelivery of doxorubicin and triptolide with reduction-sensitive lipid-polymer hybrid nanoparticles for in vitro and in vivo synergistic cancer treatment. Int J Nanomedicine. 2017;12:1853–1862. | ||
Wu B, Li XQ, Huang T, et al. MRI-guided tumor chemo-photodynamic therapy with Gd/Pt bifunctionalized porphyrin. Biomater Sci. 2017;5(9):1746–1750. | ||
Wu B, Wan B, Lu ST, et al. Near-infrared light-triggered theranostics for tumor-specific enhanced multimodal imaging and photothermal therapy. Int J Nanomedicine. 2017;12:4467–4478. | ||
Tan M, Ye Z, Lindner D, Brady-Kalnay SM, Lu ZR. Synthesis and evaluation of a targeted nanoglobular dual-modal imaging agent for MR imaging and image-guided surgery of prostate cancer. Pharm Res. 2014;31(6):1469–1476. | ||
Zhou Z, Wu X, Kresak A, Griswold M, Lu ZR. Peptide targeted tripod macrocyclic Gd(III) chelates for cancer molecular MRI. Biomaterials. 2013;34(31):7683–7693. | ||
Zhang P, Zhang Y, Li B, et al. Cell-assembled nanoclusters of MSC-targeting Gd-DOTA-peptide as a T2 contrast agent for MRI cell tracking. J Pept Sci. 2018;24(4–5):e3077. | ||
Wang H, Sun D, Liao H, et al. Synthesis and characterization of a bimodal nanoparticle based on the host-guest self-assembly for targeted cellular imaging. Talanta. 2017;171:8–15. | ||
Lammers T, Aime S, Hennink WE, Storm G, Kiessling F. Theranostic nanomedicine. Acc Chem Res. 2011;44(10):1029–1038. | ||
Kelkar SS, Reineke TM. Theranostics: combining imaging and therapy. Bioconjug Chem. 2011;22(10):1879–1903. | ||
Zhang J, Li Y, Zhang Q, Hao X, Wang S. Effects of gadolinium on proliferation, differentiation and calcification of primary mouse osteoblasts in vitro. J Rare Earths. 2012;30(8):831–834. | ||
Abrey LE, Moskowitz CH, Mason WP, et al. Intensive methotrexate and cytarabine followed by high-dose chemotherapy with autologous stem-cell rescue in patients with newly diagnosed primary CNS lymphoma: an intent-to-treat analysis. J Clin Oncol. 2003;21(22):4151–4156. | ||
Batchelor T, Carson K, O’Neill A, et al. Treatment of primary CNS lymphoma with methotrexate and deferred radiotherapy: a report of NABTT 96-07. J Clin Oncol. 2003;21(6):1044–1049. | ||
Choi YJ, Park H, Lee JS, et al. Methotrexate elimination and toxicity: MTHFR 677C>T polymorphism in patients with primary CNS lymphoma treated with high-dose methotrexate. Hematol Oncol. 2017;35(4):504–509. | ||
Fritsch K, Kasenda B, Schorb E, et al. High-dose methotrexate-based immuno-chemotherapy for elderly primary CNS lymphoma patients (PRIMAIN study). Leukemia. 2017;31(4):846–852. | ||
Hoang-Xuan K, Bessell E, Bromberg J, et al. Diagnosis and treatment of primary CNS lymphoma in immunocompetent patients: guidelines from the European Association for Neuro-Oncology. Lancet Oncol. 2015;16(7):e322–e332. | ||
Okita Y, Narita Y, Miyakita Y, et al. Health-related quality of life in outpatients with primary central nervous system lymphoma after radiotherapy and high-dose methotrexate chemotherapy. Mol Clin Oncol. 2016;5(3):179–185. | ||
Weller M, Wick W, Aldape K, et al. Glioma. Nat Rev Dis Primers. 2015;1:15017. | ||
Esmaeili M, Stensjøen AL, Berntsen EM, Solheim O, Reinertsen I. The Direction of Tumour Growth in Glioblastoma Patients. Sci Rep. 2018;8(1):1199. | ||
Schuenke P, Paech D, Koehler C, et al. Fast and Quantitative T1ρ-weighted Dynamic Glucose Enhanced MRI. Sci Rep. 2017;7:42093. | ||
Xuesong D, Wei X, Heng L, et al. Evaluation of neovascularization patterns in an orthotopic rat glioma model with dynamic contrast-enhanced MRI. Acta Radiol. 2017;58(9):1138–1146. | ||
Khodadadei F, Safarian S, Ghanbari N. Methotrexate-loaded nitrogen-doped graphene quantum dots nanocarriers as an efficient anticancer drug delivery system. Mater Sci Eng C Mater Biol Appl. 2017;79:280–285. | ||
Vakilinezhad MA, Alipour S, Montaseri H. Fabrication and in vitro evaluation of magnetic PLGA nanoparticles as a potential Methotrexate delivery system for breast cancer. J Drug Deliv Sci Technol. 2018;44:467–474. | ||
Maestá I, Nitecki R, Horowitz NS, et al. Effectiveness and toxicity of first-line methotrexate chemotherapy in low-risk postmolar gestational trophoblastic neoplasia: The New England Trophoblastic Disease Center experience. Gynecol Oncol. 2018;148(1):161–167. | ||
Park JA, Lee YJ, Ko IO, Io K, et al. Improved tumor-targeting MRI contrast agents: Gd(DOTA) conjugates of a cycloalkane-based RGD peptide. Biochem Biophys Res Commun. 2014;455(3–4):246–250. | ||
Xiao Y, Xue R, You T, et al. Gadolinium-1,4,7,10-tetraazacyclododecane-1,4,7,10-tetraacetic acid conjugate of arabinogalactan as a potential liver-targeting magnetic resonance imaging contrast agent. Carbohydr Res. 2014;395:9–14. | ||
Li Y, Han Z, Roelle S, et al. Synthesis and Assessment of Peptide Gd-DOTA Conjugates Targeting Extradomain B Fibronectin for Magnetic Resonance Molecular Imaging of Prostate Cancer. Mol Pharm. 2017;14(11):3906–3915. |
 © 2018 The Author(s). This work is published and licensed by Dove Medical Press Limited. The full terms of this license are available at https://www.dovepress.com/terms.php and incorporate the Creative Commons Attribution - Non Commercial (unported, v3.0) License.
By accessing the work you hereby accept the Terms. Non-commercial uses of the work are permitted without any further permission from Dove Medical Press Limited, provided the work is properly attributed. For permission for commercial use of this work, please see paragraphs 4.2 and 5 of our Terms.
© 2018 The Author(s). This work is published and licensed by Dove Medical Press Limited. The full terms of this license are available at https://www.dovepress.com/terms.php and incorporate the Creative Commons Attribution - Non Commercial (unported, v3.0) License.
By accessing the work you hereby accept the Terms. Non-commercial uses of the work are permitted without any further permission from Dove Medical Press Limited, provided the work is properly attributed. For permission for commercial use of this work, please see paragraphs 4.2 and 5 of our Terms.