")
Back to Journals » International Journal of Nanomedicine » Volume 14
Enhanced Gene Delivery in Bacterial and Mammalian Cells Using PEGylated Calcium Doped Magnetic Nanograin
Authors Hashemi E, Mahdavi H, Khezri J , Razi F, Shamsara M, Farmany A
Received 23 August 2019
Accepted for publication 3 December 2019
Published 19 December 2019 Volume 2019:14 Pages 9879—9891
DOI https://doi.org/10.2147/IJN.S228396
Checked for plagiarism Yes
Review by Single anonymous peer review
Peer reviewer comments 2
Editor who approved publication: Prof. Dr. Anderson Oliveira Lobo
Ehsan Hashemi,1,2 Hossein Mahdavi,3 Jafar Khezri,1 Farideh Razi,2,4 Mehdi Shamsara,1 Abbas Farmany5
1National Research Center for Transgenic Mouse & Animal Biotechnology Division, National Institute of Genetic Engineering and Biotechnology, Tehran, Iran; 2Endocrinology and Metabolism Research Center, Endocrinology and Metabolism Clinical Sciences Institute, Tehran University of Medical Sciences, Tehran, Iran; 3School of Chemistry, College of Science, University of Tehran, Tehran, Iran; 4Diabetes Research Center, Endocrinology and Metabolism Clinical Sciences Institute, Tehran University of Medical Sciences, Tehran, Iran; 5Dental Implant Research Center, Hamadan University of Medical Sciences, Hamadan, Iran
Correspondence: Abbas Farmany
Dental Implant Research Center, Hamadan University of Medical Sciences, Hamadan, Iran
Email [email protected]
Background: Beyond viral carriers which have been widely used in gene delivery, non-viral carriers can further improve the delivery process. However, the high cytotoxicity and low efficiency impedes the clinical application of non-viral systems. Therefore, in this work, we fabricated polyethylene glycol (PEG) coated, calcium doped magnetic nanograin (PEG/Ca(II)/Fe3O4) as a genome expression enhancer.
Methods: Monodisperse magnetic nanograins (MNGs) with tunable size were synthesized by a solvothermal method. The citrate anions on the spherical surface of MNGs capture Ca2+ ions by an ion exchange process, which was followed by surface capping with PEG. The synthesized PEG/Ca(II)/Fe3O4 was characterized using Fourier-transform infrared spectroscopy (FTIR), dynamic light scattering (DLS) spectra, vibrating sample magnetometer (VSM), transmission electron microscopy (TEM), and scanning electron microscopy (SEM). MTT test was utilized to assess the toxicity of PEG/Ca(II)/Fe3O4. Real time qPCR was applied for quantification of gene expression.
Results: DLS spectra and TEM images confirmed a thin layer of PEG on the nanocarrier surface. Shifting the zeta potential in the biological pH window from −23.9 mV (for Fe3O4) to ≈ +11 mV (for PEG/Ca(II)/Fe3O4) confirms the MNGs surface protonation. Cytotoxicity results show that cell viability and proliferation were not hindered in a wide range of nanocarrier concentrations and different incubation times.
Conclusion: PEGylated calcium doped magnetic nanograin enhanced PUC19 plasmid expression into E. Coli and GFP protein expression in HEK-293 T cells compared to control. A polymerase chain reaction of the NeoR test shows that the transformed plasmids are of high quality.
Keywords: gene expression, calcium doped magnetic nanograins, cytotoxicity
Introduction
As a promising strategy, gene therapy has drawn significant attention, specially in cell therapy and treatment of gene-associated diseases ranging from hemophilia and cancer to autoimmune diseases.1,3 Clinical application of gene therapy depends on the efficiency and safety of its delivery vectors. Compared with the viral delivery vectors, non-viral vectors are relatively oncogenic, less immunogenic and easy to prepare, and specially have no limitation in the size of transferred genome material and no potential of virus recombination.4 At this time, many efforts have been attempted to fabricate the safe and efficiency gene vectors. There is intense activity in evaluating and developing non-viral carriers including polymers,5,6 cationic lipids,7 quantum dots,8,9 carbon nanotubes,10,11 graphene,12 silica nanoparticles,13,14 and gold nanoparticles15,8 with surface properties, tunable size, and multifunctional properties. The potential of large scale production and biocompatibility make non-viral carriers increasingly attractive. However, numerous intra- and extracellular obstacles significantly reduce their transfection efficiency.
Recently, superparamagnetic iron oxide nanoparticles have been widely explored for use in nanomedicine. Magnetic nanoparticles (MNPs) have been investigated in both therapeutic and diagnostic applications.19 The large surface area-to-volume ratio of MNPs renders these nanomaterials as a suitable candidate for drug and genome material loading and transport.20,25 Genome material may be attached to the particles employing target specific linkers or utilizing electrostatic interaction between positively charged polymers (PEI, etc. …) attached to nanoparticle surface and negatively charged phosphate backbone of the genome material.25
In the genome material, phosphate groups form ionic complexes with divalent metals such as Ca2+, Ba2+, and Mg2+ and stabilize the genome structure.26,30 As shown by Baoum et al,26,27 the Ca2+-lipoplex improves the transfection efficiency in accordance with a classical analog of gene delivery method in the presence of Ca2+. Also, Haberland et al28 reported that Ca2+ could enhance the gene transfer process. More recently, Chen et al29 showed that Ca2+ improved both packaging and release of plasmid DNA.As shown by Zaitsev et al,30 the cellular uptake is independent to Ca2+ in the absence and/or presence at the culture media. In fact, Ca2+ works to organize the transfection in the endosome/lysosome and its release into the cytosol.31,35
The aim of this study was to fabricate a highly biocompatible magnetic nanograin (MNG) for gene delivery. The nanocarrier is assembled from a citrate-stabilized magnetic nanograin core which spherically is doped by Ca2+ and surrounded by a polyethylene glycol (PEG) shell. The MNGs were applied in the PUC19 plasmid expression into E. coli and GFP protein expression in HEK-293 T cells as prokaryotic and eukaryotic cell models, respectively.
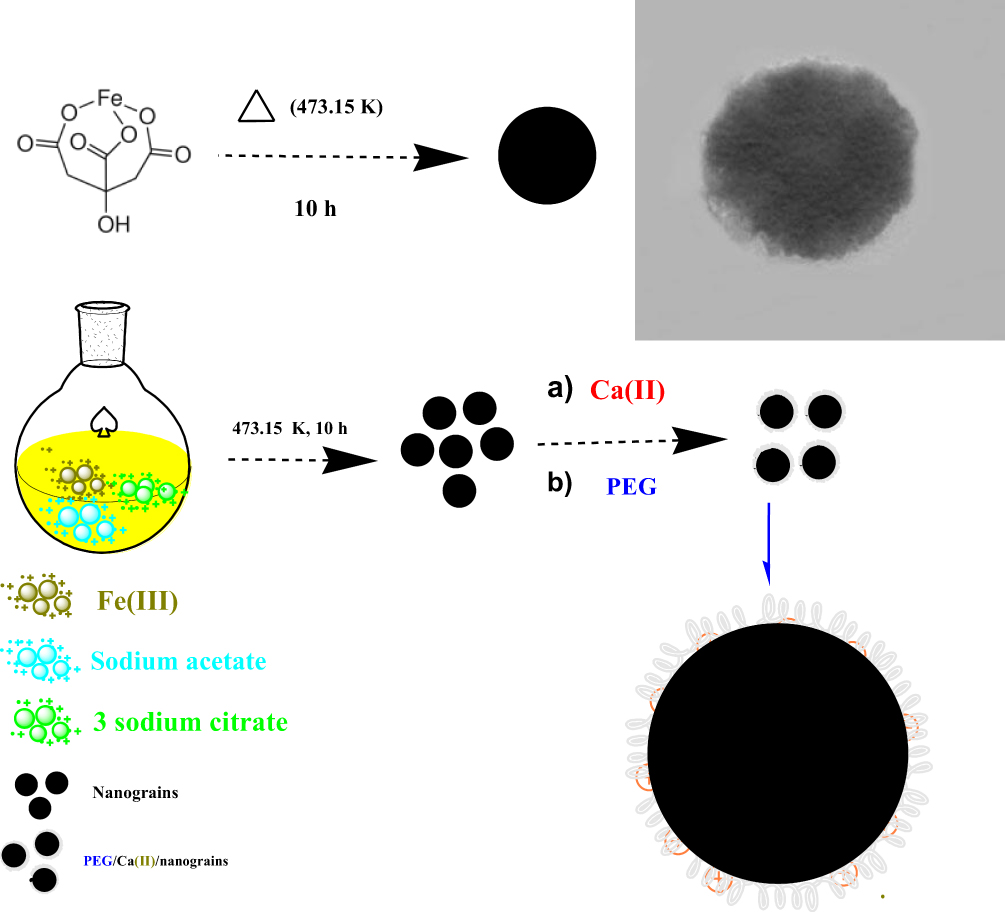 |
Figure 1 Overall synthesis of monodisperse PEG/Ca(II)/MNGs. |
Experimental Section
Materials and Methods
Synthesis of MNGs
High quality monodisperse magnetic nanograins (MNGs) with tunable size were synthesized by a solvothermal method.36 Following is a typical protocol for MNG synthesis (see Figure 1). FeCl3 (0.32 g, 4.0 mmol) and trisodium citrate (0.10 g, 0.68 mmol) were first dissolved in ethylene glycol (20 mL), then NaAc (0.60 g) was added with stirring. The mixture was stirred vigorously for 30 minutes and then sealed in a Teflon-lined stainless-steel autoclave. The autoclave was heated at 200°C and maintained for 10 hours, and then allowed to cool to room temperature. The synthesized MNGs were washed with ethanol and purified by precipitation with acetone. Stock solution of MNGs with concentration of 25 mg/mL was prepared by dispersing MNGs in ethanol.
Synthesis of Ca(II) Doped MNGs
In a typical synthesis, 10 mg MNGs was first sonicated in ethanol and placed in a 25 mL round-bottom flask. The flask was purged with N2 for 5 minutes. Then 40 mg CaCl2 was dissolved in 5 mL ethanol and, after purging for 5 minutes with N2, it was swiftly injected to the MNGs. The mixture was stirred for 10 hours under N2. After a through washing with ethanol, to remove the excess salts, it was re-dispersed in 10 mL ethanol.
PEGylation of Ca(II)/MNGs
Five millilters of aqueous solution (2% w/v) of PEG-2000 (MW) was swiftly injected into Ca(II)/MNGs under vigorous stirring with a stirring speed of 700 rpm. It was kept for 2 hours at room temperature.37 The resulting PEG/Ca(II)/MNGs were isolated by centrifugation, washed with ethanol, re-dispersed in ethanol, and stored at 4ºC as stock solution.
Instrumentation
TEM measurements were taken on a Philip CM 120 (120 kV). SEM measurements were made using a Scanning TESCAN (Vega). IR studies were run on a Spectrum 65 – PERKIN-ELMER FTIR spectrophotometer. The hydrodynamic diameters of the nanoparticles were measured by a Microtrac Nanotrac Wave dynamic light scattering (DLS) instrument.
Gene Expression Mechanism Study
All the experiments were performed according to the following.38 First, PUC19 plasmid was added to the competent cells and divided into eight different groups: 1) The nanocarrier has been added immediately (optimal concentration of nanocarrier was 10 µg/mL); 2) After 30 minutes the nanocarrier was added (before heat shock); 3) 30 seconds after starting heat shock the nanocarrier was added; 4) 60 seconds after starting heat shock the nanocarrier was added; 5) 90 seconds after starting heat shock the nanocarrier was added; 6) the nanocarrier was added after neutralizing with LB media (500 µL); 7) the nanocarrier was added before transferring to culture plate; and 8) control group.
DNA Extraction, PCR, and Gel Electrophoresis
pDNA molecules were extracted from E. coli bacteria.38 Extracted E. coli DNA was subjected to restriction enzyme digestion (RED) using MlsI (BalI) restriction enzyme (Fermentas, Cat. No.ER1211). To analyze the stability of extracted DNA, PCR was applied to the NeoR gene. Briefly, 1× PCR buffer (50 mM Tris-HCl, 100 mM NaCl, pH ~8.3), 4 μL isolated DNA sample, 4 mM Mg2+, 50 μM dNTPs, 6 IU Taq DNA polymerase and 10 pmol of each forward (5´-GCAACATCAGGTCGGCCATTAC-3´) and reverse (5´-CTGGCAACAGGAAAGATGGAGC-3´) primers. The PCR reaction was performed by initial denaturation at 94°C for 5 minutes, denaturation at 94°C for 30 seconds, and annealing at 60°C for 45 seconds in 35 cycles, and finally extension at 72°C for 45 seconds to obtain a 807 bp.
Cell Culture and Viability Assay
All cell lines used in this manuscript were commercially purchased from Pasteur Institute of Iran. MTT test was utilized to assess toxicity of nanocarrier in Hek293T cell lines. Cells were cultured in RPMI supplemented with 10% fetal bovine serum (FBS) and 50 IU/mL penicillin and 50 μg/mL streptomycin and incubated in a 5% CO2 atmosphere at 37°C.
Cultured cells in a 96-well plate exposed with different concentrations of nanocarrier (0, 0.1, 1, 10, 100, and 500 µg/mL) and after 48 hours, viability of treated cells were tested by the MTT. The treated cells were incubated for 3 hours with MTT solution. Then, DMSO was added to the wells to solubilize formazan particles, and finally the absorbance was read at 580 nm using an ELISA reader (Microplate reader labsystem multiscan).
In vitro Gene Delivery
Hek293T cells were cultured in a 4-well tissue culture plate in a DMEM medium supplemented with 10% FBS in a CO2 incubator. To test the potential gene delivery of nanocarrier, the cultured cells were treated with nontoxic concentrations (obtained by MTT test) of nanocarrier (1 and 10 µg/mL) and about 4 µg of EGFP-contained pDNA (pEGFP-C1). A standard method (Lipofectamine2000) was utilized as control. After 8 hours of transfection, cells were washed and fresh media were added then, after 24 hours, the treated cells were monitored for detection of EGFP emission by a fluorescence inverted microscope (Nikon) at 490 nm excitation wavelengths.
Gene Expression Analysis
Total RNA was isolated from the treated and control cells by RNaeasy mini Kit (Qiagen, USA) manufacturer’s protocol and kept at −80ºC until use. Then, a RevertAid First Strand cDNA Synthesis Kit (Thermo Fisher Scientific) was applied for cDNA synthesis. For quantification of gene expression, Real Time qPCR was applied. The final reaction volume reached 20 μL by mixing 8 μL of 2× SYBR Green PCR Master Mix (Intron, Korea, 25344), 4 μL of synthesized cDNA, and 0.5 μL of each primer and deionized water. The ABI System (Applied Biosystems StepOne, USA) was used for Real-Time PCR under the following conditions: 95°C for 2 minutes, and 35 cycles of 95°C for 10 seconds and 60°C for 30 seconds.
Statistical Analysis
Experiments were assayed in triplicate and statistical analysis was performed with SPSS version 20.0 statistic software package. The student’s t-test and analysis of variance (ANOVA) were used for analysis of the experimental data. A P-value of <0.05 was considered statistically significant.
Results
Synthesis and Characterization of Magnetic Nanovector
PEG/Ca(II)/MNGs were prepared via thermal decomposition of iron chloride and trisodium citrate in the presence of sodium acetate in ethylene glycol.36,39 FT-IR spectra (Figure 2A) show the binding modes as 1,536 and 1,375 cm−1, which are related to symmetric and asymmetric stretches of carbonyl groups, whereas 550–590 cm−1 absorption shows the ligand-nanoparticle binding. Furthermore, 1,050–1,220 cm−1 peaks may be assigned to the PEG functional groups.40,,42 Notably, the peak near 711 and 875 cm−1 in PEG/Ca(II)/MNGs can be assigned to the vibration bands of Ca-O. As Ca is minor in the nanoparticle structure, its absorption peaks are not clear.43 Comparison between FT-IR spectra of naked MNGs and PEG capped MNGs show a little (blue) shift which implicates the surface changes of MNGs after PEG capping, where the new bands between Fe-O and O-H are formed.44 Zeta potential measurements at various pH were carried out to obtain the surface charge of nanocarrier. Figure 2B shows the zeta potential data of the MNGs and PEG/Ca2+/MNGs. As shown in Figure 2B, at physiological pH, zeta potential was shifted from −23.9 mV to +11.0 mV. This shift can be related to the less aggregation of PEGylated MNGs in aqueous solution compared to naked MNGs. In all cases, charge differences higher than ±10 mV show a greater inter-particle repulsion and, hence, increase the colloidal stability.45
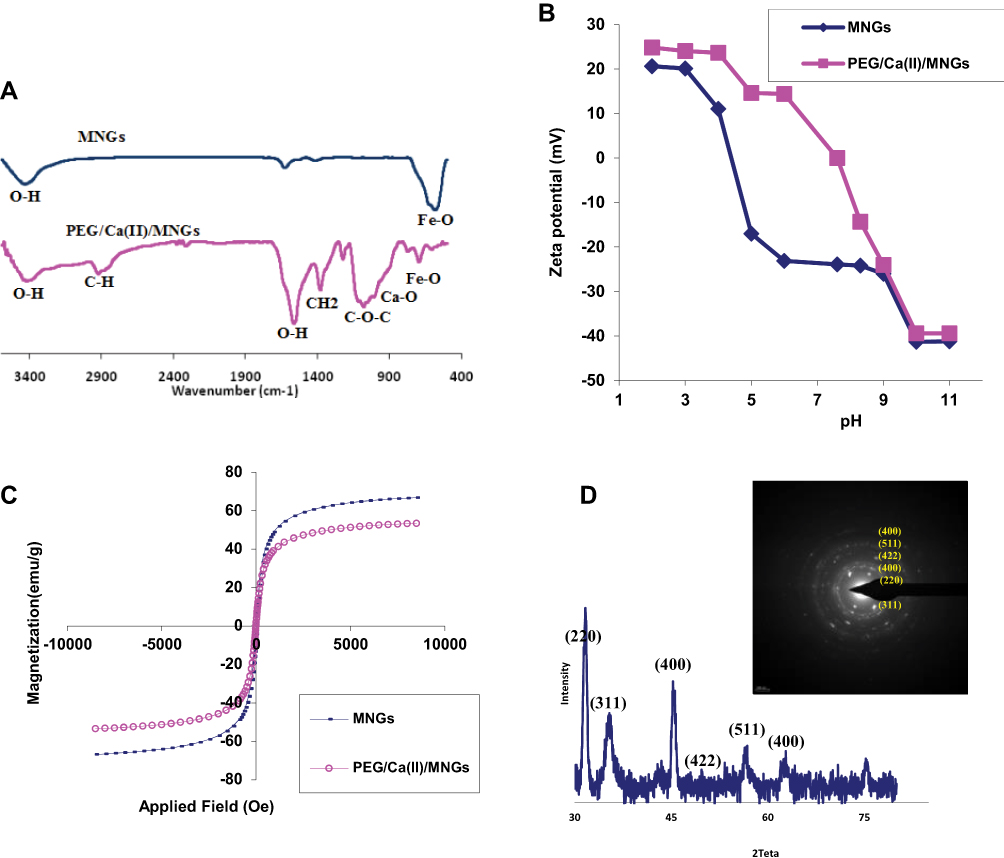 |
Figure 2 (A) FT-IR spectra of MNGs and PEG/Ca(II)/MNGs. (B) Zeta potential of MNGs and PEG/Ca(II)/MNGs. (C) Hysteresis loops of MNGs and PEG/Ca(II)/MNGs. In the inset: photograph of an aqueous PEG/Ca(II)/MNGs in a vial without/with magnetic field. (D) XRD pattern of bare MNGs. In the inset: SAED pattern of MNGs. |
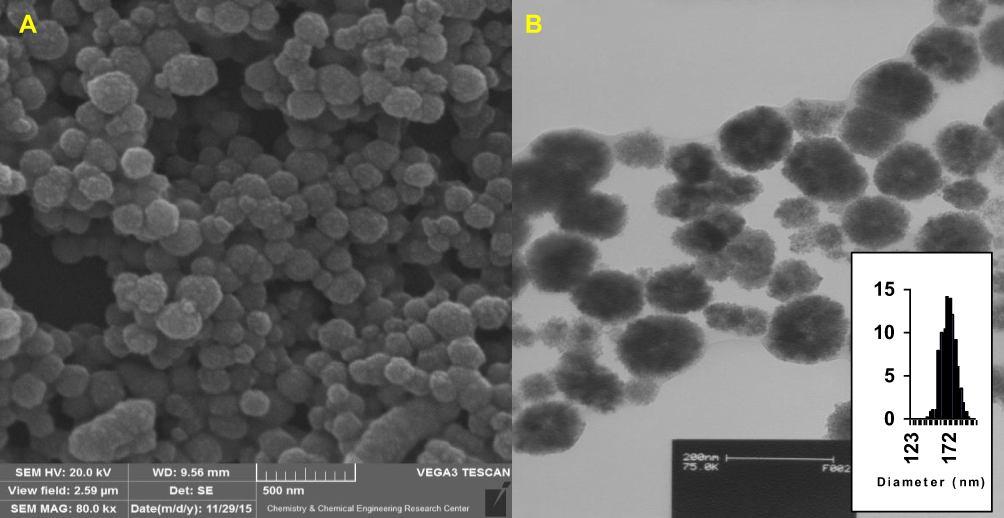 |
Figure 3 (A) SEM of bare MNGs. (B) TEM of bare MNGs; inset: size distribution of MNGs. |
Shifting the zeta potential to positive values confirms the protonation of MNGs surface which can be related to PEG capping of the Ca(II)/MNGs surface.46 The magnetization hysteresis loop of nanocrystals was probed in a magnetic field up to 3 T at room temperature using a vibrating sample magnetometer (VSM). The results in Figure 2C show that the magnetic behavior of MNGs is similar to that of superparamagnetic materials. The saturation magnetization of MNGs at room temperature was 62.5 and 53.4 emu/g for MNGs and PEG/Ca2+/MNGs, respectively. The saturation magnetization of PEGylated crystals was decreased which may be attributed to the high weight fraction of PEG or a surface-related effect such as surface disorder. X-ray diffraction peaks (2θ) at 30.0, 35.6, 43.8, 54.2, 57.2, and 62.5 (shown in Figure 2D) indexed to (220), (311), (400), (422), (511), and (440), which show the cubic spinel structure of MNGs.
Scanning electron microscopy (SEM) images showed the formation of spherical magnetic nanoparticles (Figure 3). Transmission electron microscopy (TEM) analysis revealed that magnetic nanoparticles were uniform and separated from one another and had an average diameter of 170 nm (Figure 3). Uniformity of nanoparticles was clearly demonstrated by TEM image of the colloidal packing. Spherically monodisperse images of MNGs speculate that the formation of this magnetic nanocarrier is probably driven by enhanced forces which originated from complex formation between tricarboxylic acid groups of trisodium citrate with Fe(III) ions.36,47
DLS analysis showed that mean hydrodynamic size distribution of bare MNGs and PEG/Ca(II)/MNGs were centered at 164 and 170 nm, respectively. As shown in Figure 4A, no broadening of size distribution occurred, which suggests that no aggregations in bare MNGs and PEGylated MNGs occurred. Shifting the hydrodynamic size distribution from 164 to 170 nm is related to Ca(II) doping and PEGylation. To further confirm the success of PEGylation, the corresponding TEM and SEM images of MNGs after PEGylation were obtained. As shown in Figures 4B and C, both TEM and SEM images show a spherical hollow layer with a thickness of ≈5 nm covering the MNGs. With their combination of biocompatibility, magnetism and monodispersity, magnetic nanocarriers have potential in various applications, especially in nanobiotechnology.
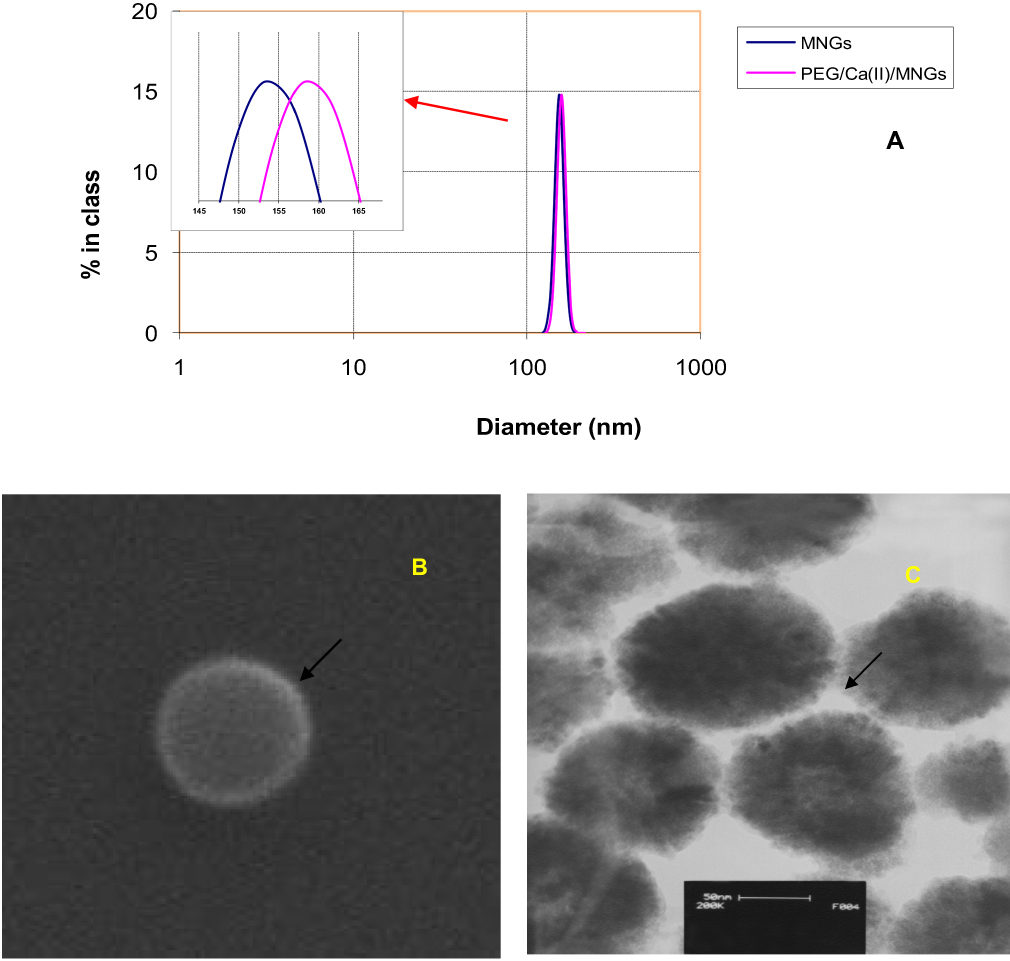 |
Figure 4 (A) Size distribution of bare MNGs and PEG/Ca(II)/MNGs. (B) TEM image of PEG/Ca(II)/MNGs. (C) SEM image of PEG/Ca(II)/MNGs (scale bar is 50 nm). |
Cytotoxicity Study
In order to be applied in a gene delivery experiment, the cytotoxicity of magnetic nanocarrier against E. coli and Hek293T cells were tested. Cytotoxicity assay was done under three incubation times. The results for E. coli show that cell viability and proliferation were not hindered by the magnetic nanocarrier at a wide concentration range and three incubation times of 1, 2, and 3 hours (Figure 5A). Furthermore, the results of viability of treated Hek293T cells show that after their exposing with different concentrations of nanocarrier (0.1, 1, and 10 µg/mL), the nanocarrier was not toxic and the viability rates were 98%, 95%, and 92%, which are not significant. However, in 100 and 500 µg/mL of nanocarrier, the viability rates were significantly decreased.
Delivery of PUC19 Plasmid into E. Coil Membrane
In the optimized experimental conditions, magnetic nanocarrier was applied to the delivery of PUC19 plasmid into the E. coli membrane. A modified Sambrook protocol was applied for gene transfection.38 Different ratios of nanoparticle/plasmid were applied to obtain high transformation efficiency. The obtained results show that high ratio of nanocarrier/plasmid increased transfection efficiency. This increase continued to a toxic concentration level of nanocarrier in which the number of bacterial colonies was dropped. The transformation rate is evaluated by colony numbers counting. Transformed cells are able to live and continue their growth on antibiotic-selective medium, while the untransformed cells will die. Comparison between the transformed bacteria plates after treatment and the control group is presented in Figure 5B.
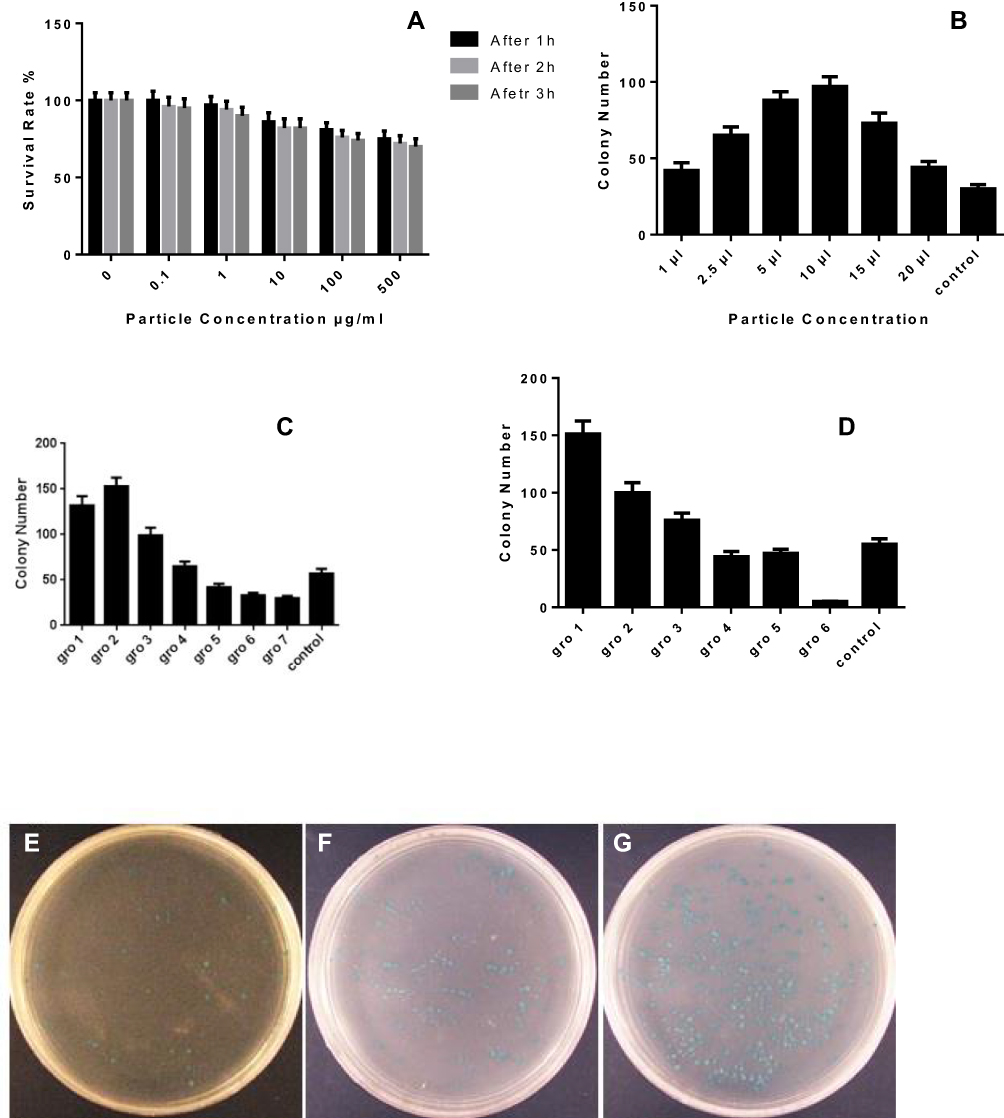 |
Figure 5 (A) Viability assay of E. coli in three incubation times. (B) Relation between nanocarrier concentration and number of colonies. (C) Relation between nanocarrier concentration variations in different gene delivery steps and colony number. (D) Effect of LB volume on the colony number. The colony number evaluation of transformed bacteria cells, (E) control, (F) group 2, (G) group 1. The blue colonies show viable and transformed bacteria. |
Gene delivery in bacterial cells is highly dependent on the nanocarrier concentration. High concentrations of nanocarrier are toxic. For example, in the presence of 15 and 20 µL of nanocarrier, the colony numbers decreased to 73±6.7 and 44±3.9, respectively. However, 10 µL of nanocarrier dramatically dropped the colony numbers to 97±6.4, which was about 3-fold more than the control group (traditional method) with a 30±2.8 colony (Figure 5B).
We selected 10 µL as the optimized concentration for transformation, as it was in this concentration that the highest colony number was seen. At higher concentrations, the colony number dropped until reaching the least number (Figure 5B).
To obtain a concentration of nanocarrier where, at this concentration, the transformation efficiency is higher, we set up a series of experiments by adding 10 µL of nanocarrier in different steps of transformation.
The results presented in Figure 5C show that in group 1, in which the nanocarrier was added at the initial step of transformation, the number of colonies was significantly changed in comparison with the control group (132±9.5). In group 2 (156±10), in which the nanocarrier was added before the heat shock, the number of colonies were more than the control group, with the highest number of colonies. In group 2, the bacteria were exposed with the nanocarrier for 30 minutes less than in group 1. The results show that, during the 30 minutes incubation of bacteria on the ice-bath, the presence of a nanocarrier is not essential to increase the transfection efficiency. Perhaps the decreasing colony numbers are because of the potential toxicity of the nanocarrier. In group 3, addition of the nanocarrier increased the transfection rate (99±8.5), but this was less than group 1 and 2 (see Figures 5E–G). This result could be described by less exposing (30 seconds) of bacteria with the nanocarrier. Similar results were obtained for group 4 (65±5.6), where the nanocarrier increased the colony numbers but it was less than groups 1, 2, and 3. In group 4, the bacteria exposing time was 60 minutes less than other groups. In groups 5 (42±3.8) and 6 (33±2.7), in which the nanocarrier was added after the heat shock, the colony numbers decreased in comparison with the control group (57±5.2) (Figure 5C). The effect of neutralizing media on the efficiency of transfection process was studied. In this experiment, different volumes of neutralizing media and different concentrations of nanocarrier on the transfection efficacy were tested. The groups were as follows: 1) 5 µL nanocarrier neutralized with 500 µL of LB, 2) 5 µL nanocarrier neutralized with 50 mL of LB, 3) 10 µL nanocarrier neutralized with 500 µL of LB, 4) 10 µL nanocarrier neutralized with 5 mL of LB, 5) 20 µL nanocarrier neutralized with 500 µL of LB, (6) 20 µL nanocarrier neutralized with 5 mL of LB, and 7) control group. As shown in Figure 5D, the best efficiency was obtained for group 1 with (150±10) colonies when 5 µL nanocarrier neutralized with 500 µL of LB. As a result of this experiment, diluting the nanocarrier with more neutralized media decreased the toxiceffect of the nanocarrier.
Success, Quality, and Purity of Transfected Plasmid
To examine the success, quality, and purity of transfected plasmid, the transfected plasmid was extracted from treated colonies using a commercial plasmid extraction kit. The isolated plasmid was subjected to control the endonuclease digestion. Figure 6A shows the agarose gel electrophoresis of transformed plasmid. The efficiency of the transformation process has increased dramatically by using magnetic nanograin as a gene carrier. After electrophoresis in agarose gel, the digested plasmid showed a negligible fragmentation (Figure 6B). As shown in Figure 4B, the digestion was effective and no band of undigested plasmid was found. Finally, to assess the quality of transferred plasmid using magnetic nanocarrier, polymerase chain reaction (PCR) was made on the NeoR gene. Figure 6C shows the 807 bp amplicon of NeoR in the treated band which is accorded with the control group and molecular weight marker.
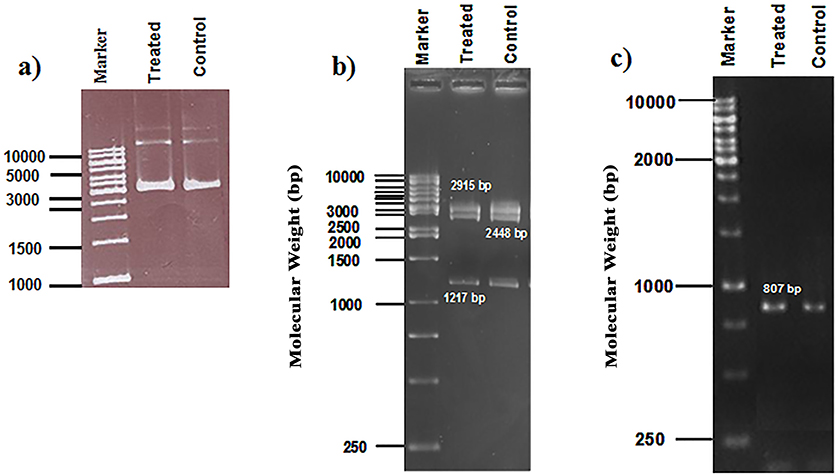 |
Figure 6 (A) Agarose gel electrophoresis of extracted plasmid. Lane 1: molecular marker, Lane 2: treated, Lane 3: control: (B) Restriction endonuclease digestion. Lane 1: molecular marker, Lane 2: enzyme digested pDNA extracted from treated-cells, Lane 3: enzyme digested pDNA extracted from control cells. (C) Agarose gel electrophoresis of NeoR gene (807 bp amplicon). Lane 1: DNA molecular weight marker; Lane 2: treated sample; Lane 3: control. |
Gene Expression Analysis in HEK-293 T Cells
The relative gene expression analysis by qPCR showed that treated cells by nanocarrier enhanced the GFP expression 1.4-fold more than the control group (Lipofectamine 2000), which shows a significant differences (P≤0.05) (Figure 7C). Furthermore, microscopic analysis revealed that the GFP expression rate in nanocarriers treated cells was remarkably higher than in the control group (see Figures 7A and B).
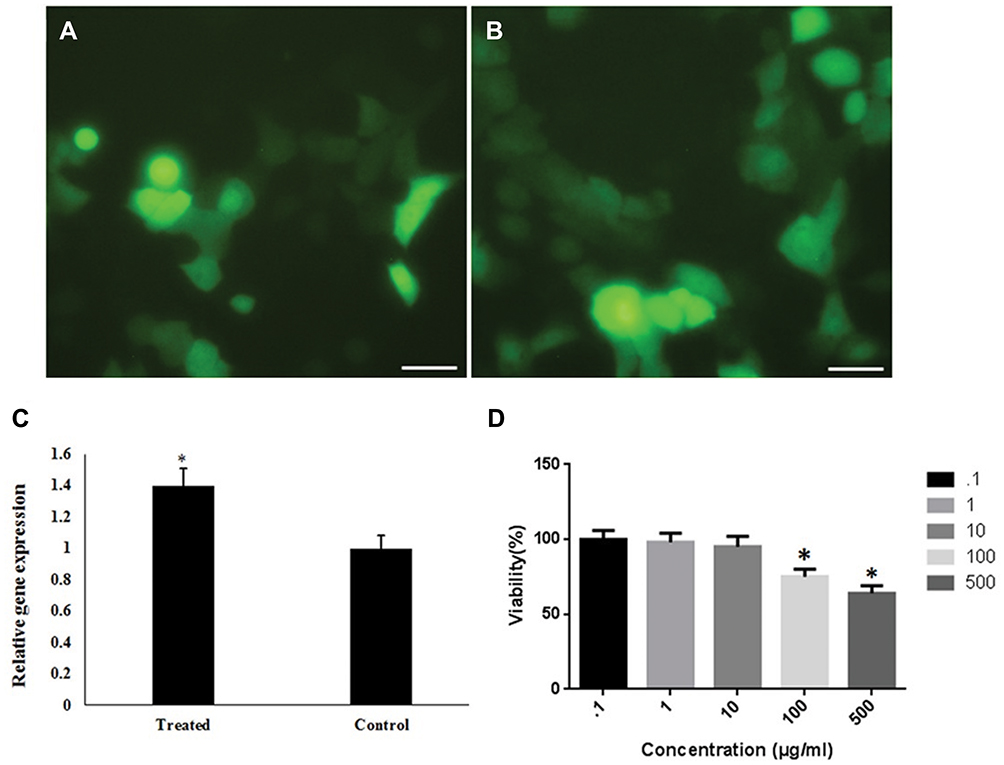 |
Figure 7 Gene delivery efficiency of GFP by PEG/Ca(II)/MNGs: (A) Phase contrast fluorescence microscopy image of transfected cells in the Control group. (B) Fluorescence image of transfected GFP in cells by PEG/Ca(II)/MNGs. (C) Relative GFP expression by qPCR in treated cell by PEG/Ca(II)/MNGs and lipofectamine 2000 as a standard method (Scale bar is 20 µm). (D) Viability of exposed HEK 293T cells to PEG/Ca(II)/MNGs. All experiments were performed in triplicate. |
Discussion
The modified solvothermal synthesis protocol is presented in Figure 1. Briefly, three carboxylate groups of trisodium citrate create a strong coordination affinity to three valence iron ions resulting not only in citrate groups on magnetic nanocrystals (MNCs) but also preventing the nanocarrier from aggregation.36 Another role of trisodium citrate is to render the surface of the nanocarrier more biocompatible. To the best of our knowledge, citric acid is widely used in food and drug industries and has a key role in the normal metabolic process in the human body (tricarboxylic acid cycle). Ethylene glycol works as a solvent and its excess serves as a reductant.36 Sodium acetate serves as the source of alkali media. The citrate anions on the spherical surface of MNGs captured Ca2+ ions by ion exchange process and a layer of PEG was coated on the MNGs surface.36 It is reported that PEG can reduce the non-specific cellular uptakes.39
In this paper the cytotoxicity of the nanocarrier was tested and a non-toxic concentration of nanocarrier for E. coli and Hek293T cells was determined. Previous studies revealed that all nanoparticles exhibit a dose-dependent cytotoxicity, but dose-dependent toxicity of the synthesized magnetic nanocarrier is negligible.48 In addition, PEG protected the positive charge of magnetic nanocarrier and caused a proton sponge structure which protected the cell membrane damage due to abundant positive charge. This is an issue for cationic polymers which are used as non-viral vectors.15 The obtained non-toxic concentration of nanocarrier was applied for gene delivery and the results, which are presented in Figure 5, showed an increase in the gene delivery efficiency by adding nanocarrier. High plasmid transfection efficiency is a crucial factor in gene delivery. Naked plasmid cannot penetrate to bacteria membrane due to electrostatic repulsion between anionic bacteria membrane surface and negative charges of plasmid. Therefore, plasmid might be absorbed on the positively charged magnetic nanograin surface to pass through bacteria membrane. A plasmid (containing an antibiotic resistance gene) penetrates a bacterial cell, resulting in viability of bacteria when cultured in antibiotic-selective medium. However, untransformed cells are not able to growth in such selective medium. Results in Figure 5 revealed that the nanocarrier could be able to enhance the transformation rate.
In this work the mechanism of increasing the gene delivery rate was evaluated and the best step for addition of the nanocarrier, to obtain the best efficiency, was assessed. The data showed that addition of the nanocarrier before and after the heat shock does not have any positive effect on the transformation rate. In addition, we found that the best step for adding a nanocarrier is exactly before and during the heat shock period. Our results are a first report that introduce the best protocol for increasing the transformation rate. In some groups, the colony number was decreased. This decrease in the colony number in groups 5 and 6 could be due to the toxicity potential of the nanocarrier. Further, they could not transfer plasmids to bacterial cells and led to a drop in colony numbers. The importance of gene delivery in clinical therapy in some genetic diseases like diabetes, heart diseases, or in molecular biology labs is not hidden. However, the efficiency and adverse effects of gene carriers are the main issues. Better understanding of cell state, during a physiological process such as transformation, can reduce the toxic effects of the nanocarrier. Using this information, one can find at what stage the gene delivery process achieves less adverse effects on cells. In this work, by testing at which step we can add a nanocarrier to obtain high efficiency and lowest toxicity, we reached the optimum period and also the best concentration of the nanocarrier.
Conclusions
In this study we have shown the utility of a gene expression response of PEG/Ca(II) assembly of magnetic nanograin in both eukaryote and prokaryote systems. We confirmed the biocompatibility of nanograins in different incubation times and a wide concentration range. We have also shown a plausible mechanism for the gene expression process. The results of this study show that doping calcium ions on the nanograins dramatically increased the transfection efficiency of PUC19 plasmid onto E. coli bacteria membrane and GFP expression in HEK-293 T cells.
Acknowledgements
We gratefully acknowledge the financial support from the Iran National Science Foundation (INSF; project number 96005771) and Research Council of the Hamadan University of Medical Sciences (9703081282).
Disclosure
The authors report no conflicts of interest in this work.
References
1. Choi YS, Lee MY, David AE, Park YS. Nanoparticles for gene delivery: therapeutic and toxic effects. Mol Cell Toxicol. 2014;10:1–8. doi:10.1007/s13273-014-0001-3
2. Chen J, Jiao ZX, Lin L, et al. Polylysine-modified polyethylenimines as siRNA carriers for effective tumor treatment. Chin J Polym Sci. 2015;33:830–837. doi:10.1007/s10118-015-1632-0
3. Yadegari A, Khezri J, Esfandiari S, et al. Bottom-up synthesis of nitrogen and oxygen co-decorated carbon quantum dots with enhanced DNA plasmid expression. Colloids Surf B. 2019;184:110543. doi:10.1016/j.colsurfb.2019.110543
4. Jin S, Leach JC, Ye K. Nanoparticle-mediated gene delivery. Methods Mol Biol. 2009;544:547–557.
5. Wu Y, Wang W, Chen Y, et al. The investigation of polymer-siRNA nanoparticle for gene therapy of gastric cancer in vitro. Int J Nanomed. 2010;5:129–136.
6. Eltoukhy AA, Sahay G, Cunningham GM, Anderson DG. Niemann-Pick C1 affects the gene delivery efficacy of degradable polymeric nanoparticles. ACS Nano. 2014;8:7905–7913. doi:10.1021/nn501630h
7. Song H, Wang G, He B, et al. Cationic lipid-coated PEI/DNA polyplexes with improved efficiency and reduced cytotoxicity for gene delivery into mesenchymal stem cells. Int J Nanomed. 2012;7:4637–4648.
8. Cheng L, Li Y, Zhai X, Xu B, Cao Z, Liu W. Polycation-b-polyzwitterion copolymer grafted luminescent carbon dots as a multifunctional platform for serum-resistant gene delivery and bioimaging. ACS Appl Mater Interfaces. 2014;6:20487–20497. doi:10.1021/am506076r
9. Bardi G, Malvindi MA, Gherardini L, Costa M, Pompa PP, Cingolani R. The biocompatibility of amino functionalized CdSe/ZnS quantum-dot-doped SiO2 nanoparticles with primary neural cells and their gene carrying performance. Biomaterials. 2010;31:6555–6566. doi:10.1016/j.biomaterials.2010.04.063
10. Pantarotto D, Singh R, McCarthy D, Erhardt M, Briand JP, Prato M. Functionalized carbon nanotubes for plasmid DNA gene delivery. Angew Chem Int Ed. 2004;43:5242–5246. doi:10.1002/anie.200460437
11. Karmakar A, Bratton SM, Dervishi E, et al. Ethylenediamine functionalized-single-walled nanotube (f-SWNT)-assisted in vitro delivery of the oncogene suppressor p53 gene to breast cancer MCF-7 cells. Int J Nanomed. 2011;6:1045–1055.
12. Li K, Feng L, Shen J, et al. Patterned substrates of nano-graphene oxide mediating highly localized and efficient gene delivery. ACS Appl Mater Interfaces. 2014;6:5900–5907. doi:10.1021/am5008134
13. Zhang Y, Wang Z, Zhou W, Min G, Lang M. Cationic poly(caprolactone) surface functionalized mesoporous silica nanoparticles and their application in drug delivery. Appl Surf Sci. 2013;276:769–775. doi:10.1016/j.apsusc.2013.03.168
14. Song H, Yu M, Lu Y, et al. Plasmid DNA delivery: nanotopography matters. J Am Chem Soc. 2017;139:18247–18254. doi:10.1021/jacs.7b08974
15. Chaudhary A, Garg S. siRNA delivery using polyelectrolyte-gold nanoassemblies in neuronal cells for BACE1 gene silencing. Mater Sci Eng C. 2017;80:18–28. doi:10.1016/j.msec.2017.05.101
16. Seferos DS, Prigodich AE, Giljohann DA, Patel PC, Mirkin CA. Polyvalent DNA nanoparticle conjugates stabilize nucleic acids. Nano Lett. 2009;9:308–311. doi:10.1021/nl802958f
17. Giljohann DA, Seferos DS, Daniel WL, Massich MD, Patel PC. Gold nanoparticles for biology and medicine. Angew Chem Int Ed. 2010;49:3280–3294. doi:10.1002/anie.200904359
18. Guo S, Huang Y, Jiang Q, et al. Enhanced gene delivery and siRNA silencing by gold nanoparticles coated with charge-reversal polyelectrolyte. ACS Nano. 2010;4:5505–5511. doi:10.1021/nn101638u
19. Cole AJ, David AE, Wang J, Galbán CJ, Hill HL, Yang VC. Polyethylene glycol modified, cross-linked starch-coated iron oxide nanoparticles for enhanced magnetic tumor targeting. Biomaterials. 2011;32(8):2183–2193. doi:10.1016/j.biomaterials.2010.11.040
20. Berry CC, Wells S, Charles S, et al. Dextran and albumin derivatised iron oxide nanoparticles: influence on fibroblasts in vitro. Biomaterials. 2003;24:4551–4557. doi:10.1016/S0142-9612(03)00237-0
21. Berry CC, Curtis ASG. Functionalisation of magnetic nanoparticles for applications in biomedicine. J Phys D Appl Phys. 2003;36:R198–206. doi:10.1088/0022-3727/36/13/203
22. Bertilsson L, Liedberg B. Infrared study of thiol monolayer assemblies on gold – preparation, characterization, and functionalization of mixed monolayers. Langmuir. 1993;9:141–149. doi:10.1021/la00025a032
23. Cai D, Mataraza JM, Qin ZH, et al. Highly efficient molecular delivery into mammalian cells using carbon nanotube spearing. Nat Methods. 2005;2:449–454. doi:10.1038/nmeth761
24. Choi CJ, Dong XL, Kim BK. Microstructure and magnetic properties of Fe nanoparticles synthesized by chemical vapor condensation. Mater Trans. 2001;42:2046–2049. doi:10.2320/matertrans.42.2046
25. McBain SC, Yiu HH, Dobson J. Magnetic nanoparticles for gene and drug delivery. Int J Nanomed. 2008;3(2):169–180.
26. Baoum AA, Ovcharenko D, Berkland CJ. Calcium condensed cell penetrating peptide complexes offer highly efficient, low toxicity gene silencing. Int J Pharm. 2012;427:134–142. doi:10.1016/j.ijpharm.2011.08.012
27. Baoum AA, Berkland CJ. Calcium condensation of DNA complexed with cell-penetrating peptides offers efficient, noncytotoxic gene delivery. J Pharm Sci. 2011;100:1637–1642.
28. Haberland A, Knaus T, Zaitsev SV, et al. Calcium ions as efficient cofactor of polycation-mediated gene transfer. Biochim Biophys Acta. 1999;1445:21–30. doi:10.1016/S0167-4781(99)00017-2
29. Chen X, Guo P, Xie Z, Shen P. A convenient and rapid method for genetic transformation of E. coli with plasmids. Antonie Van Leeuwenhoek. 2001;80:297–300. doi:10.1023/A:1013040812987
30. Zaitsev S, Buchwalow I, Haberland A, et al. Histone H1-mediated transfection: role of calcium in the cellular uptake and intracellular fate of H1-DNA complexes. Acta Histochem. 2002;104:85–92. doi:10.1078/0065-1281-00633
31. Ziello JE, Huang Y, Jovin IS. Cellular endocytosis and gene delivery. Molecular Med. 2010;16:222–229. doi:10.2119/molmed.2009.00101
32. Baoum A, Xie SX, Fakhari A, Berkland CJ. “Soft” calcium crosslinks enable highly efficient gene transfection using TAT peptide. Pharm Res. 2009;26:2619–2629. doi:10.1007/s11095-009-9976-1
33. Asif A, Mohsin H, Tanvir R, Rehman Y. Revisiting the mechanisms involved in calcium chloride induced bacterial transformation. Front Microbiol. 2017;8:2169. doi:10.3389/fmicb.2017.02169
34. Wu SY, Chang LT, Peng S, Tsai HC. Calcium-activated gene transfection from DNA/poly(amic acid-co-imide) complexes. Int J Nanomed. 2015;10:1637–1647.
35. Sandhu AP, Lam AM, Fenske DB, Palmer LR, Johnston M, Cullis PR. Calcium enhances the transfection potency of stabilized plasmid-lipid particles. Anal Biochem. 2005;341:156–164. doi:10.1016/j.ab.2005.02.033
36. Deng H, Li X, Peng Q, Wang X, Chen J, Li YD. Monodisperse magnetic single-crystal ferrite microspheres. Angew Chem Int Ed. 2005;44:2782. doi:10.1002/(ISSN)1521-3773
37. Phadatare MR, Khot VM, Salunkhe AB, Thorat ND, Pawar SH. Studies on polyethylene glycol coating on NiFe2O4 nanoparticles for biomedical applications. J Magn Magn Mater. 2012;324:770–772. doi:10.1016/j.jmmm.2011.09.020
38. Sambrook J, Fritschi EF, Maniatis T. Molecular Cloning: A Laboratory Manual. New York: Cold Spring Harbor Laboratory Press; 1989.
39. Xie J, Xu C, Kohler N, Hou Y, Sun S. Controlled PEGylation of monodisperse Fe3O4 nanoparticles for reduced non-specific uptake by macrophage cells. Adv Mater. 2007;19:3163–3166. doi:10.1002/adma.200701975
40. Willis AL, Turro NJ, O’Brien S. Spectroscopic characterization of the surface of iron oxide nanocrystals. Chem Mater. 2005;17:5970. doi:10.1021/cm051370v
41. Bronstein LM, Huang X, Retrum J, et al. Influence of iron oleate complex structure on iron oxide nanoparticle formation. Chem Mater. 2007;19:3624. doi:10.1021/cm062948j
42. Yee C, Kataby G, Ulman A, et al. Self-assembled monolayers of alkanesulfonic and -phosphonic acids on amorphous iron oxide nanoparticles. Langmuir. 1999;152:7111–7115. doi:10.1021/la990663y
43. Nan Z, Chen X, Yang Q, Wang X, Shi Z, Hou W. Structure transition from aragonite to vaterite and calcite by the assistance of SDBS. J Colloid Inter Sci. 2008;325:331–336. doi:10.1016/j.jcis.2008.05.045
44. Lin Y, Lin Y, Wang L, Ngo S, Ma Y. Renal perfusion assessment using magnetic nanoparticles with 7T dynamic susceptibility contrast MRI in rats. J Magn Magn Mater. 2019;475:76–82. doi:10.1016/j.jmmm.2018.11.041
45. Salas G, Veintemillas-Verdaguer S, Morales Mdel P. Relationship between physico-chemical properties of magnetic fluids and their heating capacity. Int J Hyperthermia. 2013;29(8):768–776. doi:10.3109/02656736.2013.826824
46. Farmany A, Shamsara M, Mahdavi H. Enhanced electrochemical biosensing of buprenorphine opioid drug by highly stabilized magnetic nanocrystals. Sensors Actuat B-Chem. 2017;239:279–285. doi:10.1016/j.snb.2016.08.007
47. Kim M, Chen Y, Liu Y, Peng X. High-quality Fe3O4 dendron–nanocrystals dispersible in both organic and aqueous solutions. Adv Mater. 2005;17:1429. doi:10.1002/adma.200401991
48. Babincova M, Sourvong P, Leszczynska D, Babinec P. Blood-specific whole-body electromagnetic hyperthermia. Med Hypotheses. 2000;55:459–460. doi:10.1054/mehy.2000.1089
 © 2019 The Author(s). This work is published and licensed by Dove Medical Press Limited. The full terms of this license are available at https://www.dovepress.com/terms.php and incorporate the Creative Commons Attribution - Non Commercial (unported, v3.0) License.
By accessing the work you hereby accept the Terms. Non-commercial uses of the work are permitted without any further permission from Dove Medical Press Limited, provided the work is properly attributed. For permission for commercial use of this work, please see paragraphs 4.2 and 5 of our Terms.
© 2019 The Author(s). This work is published and licensed by Dove Medical Press Limited. The full terms of this license are available at https://www.dovepress.com/terms.php and incorporate the Creative Commons Attribution - Non Commercial (unported, v3.0) License.
By accessing the work you hereby accept the Terms. Non-commercial uses of the work are permitted without any further permission from Dove Medical Press Limited, provided the work is properly attributed. For permission for commercial use of this work, please see paragraphs 4.2 and 5 of our Terms.