")
Back to Journals » Drug Design, Development and Therapy » Volume 9
Effects of intravitreal injection of netrin-1 in retinal neovascularization of streptozotocin-induced diabetic rats
Authors Yu Y, Zou J, Han Y, Quyang L, He H, Hu P, Shao Y , Tu P
Received 1 August 2015
Accepted for publication 4 November 2015
Published 7 December 2015 Volume 2015:9 Pages 6363—6377
DOI https://doi.org/10.2147/DDDT.S93166
Checked for plagiarism Yes
Review by Single anonymous peer review
Peer reviewer comments 4
Editor who approved publication: Prof. Dr. Wei Duan
Yao Yu,1,2,* Jing Zou,3,* Yun Han,4 Luowa Quyang,4 Hui He,4 Peihong Hu,2 Yi Shao,2 Ping Tu1
1Nanchang Key Laboratory of Diabetes, Department of Endocrinology and Metabolism, The Third Hospital of Nanchang, Jiangxi, People’s Republic of China; 2Department of Ophthalmology, The First Affiliated Hospital of Nanchang University, Jiangxi Province Clinical Ophthalmology Institute, Jiangxi, People’s Republic of China; 3Department of Ophthalmology, Xiangya Hospital, Central South University, Hunan, People’s Republic of China; 4Fujian Provincial Key Laboratory of Ophthalmology and Visual Science, Eye Institute of Xiamen University, Fujian, People’s Republic of China
*These authors have contributed equally to this work
Background: In a previous study, we confirmed that netrin-1 acts as an antiangiogenic factor by inhibiting alkali burn-induced corneal neovascularization in rats. Here, we continue working on the role of netrin-1 in retinal neovascularization.
Methods: Using an in vitro angiogenesis assay, we detected the effects of netrin-1 on human umbilical vein endothelial cell tube formation, viability and proliferation, migration, and invasion at concentrations of 0.1 µg/mL or 5 µg/mL. We intravitreally injected 0.1 µg/mL or 5 µg/mL netrin-1 into streptozotocin-induced rats to assess retinal neovascularization using retinal electrophysiology and electroretinography, enzyme-linked immunosorbent assay, fundus fluoresce in angiography, measurement of inner blood retinal barrier, retinal hematoxylin-eosin staining, and retinal flat-mount fluorescence assays.
Results: Human umbilical vein endothelial cell tube formation, viability and proliferation, migration, and invasion were upregulated by netrin-1 at a concentration of 0.1 µg/mL (P<0.05), while 5 µg/mL netrin-1 had an opposite effect (P<0.05) in our in vitro angiogenesis assay. Retinal electrophysiology testing revealed that intravitreal injection of netrin-1 affected the amplitude of a- and b-waves (a-wave: 0.1 µg/mL netrin-1 =17.67±3.39 µm, 5 µg/mL netrin-1 =28.50±1.31 µm, phosphate-buffered saline [PBS]-treated =17.67±3.39 µm; b-wave: 0.1 µg/mL netrin-1 =44.67±4.80 µm, 5 µg/mL netrin-1 =97.17±9.63 µm, PBS-treated =44.67±4.80 µm) and the expression of VEGF-A (no-treatment rats, 9.29±0.80 pg/mL; PBS-treated rats, 19.64±3.77 pg/mL; 0.1 µg/mL netrin-1 treated rats, 21.37±3.64 pg/mL; 5 µg/mL netrin-1 treated rats, 9.85±0.54 pg/mL, at 6 weeks after induction). By comparing fluoresce in angiography, level of inner blood retinal barrier breakdown (% of control), retinal hematoxylin-eosin staining, and collagen-IV fluorescence assays in the retinas of PBS-treated rats, netrin-1 was found to suppress and reverse retinal neovascularization at a concentration of 5 µg/mL (P<0.05), while 0.1 µg/mL netrin-1 (P<0.05) led to an increase in the number of new retinal blood vessels, after 6 weeks’ injection.
Conclusion: Netrin-1 could play a significant role in retinal neovascularization by dual-direction regulating angiogenesis dependent on dosage.
Keywords: netrin-1,HUVEC, DR, intravitreal injection, retinal neovascularization
Introduction
Diabetic retinopathy (DR) is a severe complication in most diabetic patients that occurs when the small blood vessels in the retina become damaged.1 It is the leading cause of reduced vision and irreversible blindness in adults. The incidence of retinopathy in Chinese diabetic patients is 25.2%, and more than 70,000 people suffer from DR-related blindness every year in the People’s Republic of China.2,3 Consequently, ophthalmological studies have intensively investigated the pathogenesis, prevention, and treatment of DR. DR features selective loss of pericytes, which leads to increasing blood vessel permeability, and the formation of new blood vessels.4–6 So, the prevention of retinal neovascularization – as the unique feature of proliferative DR – is the key treatment in curing DR-related degeneration in the early stages.7,8
Netrin-1 is a member of the netrin family, constitutes one of the first factors which were identified as a soluble neural projection factor, and is highly expressed in the developing spinal cord, medulla oblongata, lower parts of the midbrain, and ventral part of the ventricle region.9,10 The function of netrin-1 in vascular guidance remains controversial. Netrin-1 induces vascular cell migration and promotes cell adhesion.11 Furthermore, netrin-1 can both enhance the pro-angiogenic function of VEGF and regulate the adhesion of vascular smooth muscle cells and endothelial cells by binding to neogenin.11 Recently, Xu et al12 treated oxygen-induced retinopathy in rats with specific lentivirus-mediated netrin-1 shRNA, which led to dramatically reduced retinal neovascularization, including less neovascular outgrowth into the inner limiting membrane in non-perfused areas. However, Lv et al reported that netrin-1 could inactivate the netrin receptor UNC5B in rats to inhibit angiogenesis.13 Downregulation of the netrin-1 ortholog in zebrafish caused improper development of the blood vessels, indicating that netrin-1 is a negative regulator of capillary branching.14 In our previous study, we also observed that netrin-1 could inhibit and reverse corneal neovascularization.15
Here, we continue to explore the role of netrin-1 in retinal neovascularization. First, we used human umbilical vein endothelial cells (HUVECs) as a model of vascular endothelial cells to assess the effects of netrin-1 in vitro. We also investigated the effects of intravitreal injection of netrin-1 into the retinas of streptozotocin (STZ)-induced diabetic rats. In this study, netrin-1 showed a dual function in angiogenesis, the effects of which were dose dependent. Thus, netrin-1 may play a significant role in retinal neovascularization.
Materials and methods
Cell culture and netrin-1 preparation
HUVECs were cultured as previously described.16 In brief, the cells were cultured in a medium containing endothelial cell basal medium 2, 2% fetal calf serum, and endothelial cell growth supplement (Promo Cell, Heidelberg, Germany). Netrin-1 (Cat 26162, Abcam, Cambridge, UK) was dissolved in 1% bovine serum albumin (BSA) in phosphate-buffered saline (PBS) to prepare the required concentrations.
Cell counting kit-8 (CCK-8) assay
After 24 hours’ incubation, 5×10³ cells/well HUVECs cultured in 96-well plates were treated with 0.01 μg/mL, 0.05 μg/mL, 0.1 μg/mL, 0.5 μg/mL, 1.0 μg/mL, 2.0 μg/mL, 5.0 μg/mL, 10.0 μg/mL or 50.0 μg/mL netrin-1, and PBS or 1% BSA in PBS. Ten microliters of CCK-8 solution (Dojindo, Kumamoto, Japan) was added to every well to measure the absorbance (ie, optical density) at 450 nm after 36, 48, and 72 hours’ incubation, as previously described.16
Flow cytometric cell-cycle analysis
One percent BSA in PBS or netrin-1 (100 or 5,000 ng/mL) was added to the medium until the HUVECs converged. After incubation, the cells were fixed in 70% cold ethanol and used to examine the cell cycle with a flow cytometer (FAC Scan; BD Biosciences, Franklin Lakes, NJ, USA).
Wound closure assay for assessing migration
As reported in a previous study,16 the migration of HUVECs was measured by a wound-healing assay. When the cells were 90% confluent, we created 2 mm scrapes with a sterile 200 μL pipet tip and photographed the change in scrapes incubated with the experimental medium (1% BSA in PBS, 100 or 5,000 ng/mL netrin-1) after 16 hours and 32 hours.
Cell invasion assay
HUVECs (200,000 cells each well) were seeded in the upper invasion chamber, placed in 24-well plates, while 1% BSA in PBS or 800 μL netrin-1 (100 or 5,000 ng/mL) was added to the lower invasion chamber. After 24 hours’ incubation, the non-invaded cells were washed with PBS, while the invaded cells were saved in the inserts which were coated with Matrigel (BD Biosciences, San Jose, CA, USA). The inserts were removed and fixed in 4% formalin for 30 minutes at room temperature and stained with 46-diamidino-2-phenylindole (DAPI). The cells were observed and photographed under a fluorescent microscope, and all images were analyzed using ImageJ software.
In vitro tube formation assay
HUVECs (10,000 cells each well) were seeded on growth factor-depleted Matrigel in 24-well plates and 1% BSA in PBS or netrin-1 (100 or 5,000 ng/mL) was added to the media without the addition of growth factor. After 6 hours’ incubation, the cells were fixed with 4% paraformaldehyde at room temperature, and the tube structures that formed in the gel were photographed at low magnification (10×). All wells were photographed five times and analyzed using ImageJ software.
Establishment of animal models
Sprague Dawley rats (180–220 g, aged 8–10 weeks, male) were used in the study. All animals were housed with environmental enrichment with free access to food and water. Animal experiments were performed in accordance with the ARVO Statement for the Use of Animals in Ophthalmic and Vision Research and the Guidelines of the Animal Experimental Committee of Nanchang University (Jiangxi, People’s Republic of China). Ethics approval was obtained from the Animal Ethical Committee of Nanchang University (Jiangxi, People’s Republic of China). Diabetic rats were prepared as previously reported.17 Prior to treatment, we confirmed that all rats were free from ocular diseases.
Induction of diabetes
Diabetes was induced with 65 mg/kg STZ in intraperitoneal in 100 mmol/L citrate buffer (pH 4.5) (Sigma-Aldrich Co., St Louis, MO, USA) in Sprague Dawley rats according to the published protocol, with slight modifications.18 After a single dose of STZ injection, body weights were recorded daily, and diabetic status was confirmed by tail-vein blood glucose measurement using an automated Accu-Chek glucometer (Hoffman-La Roche Ltd., Basel, Switzerland) after 48 hours. Rats with non-fasting blood glucose levels of 13.8 mmol/mL were deemed diabetic and included in the study. Maintenance of a diabetic state was confirmed by weekly tail-vein blood glucose measurements.
Treatment
Netrin-1 was dissolved in saline to prepare the required concentrations for intravitreal injection. Intravitreal treatment with netrin-1 or saline was performed 2 weeks after induction of diabetes. Rats were divided into four groups of 120 rats per group: Group 1, diabetic eyes without treatment (negative control [CTR], n=30, right eyes); Group 2, diabetic eyes with PBS treatment (PBS-treated diabetic retinas, n=30, right eyes); Group 3, diabetic eyes with 0.1 μg/mL netrin-1 treatment (netrin-1 treated diabetic retinas, n=30, right eyes); and Group 4, diabetic eyes with 5.0 μg/mL netrin-1 treatment (netrin-1 treated diabetic retinas, n=30, right eyes).
Intravitreal injection of netrin-1
Netrin-1 (10 μg/uL) was injected into the vitreous of the right eye of the diabetes-induced rats for 2 weeks with a 32-gauge microinjector (Hamilton, Reno, NV, USA) under a dissecting microscope. All rats were anesthetized with intraperitoneal ketamine (60 mg/kg) and xylazine hydrochloride (4 mg/kg) intramuscularly and treated with 0.5% tropicamide and 2.5% phenylephrine hydrochloride to dilate the pupils before the injection. A 30-gauge needle was used to make a punch incision 1 mm posterior to the temporal limbus, and a microinjector needle was then inserted through the incision – 1.5 mm deep – angled toward the optic nerve. After injection at 1, 2, 4, and 6 weeks, retina samples from the four groups were quickly dissected, snap-frozen in liquid nitrogen, and stored at -80°C for enzyme-linked immunosorbent assay (ELISA), hematoxylin-eosin (HE) staining, and fluorescence imaging techniques.
Electroretinography
The protocol for recording electroretinograms (ERGs) in the dark room was similar to that used in the literature.19 The electrode was placed subcutaneously in the anterior scalp between the eyes, and the ground electrode was inserted into the tail. All recordings were done under anesthesia with intraperitoneal ketamine (60 mg/kg) and xylazine hydrochloride (4 mg/kg) im. In addition, the electrode was placed on the cornea to track the ERGs in the dark room.
ELISA
A VEGF-A ELISA (RayBiotech Inc., Norcross, GA, USA) was used to measure the levels of key molecules involved in angiogenesis in the retinal lysates from the four groups of rats at different time points (2, 3, 4, 6, and 8 weeks after diabetic induction), with 50 μg loaded to allow for analyses using optical density measurements as no standard curve was provided. The antibodies in the kit exhibited >95% cross-reactivity with rat VEGF-A.
Fundus fluorescein angiography (FFA)
Six weeks after diabetic induction, the rats were anesthetized with intraperitoneal ketamine (60 mg/kg), and xylazine hydrochloride (4 mg/kg) im and treated with 0.5% tropicamide and 2.5% phenylephrine hydrochloride to dilate their pupils. We injected fluorescein sodium (10%, 75 mg/kg) into the rats’ tail-vein and then immediately captured dynamic fundus images.
Inner blood retinal barrier (iBRB) breakdown measurement
The leakage of Evans blue (EB) dye (Sigma-Aldrich Co.) was used for inner blood retinal barrier (iBRB) breakdown measurement in the retinas. The rats were injected with 45 mg/kg EB through the femoral vein, and after 2 hours we used citrate-buffered paraformaldehyde (0.05 M, Ph 3.5, 1% w/v, 37°C) to perform the perfusion. Next, 120 μL of formamide (Sigma-Aldrich Co.) was added onto the dried retinas, then dried at 4°C for 24 hours after dissection from the rats following 2 hours’ perfusion. Finally, the extractive supernatant was applied to measure – at 620 and 740 nm – the background-subtracted absorbance. The breakdown of iBRB was calculated using the equation described previously.20
Retina HE staining
One-third of the retina tissues were isolated from differently treated diabetic rats, and then fixed in 4% paraformaldehyde solution for 2 hours. The samples were subsequently sectioned (5 μm), stained with HE, and examined under a microscope (Carl Zeiss Meditec AG, Jena, Germany).
Fluorescence imaging techniques for flat retinal preparations
Retinal flat-mounts were incubated for 30 minutes at room temperature in 5% BSA in PBS containing 0.5% Triton X-100 (0.5% T-PBS), and then we used a staining solution that contained a rabbit polyclonal anti-type IV collagen antibody (1:300; Abcam) to immerse the whole flat-mounts at room temperature. After 12 hours, the flat-mounts were washed with T-PBS and then immersed in solution containing the fluorescent secondary antibody goat anti-rabbit IgG (Wuhan Boster, Wuhan, People’s Republic of China). After 2 hours’ incubation at room temperature, the retinal flat-mounts were washed several times in 0.5% T-PBS, then DAPI was applied to the surface of the retinas for 5 minutes. All the images were recorded with a confocal laser scanning microscope (Carl Zeiss Meditec AG) after mounting.21
Image processing and statistical analysis
The images were processed using Image-Pro Plus 6.0 software, and statistical analyses were performed using IBM SPSS version 19.0 software (IBM Corporation, Armonk, NY, USA). We used the one-way analysis of variance and the independent-sample t-test to compare the findings of our study. All data were expressed as mean ± standard error and P<0.05 was considered significant.
Results
Effect of netrin-1 on the viability and proliferation of HUVECs
We used CCK-8 assays to measure the cell viability when exposed to different concentrations of netrin-1 (0.01 μg/mL, 0.05 μg/mL, 0.1 μg/mL, 0.5 μg/mL, 1.0 μg/mL, 2.0 μg/mL, 5.0 μg/mL, 10.0 μg/mL or 50.0 μg/mL). Because netrin-1 was dissolved in 1% BSA in PBS to prepare the required concentrations for the HUVECs, we also incubated the cells with the same volume of PBS or 1% BSA in PBS (Figure 1A). No differences were found between the viability of the HUVECs without treatment and with PBS or 1% BSA in PBS (P>0.05). Interestingly, netrin-1 was found to increase HUVEC viability at 0.01 μg/mL, 0.05 μg/mL, 0.1 μg/mL, and 0.5 μg/mL by comparing the samples with the CTR at every time point (P<0.05). In particular, when the HUVECs were subjected to a concentration of 0.1 μg/mL netrin-1, the absorbance reached the highest value (P<0.05), while the cell viability decreased at a netrin-1 concentration of ≥1.0 μg/mL and an increasing inhibitory effect was noted with increasing concentration (P<0.05). Moreover, the inhibitory effect of netrin-1 was the same at concentrations of 5.0 μg/mL, 10.0 μg/mL, or 50.0 μg/mL (P>0.05). In addition, we also assessed its effects on HUVEC proliferation by flow cytometry after ascertaining the effects of netrin-1 on cell viability. With reference to the results of the CCK-8 assay, netrin-1 concentrations of 0.1 μg/mL and 5.0 μg/mL were selected for comparison with the CTR (1% BSA in PBS) (Figure 1B). Both the percentage of cells in the S phase and the ratio of cells in the G2+S/G1 phase increased when the HUVECs were exposed to 0.1 μg/mL netrin-1 for 72 hours (P<0.05); however, there was a reduction in the numbers of these cells at a netrin-1 concentration of 5.0 μg/mL (P<0.05) (Figure 1C and D).
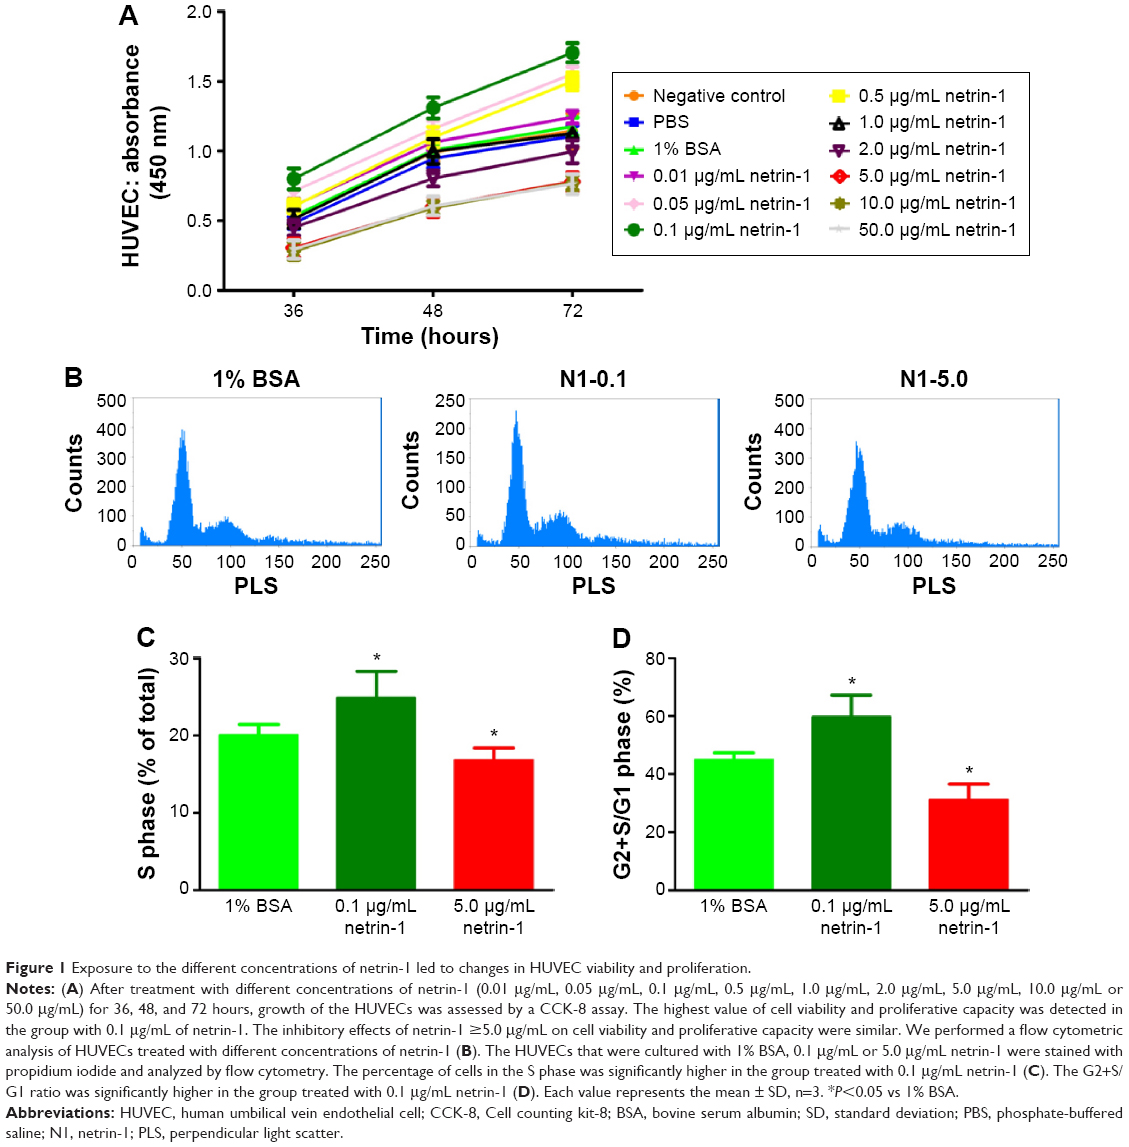 | Figure 1 Exposure to the different concentrations of netrin-1 led to changes in HUVEC viability and proliferation. |
Effect of netrin-1 on the migration, invasion, and tube formation of HUVECs
In this study, we used a wound scratch assay to confirm HUVEC migration at different dosages of netrin-1. After creating a scratch wound, all the wounds were exposed to 1% BSA (CTR), or 0.1 or 5.0 μg/mL netrin-1. While not all groups healed after 16 hours, the plates treated with 0.1 μg/mL netrin-1 showed more wound healing than was observed in the CTR and in the plates treated with 5 μg/mL netrin-1 (Figure 2A). At 32 hours after scratching, no differences were observed in the level of wound healing in the plates treated with 0.1 μg/mL netrin-1, while differences in wound healing could be observed in the plates treated with 1% BSA or 5 μg/mL netrin-1. Compared with the CTR (1% BSA), we found that 0.1 μg/mL netrin-1 could significantly promote the migration rate (P<0.05), but the migration rate of the HUVECs was inhibited by netrin-1 at concentrations of 5.0 μg/mL (P<0.05) (Figure 2B). Furthermore, we assessed HUVEC invasion using Transwell invasion assays. The cells treated with 5.0 μg/mL netrin-1 showed lower invasive abilities than the CTR, while 0.1 μg/mL netrin-1 accelerated the invasion of HUVECs (Figure 2C and D). We also assessed the effects of 0.1 or 5.0 μg/mL netrin-1 on HUVEC tube formation which could simulate the formation of new vessels in vivo. When the HUVECs were treated with 0.1 μg/mL netrin-1, they formed many more dendritic and tube-like structures than the cells untreated with netrin-1. However, 5.0 μg/mL netrin-1 significantly inhibited HUVEC tube formation (Figure 2E and F). These results suggest that netrin-1 exhibits a dose-dependent effect on HUVEC proliferation, migration, invasion, and tube formation. Thus, HUVEC proliferation, migration, invasion, and tube formation are promoted at a concentration of 5 μg/mL but inhibited at a concentration of 0.1 μg/mL.
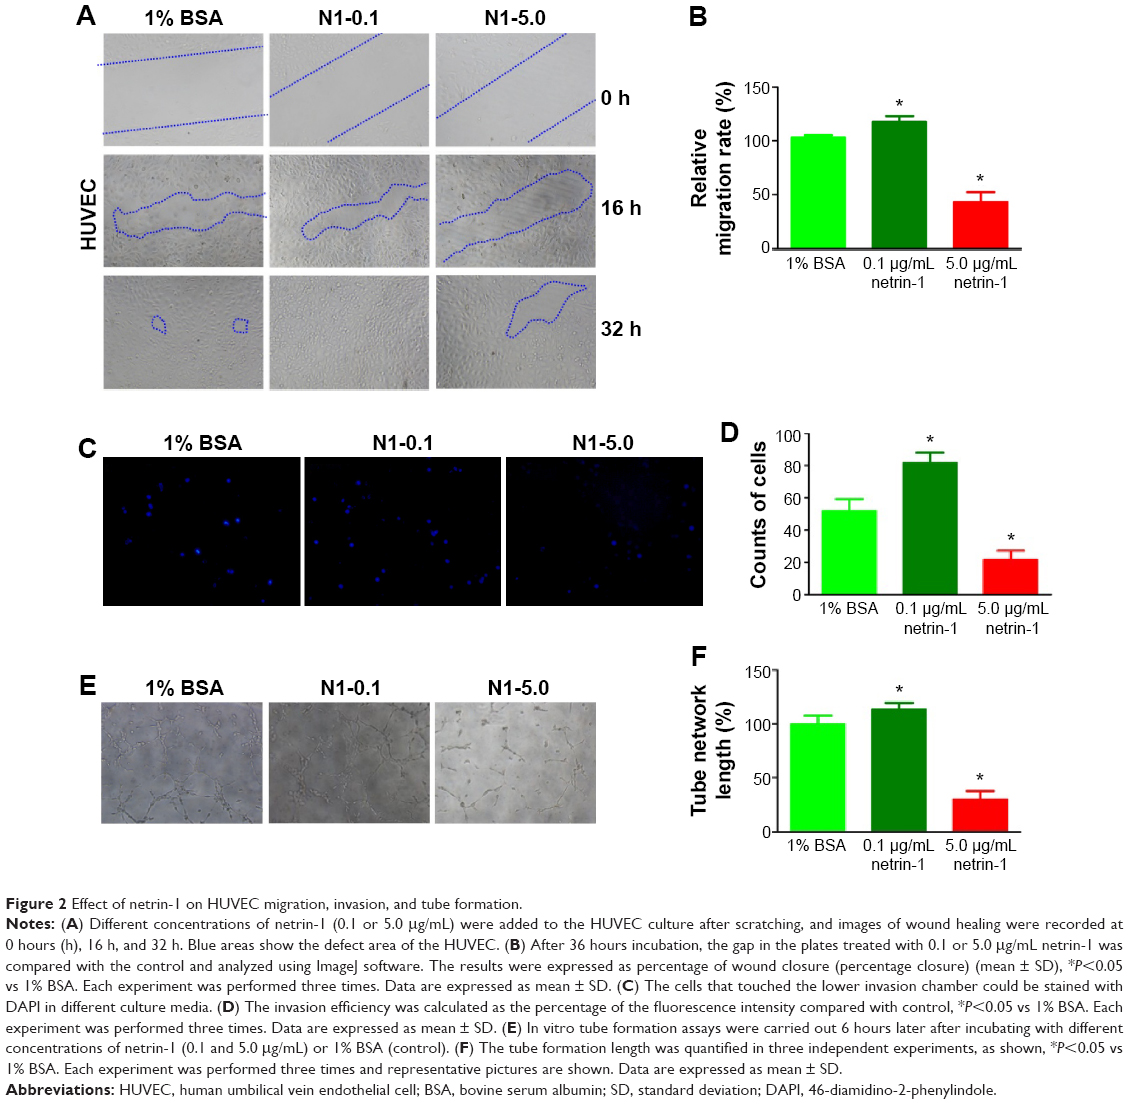 | Figure 2 Effect of netrin-1 on HUVEC migration, invasion, and tube formation. |
The metabolic conditions of Sprague Dawley rats
Blood glucose levels, body weights, and eyeball weights were measured in each group at 1, 2, 4, and 6 weeks after inducing diabetes with STZ (Figure 3A). Significant differences in blood glucose levels, body weights, and eyeball weights were observed between the diabetic rats and CTR rats as early as 1 week after STZ administration (P<0.05). However, no differences in blood glucose levels and body weights were observed among the STZ-induced rats (P>0.05) (Figure 3B and C). Furthermore, no differences in body weights were observed among the STZ-induced diabetic rats (P>0.1), but there was a sharp difference in the eyeball weights of the STZ-induced diabetic rats at 6 weeks after injection of netrin-1 (P<0.05) (Figure 3D). The eyeball weights of the rats injected with 0.1 μg/mL netrin-1 were greater than those of the CTR rats (intravitreal injection PBS) (P<0.05), while the eyeball weights of the rats injected with 5 μg/mL netrin-1 were less than those of the CTR rats (P<0.05).
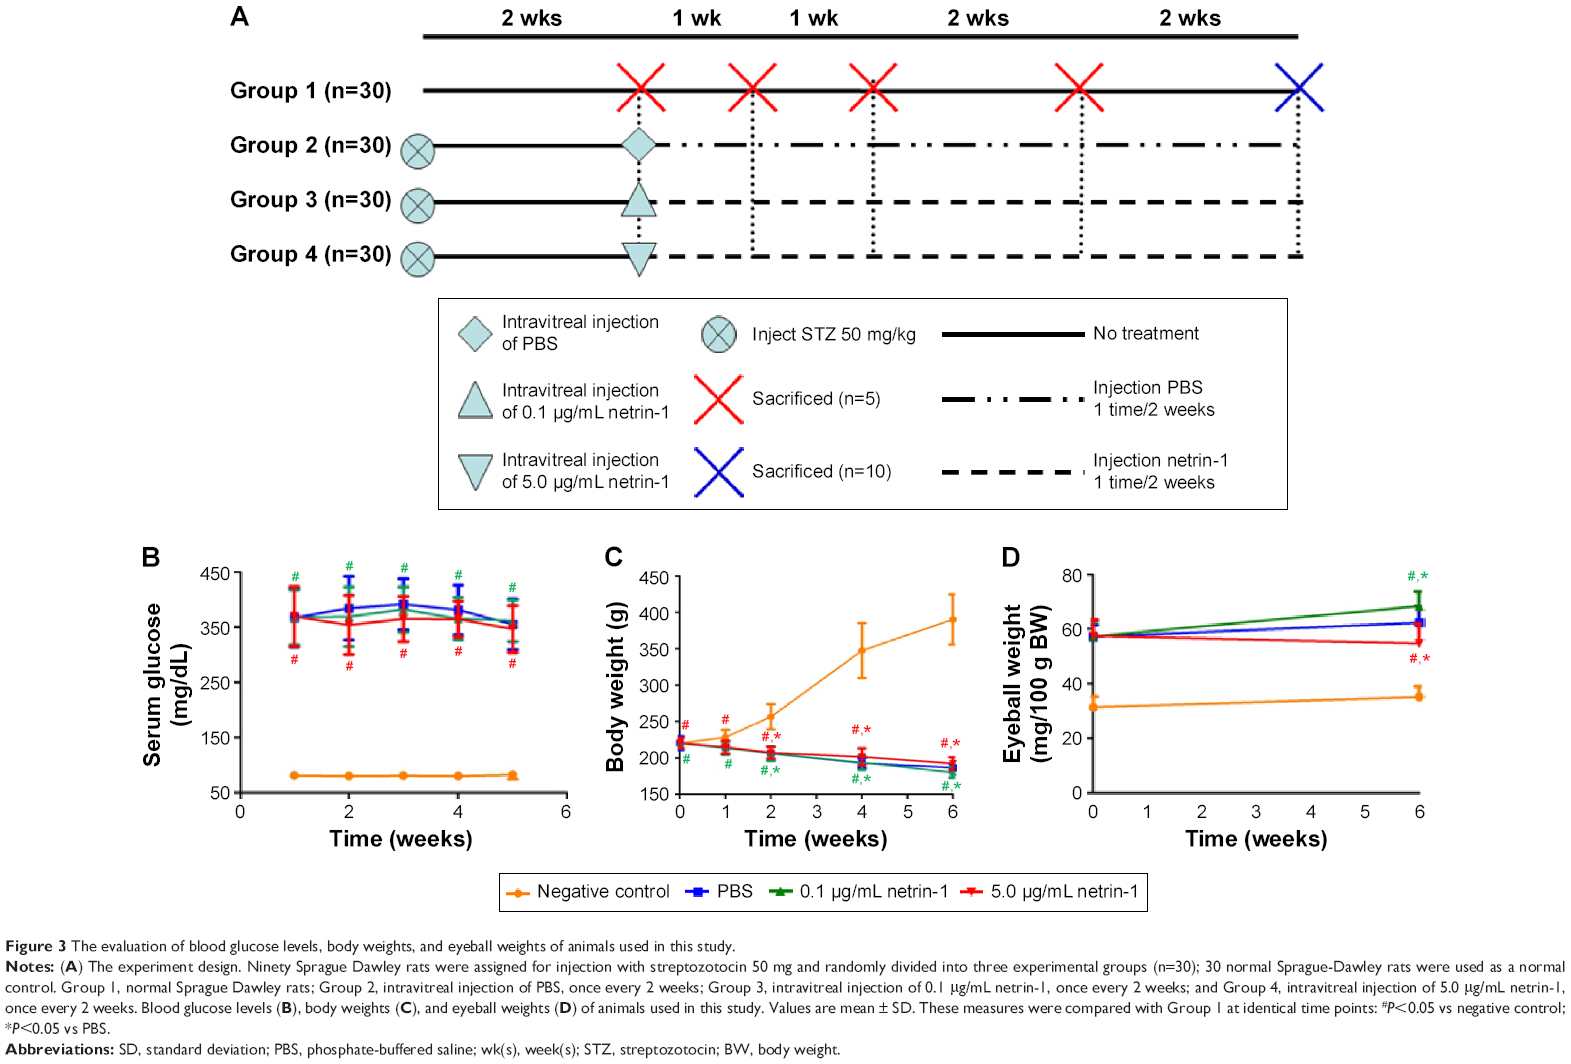 | Figure 3 The evaluation of blood glucose levels, body weights, and eyeball weights of animals used in this study. |
Effect of netrin-1 on the retinal electrophysiological function of STZ-induced diabetic rats
Dark-adapted photic ERGs showed amplitudes of a- or b-waves that were similar among the four groups at baseline (Figure 4A, B, and C). No differences were observed in the amplitude of a- or b-waves in the nondiabetic rats compared with the baseline 6 weeks later (Figure 4B and C). However, the amplitude of a- or b-waves in the PBS-treated diabetic rats decreased compared with the amplitude of the a- or b-waves in the nondiabetic rats (a-wave: PBS =19.50±3.45 μm vs CTR =31.67±4.13 μm [P < 0.05]; b-wave: PBS =50.67±5.13 μm vs CTR =130.17±5.67 μm [P<0.05]). Different concentrations of netrin-1 (0.1 μg/mL and 5 μg/mL) were injected into the diabetic rats. A 0.1 μg/mL netrin-1 injection did not alter the a- or b-waves in the diabetic rats. However, the amplitude of the a- and b-waves in the rats treated with a 5 μg/mL netrin-1 injection was greater than the amplitude of the a- and b-waves in the diabetic rats treated with PBS (a-wave: 0.1 μg/mL netrin-1 =17.67±3.39 μm, P<0.05 vs PBS; 5 μg/mL netrin-1 =28.50±1.31 μm, P<0.05 vs PBS; b-wave: 0.1 μg/mL netrin-1 =44.67±4.80 μm, P<0.05 vs PBS; 5 μg/mL netrin-1 =97.17±9.63 μm, P<0.05 vs PBS). In this study, we confirmed that a 5 μg/mL netrin-1 injection – but not a 0.1 μg/mL injection – could partially recover the reduction in amplitude of the a- and b-waves in STZ-induced diabetic rats.
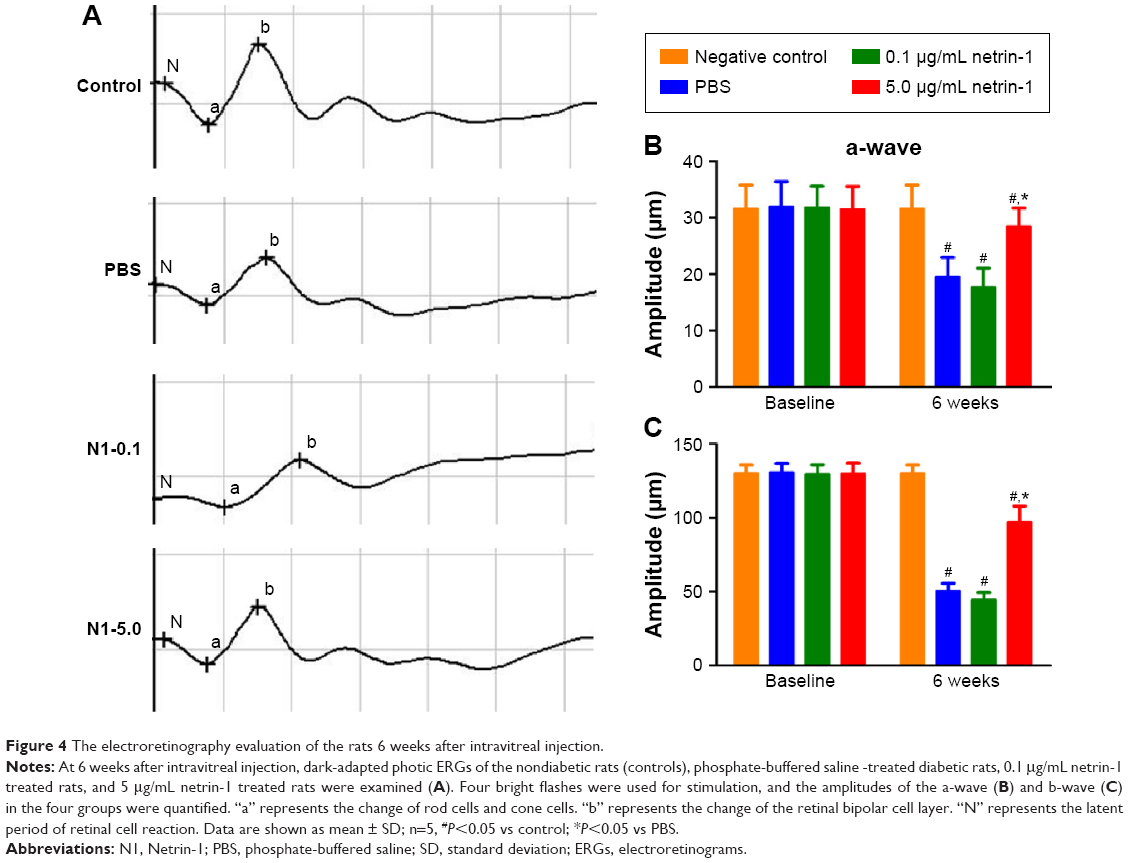 | Figure 4 The electroretinography evaluation of the rats 6 weeks after intravitreal injection. |
Effect of netrin-1 on VEGF-A expression of STZ-induced diabetic rats
We used a rat VEGF-A ELISA kit to detect the concentration of VEGF-A in the retinas of each group at 1, 2, 4, and 6 weeks after injection of STZ. Significant differences in VEGF-A were observed between the diabetic rats and the CTR rats as early as 1 week after administration of STZ (P<0.05). The expressions of VEGF-A in the retinas of rats treated with 0.1 μg/mL netrin-1 and PBS increased with increasing time, while in the 5 μg/mL netrin-1 group the total VEGF-A decreased with increasing time. From the first week after injection, the concentration of VEGF-A in the rats injected with 0.1 μg/mL netrin-1 was higher than that in the CTR rats at every time point (P<0.05). However, compared with the CTRs, the concentration of VEGF-A in the rats treated with 5 μg/mL netrin-1 was lower than that in the PBS rats at every time point from 1 to 6 weeks after treatment. (P<0.05) (Figure 5A). At 6 weeks after injection, the concentration of VEGF-A in the no-treatment rats, PBS-treated rats, 0.1 μg/mL netrin-1 treated rats, and 5 μg/mL netrin-1 treated rats was 9.29±0.80 pg/mL, 19.64±3.77 pg/mL, 21.37±3.64 pg/mL, and 9.85±0.54 pg/mL respectively. There was an overt reduction in VEGF-A concentration in the rats treated with 5 μg/mL netrin-1 (P<0.05), and an obvious increase in the 0.1 μg/mL netrin-1 treated rats compared with the PBS-treated rats (P<0.05). Therefore, netrin-1 can promote the expression of VEGF-A in retinas at a concentration of 0.1 μg/mL, but exhibits the opposite effect at the higher dosage of 5 μg/mL (Figure 5B).
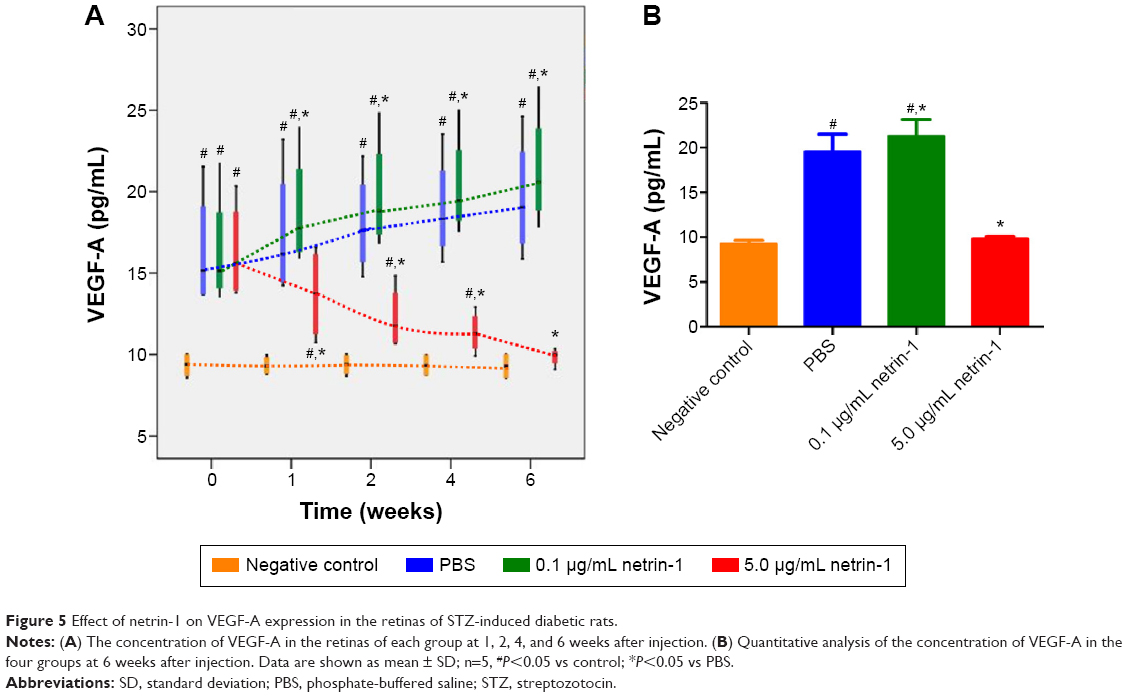 | Figure 5 Effect of netrin-1 on VEGF-A expression in the retinas of STZ-induced diabetic rats. |
Effect of netrin-1 on retinal vascular leakage and iBRB breakdown of STZ-induced diabetic rats
To test the function of netrin-1 on retinal neovascularization, we performed an FFA examination and quantitative analysis of iBRB breakdown. FFA examination was performed to assess the integrity of the retinal blood vessels; in our study, we observed fluorescein sodium in the retinal vessels of the nondiabetic rats (Figure 6A). However, many areas showed fluorescence except for the retinal vessels of the PBS-treated diabetic rats (Figure 6B). Treatment with 0.1 μg/mL netrin-1 led to a larger leakage area compared with the nontreated and PBS-treated diabetic rats (Figure 6C), while there were almost no leakage areas in 5 μg/mL netrin-1 treated diabetic rats (Figure 6D). Furthermore, we quantitated the EB dye leakage to show the retinal leakage in the four groups. Consistent with FFA examination, the iBRB breakdown in the PBS-treated diabetic rats was significantly increased compared with that in the nondiabetic rats (P<0.05). But beyond that, 0.1 μg/mL netrin-1 treatment increased iBRB breakdown in the diabetic rats (P<0.05, Figure 6E), and the retinal leakage attenuated in the rats injected with 5 μg/mL netrin-1 (P<0.05, Figure 6E). After 6 weeks’ injection, the iBRB breakdown (% of CTR) in the PBS-treated rats, 0.1 μg/mL netrin-1 treated rats and 5 μg/mL netrin-1 treated rats was 3.05±0.23(%), 3.53±0.2(%), and 1.46±0.34(%) respectively. In the diabetic rats, 5 μg/mL netrin-1 treatment effectively reduced retinal vessel leakage and protected iBRB function. To the contrary, intravitreal injection of 0.1 μg/mL netrin-1 led to a deterioration in iBRB function.
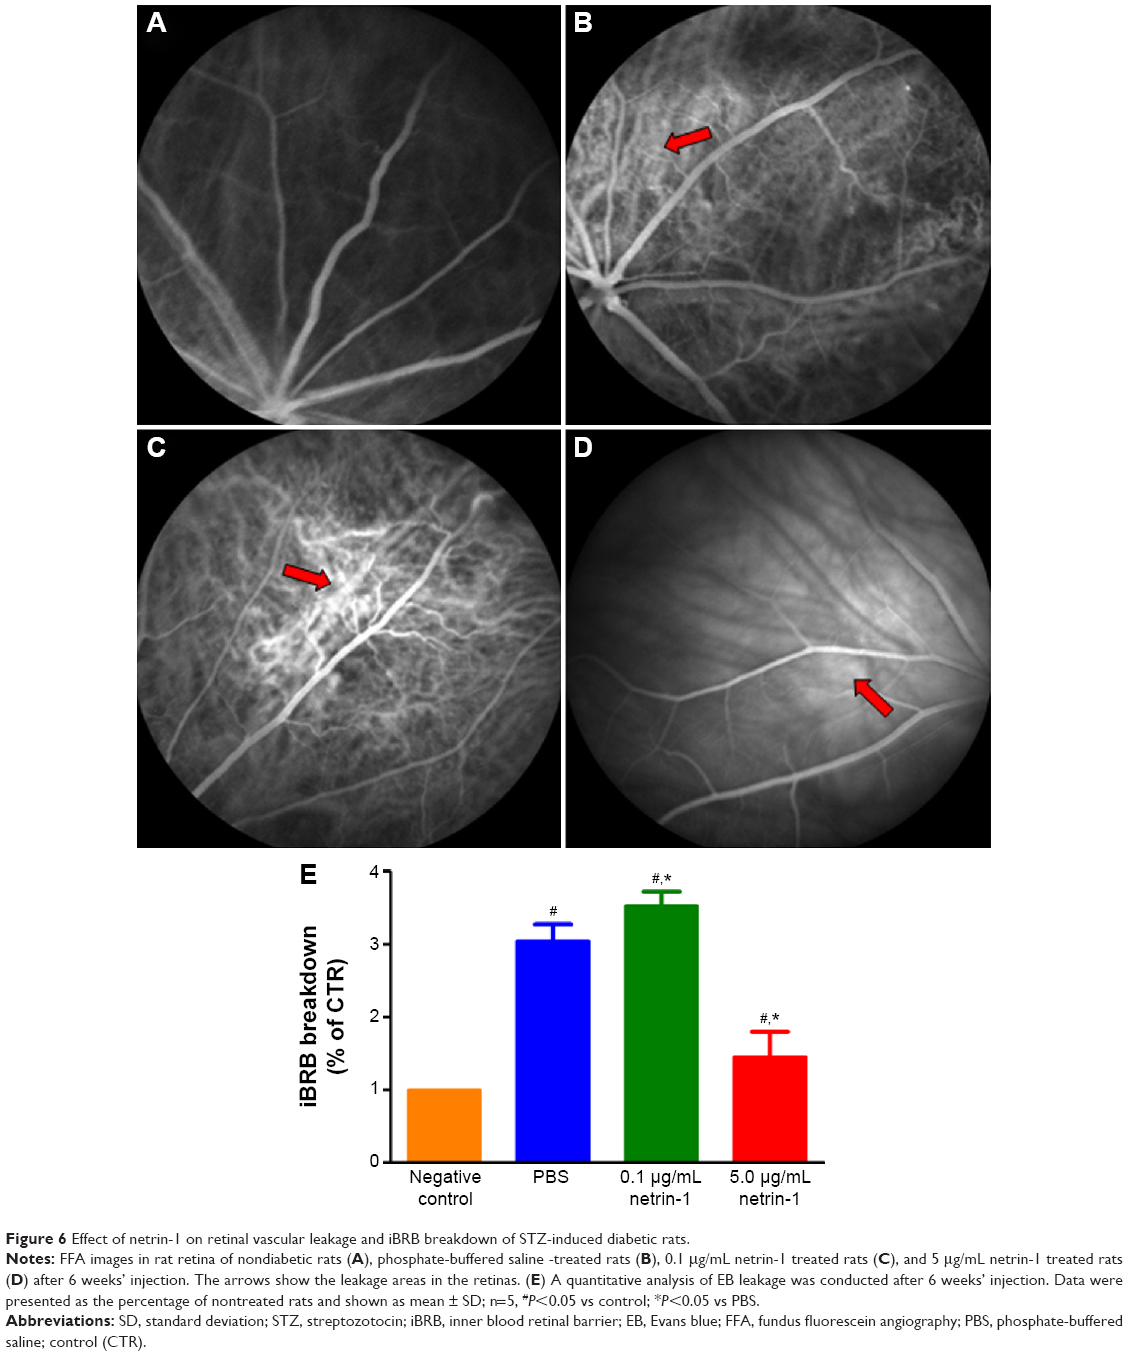 | Figure 6 Effect of netrin-1 on retinal vascular leakage and iBRB breakdown of STZ-induced diabetic rats. |
Effect of netrin-1 on retinal structure and vascular changes in STZ-induced diabetic rats
Morphological changes in retinas at 6 weeks after injection (Figure 7A) were observed, along with the number of new retinal vessels (Figure 7B): retinal ganglion cells (RGCs) (Figure 7C) were counted at 1, 2, 4, and 6 weeks after injection. At 1 week after injection, we found more new vessels and fewer RGCs in the diabetic rats compared with the normal rats (P<0.05). There were also significant differences in retinal morphology between the three groups of diabetic rats. There were more new retinal vessels in rats treated with 0.1 μg/mL netrin-1 than in the PBS-treated group (P<0.05), while 5 μg/mL netrin-1 injection led to fewer retinal new vessels at 1 to 6 weeks after treatment (P<0.05) (Figure 6B). However, the changes in the number of RGCs varied widely between the three diabetic groups (Figure 6C). The number of RGCs in the 5 μg/mL netrin-1 group was more than in the other two diabetic groups, indicating that a higher dosage of netrin-1 is needed to maintain RGC survival. Using the retinal flat-mounts stained with type IV collagen antibody, we found that many vessels were bridged with type IV collagen-positive antibody (Figure 7D) in STZ-induced diabetic rats at 6 weeks after intravitreal injection, compared with nondiabetic rats. The number of type IV+ strands in the retinas of rats treated with 0.1 μg/mL netrin-1 and PBS increased with increasing time, while the number of strands decreased with increasing time in the 5 μg/mL netrin-1 group. Furthermore, the quantitative results clearly demonstrated that we found more type IV+ strands in the rats injected with 0.1 μg/mL netrin-1 than in the CTR rats at 1, 2, 4, and 6 weeks after intravitreal injection (P<0.05) (Figure 7E). In the rats treated with 5 μg/mL netrin-1, we found less type IV+ strands than in the PBS-treated rats from 1 to 6 weeks after treatment (P<0.05). In addition, we also compared the density of type IV collagen of the four groups at 6 weeks after intravitreal injection (Figure 7F). The density of type IV+ strands in the nontreated rats, PBS-treated rats, 0.1 μg/mL netrin-1 treated rats, and 5 μg/mL netrin-1 treated rats was 14.67±2.50 pg/mL, 25.25±4.09 pg/mL, 30.75±3.84 pg/mL, and 23.92±2.97 pg/mL, respectively. Treatment with 5 μg/mL netrin-1 (P<0.05) could reduce the new collagen-IV strands and density of new vessels, but there were obvious increases in 0.1 μg/mL netrin-1 treated rats compared to PBS-treated rats (P<0.05). Therefore, netrin-1 can accelerate retinal neovascularization at a concentration of 0.1 μg/mL, but at the higher dosage of 5 μg/mL the role of netrin-1 is reversed.
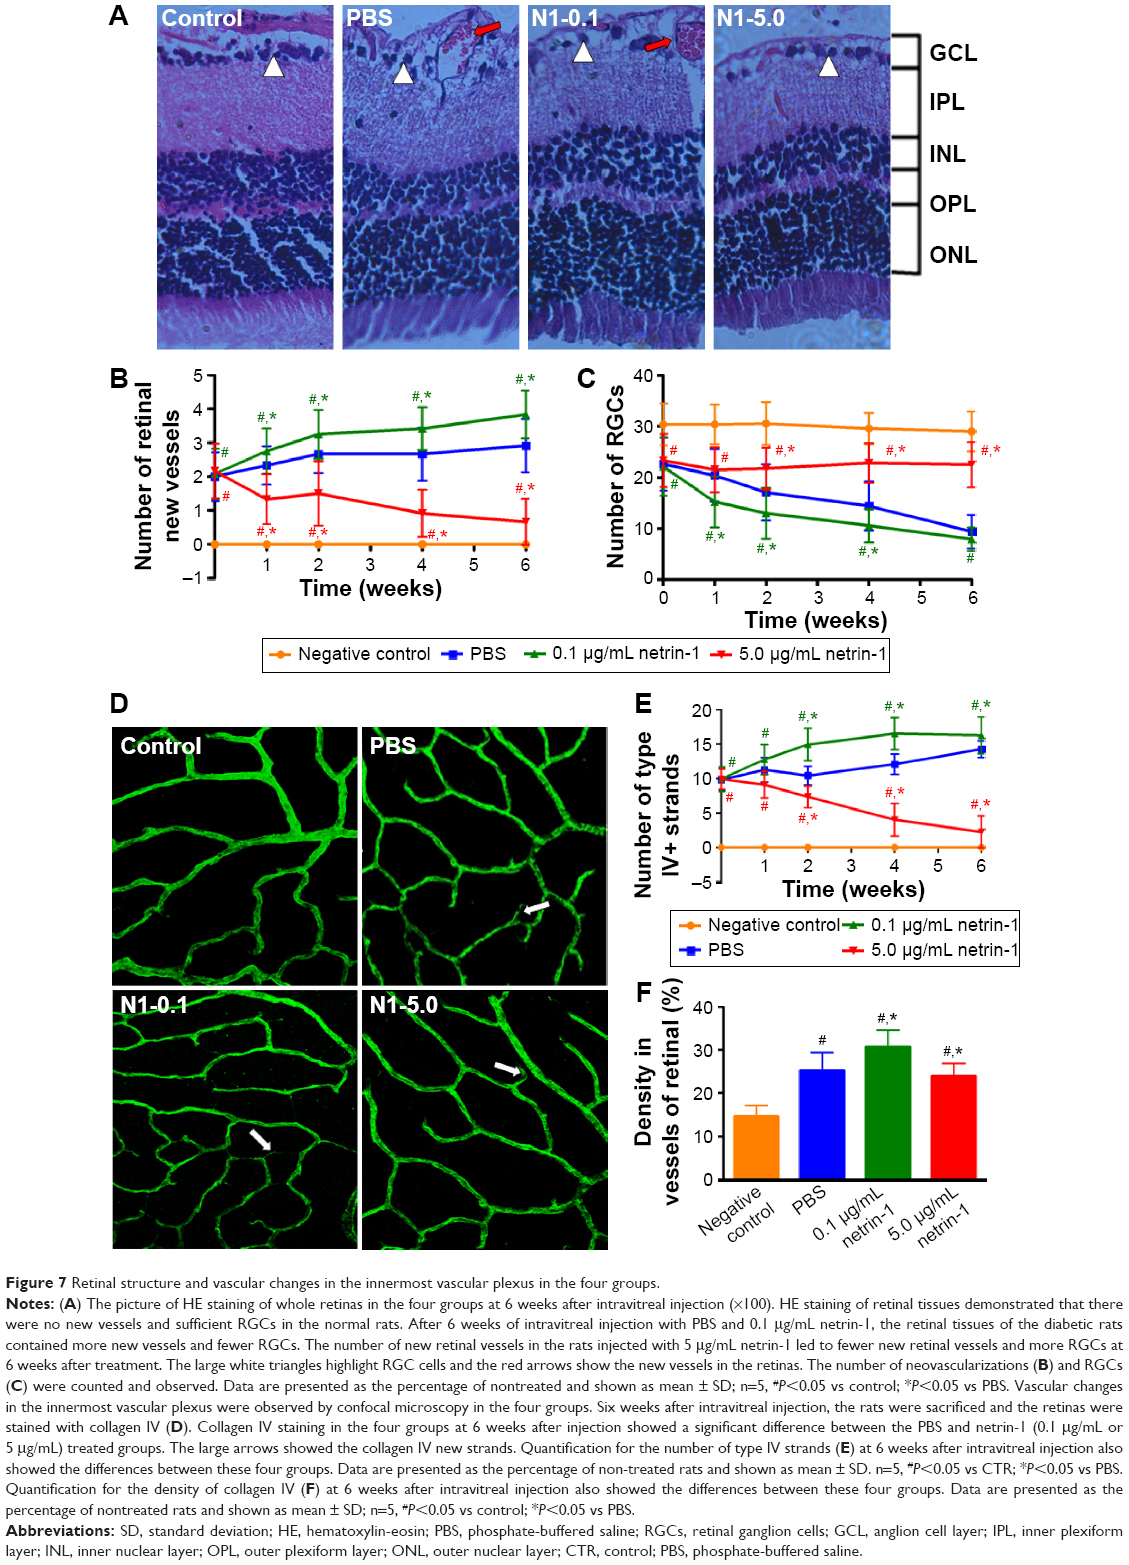 | Figure 7 Retinal structure and vascular changes in the innermost vascular plexus in the four groups. |
Discussion
Netrin-1 plays various important roles in most biological processes including cell guidance, adhesion, differentiation, and angiogenesis.9,11–14 In our previous study, we reported netrin-1 to be an important member of the netrin family, acting as an anti-angiogenic factor by inhibiting alkali-burn-induced cornea neovascularization in rats.15 Here, we investigated the effects of netrin-1 on in vitro and in vivo retinal neovascularization, which we performed in HUVECs and STZ-induced diabetic rats, respectively.
First, we detected how netrin-1 affects HUVECs. We observed that 0.1 μg/mL netrin-1 promoted HUVEC proliferation, migration, invasion, and tube formation, which is consistent with some literature reports that considered that netrin (50 ng/mL) induced cell migration and promoted cell adhesion.11 In addition, higher concentrations of netrin-1 are deemed to inhibit angiogenesis by stimulating the UNC5B signaling pathway,14 yet we found that netrin-1 had precisely the opposite effect at a concentration of 5 μg/mL compared with lower concentrations. Taken together, these findings suggest that netrin-1 acts either as a pro- or an anti-angiogenic factor in vitro, depending on the dosage.
DR is caused by chronic hyperglycemia, and its symptoms include self-regulation disorders of the retinal vessels, abnormalities in blood rheology, and damage to the BRB.22 DR also features selective loss of pericytes, increased permeability of blood vessels, and the formation of new blood vessels.6,7 No uniform standard exists for establishing diabetes models in rats. Based on Qinna and Badwan’s proposal,18 the standards for successful modeling were used in this study. After 2 weeks’ successful induction, 0.1 μg/mL or 5 μg/mL netrin-1 was used in DR rats through intravitreal injection, and the retinas were examined by electroretinography, FFA, HE-staining, and immunostaining.
Electroretinography, as an advent of a new neurophysiological technique to assess retinal and brain (optic tract) function, allows a more detailed study of visual function and of the effects of diabetes mellitus on this function.23–25 According to recent clinical studies,26,27 the dark-adapted DR retina we used shows more functional pathologic changes at the early stage of DR than the light-adapted DR retina. The a-wave of an ERG reflects abnormalities in photoreceptors, while the b-wave reflects amacrine cells, bipolar cells, and mainly Müller cells.28–30 We observed that a 5 μg/mL netrin-1 injection improved the amplitudes of a- and b-waves in the diabetic rats, and that there was no change in 0.1 μg/mL netrin-1 injected rats after 6 weeks’ injection. Although the amplitudes of a- and b-waves in the 5 μg/mL netrin-1 treatment group did not reach the amplitudes recorded for the normal rats, they were greater than those of the diabetic rats treated with PBS. So we believe that 5 μg/mL netrin-1 improves the function of retinal neurons and glial cells and results in ERG abnormalities during the early stage of diabetes. The unchanged amplitudes that we recorded with 0.1 μg/mL netrin-1 treatment may have occurred because we conducted the electroretinography 8 weeks after induction, which was not ideal, and the counted number is not enough. So in any future studies, more rats should be monitored at every time point for serum glaucoma and body weights.
Many animal and clinical studies have been performed where VEGF was revealed to play a key role in the progression of DR. VEGF does not only promote angiogenesis, cause breakdown of the BRB, and stimulate endothelial cell growth and neovascularization, but also increases vascular permeability in the ischemic retina.31–33 At the same time, studies have reported that the degree of fibrosis depends upon the relative amounts of VEGF in proliferative DR eyes.34,35 Many prospective randomized clinical trial data have shown that the use of VEGF inhibitors – such as ranibizumab and bevacizumab (Avastin) – is an effective treatment for retinal vascular diseases.35–37 Despite the success of drugs in the treatment of DR, the exact mechanisms have only been partly resolved. Previous studies have revealed that VEGF-A is the best-studied inducer of ocular angiogenesis and vascular permeability and is crucial for the further development of early DR.38–40 STZ-induced diabetes in rats is a widely used model to study the signs of early DR. However, in this model we found only diffuse vascular leakage and vasoregression, but no signs of nonproliferative DR and proliferative DR, such as diabetic macular edema and neovascularization.5 In our study, the overexpression of VEGF-A in the retinas of diabetic rats was found to be associated with increased retinal vessel leakage. We reported that 5 μg/mL netrin-1 reduced both VEGF-A expression and retinal vessel leakage, while 0.1 μg/mL netrin-1 increased VEGF-A expression and retinal vessel leakage in the retinas of diabetic rats. Therefore, 5 μg/mL netrin-1 can effectively inhibit the expression of VEGF-A and the retinal lesion at a concentration of 5 μg/mL, but at the lower dosage of 0.1 μg/mL the role of netrin-1 is reversed. PKC belongs to a family of ten enzymes. The isoform activation of this enzyme regulates various pathophysiological processes in DR, such as increases in endothelial permeability, retinal hemodynamics, and expression of VEGF in the retina, and activation and adhesion of leukocytes (leukostasis).41,42 The activation of PKC in HUVECs and retinas of STZ-induced rats exposed to concentrations of 5 and 0.1 μg/mL netrin-1 may help us to understand the mechanism of netrin-1. Netrin-1 both inhibits sprouting angiogenesis, through activation of the UNC5B receptor, and induces angiogenesis via a DCC-dependent ERK1/2-eNOS feed-forward mechanism.43 Thus, future studies are needed to explore the mechanism of netrin-1’s dual function in neovascularization by detecting UNC5B receptor expression and any alterations in the ERK1/2-eNOS pathway.
Neurons are involved in phototransduction and convey electrochemical impulses to the brain for sensory functions. Neuronal dysfunction in the retina is also an important effect of diabetes and may precede the change in vascular structure in the retina, through altered metabolism and enhanced apoptosis.44–46 Neural apoptosis is associated with a breakdown of iBRB and retinal vascular cell death; the vascular defects and dysfunctional neurons in DR always show in the same region.47,48 However, the maintenance of iBRB integrity relates to neuron cells and vascular cells in the retina, and RGCs are a key player in this.46,49 All of these findings indicate that intimate interactions exist between neuronal cells, especially retinal glial cells and vascular cells, in the retina in order to maintain the integrity of the iBRB and proper tissue perfusion. Our results confirm that a 0.1 μg/mL netrin-1 treatment may lead to more retinal new vessels and a reduced number of RGCs, and that 5 μg/mL netrin-1 partly maintains the survival of RGCs and a reduction in retinal neovascularization. The mechanism of action of netrin-1 in cell physiological phenomenon is still unknown. Another study is needed to determine the direction effects of netrin-1 at different concentrations in RGC apoptosis. Zhang et al50 proposed that type-IV collagen filaments are related to vessel degeneration in the early stages of diabetes and that vascular degeneration equates to an abnormal structure of “ghost” blood vessels without blood flow. Moreover, the presence of type-IV collagen during vessel degeneration represents the remainder of the vascular basement membrane.51 This indicates that blood vessel degeneration causes diabetes-induced endothelial cell and vascular basement membrane degeneration. Recently, many studies have shown that a vessel degeneration-mediated increase in type-IV collagen filaments may be related to an abnormal NMDA-signaling pathway.52 We assume that netrin-1 regulates retinal ischemia to control the development of DR by managing the expression of type-IV collagen.
In summary, this study revealed the dual effects of exogenous netrin-1 on in vitro and in vivo retinal neovascularization, which were demonstrated in HUVECs and STZ-induced diabetic rats, respectively. Retinal neovascularization is a complex process regulated by many growth factors and signaling pathways. In future studies, we hope to establish alternative mechanisms of action for netrin-1 and the multifunctional features of netrin-1 in other ocular neovascular diseases.
Acknowledgments
This study was supported by the National Natural Science Foundation of China (81160118, 81300729, and 81400372); Clinical Medicine Research Special-purpose Foundation of China (L2012052); Jiangxi Province Voyage Project (2014022); Jiangxi province Degree and Postgraduate Education Reform Project (2015); the Shanghai Foundation of Xiamen University (No.2013SH008); Science and Technology Platform Construction Project of Jiangxi Province (2013116); Youth Science Foundation of Jiangxi Province (20151BAB215016) Technology and Science Foundation of Jiangxi Province (20151BBG70223) and Fujian Province (2015J05170); Jiangxi Province Education Department Scientific Research Foundation (GJJ14170); Health Development Planning Commission Science Foundation of Jiangxi Province (20155154); Scholor Project of Ganjiang River (2015).
Disclosure
This was not an industry supported study. The authors report no conflicts of interest in this work.
References
Kim I, Rodriguez-Enriquez S, Lemasters JJ. Selective degradation of mitochondria by mitophagy. Arch Biochem Biophys. 2007;462(2):245–253. | ||
Terman A, Gustafsson B, Brunk UT. The lysosomal-mitochondrial axis theory of postmitotic aging and cell death. Chem Biol Interact. 2006;163(1–2):29–37. | ||
Twig G, Elorza A, Molina AJ, et al. Fission and selective fusion govern mitochondrial segregation and elimination by autophagy. EMBO J. 2008;27(2):433–446. | ||
Das A, McGuire PG, Rangasamy S. Diabetic Macular Edema: Pathophysiology and Novel Therapeutic Targets. Ophthalmology. 2015;122(7):1375–1394. | ||
Klaassen I, Van Noorden CJ, Schlingemann RO. Molecular basis of the inner blood-retinal barrier and its breakdown in diabetic macular edema and other pathological conditions. Prog Retin Eye Res. 2013;34:19–48. | ||
Shah CA. Diabetic retinopathy: a comprehensive review. Indian J Med Sci. 2008;62(12):500–519. | ||
Bhagat N, Grigorian RA, Tutela A, Zarbin MA. Diabetic macular edema: pathogenesis and treatment. Surv Ophthalmol. 2009;54(1):1–32. | ||
Boscia F. Current approaches to the management of diabetic retinopathy and diabetic macular oedema. Drugs. 2010;70(16):2171–2200. | ||
Kennedy TE, Serafini T, de la Torre JR, Tessier-Lavigne M. Netrins are diffusible chemotropic factors for commissural axons in the embryonic spinal cord. Cell. 1994;78(3):425–435. | ||
Bradford D, Cole SJ, Cooper HM. Netrin-1: diversity in development. Int J Biochem Cell Biol. 2009;41(3):487–493. | ||
Park KW, Crouse D, Lee M, et al. The axonal attractant Netrin-1 is an angiogenic factor. Proc Natl Acad Sci U S A. 2004;101(46):16210–16215. | ||
Xu H, Liu J, Xiong S, Le YZ, Xia X. Suppression of retinal neovascularization by lentivirus-mediated netrin-1 small hairpin RNA. Ophthalmic Res. 2012;47(3):163–169. | ||
Lv J, Sun X, Ma J, et al. Netrin-1 induces the migration of Schwann cells via p38 MAPK and PI3K-Akt signaling pathway mediated by the UNC5B receptor. Biochem Biophys Res Commun. 2015;464(1):263–268. | ||
Lu X, Le Noble F, Yuan L, et al. The netrin receptor UNC5B mediates guidance events controlling morphogenesis of the vascular system. Nature. 2004;432(7014):179–186. | ||
Han Y, Shao Y, Lin Z, et al. Netrin-1 simultaneously suppresses corneal inflammation and neovascularization. Invest Ophthalmol Vis Sci. 2012;53(3):1285–1295. | ||
Han Y, Shao Y, Liu T, Qu YL, Li W, Liu Z. Therapeutic effects of topical netrin-4 inhibits corneal neovascularization in alkali-burn rats. PloS One. 2015;10(4):e0122951. | ||
Liu Q, Li J, Cheng R, et al. Nitrosative stress plays an important role in Wnt pathway activation in diabetic retinopathy. Antioxid Redox Signal. 2013;18(10):1141–1153. | ||
Qinna NA, Badwan AA. Impact of streptozotocin on altering normal glucose homeostasis during insulin testing in diabetic rats compared to normoglycemic rats. Drug Des Devel Ther. 2015;9:2515–2525. | ||
Xu H, Zhang L, Gu L, et al. Subretinal delivery of AAV2-mediated human erythropoietin gene is protective and safe in experimental diabetic retinopathy. Invest Ophthalmol Vis Sci. 2014;55(3):1519–1530. | ||
Huang J, Li X, Li M, et al. Effects of intravitreal injection of KH902, a vascular endothelial growth factor receptor decoy, on the retinas of streptozotocin-induced diabetic rats. Diabetes Obes Metab. 2012;14(7):644–653. | ||
Mitsuhashi J, Morikawa S, Shimizu K, Ezaki T, Yasuda Y, Hori S. Intravitreal injection of erythropoietin protects against retinal vascular regression at the early stage of diabetic retinopathy in streptozotocin-induced diabetic rats. Exp Eye Res. 2013;106:64–73. | ||
Wisniewska-Kruk J, Klaassen I, Vogels IM, et al. Molecular analysis of blood-retinal barrier loss in the Akimba mouse, a model of advanced diabetic retinopathy. Exp Eye Res. 2014;122:123–131. | ||
Tzekov R. Full-field ERG in diabetic retinopathy: a screening tool? Graefes Arch Clin Exp Ophthalmol. 2015;253(7):987–988. | ||
Tzekov R, Arden GB. The electroretinogram in diabetic retinopathy. Surv Ophthalmol. 1999;44(1):53–60. | ||
Jansson RW, Raeder MB, Krohn J. Photopic full-field electroretinography and optical coherence tomography in type 1 diabetic retinopathy. Graefes Arch Clin Exp Ophthalmol. 2015;253(7):989–997. | ||
Arden GB, Sivaprasad S. The pathogenesis of early retinal changes of diabetic retinopathy. Doc Ophthalmol. 2012;124(1):15–26. | ||
Heckenlively JR. New concept: treating nonproliferative diabetic retinopathy with light adaptation of rods during sleep. Eye (Lond). 2011;25(12):1533–1534. | ||
Yamamoto S, Kamiyama M, Nitta K, Yamada T, Hayasaka S. Selective reduction of the S cone electroretinogram in diabetes. Br J Ophthalmol. 1996;80(11):973–975. | ||
Li Q, Zemel E, Miller B, Perlman I. Early retinal damage in experimental diabetes: electroretinographical and morphological observations. Exp Eye Res. 2002;74(5):615–625. | ||
Kusari J, Zhou S, Padillo E, Clarke KG, Gil DW. Effect of memantine on neuroretinal function and retinal vascular changes of streptozotocin-induced diabetic rats. Invest Ophthalmol Vis Sci. 2007;48(11):5152–5159. | ||
Ishida S, Usui T, Yamashiro K, et al. VEGF164 is proinflammatory in the diabetic retina. Invest Ophthalmol Vis Sci. 2003;44(5):2155–2162. | ||
Simo R, Hernandez C. Intravitreous anti-VEGF for diabetic retinopathy: hopes and fears for a new therapeutic strategy. Diabetologia. 2008;51(9):1574–1580. | ||
Zhang XL, Wen L, Chen YJ, Zhu Y. Vascular endothelial growth factor up-regulates the expression of intracellular adhesion molecule-1 in retinal endothelial cells via reactive oxygen species, but not nitric oxide. Chin Med J (Engl). 2009;122(3):338–343. | ||
Van Geest RJ, Lesnik-Oberstein SY, Tan HS, et al. A shift in the balance of vascular endothelial growth factor and connective tissue growth factor by bevacizumab causes the angiofibrotic switch in proliferative diabetic retinopathy. Br J Ophthalmol. 2012;96(4):587–590. | ||
Stewart MW, Stewart ML. Progression to macula-off tractional retinal detachment after a contralateral intraoperative intravitreal bevacizumab injection for proliferative diabetic retinopathy. Clin Ophthalmol. 2015;9:409–411. | ||
Comer GM, Ciulla TA. Pharmacotherapy for diabetic retinopathy. Curr Opin Ophthalmol. 2004;15(6):508–518. | ||
Ma C, Bai L, Lei C, et al. Predictors of visual and anatomical outcomes for neovascular age-related macular degeneration treated with bevacizumab. Biomed Rep. 2015;3(4):503–508. | ||
Witmer AN, Vrensen GF, Van Noorden CJ, Schlingemann RO. Vascular endothelial growth factors and angiogenesis in eye disease. Prog Retin Eye Res. 2003;22(1):1–29. | ||
Cui JZ, Chiu A, Maberley D, Ma P, Samad A, Matsubara JA. Stage specificity of novel growth factor expression during development of proliferative vitreoretinopathy. Eye (Lond). 2007;21(2):200–208. | ||
Siemerink MJ, Augustin AJ, Schlingemann RO. Mechanisms of ocular angiogenesis and its molecular mediators. Dev Ophthalmol. 2010;46:4–20. | ||
Koya D, King GL. Protein kinase C activation and the development of diabetic complications. Diabetes. 1998;47(6):859–866. | ||
Aiello LP, Clermont A, Arora V, Davis MD, Sheetz MJ, Bursell SE. Inhibition of PKC beta by oral administration of ruboxistaurin is well tolerated and ameliorates diabetes-induced retinal hemodynamic abnormalities in patients. Invest Ophthalmol Vis Sci. 2006;47(1):86–92. | ||
Nguyen A, Cai H. Netrin-1 induces angiogenesis via a DCC-dependent ERK1/2-eNOS feed-forward mechanism. Proc Natl Acad Sci U S A. 2006;103(17):6530–6535. | ||
Barber AJ, Gardner TW, Abcouwer SF. The significance of vascular and neural apoptosis to the pathology of diabetic retinopathy. Invest Ophthalmol Vis Sci. 2011;52(2):1156–1163. | ||
Han Y, Bearse MA Jr, Schneck ME, Barez S, Jacobsen CH, Adams AJ. Multifocal electroretinogram delays predict sites of subsequent diabetic retinopathy. Invest Ophthalmol Vis Sci. 2004;45(3):948–954. | ||
Antonetti DA, Barber AJ, Bronson SK, et al. Diabetic retinopathy: seeing beyond glucose-induced microvascular disease. Diabetes. 2006;55(9):2401–2411. | ||
Kowluru RA, Engerman RL, Case GL, Kern TS. Retinal glutamate in diabetes and effect of antioxidants. Neurochem Int. 2001;38(5):385–390. | ||
Ng JS, Bearse MA Jr, Schneck ME, Barez S, Adams AJ. Local diabetic retinopathy prediction by multifocal ERG delays over 3 years. Invest Ophthalmol Vis Sci. 2008;49(4):1622–1628. | ||
Gardner TW, Antonetti DA, Barber AJ, LaNoue KF, Levison SW. Diabetic retinopathy: more than meets the eye. Surv Ophthalmol. 2002;47 Suppl 2:S253–S262. | ||
Zhang J, Wu Y, Jin Y, et al. Intravitreal injection of erythropoietin protects both retinal vascular and neuronal cells in early diabetes. Invest Ophthalmol Vis Sci. 2008;49(2):732–742. | ||
Inai T, Mancuso M, Hashizume H, et al. Inhibition of vascular endothelial growth factor (VEGF) signaling in cancer causes loss of endothelial fenestrations, regression of tumor vessels, and appearance of basement membrane ghosts. Am J Pathol. 2004;165(1):35–52. | ||
Ueda K, Nakahara T, Hoshino M, Mori A, Sakamoto K, Ishii K. Retinal blood vessels are damaged in a rat model of NMDA-induced retinal degeneration. Neurosci Lett. 201012;485(1):55–59. |
 © 2015 The Author(s). This work is published and licensed by Dove Medical Press Limited. The full terms of this license are available at https://www.dovepress.com/terms.php and incorporate the Creative Commons Attribution - Non Commercial (unported, v3.0) License.
By accessing the work you hereby accept the Terms. Non-commercial uses of the work are permitted without any further permission from Dove Medical Press Limited, provided the work is properly attributed. For permission for commercial use of this work, please see paragraphs 4.2 and 5 of our Terms.
© 2015 The Author(s). This work is published and licensed by Dove Medical Press Limited. The full terms of this license are available at https://www.dovepress.com/terms.php and incorporate the Creative Commons Attribution - Non Commercial (unported, v3.0) License.
By accessing the work you hereby accept the Terms. Non-commercial uses of the work are permitted without any further permission from Dove Medical Press Limited, provided the work is properly attributed. For permission for commercial use of this work, please see paragraphs 4.2 and 5 of our Terms.