")
Back to Journals » Drug Design, Development and Therapy » Volume 12
Effect of green tea catechins on the pharmacokinetics of digoxin in humans
Authors Kim TE, Shin KH, Park JE, Kim MG , Yun YM , Choi DH, Kwon KJ, Lee J
Received 5 March 2018
Accepted for publication 20 April 2018
Published 10 July 2018 Volume 2018:12 Pages 2139—2147
DOI https://doi.org/10.2147/DDDT.S148257
Checked for plagiarism Yes
Review by Single anonymous peer review
Peer reviewer comments 2
Editor who approved publication: Dr Sukesh Voruganti
Tae-Eun Kim,1 Kwang-Hee Shin,2 Jeong-Eun Park,2 Min-Gul Kim,3 Yeo-Min Yun,4 Dong-Hee Choi,5 Kyoung Ja Kwon,5 Jongmin Lee6
1Department of Clinical Pharmacology, Konkuk University Medical Center, Seoul, Republic of Korea; 2Department of Pharmacotherapy & Translational Research, College of Pharmacy, Research Institute of Pharmaceutical Sciences, Kyungpook National University, Daegu, Republic of Korea; 3Department of Pharmacology, Chonbuk National University Medical School, Jeonju, Jeonbuk, Republic of Korea; 4Department of Laboratory Medicine, Konkuk University Medical Center, Konkuk University School of Medicine, Seoul, Republic of Korea; 5Department of Medical Science, Konkuk University School of Medicine, Seoul, Republic of Korea; 6Department of Rehabilitation Medicine, Konkuk University School of Medicine, Seoul, Republic of Korea
Background: Previous in vitro studies have reported the inhibitory effect of green tea on p-glycoprotein (p-gp) encoded by ABCB1. This study aimed to investigate the effect of green tea on the pharmacokinetics of digoxin, a typical probe drug of p-gp.
Methods: Sixteen healthy volunteers participated in this study. At Day 1, 0.5 mg of digoxin was administered via oral route. After a 14-day washout period, 630 mg of green tea catechins (GTC) was administered via oral route, followed by 0.5 mg of digoxin 1 hour later. From Day 16 through Day 28, 630 mg of GTC was administered alone. At Day 29, 630 mg of GTC and 0.5 mg of digoxin were administered in the same way as Day 15. Blood samples for the pharmacokinetic assessments of digoxin were collected up to 8 hours after each dose. Pharmacokinetic parameters were estimated by noncompartmental analysis. Area under the curve (AUC) and peak plasma concentration (Cmax) were compared using mixed effect model between digoxin alone and digoxin with GTC. ABCB1 was genotyped to determine whether its polymorphism affects digoxin–GTC interaction.
Results: Fifteen subjects completed the study. Compared to digoxin alone, the concomitant administration of digoxin and GTC significantly reduced the systemic exposure of digoxin: geometric mean ratios (GMR) and 90% confidence intervals (CI) of area under the concentration–time curve from time 0 to the last measurable time (AUClast) and Cmax were 0.69 (0.62–0.75) and 0.72 (0.61–0.85), respectively. The concomitant administration of digoxin and GTC following pretreatment of GTC (Day 29) similarly reduced the AUClast (GMR [90% CI]: 0.67 [0.61–0.74]) and Cmax (GMR [90% CI]: 0.74 [0.63–0.87]). In the comparison of the percentage changes from Day 1 (digoxin single administration) of AUClast between genotypes, C1236T variant type showed a significant difference to wild-type on Day 15 (concomitant administration of digoxin and GTC) (P=0.005).
Conclusion: This study demonstrates that the coadministration of GTC reduces the systemic exposure of digoxin regardless of pretreatment of GTC.
Keywords: digoxin, green tea, catechin, p-glycoprotein, pharmacokinetics, drug interaction
Introduction
Green tea is one of the most popular beverages in Asia. Green tea is made up of catechins, which account for 30%–42% of the dried green tea leaves.1 Catechins in green tea include (+)-catechin (C), (−)-epicatechin (EC), (−)-epigallocatechin (EGC), (−)-epicatechin gallate (ECG), and (−)-epigallocatechin gallate (EGCG), of which EGCG is the most abundant one accounting for about half of the total catechin amount.2
Recently, green tea and its products have attracted significant attention worldwide, as they have been associated with various health benefits such as weight loss and prevention of cardiovascular disease or cancer.3–5 As green tea consumption increases, chances of significant interaction between drugs and green tea ingredients also may increase. Importantly, the concurrent use of a drug and green tea can alter the concentration of the drug, as the green tea catechins (GTC) can potentially interact with drug-metabolizing enzymes or transporters. Although no significant changes in cytochrome P450 by green tea or GTC have been observed, multiple studies have reported alterations in transporter activity by green tea or GTC.6 Roth et al7 reported an in vitro study that GTC inhibited the uptake transporters organic anion transporting polypeptide (OATP)1A2, OATP1B1, and OATP2B1. Knop et al8 also demonstrated the inhibition of various transporters by EGCG via an in vitro study. Misaka et al9 reported in a clinical study that green tea ingestion greatly reduces the systemic exposure of nadolol by inhibiting OATP1A2-mediated uptake.
In contrast to the OATP transporters that exhibit significant interactions with GTC, p-glycoprotein (p-gp) has not been reported to interact with GTC in a study involving human subjects. P-gp is the well-characterized efflux transporter which is located in various organs such as the intestine, kidney, and liver to efflux drugs out of cells.10,11 We used digoxin to evaluate the effect of GTC on P-gp in vivo. Digoxin is used in patients with atrial fibrillation or congestive heart failure.12,13 It is one of the substrates of p-gp, and therefore its absorption and excretion are affected by p-gp. The US Food and Drug Administration recommended digoxin as one of the most suitable substrates for p-gp studies.14
To investigate the effect of green tea on the pharmacokinetics of digoxin, we conducted an open-label, 3-treatment, 3-period, fixed-sequence study. Digoxin was given on Day 1, followed by a 14-day washout period, and given with GTC on Day 15; then, GTC was given for 13 days from Day 16 through 28, as a pretreatment; and digoxin and GTC were given concomitantly on Day 29. For each treatment, plasma concentrations of digoxin were measured to compare its systemic exposure between treatments. Genotyping of ABCB1 gene encoding p-gp was also performed to identify the effect of genotype in the inhibition of p-gp by GTC.
Materials and methods
Study population
This study was conducted in healthy Korean volunteers, aged 19–55 years who agreed to refrain from any food containing green tea during whole study duration. Volunteers were screened by a physical examination, a 12-lead electrocardiogram, and clinical laboratory tests, and those who showed any abnormal findings could not participate in this study. The volunteers who had any significant past medical history or allergy to green tea constituents were excluded. Also, volunteers who had taken any agent that was reported to inhibit or induce transporter p-gp in the prior 2 weeks were excluded from this study.
Study design
To investigate the effect of GTC on the pharmacokinetics of digoxin, an open-label, 3-treatment, fixed-sequence study was conducted (Figure 1) in Konkuk University Medical Center. The Institutional Review Boards of Konkuk University Medical Center (IRB No KUH1280094) approved the study protocol, and written informed consent was obtained from all subjects before study enrollment. All procedures were performed in accordance with the recommendations of the Declaration of Helsinki and Good Clinical Practices.
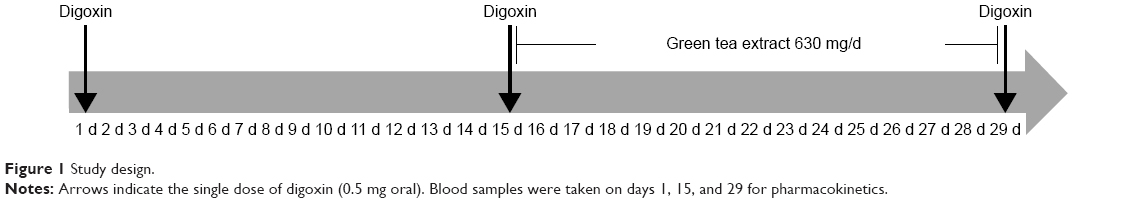 | Figure 1 Study design. |
At Day 1, all the subjects were orally administered a 0.5 mg digoxin tablet. After a 14-day washout period, they were administered 630 mg of green tea extract followed by 0.5 mg digoxin 1 hour later. From Day 16 through 28, subjects only received 630 mg of GTC. At Day 29, the subjects were administered a 630 mg capsule of green tea extract followed by 0.5 mg digoxin 1 hour later, just like Day 15. Green tea extract was administered as a commercially available capsule Ggreen Tea catechin™ (Atlantic Essential Products, Inc., Hauppauge, NY, USA) containing 300 mg catechins. From the screening to the completion of the study, foods containing green tea constituents or grapefruit juice were not allowed. Concomitant medications were allowed only if it was not reported to induce or inhibit p-gp.
Pharmacokinetic analysis
For the analysis of digoxin pharmacokinetics, blood samples (8 mL) were taken predose and 1, 1.5, 2, 4, 6, and 8 hours after the administration of digoxin. Plasma was obtained by centrifugation at 3,000 rpm for 10 minutes and transferred into 3 polypropylene tubes. Plasma samples obtained after receiving digoxin were additionally transferred into 2 polypropylene tubes containing ascorbate-EDTA solution (20% ascorbic acid and 0.1% EDTA in 0.4 M NaH2PO4 buffer, pH 3.6) for the analysis of catechins. Plasma samples were stored at −80°C until analysis.
The peak plasma concentration (Cmax) and time to Cmax (ie, Tmax) were directly obtained from the observed values. The area under the concentration–time curve (AUC) from time 0 to the last measurable time (AUClast) was calculated using the trapezoidal rule. The elimination rate constant (λz) and AUCinf were not determined due to the limitation of sampling time. Noncompartmental analyses were performed using Phoenix WinNonlin® (Certara, Princeton, NJ, USA).
Bioanalysis of digoxin and catechins
Plasma concentrations of digoxin were determined using a Cobas Integra 800 automated analyzer (Roche Diagnostics, Rotkreuz, Switzerland). The limit of detection was 0.3 ng/mL, and the measuring range was 0.3–5.0 ng/mL, defined by linearity. For this assay, intermediate precision was 3.9%–9.7% and cross-reactivities with structurally related or potentially coadministered compounds (canrenone, dehydroisoandrosterone, digitoxose, estradiol, estriol, hydrocortisone, 11-hydroxyprogesterone, 17-hydroxyprogesterone, prednisolone, prednisone, progesterone, and spironolactone) were under 0.03%.
EGCG, ECG, EGC, and EC were analyzed from plasma using liquid–liquid extraction method15 and their concentrations were calculated with a liquid chromatography-tandem mass spectrometry (LC-MS/MS). Briefly, 1 mL of ethyl acetate was added to 100 μL plasma and ascorbic acid-EDTA solution 10:1 (v/v) mixture with 10 μL ethyl gallate (1 μg/mL) as internal standard and vortexed for 15 minutes and centrifuged at 4,500 rpm for 20 minutes. After initial collection of 850 μL of the supernatant, the remaining precipitate was repeatedly processed under the same conditions for further extraction, and 600 μL of the supernatant was additionally obtained. The final 1,450 μL was concentrated at 35°C for 60 minutes. After evaporation, the pellet was reconstituted with 100 μL of 15% acetonitrile containing 0.3% acetic acid and centrifuged at 13,000 rpm for 10 minutes, and 5 μL of the supernatant was injected into LC-MS/MS. Analysis was carried out through UPLC (ACQUITY™ Binary UPLC system, Waters, Milford, MA, USA) coupled XEVO TQ-MS (Waters). The samples were eluted in a gradient mobile phase consisting of water containing 0.3% acetic acid (A) and acetonitrile containing 0.3% acetic acid (B) with conditions as follow; A 98%–70% (0–4 minutes), 70% (4–7 minutes), 70%–2% (7–7.1 minutes), 2% (7.1–8 minutes), 2%–98% (8–8.1 minutes), 98% (8.5–10 minutes). The monitored M/Z values of the parent and product ions under the positive electrospray mode of ECG, EGC, EC, and internal standard (IS) injected into MS through the Atlantis T3 (4.6×50 mm ×3 μm) C18 (Waters) column were 443.10 → 123.00, 307.20 → 151.00, 291.20 → 139.00, and 199.00 → 127.03, respectively. The confirmation ion from negative mode of EGCG was detected 457.20 → 168.98. Instrumental settings of the ionization were as follows: capillary voltage 2 kV; capillary source temperature at 150°C; desolvation gas temperature at 625°C; cone voltages 25 V for EGCG and ECG, 20 V for EGC and EC, 18 V for ethyl gallate; collision energy 25 V for EGCG, 15 V for ECG and EGC, 12 V for ethyl gallate. Using this LC-MS/MS method, a calibration curve range was generated by 0.1–50 ng/mL for EC and 1–500 ng/mL for EGCG, ECG, and EGC. Lower limit of quantification was determined as the lowest concentration of the calibration curve. The inter- and intrabatch accuracies and precisions of 4 GTCs were 88.85%–110.71% and 0.53%–11.58%, respectively.
Genotyping
DNA was isolated from the 200 μL of whole blood samples using a QIAamp DNA Blood Mini Kit (Qiagen, Germantown, MD, USA). The concentrations of purified DNAs were quantified by absorbance spectroscopy (260 and 280 nm) between 1.8 and 2.0 using a Nanodrop 2000 (Thermo Fisher Scientific, Waltham, MA, USA). The identification of genotyping was performed for 4 single-nucleotide polymorphisms (SNPs) in ABCB1, namely C3435T (rs1045642), C1236T (rs1128503), G2677A (rs2032582), and G2677T (rs2032582). The PCR reaction mixture consisted of 1 μL of isolated DNA, 5 μL of 2× TagMan Universial PCR master mix, 0.5 μL of 20× Drug Metabolism Genotyping assay mix, and 3.5 μL of DNase-free water. Genotyping was carried out using the Taqman SNP Genotyping Assays. DNA amplification was performed by real-time PCR using a Light Cycler 96™ (Roche) under the following protocol: initial denaturation at 60°C for 60 seconds and at 95°C for 600 seconds, followed by a 45-cycle amplification step that consists of denaturation at 95°C for 15 seconds and annealing/extension at 60°C for 60 seconds, and final cooling at 60°C for 60 seconds.
Statistical analysis
To compare Cmax and AUClast of digoxin between single administration (Day 1) and concomitant administration with GTC (Day 15 or Day 29), we performed a mixed-effects analysis in which the subject was a random effect and the treatment was a fixed effect. The analysis was conducted with log-transformed values, and the geometric mean ratios (GMRs) and 90% CIs were obtained by exponentiating the mean difference of the log-transformed values between treatments. The Wilcoxon signed rank test was used to compare Tmax of digoxin between single administration (Day 1) and concomitant administration with GTC (Day 15 or Day 29). The Mann–Whitney U-test was used to compare the % changes from Day 1 (digoxin single administration) of AUClast and Cmax between genotypes (wild-type vs variant genotype) in each SNP.
To evaluate the effect of catechin exposure on digoxin transport, correlation between percent change of digoxin AUClast from Day 1 and AUClast of catechins was assessed by Pearson correlation coefficient.
SAS® 9.3 (SAS Institute Inc., Cary, NC, USA) was used for statistical analysis. The 2-sided level of statistical significance was set at 0.05.
Results
Study participants
A total of 16 subjects (11 males and 5 females) were enrolled in this study. One male subject withdrew his consent after Day 15, and so 15 subjects completed the study. The mean age of subjects was 23.1±2.8 years (mean ± SD), and weight was 68.8±10.8 kg. The baseline characteristics are presented in Table 1.
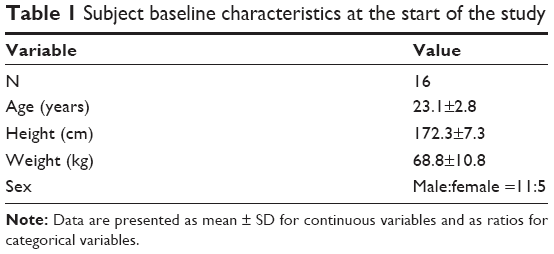 | Table 1 Subject baseline characteristics at the start of the study |
Safety profiling
Sixteen subjects reported 27 adverse events. Of these, 20 were symptoms related to upper respiratory tract infection such as headache, cough, rhinorrhea, pharyngitis, and sputum. There were 7 cases of adverse events unrelated to upper respiratory tract infection, including single cases of nausea, constipation, and insomnia and 4 cases of headache. Among those adverse events, nausea and constipation were considered possibly related to GTC. All the adverse events were mild in intensity and resolved without any treatment.
Pharmacokinetics of digoxin
Compared to the single administration of digoxin (Day 1), the concomitant administration of digoxin and GTC was associated with a significant reduction in systemic exposure of digoxin (Day 15): AUClast decreased by 31% (GMR [90% CI]: 0.69 [0.62–0.75]) and Cmax decreased by 28% (GMR [90% CI]: 0.72 [0.61–0.85]). The concomitant administration of digoxin and GTC at Day 29, following pretreatment with GTC for 13 days, also reduced AUClast and Cmax by 33% and 26%, respectively (GMR [90% CI] of AUClast: 0.67 [0.61–0.74]; GMR [90% CI] of Cmax: 0.74 [0.63–0.87]) (Figures 2 and 3, Table 2). There was no significant difference in Tmax between coadministration of GTC at Day 15 or Day 29 and digoxin alone at Day 1 Table 2.
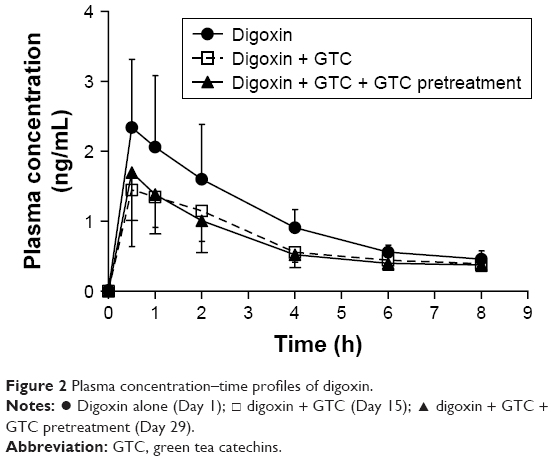 | Figure 2 Plasma concentration–time profiles of digoxin. |
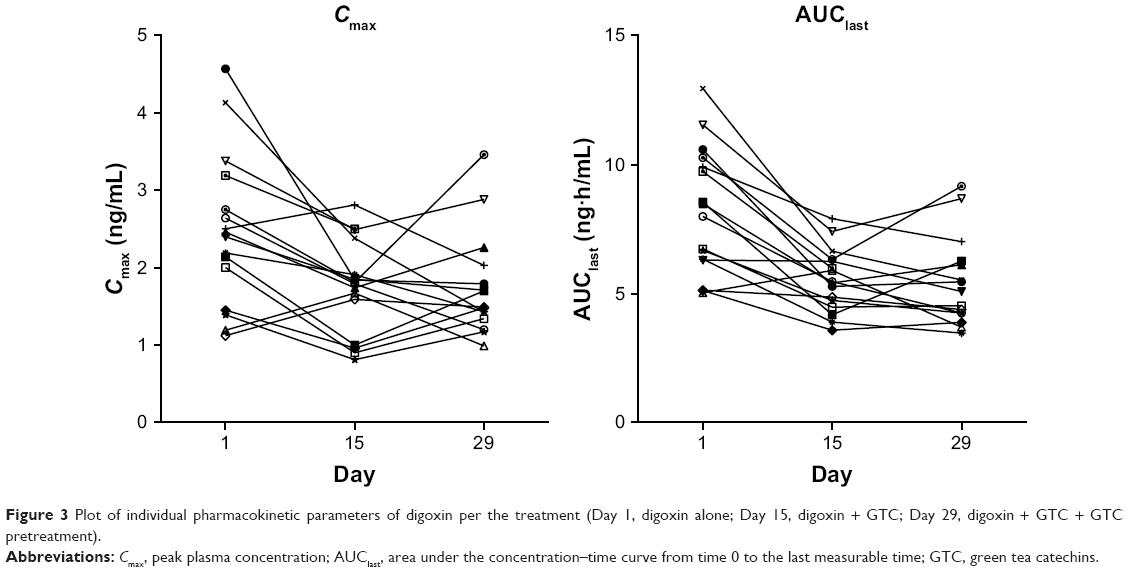 | Figure 3 Plot of individual pharmacokinetic parameters of digoxin per the treatment (Day 1, digoxin alone; Day 15, digoxin + GTC; Day 29, digoxin + GTC + GTC pretreatment). |
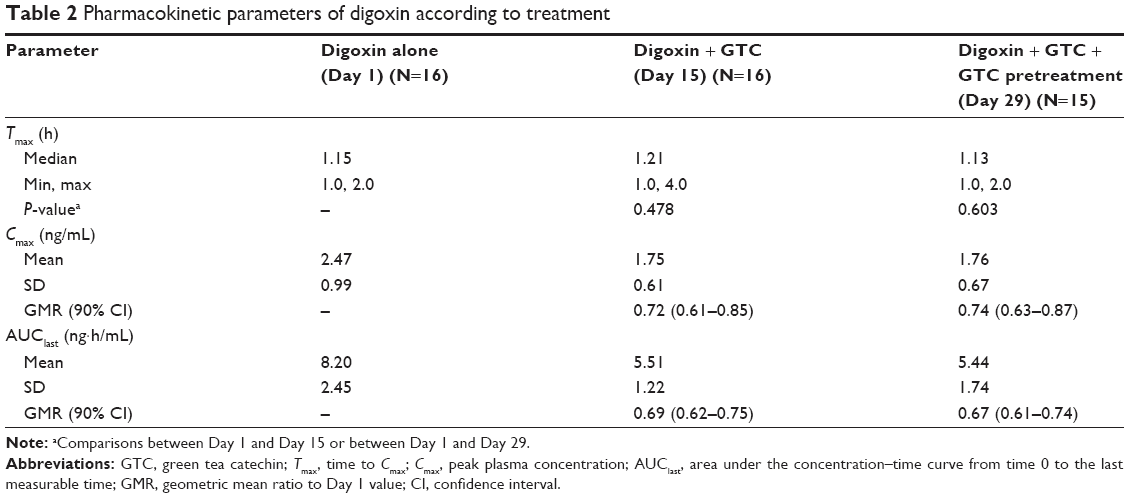 | Table 2 Pharmacokinetic parameters of digoxin according to treatment |
Pharmacokinetics of catechins
The concentration–time profiles of EC, EGC, ECG, and EGCG and the pharmacokinetics parameters are presented in Figure 4 and Table 3. All the 4 kinds of catechins showed peak level at 1 hour after administering digoxin, ie, 2 hours after receiving GTC. EGCG accounted for the largest part of total catechins, followed by ECG. The concentrations of EGC and EC were very low compared to EGCG or ECG. There was no correlation between its AUClast and the reduction of digoxin AUClast for any of these catechins (Figure 5).
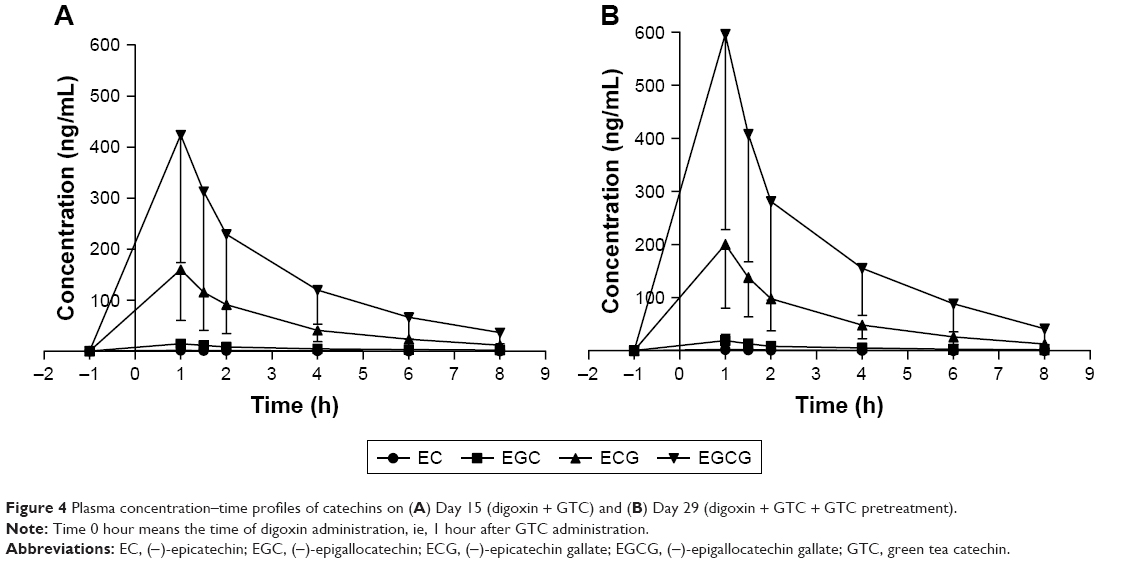 | Figure 4 Plasma concentration–time profiles of catechins on (A) Day 15 (digoxin + GTC) and (B) Day 29 (digoxin + GTC + GTC pretreatment). |
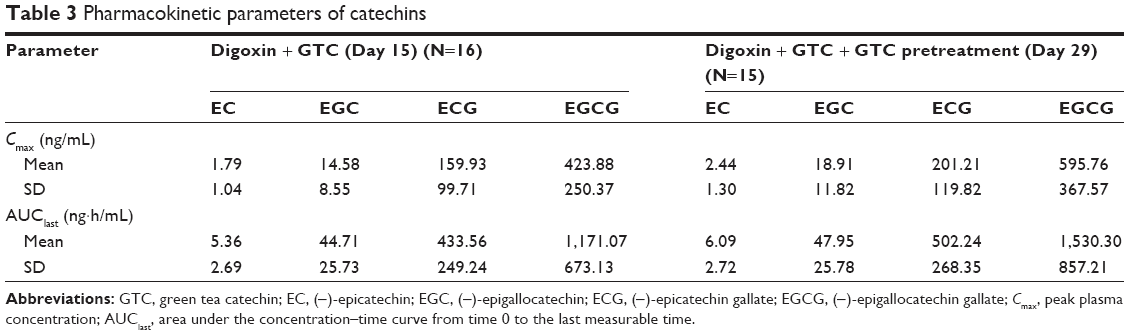 | Table 3 Pharmacokinetic parameters of catechins |
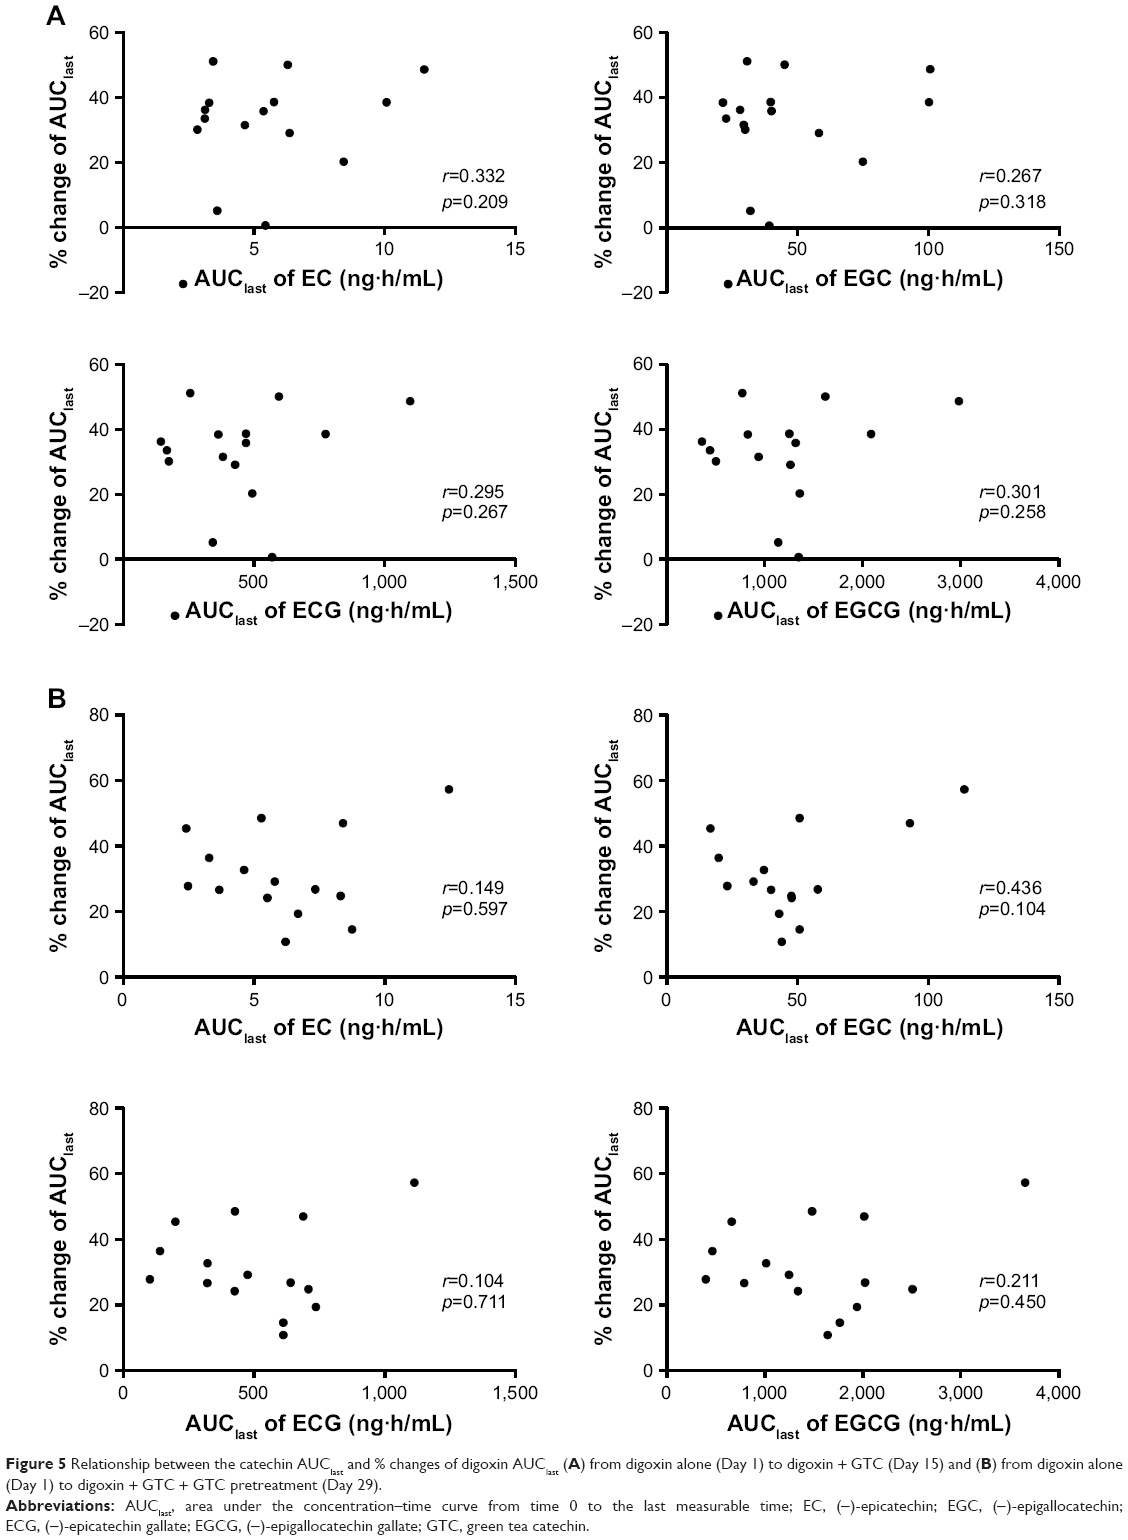 | Figure 5 Relationship between the catechin AUClast and % changes of digoxin AUClast (A) from digoxin alone (Day 1) to digoxin + GTC (Day 15) and (B) from digoxin alone (Day 1) to digoxin + GTC + GTC pretreatment (Day 29). |
Effect of SNPs of ABCB1 on GTC–digoxin interaction
In the comparisons between genotypes in ABCB1, dominant and recessive models were applied depending on the distribution of each polymorphism among the subjects: the dominant model (wild-type + heterozygote variant vs homozygote variant) was used for C1236T genotypes and the recessive model (wild-type vs heterozygote + homozygote variant) for G2677A and G2677T genotypes. In case of C3435T, wild-type was compared with heterozygous variant due to the absence of homozygous variant.
To identify the effect of ABCB1 genotype on the pharmacokinetic alteration of digoxin by GTC, we compared the percentage changes from Day 1 (digoxin alone treatment) of AUClast between genotypes in each SNP. SNPs C3435A and G2677A/T did not show any significant difference in AUClast between genotypes. The percentage change of Day 15 AUClast was significantly higher in C1236T homozygous variant type (TT) than in CC and CT genotypes (P=0.005). However, there were no significant differences between C1236T genotypes in the percentage changes of AUClast at Day 29 (Table 4).
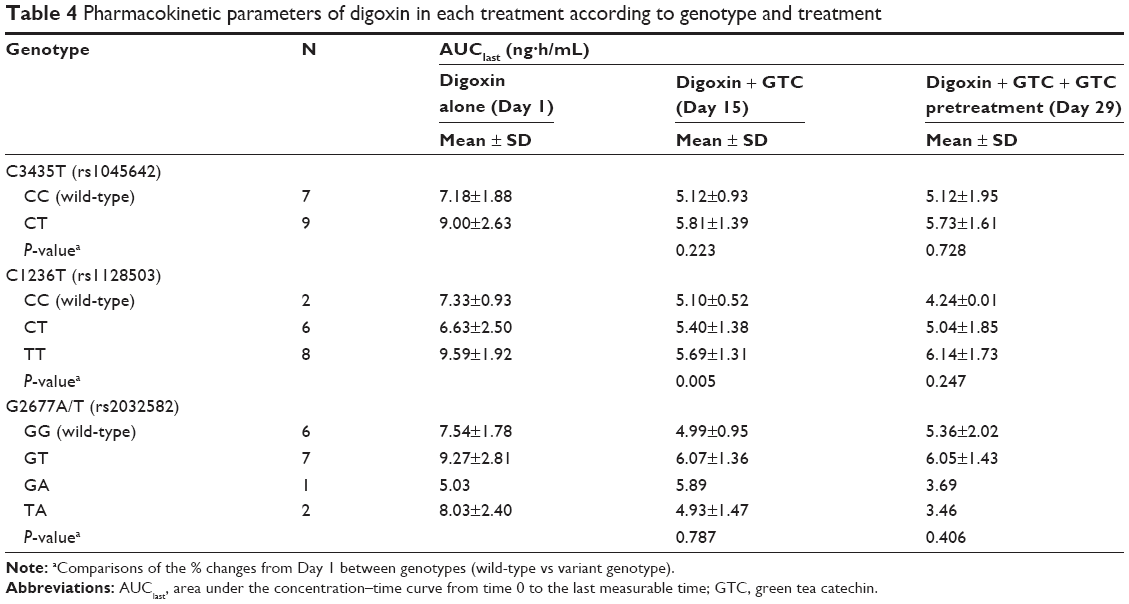 | Table 4 Pharmacokinetic parameters of digoxin in each treatment according to genotype and treatment |
Discussion
This study investigated the effect of GTC on the pharmacokinetics of digoxin. Compared with digoxin alone, concomitant administration with GTC reduced Cmax and AUClast of digoxin by 28% and 31%, respectively. Pretreatment with GTC for 13 days did not alter the effect of concomitant GTC administration on the pharmacokinetics of digoxin: Cmax and AUClast of digoxin decreased by 26% and 33%, respectively, with concomitant GTC and digoxin administration following GTC pretreatment.
Apparently, these findings are not consistent with the known role of p-gp in drug absorption and elimination. P-gp is abundantly expressed on the luminal membrane of enterocytes, hepatocytes facing biliary canaliculi, and renal proximal tubular epithelial cells, so that it interrupts the absorption of substrate drugs and facilitate their excretion. Given the in vitro study8 reporting the inhibitory effect of GTC on the activity of p-gp, we hypothesized that the systemic exposure of digoxin would increase after concomitant administration of GTC. Surprisingly, the coadministration of GTC reduced the systemic exposure of digoxin in this study. Although previous studies on the interaction between p-gp inhibitors and digoxin have consistently reported an increase in the systemic exposure of digoxin, a similar observation was previously reported as an abstract,16 in which the AUC (0–4 hours) of digoxin measured in 8 healthy human subjects decreased by 7% (statistically insignificant) and 2 of them exhibited a 40% decrease in AUC (0–4 hours) and Cmax.
We believe that the reduction in systemic exposure to digoxin following concomitant GTC use can be explained by one of the following: 1) enhanced p-gp activity by EC and 2) inhibition of digoxin uptake transporters by GTC. Distinct from other catechins, EC has been reported to enhance the efflux function of p-gp possibly by binding to an allosteric site of p-gp that increases its activity.17 Although the AUClast of EC was only about 1/200 as high as that of ECGC in our study, this does not exclude the possibility that EC might have effectively increased the activity of p-gp on the intestinal lumen and contributed to decreased systemic exposure of digoxin. Another possibility is that GTC might have interfered with other membrane transporters reportedly involved in the transport of digoxin. Although digoxin was recommended as one of the most suitable substrates for p-gp studies,14 most p-gp inducers or inhibitors cause only modest changes in the pharmacokinetics of digoxin (20%–30% changes in digoxin AUC or Cmax).18,19 Therefore, digoxin absorption may not be highly dependent on p-gp. In addition, multiple studies reported that digoxin is likely to be a substrate of uptake transporters.20–22 Taub et al20 suggested that digoxin could be a substrate of a sodium-dependent uptake transporter, by demonstrating the significant increase of digoxin uptake in cells incubated with sodium-fortified media. Kobayashi et al21 reported that ribosomal protein L in Xenopus laevis oocyte mediated the uptake of digoxin. Lumen et al22 demonstrated by data simulation that digoxin transport into MDCK-MDR1-NKI cells involved an uptake transporter as well as p-gp. Although specific transporters were not identified and involvement of uptake transporters in digoxin pharmacokinetics has not yet been evaluated in vivo, the existence of uptake transporter found in these studies agrees with our findings.
In this study, a 630 mg capsule of green tea extract containing 300 mg of catechins was used as the source of GTC. According to a previous report which investigated the ingredients of various green tea products and green tea supplements, the total amount of catechins brewed in 100 mL of water or contained in a capsule was highly variable, ranging from 52.7 to 584.8 mg. Also, green tea products available in the market were found to have differing compositions of catechins.2 While it would be reasonable to assume that a higher dose of catechins would elicit a stronger interaction with digoxin, our study did not establish a dose–response relationship regarding GTC–digoxin interaction since only one dose of GTC was used. Given the variable amount of catechins contained in green tea products and the differing chemical compositions of catechins, our finding might not generalize to every case of concomitant administration of digoxin and a green tea product. In particular, systemic exposure of digoxin may not be reduced at all if digoxin is taken with a green tea product containing a very small amount of catechins.
There are some limitations in this study. This study was designed to collect blood sample up to 8 hours postdose. Since the terminal elimination half-life of digoxin is 26–45 hours,23 blood sampling for 8 hours is not sufficient for evaluating pharmacokinetic characteristics of the elimination phase. Despite the lack of data from the elimination phase, collection of more blood samples beyond 8 hours after administration of digoxin is unlikely to have made a difference for the following reasons. First, it is highly unlikely that digoxin and GTC have significant interaction in the intestinal lumen at 8 hours after administration because most of the digoxin and GTC will have been absorbed by that time. Second, the concentrations of catechins reported in previous studies on the inhibitory effect of catechins on organic anion transporters were much higher than the plasma concentrations of EGCG found in our subjects. Roth et al7 reported that the IC50 concentrations of EGCG and ECG were 7.8–101 μM (3,573.492–46,272.14 ng/mL) and 10.2–58.6 μM (4,512.174–25,922.88 ng/mL), respectively, and Knop et al8 used ECGC at 1–100 μM (458.14–45,814 ng/mL) to study the effect of EGCG on various transporters. The plasma concentrations of EGCG reported at 8 hours of administration in our study subjects ranged from 4.24 to 119.68 ng/mL, lower than those in these previous studies by several orders of magnitude. We believe that plasma concentrations of EGCG beyond 8 hours of administration are too low to exhibit any biologically relevant interaction between catechins and digoxin.
Conclusion
We observed that concomitant administration of GTC significantly reduces the systemic exposure of digoxin, with or without pretreatment with GTC. Our findings suggest that caution might be needed in case of prescribing digoxin to a patient taking green tea or green tea supplement on a regular basis. This study did not investigate the mechanism for the finding. Further studies are needed on the role of each green tea ingredient or other digoxin transporters to clarify the green tea–digoxin interaction.
Acknowledgment
This work was supported by the National Research Foundation of Korea (NRF) grant (No NRF-2017R1D1A1B03035766). Dr Kim was supported by a training program grant from the Korea Healthcare Technology R&D Project, Ministry for Health & Welfare, Republic of Korea (HI14C2339).
Disclosure
The authors report no conflicts of interest in this work.
References
Balentine DA, Wiseman SA, Bouwens LC. The chemistry of tea flavonoids. Crit Rev Food Sci Nutr. 1997;37(8):693–704. | ||
Henning SM, Fajardo-Lira C, Lee HW, Youssefian AA, Go VL, Heber D. Catechin content of 18 teas and a green tea extract supplement correlates with the antioxidant capacity. Nutr Cancer. 2003;45(2):226–235. | ||
Yang CS, Wang X, Lu G, Picinich SC. Cancer prevention by tea: animal studies, molecular mechanisms and human relevance. Nat Rev Cancer. 2009;9(6):429–439. | ||
Amiot MJ, Riva C, Vinet A. Effects of dietary polyphenols on metabolic syndrome features in humans: a systematic review. Obes Rev. 2016;17(7):573–586. | ||
Kuriyama S, Shimazu T, Ohmori K, et al. Green tea consumption and mortality due to cardiovascular disease, cancer, and all causes in Japan: the Ohsaki study. JAMA. 2006;296(10):1255–1265. | ||
Albassam AA, Markowitz JS. An appraisal of drug-drug interactions with green tea (Camellia sinensis). Planta Med. 2017;83(6):496–508. | ||
Roth M, Timmermann BN, Hagenbuch B. Interactions of green tea catechins with organic anion-transporting polypeptides. Drug Metab Dispos. 2011;39(5):920–926. | ||
Knop J, Misaka S, Singer K, et al. Inhibitory effects of green rea and (−)-epigallocatechin gallate on transport by OATP1B1, OATP1B3, OCT1, OCT2, MATE1, MATE2-K and P-glycoprotein. PLoS One. 2015;10(10):e0139370. | ||
Misaka S, Yatabe J, Müller F, et al. Green tea ingestion greatly reduces plasma concentrations of nadolol in healthy subjects. Clin Pharmacol Ther. 2014;95(4):432–438. | ||
Schinkel AH, Jonker JW. Mammalian drug efflux transporters of the ATP binding cassette (ABC) family: an overview. Adv Drug Deliv Rev. 2003;55(1):3–29. | ||
Thiebaut F, Tsuruo T, Hamada H, Gottesman MM, Pastan I, Willingham MC. Cellular localization of the multidrug-resistance gene product P-glycoprotein in normal human tissues. Proc Natl Acad Sci U S A. 1987;84(21):7735–7738. | ||
Hauptman PJ, Kelly RA. Digitalis. Circulation. 1999;99(9):1265–1270. | ||
Stucky MA, Goldberger ZD. Digoxin: its role in contemporary medicine. Postgrad Med J. 2015;91(1079):514–518. | ||
US Food and Drug Administration. Draft Guidance for Industry: Drug Interaction Studies – Study Design, Data Analysis, and Implications for Dosing and Labeling. Silver Spring, MD: FDA; 2012. | ||
Ganguly S, Kumar T, Mantha S, Panda K. Simultaneous determination of black tea-derived catechins and theaflavins in tissues of tea consuming animals using ultra-performance liquid-chromatography tandem mass spectrometry. PLoS One. 2016;11(10):e0163498. | ||
Mohamed A, Liangpunsakul S, Foster D. Pharmacokinetic (PK) evaluation of a potential transporter-mediated interaction between green tea (GT) and digoxin (DIG). Clin Pharmacol Ther. 2013;93:S86. | ||
Wang EJ, Barecki-Roach M, Johnson WW. Elevation of P-glycoprotein function by a catechin in green tea. Biochem Biophys Res Commun. 2002;297(2):412–418. | ||
Westphal K, Weinbrenner A, Giessmann T, et al. Oral bioavailability of digoxin is enhanced by talinolol: evidence for involvement of intestinal P-glycoprotein. Clin Pharmacol Ther. 2000;68(1):6–12. | ||
Greiner B, Eichelbaum M, Fritz P, et al. The role of intestinal P-glycoprotein in the interaction of digoxin and rifampin. J Clin Invest. 1999;104(2):147–153. | ||
Taub ME, Mease K, Sane RS, et al. Digoxin is not a substrate for organic anion-transporting polypeptide transporters OATP1A2, OATP1B1, OATP1B3, and OATP2B1 but is a substrate for a sodium-dependent transporter expressed in HEK293 cells. Drug Metab Dispos. 2011;39(11):2093–2102. | ||
Kobayashi Y, Kawakami K, Ohbayashi M, Kohyama N, Yamamoto T. Ribosomal protein L3 mediated the transport of digoxin in Xenopus laevis oocyte. J Toxicol Sci. 2010;35(6):827–834. | ||
Lumen AA, Li L, Li J, et al. Transport inhibition of digoxin using several common P-gp expressing cell lines is not necessarily reporting only on inhibitor binding to P-gp. PLoS One. 2013;8(8):e69394. | ||
Iisalo E. Clinical pharmacokinetics of digoxin. Clin Pharmacokinet. 1977;2(1):1–16. |
 © 2018 The Author(s). This work is published and licensed by Dove Medical Press Limited. The full terms of this license are available at https://www.dovepress.com/terms.php and incorporate the Creative Commons Attribution - Non Commercial (unported, v3.0) License.
By accessing the work you hereby accept the Terms. Non-commercial uses of the work are permitted without any further permission from Dove Medical Press Limited, provided the work is properly attributed. For permission for commercial use of this work, please see paragraphs 4.2 and 5 of our Terms.
© 2018 The Author(s). This work is published and licensed by Dove Medical Press Limited. The full terms of this license are available at https://www.dovepress.com/terms.php and incorporate the Creative Commons Attribution - Non Commercial (unported, v3.0) License.
By accessing the work you hereby accept the Terms. Non-commercial uses of the work are permitted without any further permission from Dove Medical Press Limited, provided the work is properly attributed. For permission for commercial use of this work, please see paragraphs 4.2 and 5 of our Terms.