")
Back to Journals » Drug Design, Development and Therapy » Volume 11
Drug–drug interaction of microdose and regular-dose omeprazole with a CYP2C19 inhibitor and inducer
Authors Park G, Bae SH, Park W, Han S , Park M, Shin S, Shin YG, Yim DS
Received 10 January 2017
Accepted for publication 13 March 2017
Published 30 March 2017 Volume 2017:11 Pages 1043—1053
DOI https://doi.org/10.2147/DDDT.S131797
Checked for plagiarism Yes
Review by Single anonymous peer review
Peer reviewer comments 2
Editor who approved publication: Dr Jianbo Sun
Gab-jin Park,1 Soo Hyeon Bae,1 Wan-Su Park,1 Seunghoon Han,1 Min-Ho Park,2 Seok-Ho Shin,2 Young G Shin,2 Dong-Seok Yim1,2
1Department of Clinical Pharmacology and Therapeutics, Seoul St Mary’s Hospital, PIPET (Pharmacometrics Institute for Practical Education and Training), College of Medicine, Catholic University of Korea, Seoul, South Korea; 2College of Pharmacy, Chungnam National University, Daejeon, South Korea
Purpose: A microdose drug–drug interaction (DDI) study may be a valuable tool for anticipating drug interaction at therapeutic doses. This study aimed to compare the magnitude of DDIs at microdoses and regular doses to explore the applicability of a microdose DDI study.
Patients and methods: Six healthy male volunteer subjects were enrolled into each DDI study of omeprazole (victim) and known perpetrators: fluconazole (inhibitor) and rifampin (inducer). For both studies, the microdose (100 µg, cold compound) and the regular dose (20 mg) of omeprazole were given at days 0 and 1, respectively. On days 2–9, the inhibitor or inducer was given daily, and the microdose and regular dose of omeprazole were repeated at days 8 and 9, respectively. Full omeprazole pharmacokinetic samplings were performed at days 0, 1, 8, and 9 of both studies for noncompartmental analysis.
Results: The magnitude of the DDI, the geometric mean ratios (with perpetrator/omeprazole only) of maximum concentration (Cmax) and area under the curve to the last measurement (AUCt) of the microdose and the regular dose were compared. The geometric mean ratios in the inhibition study were: 2.17 (micro) and 2.68 (regular) for Cmax, and 4.07 (micro), 4.33 (regular) for AUCt. For the induction study, they were 0.26 (micro) and 0.21 (regular) for Cmax, and 0.16 (micro) and 0.15 (regular) for AUCt. There were no significant statistical differences in the magnitudes of DDIs between microdose and regular-dose conditions, regardless of induction or inhibition.
Conclusion: Our results may be used as partial evidence that microdose DDI studies may replace regular-dose studies, or at least be used for DDI-screening purposes.
Keywords: drug–drug interaction, microdose, CYP2C19
Introduction
Identifying the principal routes of absorption, distribution, metabolism, and excretion and quantifying drug–drug interactions (DDIs) are essential steps in the investigational drug-development process. Metabolic enzymes (including CYP and UGT isozymes and transporters are related to pharmacokinetic (PK) DDI. It is critical to identify the major drug-metabolizing enzymes and/or drug transporters responsible for drug disposition, and furthermore it is necessary to confirm the magnitude of DDI and to predict the possibility of DDI in clinical practice for safety and efficacy. On the process of evaluating DDI, in vitro studies and preclinical studies are conducted first where quantitative assessments, including physiologically based PK modeling are considered.1 Based on these findings, there is a necessity for a clinical DDI study.
Microdose studies are a valuable tool for understanding the PKs of candidate drugs in humans before the initiation of Phase I studies.2–5 A microdose is defined as 1% of the pharmacologically active dose, and must be no more than 100 μg for small molecules and 30 nmol for protein products.6 Because of the small amount of compound and abbreviated repeated dose-toxicity tests required, a microdose study allows human PK data to be attained more quickly than with conventional approaches. These microdose studies shorten times required for clinical trials and increase the success rate of new-drug approval through an earlier PK assessment of candidate drugs in humans.7
The purpose of a microdose study is predominantly to predict therapeutic dose PKs, but there have been reports of predicting DDIs using a microdose.8,9 Because a microdose is at most 1% of the dose that exhibits any pharmacological effect, its administration is unlikely to exert any observable effects on drug-metabolizing enzymes as a perpetrator (or inhibitor/inducer). However, by coadministration of an established perpetrator, it may be possible to evaluate the DDI of a microdose drug as a victim (or substrate). There are not yet sufficient studies to compare the difference in the magnitude of DDI between a therapeutic (regular) dose and a microdose. Croft et al8 performed a DDI study on CYP1A2, CYP2C9, CYP3A4, and Pgp substrates with a microdose, and compared the results with the previous literature. In the case of a multiple ascending-dose study of a new molecular entity at its Phase I clinical trial, its potential as a perpetrator may be tested using a microdose of victims, instead of normal doses that may influence the PK or safety results of the perpetrator (new molecular entity). If such an approach may replace a full-dose DDI study performed at later phases, this approach may be a safe and time- and cost-effective alternative. The aims of this study were to evaluate DDI by CYP2C19 in a microdose and regular-dose study, and to explore a safe design for assessment of drug interaction.
A probe substrate and well-known inhibitor and inducer of CYP2C19 were used for this study.6,10–13 Omeprazole was selected as a substrate, and fluconazole and rifampin were selected as an inhibitor and an inducer, respectively.
Patients and methods
Subjects
A total of 12 healthy male volunteers were enrolled for the inhibition study and the induction study. Eligibility criteria in the two studies included healthy Korean men 19–45 years old, weighing within 20% of their ideal body weight (height [cm] – 100×0.9), and no clinically relevant conditions identified at their medical history or physical examination or on laboratory tests. A previous history of hypersensitivity to drugs was one of the important exclusion criteria. Subjects abstained from drugs, foods, and any other lifestyle factors that might alter the PK characteristics of investigational products – omeprazole, fluconazole, and rifampin – for at least 24 hours before hospitalization and throughout the participation period. The following data were recorded for each subject: body weight, sex, age, height, vital signs, electrocardiogram, clinical laboratory test including complete blood count, clinical chemistry, urinalysis, and concomitant intake of medications that might influence the PKs of investigational products.
Investigational products
In vivo studies of DDIs are generally designed to compare substrate (victim) concentrations with/without perpetrators.1 Omeprazole 20 mg capsules (regular dose) and 100 μg solution (cold compound microdose) were administered as substrates of CYP2C19. For the CYP2C19 inhibitor and inducer, fluconazole 50 mg capsules and rifampin 150 mg capsules were used, respectively (Figure 1).
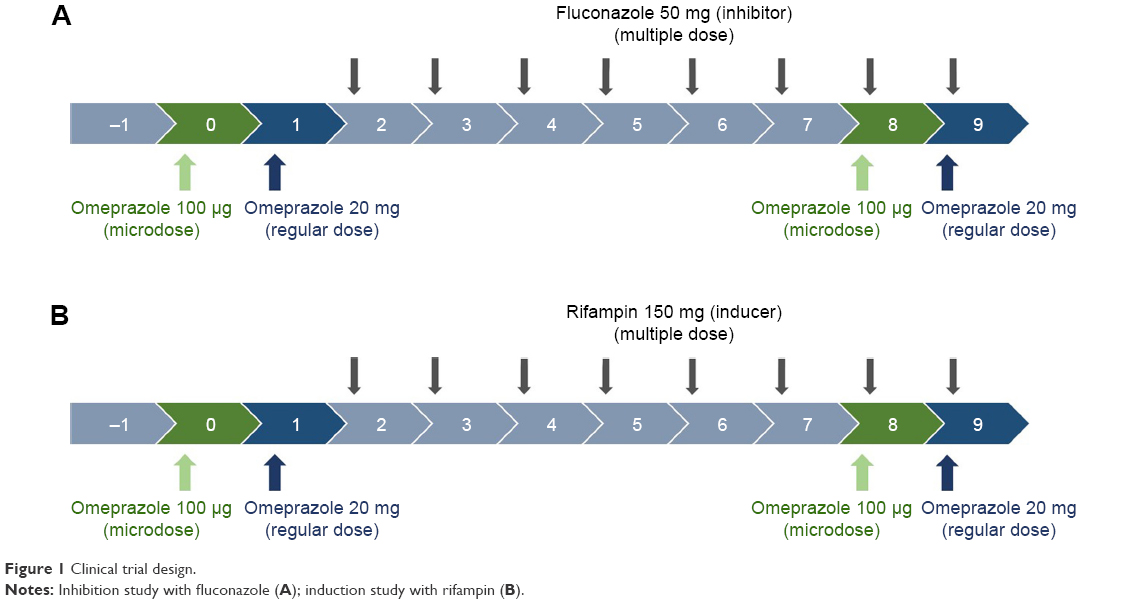 | Figure 1 Clinical trial design. |
For microdosing, omeprazole solution as omeprazole 100 μg/10 mL was prepared by the pharmacy team with the following process. With a flask, 10 mL of 8.4% sodium bicarbonate injection solution was added to the omeprazole 20 mg (prepared by emptying one capsule of omeprazole 20 mg) to reach a concentration of 2 mg/mL. After the mixture had been stirred well, 0.5 mL of the liquid preparation from the mixture was added to 99.5 mL of 8.4% sodium bicarbonate to achieve a final concentration of 10 mg/mL. The final liquid preparation was drawn and stored in six 20 mL Luer-Lok syringes (for each study) at 10 mL each. All syringes were stored at room temperature. Omeprazole solution for each trial was prepared within 1 hour before its administration.
Study design
Two PK studies with an open-labeled, modified one-sequence crossover design (Figure 1) were conducted at the clinical trial center of Seoul St Mary’s Hospital. On day 0, six healthy male volunteer subjects in each study were administered a microdose of omeprazole solution 100 μg, according to the definition of “microdose”.14 On day 1, regular doses of omeprazole 20 mg capsule were administered. A daily dose of fluconazole 50 mg as a CYP2C19 inhibitor or rifampin 150 mg as an inducer was then administered for 8 days (days 2–9). The microdose and regular dose of omeprazole were again administered on days 8 and 9 (Figure 1). Blood samples were collected into heparinized tubes at predose and 0.25, 0.5, 0.75, 1, 2, 4, 6, 8, 12, and 24 hours after dosing on days 0 and 8 for microdose PKs and on days 1 and 9 for regular-dose PKs.
The protocols were approved by the institutional review board of Seoul St Mary’s Hospital, and the studies were conducted in compliance with the Declaration of Helsinki and the Guidelines for Korean Good Clinical Practice. Written informed consent was obtained from each subject. The studies were registered on the Clinical Research Information Service (https://cris.nih.go.kr); KCT0002204 [inhibition study] and KCT0002203 [induction study].
Plasma-concentration analysis
Plasma samples were analyzed at the College of Pharmacy, Chungnam National University using a CBM-20A high-performance liquid-chromatography pump controller (Shimadzu Corporation, Kyoto, Japan) and a CTC HTS PAL autosampler (Trajan Scientific and Medical, Melbourne, Australia) equipped with a TripleTOF 5,600+ mass-spectrometry system with a DuoSpray ion source (Sciex, Concord, ON, Canada). The method of analysis for omeprazole concentration was modified from previous reports.15,16 The calibration curves had ranges of 0.034–222.222 ng/mL and 3.02–2,200 ng/mL for the microdose and regular dose, respectively. The quadratic regression of the calibration curve for peak area ratios versus concentrations was weighted by (1/concentration).2 Calculated coefficients of determination (r) for calibration curves were used to evaluate the fit of the curves. The correlation coefficient for the calibration curve was ≥0.9914. Acceptable runs for the qualification had to have accuracy values within ±30% for the lower limit of quantification (LLOQ) and ±25% for all samples. For quality-control samples at 0.501, 5.509, and 60.606 ng/mL, within-run accuracy ranged from 89.4% to 110.3%, which met the acceptance criteria for qualification. The LLOQs of omeprazole were 0.034 ng/mL for the microdose and 3.02 ng/mL for the regular dose.
Pharmacokinetic analysis
A noncompartmental analysis was performed using Phoenix WinNonlin (version 6.3; Certara, St Louis, MO, USA). Plasma-concentration data obtained from volunteers who completed blood sampling were included. Concentration values were omitted when they were below the LLOQ or when the actual values could not be acquired for any reason (sample missing or blood clotting). Primary PK parameters were taken as the area under the plasma concentration–time curve from time zero to the last measurement (AUCt) and the maximum plasma concentration (Cmax). AUC from time zero to infinity (AUC8), time to reach Cmax (Tmax), and terminal half-life were obtained as the secondary parameters. AUCt was calculated using a linear trapezoidal method. PK parameters, including the geometric means of Cmax, and AUCt, were used for determining DDI.
Results
Subjects
There were no significant differences in demographic characteristics between subjects in the two studies (Table 1). Eleven of the 12 subjects enrolled completed the studies, except for one in the induction study (subject 4), who dropped out before coadministration of the inducer (rifampin) for personal reasons. Geometric mean ratio (GMR) analysis for the induction study was thus executed in five subjects (Table 2).
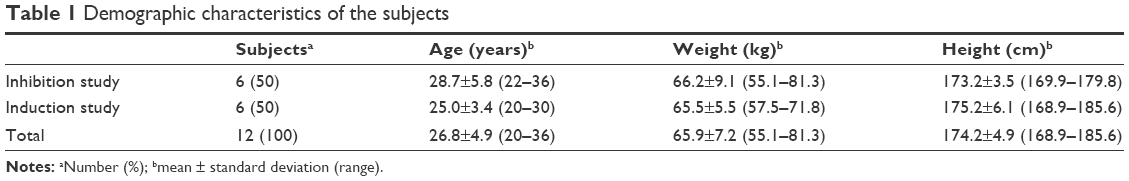 | Table 1 Demographic characteristics of the subjects |
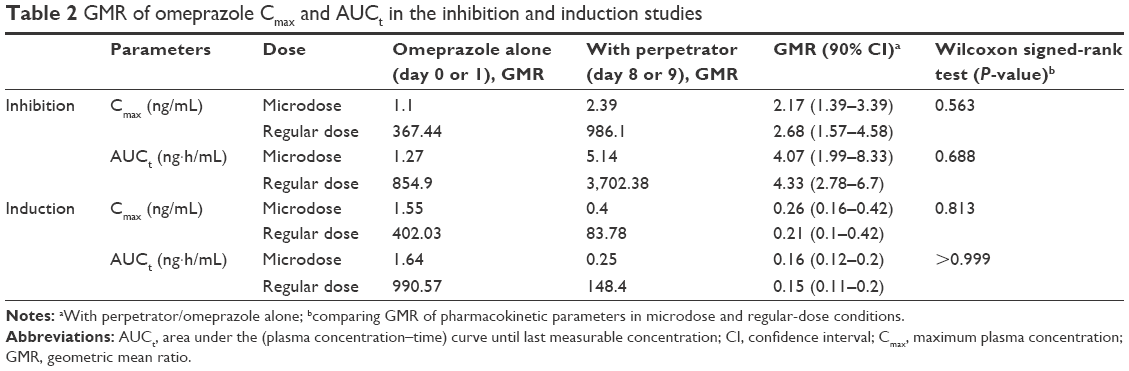 | Table 2 GMR of omeprazole Cmax and AUCt in the inhibition and induction studies |
Noncompartmental analysis
The mean plasma concentration–time profiles of omeprazole in the two studies are shown in Figure 2, and summarized PK-parameter/exposure changes are listed in Tables 3 and 4. Individual plasma concentration-time profiles of omeprazole are shown in Figure S1 and Figure S2. The Cmax and AUCt of omeprazole only in inhibition/induction studies were 1.23±0.7 and 1.88±0.85 ng/mL for microdoses and 528.49±426.85 and 480.81±393.83 ng·h/mL for regular doses, respectively. Those PK parameters as baseline characteristics without DDI were not different statistically between the two studies: P=0.18 and P=0.589 for Cmax and AUCt (microdose) and P=0.937 and P=0.818 for Cmax and AUCt (regular dose).
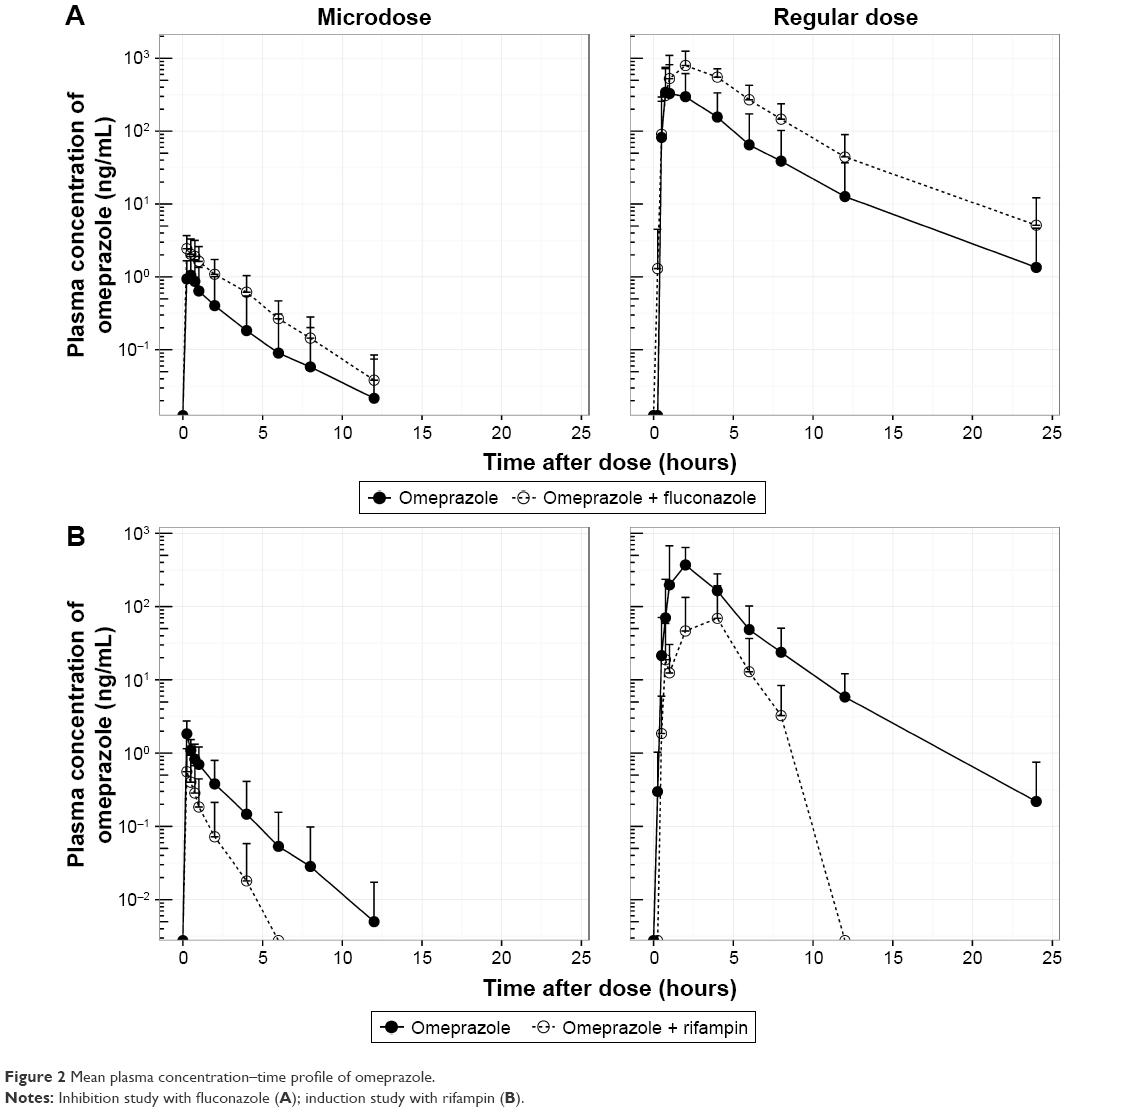 | Figure 2 Mean plasma concentration–time profile of omeprazole. |
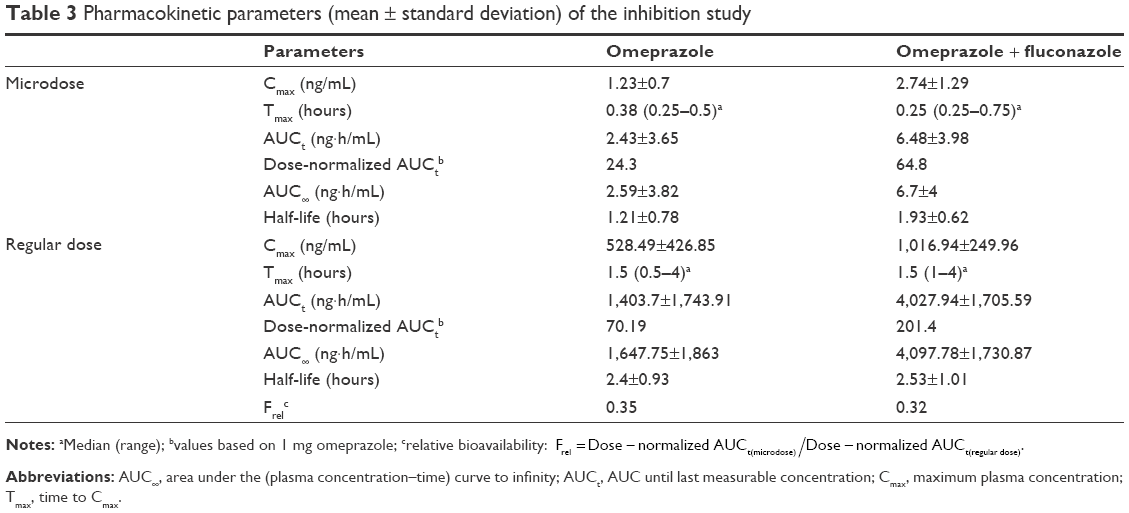 | Table 3 Pharmacokinetic parameters (mean ± standard deviation) of the inhibition study |
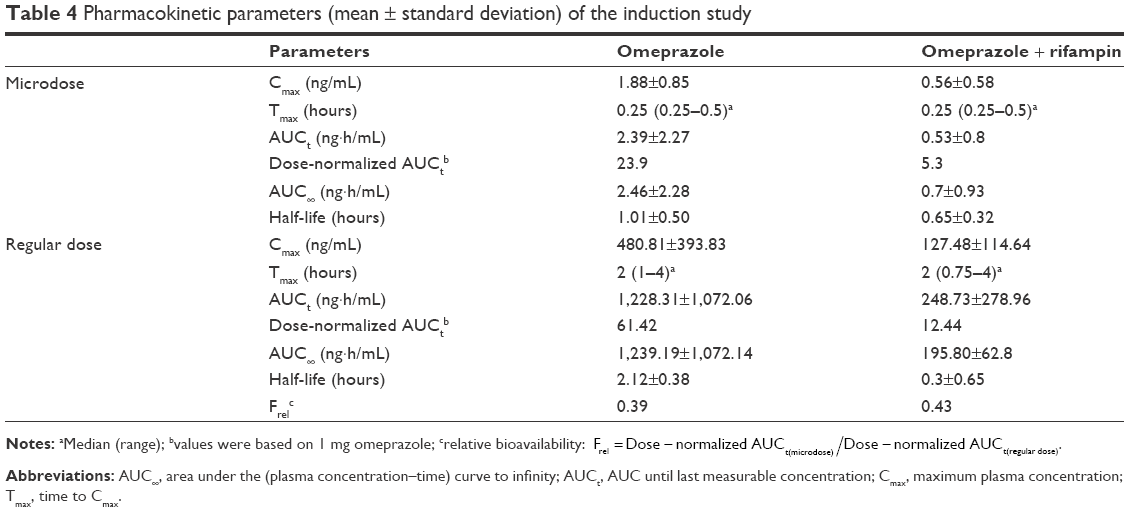 | Table 4 Pharmacokinetic parameters (mean ± standard deviation) of the induction study |
The magnitude of DDI was described using the GMR (with/without perpetrator) of the Cmax and the AUCt of omeprazole. Wilcoxon signed-rank tests were conducted to compare the GMRs in microdose and regular-dose conditions in the two studies. In both the inhibition and induction studies, the GMRs of Cmax and AUCt (with/without perpetrator) at microdoses and regular doses were not significantly different (Table 2 and Figure 3).
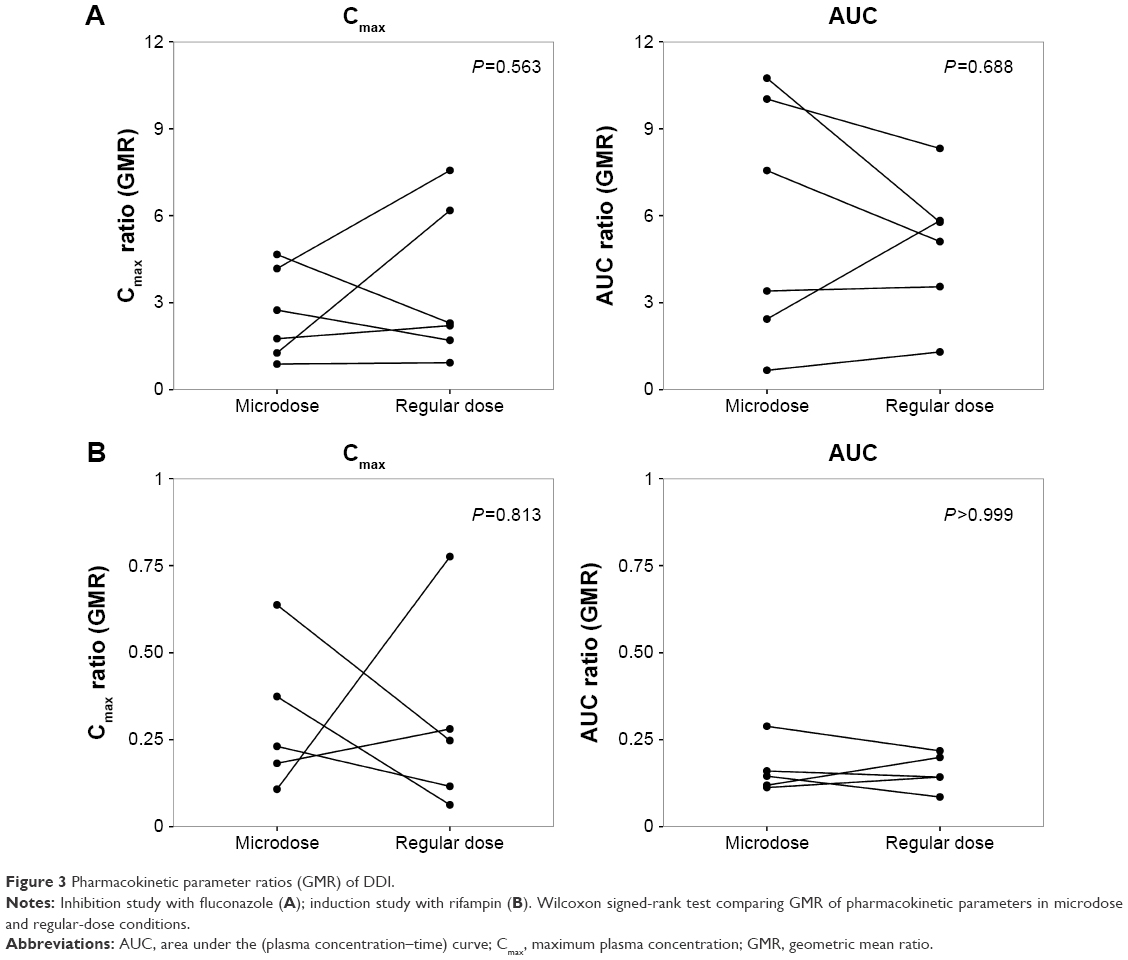 | Figure 3 Pharmacokinetic parameter ratios (GMR) of DDI. |
Discussion
To evaluate the magnitude of DDI with microdoses, a careful and restricted approach is needed. If an investigational drug is suspected as a perpetrator of DDIs, probe substrates of metabolic enzymes, such as midazolam9 or omeprazole, which have simple (“probe”) metabolic pathways and linear PK profiles, can be given at microdoses. If an investigational drug is suspected as a victim of DDIs, microdose study becomes more complicated. Where the investigational drug is eliminated via multiple metabolic pathways, or a substrate of efflux and/or uptake transporters, which is likely to exhibit dose-dependent PKs, the results of microdose DDIs may not represent the full dosing study.
The objective of this study was to assess the magnitude of DDI when the victim drug was given at a microdose and at the regular dose. Omeprazole, a probe substrate of CYP2C19, was selected, and well-known perpetrators of CYP2C19 – fluconazole and rifampin – were chosen as inhibitor and inducer, respectively, for this study.10,17 Omeprazole, a racemic mixture of R-omeprazole and S-omeprazole (esomeprazole), is reported to exhibit nonlinear PKs in the range of therapeutic doses, 20–40 mg, and S-omeprazole is known as a main cause of the nonlinearity of omeprazole PKs.18 The reported single AUC ratios (40 mg/20 mg) of S-omeprazole, R-omeprazole, and omeprazole are 2.55, 2.24, and 2.35, respectively, whereas the steady-state AUC ratios (40 mg/20 mg) of same are 3.28, 2.65, and 3.55, respectively.18,19 Moreover, the contributions of CYP2C19 and CYP3A4 to the metabolism and total intrinsic clearance are different between the two enantiomers. Based on these phenomena, we can conclude that the metabolic saturation of omeprazole, especially S-omeprazole, is the main cause of the nonlinearity. In the results of our study, relative bioavailability of omeprazole (Frel = AUCt[microdose]/AUCt[regular dose]) was 0.35 and 0.39 for the inhibition and induction studies, respectively. The results that the half-lives of omeprazole were longer at the regular dose when omeprazole was given alone (days 0 and 1) also support the nonlinearity of omeprazole PKs: 1.21 hours (micro-) vs 2.4 hours (regular) in the inhibition study and 1.01 hours (micro-) vs 2.12 hours (regular) in the induction study (Tables 3 and 4). Nonetheless, the magnitudes of the DDIs between microdoses and regular doses were comparable. Although the half-life of omeprazole did not seem to change in a regular dose inhibition study, it was considered that this was due to a large inter-individual variability and small number of subjects. In general, however, individual plot showed the tendency of increase of individual half-life after coadministration of fluconazole (Figure 2 and Figure S1).
It is difficult to determine from our results alone whether a full-dose DDI study can be replaced with a microdose DDI study, because this was an exploratory study the sample size of which was not sufficient to make a decision on the representativeness of microdosing. The genetic polymorphism of CYP2C19, which has a significant effect on exposure to omeprazole,20 was not considered in the present study. Based on the results from the inhibition study, the sixth subject was assumed to be a poor metabolizer against CYP2C19, because his exposure to omeprazole was not changed by the coadministration of fluconazole (see Supplementary materials). S-omeprazole is also known as a time-dependent inactivator of CYP2C19, which irreversibly binds to and inhibits CYP2C1919 after multiple dosing. Therefore, extrapolation of the magnitude of the DDI from a single microdose to a regular dose may lead to a biased conclusion if the single-microdose victim used was omeprazole. For the microdose study to replace a full-dose study, above all, the metabolic pathway and the PK characteristics of the substrate should be understood fully, and it is recommended that a verified compound be selected as a microdose substrate. Despite these limitations, we present our results as clinical research estimating the appropriateness of microdose DDI study.
Acknowledgment
This research was supported by a grant from the Korea Health Technology R&D Project through the Korea Health Industry Development Institute (KHIDI), funded by the Ministry of Health and Welfare, South Korea (grant HI14C3321).
Disclosure
The authors report no conflicts of interest in this work.
References
US Food and Drug Administration. Guidance for industry – drug interaction studies: study design, data analysis, implications for dosing, and labeling recommendations. 2012. Available from: https://www.fda.gov/downloads/drugs/guidances/ucm292362.pdf. Accessed March 16, 2017. | ||
Harrison A, Gardner I, Hay T, et al. Case studies addressing human pharmacokinetic uncertainty using a combination of pharmacokinetic simulation and alternative first in human paradigms. Xenobiotica. 2012;42(1):57–74. | ||
Maeda K, Sugiyama Y. Novel strategies for microdose studies using non-radiolabeled compounds. Adv Drug Deliv Rev. 2011;63(7):532–538. | ||
Lappin G, Noveck R, Burt T. Microdosing and drug development: past, present and future. Expert Opin Drug Metab Toxicol. 2013;9(7):817–834. | ||
Burt T, Yoshida K, Lappin G, et al. Microdosing and other phase 0 clinical trials: facilitating translation in drug development. Clin Transl Sci. 2016;9(2):74–88. | ||
US Food and Drug Administration. Guidance for industry, investigators, and reviewers: exploratory IND studies. 2006. Available from: www.fda.gov/downloads/drugs/guidancecomplianceregulatoryinformation/guidances/ucm078933pdf. Accessed March 16, 2017. | ||
Fujita K, Yoshino E, Kawara K, et al. A clinical pharmacokinetic microdosing study of docetaxel with Japanese patients with cancer. Cancer Chemother Pharmacol. 2015;76(4):793–801. | ||
Croft M, Keely B, Morris I, Tann L, Lappin G. Predicting drug candidate victims of drug-drug interactions, using microdosing. Clin Pharmacokinet. 2012;51(4):237–246. | ||
Halama B, Hohmann N, Burhenne J, Weiss J, Mikus G, Haefeli WE. A nanogram dose of the CYP3A probe substrate midazolam to evaluate drug interactions. Clin Pharmacol Ther. 2013;93(6):564–571. | ||
Kang BC, Yang CQ, Cho HK, Suh OK, Shin WG. Influence of fluconazole on the pharmacokinetics of omeprazole in healthy volunteers. Biopharm Drug Dispos. 2002;23(2):77–81. | ||
Ieiri I, Kubota T, Urae A, et al. Pharmacokinetics of omeprazole (a substrate of CYP2C19) and comparison with two mutant alleles, CYP2C19m1 in exon 5 and CYP2C19m2 in exon 4, in Japanese subjects. Clin Pharmacol Ther. 1996;59(6):647–653. | ||
Prilosec (omeprazole) [package insert]. London: AstraZeneca; 2012. | ||
Ridtitid W, Wongnawa M, Mahatthanatrakul W, Punyo J, Sunbhanich M. Rifampin markedly decreases plasma concentrations of praziquantel in healthy volunteers. Clin Pharmacol Ther. 2002;72(5):505–513. | ||
[No authors listed]. Guidance for industry, investigators, and reviewers: exploratory IND studies. Biotechnol Law Rep. 2006;25(2):167–174. | ||
Frerichs VA, Zaranek C, Haas CE. Analysis of omeprazole, midazolam and hydroxy-metabolites in plasma using liquid chromatography coupled to tandem mass spectrometry. J Chromatogr B Analyt Technol Biomed Life Sci. 2005;824(1):71–80. | ||
Vittal S, Ganneboina R, Layek B, et al. Highly sensitive method for the determination of omeprazole in human plasma by liquid chromatography-electrospray ionization tandem mass spectrometry: application to a clinical pharmacokinetic study. Biomed Chromatogr. 2009;23(4):390–396. | ||
Narasimhan NI, Dorer DJ, Davis J, Turner CD, Sonnichsen D. Evaluation of the effect of multiple doses of rifampin on the pharmacokinetics and safety of ponatinib in healthy subjects. Clin Pharmacol Drug De. 2015;4(5):354–360. | ||
Hassan-Alin M, Andersson T, Niazi M, Röhss K. A pharmacokinetic study comparing single and repeated oral doses of 20 mg and 40 mg omeprazole and its two optical isomers, S-omeprazole (esomeprazole) and R-omeprazole, in healthy subjects. Eur J Clin Pharmacol. 2005;60(11):779–784. | ||
Wu F, Gaohua L, Zhao P, et al. Predicting nonlinear pharmacokinetics of omeprazole enantiomers and racemic drug using physiologically based pharmacokinetic modeling and simulation: application to predict drug/genetic interactions. Pharm Res. 2014;31(8):1919–1929. | ||
Furuta T, Shirai N, Sugimoto M, Nakamura A, Hishida A, Ishizaki T. Influence of CYP2C19 pharmacogenetic polymorphism on proton pump inhibitor-based therapies. Drug Metab Pharmacokinet. 2005;20(3):153–167. |
Supplementary materials
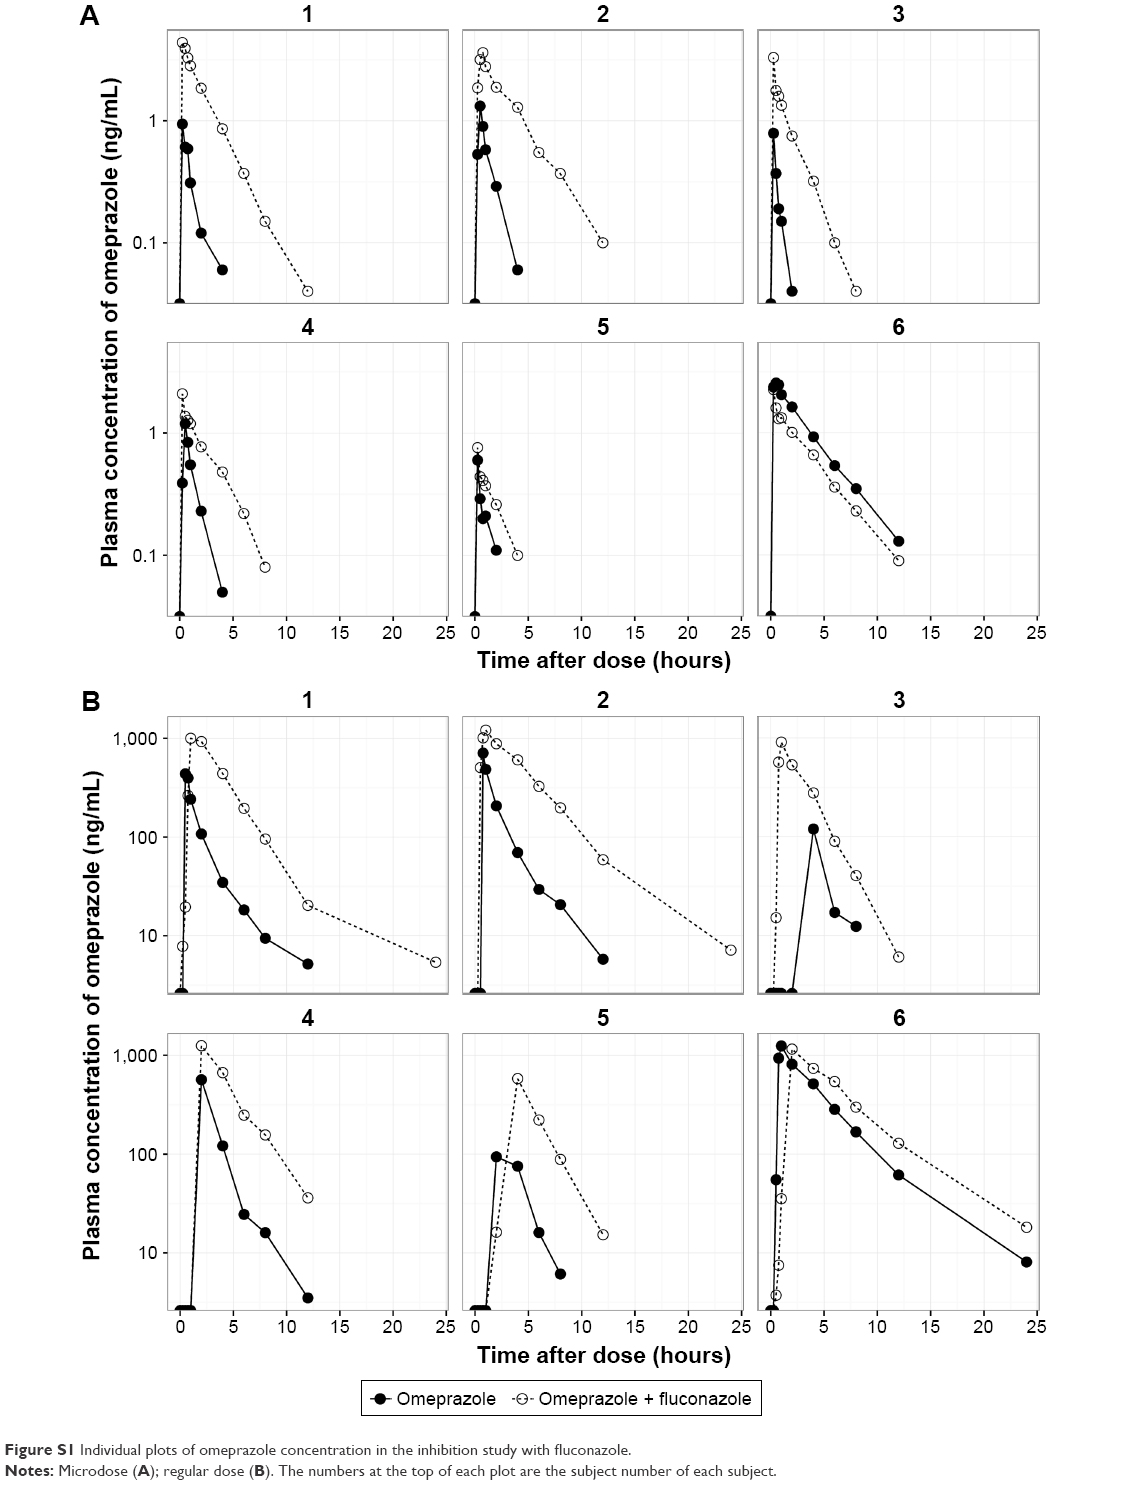 | Figure S1 Individual plots of omeprazole concentration in the inhibition study with fluconazole. |
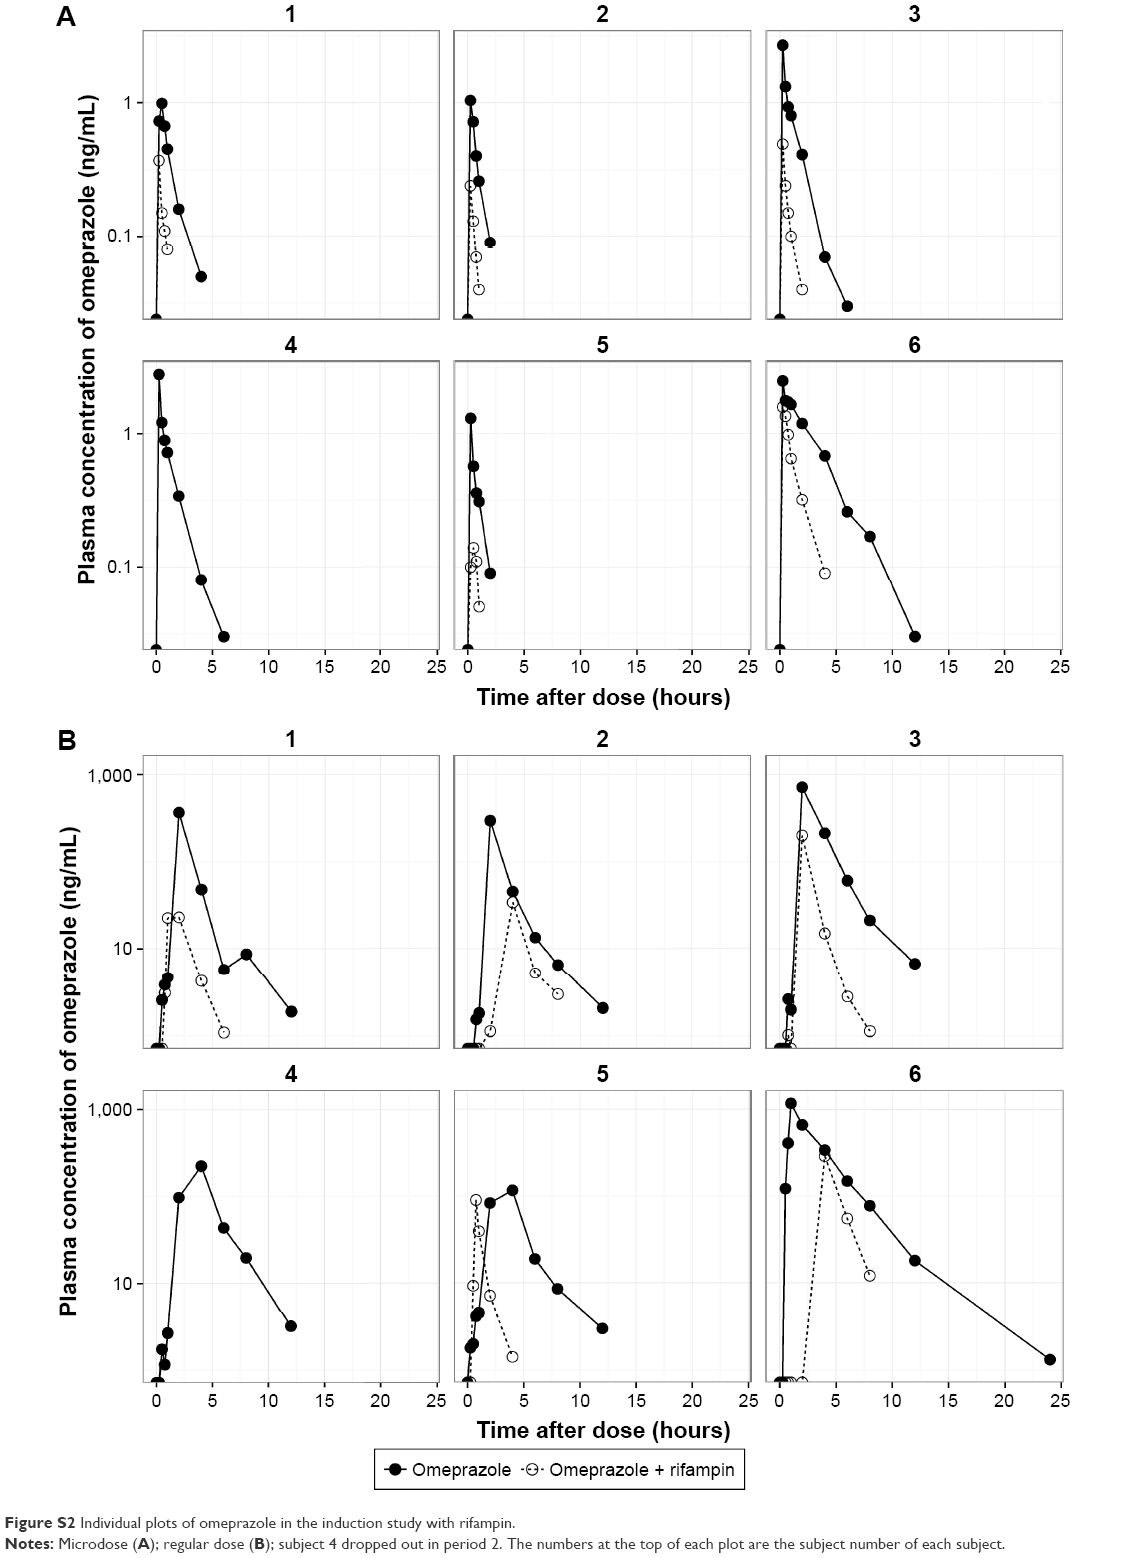 | Figure S2 Individual plots of omeprazole in the induction study with rifampin. |
 © 2017 The Author(s). This work is published and licensed by Dove Medical Press Limited. The full terms of this license are available at https://www.dovepress.com/terms.php and incorporate the Creative Commons Attribution - Non Commercial (unported, v3.0) License.
By accessing the work you hereby accept the Terms. Non-commercial uses of the work are permitted without any further permission from Dove Medical Press Limited, provided the work is properly attributed. For permission for commercial use of this work, please see paragraphs 4.2 and 5 of our Terms.
© 2017 The Author(s). This work is published and licensed by Dove Medical Press Limited. The full terms of this license are available at https://www.dovepress.com/terms.php and incorporate the Creative Commons Attribution - Non Commercial (unported, v3.0) License.
By accessing the work you hereby accept the Terms. Non-commercial uses of the work are permitted without any further permission from Dove Medical Press Limited, provided the work is properly attributed. For permission for commercial use of this work, please see paragraphs 4.2 and 5 of our Terms.