")
Back to Journals » Drug Design, Development and Therapy » Volume 13
Drug–Drug Interactions Of Amiodarone And Quinidine On The Pharmacokinetics Of Eliglustat In Rats
Authors Wang Q, Wang H, Zhong Y, Zhang Q
Received 12 August 2019
Accepted for publication 28 October 2019
Published 12 December 2019 Volume 2019:13 Pages 4207—4213
DOI https://doi.org/10.2147/DDDT.S226948
Checked for plagiarism Yes
Review by Single anonymous peer review
Peer reviewer comments 2
Editor who approved publication: Dr Sukesh Voruganti
Qiong Wang,1 Haiyun Wang,1 Youyan Zhong,1 Qiang Zhang2
1Department of Pharmacy, Wenzhou People’s Hospital, Wenzhou, Zhejiang 325000, People’s Republic of China; 2Department of Clinical Laboratory, The People’s Hospital of Lishui, Lishui, Zhejiang 323000, People’s Republic of China
Correspondence: Qiang Zhang
Department of Clinical Laboratory, The People’s Hospital of Lishui, Lishui, Zhejiang 323000, People’s Republic of China
Email [email protected]
Background: Eliglustat, a new oral substrate-reduction therapy, was recently approved as a first-line therapy for Gaucher’s disease type 1 (GD1) patients.
Purpose: The purpose of the present study was to develop and validate a simple UPLC-MS/MS method for the measurement of plasma-eliglustat concentration and to investigate the effects of amiodarone and quinidine on eliglustat metabolism in rats.
Methods: Eighteen rats were randomly divided into three groups (n=6): control (0.5% CMC-Na, group A), amiodarone (60 mg/kg, group B), and quinidine (100 mg/kg, group C). Thirty minutes later, 10 mg/kg eliglustat was orally administered to each rat and concentrations of eliglustat in the rats determined by our UPLC-MS/MS method.
Results: Amiodarone and quinidine increased the main pharmacokinetic parameters (AUC0→t, AUC0→∞, and Cmax) of eliglustat significantly and decreased clearance obviously.
Conclusion: Amiodarone and quinidine can elevate eliglustat exposure and have an inhibitory effect on eliglustat metabolism. Clearly, appropriate pharmacological studies of eliglustat in patients treated with amiodarone or quinidine should be done in future.
Keywords: eliglustat, drug–drug interaction, UPLC-MS/MS, amiodarone, quinidine
Introduction
Gaucher's disease type 1 (GD1), a rare lysosomal overload disease, is described by enzymatic deficit and results in glucosylceramide overload in body tissue.1 Eliglustat (Figure 1A), a new oral substrate reduction–therapy drug, has recently been awarded marketing approval as a first-line therapy for GD1 patients in Europe, Japan, and the US.2,3 The metabolism of eliglustat is primarily through the CYP2D6 enzyme and to a lesser extent the CYP3A pathway.2,4
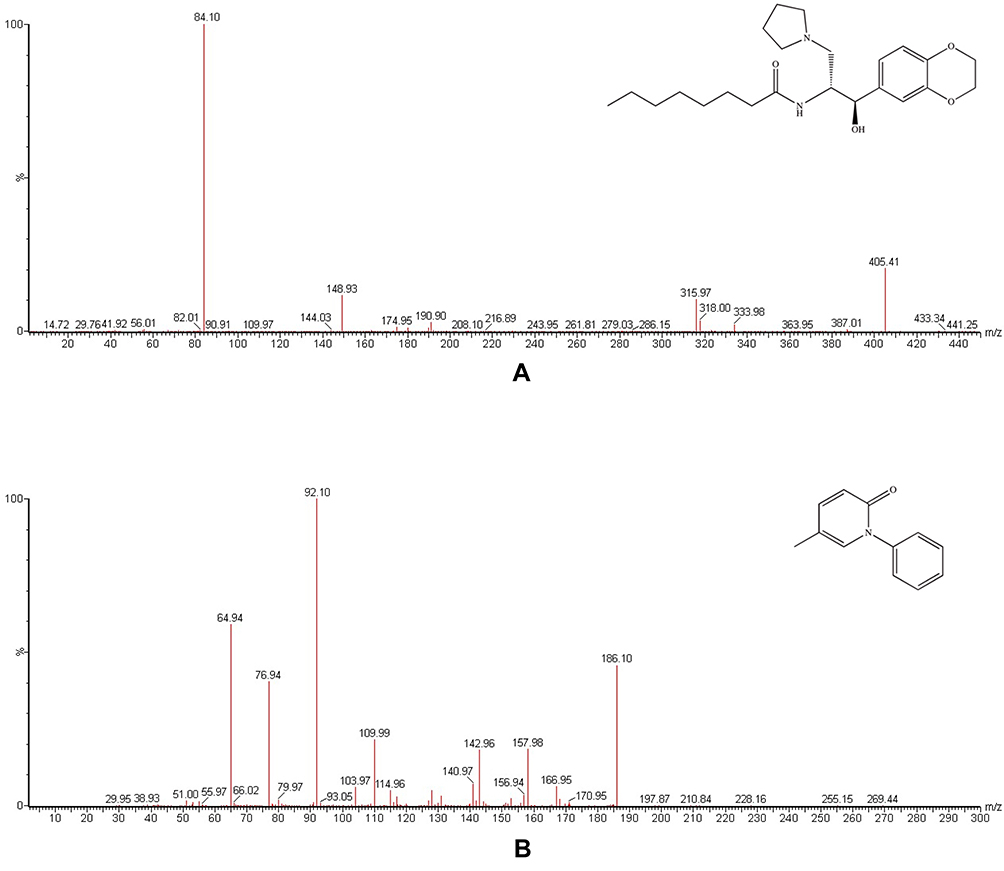 |
Figure 1 Mass spectra of eliglustat (A) and pirfenidone (B) in the present study. |
As an important determinant, CYP2D6-metabolizer status can influence both patient eligibility and recommended dose.5 Prior to prescription of eliglustat, CYP2D6 genotyping is required by both the US Food and Drug Administration and European Medicines Agency in marketing approval: slow metabolizers should be given a 50%-reduced daily dose of eliglustat (risk of overdose-related adverse effects), and the drug is contraindicated for ultrarapid metabolizers (underdosing inefficacy).6,7 Moreover, potential drug–drug interaction is also a significant determinant of the plasma concentration of eliglustat. Substrates, inhibitors, or inducers of CYP2D6 can affect eliglustat-plasma concentration to a clinically relevant extent.6 If patients are prescribed with drugs metabolized by CYP2D6, avoidance or dose reduction of eliglustat is required to avoid adverse drug–drug interactions and toxicity.8
Amiodarone, one of the most commonly used antiarrhythmic agents, can control a wide spectrum of atrial and ventricular antiarrhythmic disorders, followed by sotalol, class II, class IV, and other class III drugs.9 Both amiodarone and its metabolite desethylamiodarone have an inhibitory effect on CYP2D6.10–12 Quinidine, also an antiarrhythmic agent, is not metabolized by CYP2D6, while it has long been established as a potent competitive inhibitor of the enzyme.13–15 GD1 patients with arrhythmia should be coadministered eliglustat and amiodarone (or quinidine) as one treatment protocol. However, to the best of our knowledge, there is no information about the effects of amiodarone and quinidine on the metabolism of eliglustat. Therefore, the goal of this study was to develop and establish a UPLC-MS/MS method for the determination of eliglustat and investigate drug–drug interactions between eliglustat and amiodarone/quinidine by comparing plasma concentrations and pharmacokinetic parameters of eliglustat in rats.
Methods
Materials
Eliglustat (purity >98%), amiodarone (purity >98%), quinidine (purity >98%), and pirfenidone (IS; purity >98%, Figure 1B) were supplied by Beijing Sunflower and Technology Development (Beijing, China). HPLC-grade acetonitrile and methanol were obtained from Merck (Darmstadt, Germany). Analytical-grade formic acid was bought from Beijing Sunflower and Technology Development. Ultrapure water was prepared using a Milli-Q water purification system (Millipore, Bedford, MA, USA).
Animal Experiments
Eighteen male Sprague Dawley rats with body weight of 180–220 g were obtained from the Laboratory Animal Center of Wenzhou Medical University (Wenzhou, China). Before experiments, rats were fasted for 12 hours, but water was freely available. All experimental procedures and protocols were reviewed and approved by the Animal Care and Use Committee of Wenzhou Medical University and were in accordance with the Guide for the Care and Use of Laboratory Animals. Eliglustat, amiodarone, and quinidine were all suspended in 0.5% carboxymethyl cellulose sodium (CMC-Na). Eighteen rats were randomly divided into three groups (n=6) and orally given solutions: control (0.5% CMC-Na, group A), amiodarone (60 mg/kg, group B), and quinidine (100 mg/kg, group C). Thirty minutes later, 10 mg/kg eliglustat was orally administered to each group. Approximately 0.15 mL of blood was collected at 0.333, 0.667, 1, 1.5, 2, 3, 4, 6, 8, 12, 24, and 36 hours from the tail vein into heparinized 1.5 mL polythene tubes. Subsequently, blood samples obtained were immediately subjected to centrifugation at 4,000 g for 8 minutes, and 50 µL plasma was harvested after separation and stored at −80°C until analysis.
Instrumentation And Analytical Conditions
Liquid chromatography was conducted on a Waters Acquity UPLC system (Milford, MA, USA), which was equipped with a sample manager (flow-through needle, set at 10°C), a column oven (set at 40°C), and an I-Class binary solvent–delivery manager. Chromatographic separation was carried out on an Acquity BEH C18 column (2.1×50 mm, 1.7 μm). Meanwhile, the mobile phase consisted of acetonitrile (solvent A) and 0.1% formic acid in water (solvent B) delivered at a flow rate of 0.30 mL/min, and linear gradient elution was employed: 20% A at 0–0.5 minutes, 20%–50% A at 0.5–1 minute, 50% A at 1–2 min, 50%–20% A at 2–2.1 minutes, and finally the column was equilibrated with 20% A for 0.9 minutes. The entire run time was 3 minutes for an injection volume of 1 µL.
Quantification analysis was performed on a Waters Xevo TQ-S triple-quadrupole tandem mass spectrometer equipped with an electro-spray ionization source in the positive mode. General parameters, such as gas, voltage, and temperature, were optimized: cone gas 150 L/h, desolvation gas 800 L/h, collision gas 0.15 mL/min, capillary voltage 1.5 kV, desolvation temperature 600°C. Cone voltage and collision energy were 20 V and 15 eV for eliglustat and 25 V and 20 eV for IS, respectively. Multiple reaction–monitoring mode was used for each transition: m/z 405.4 → 84.1 for eliglustat and m/z 186.1 → 92.1 for IS. Masslynx 4.1 software (Waters) was used for data acquisition and instrument control.
Sample Preparation
First, 5 µL IS working solution (50 ng/mL in acetonitrile) was added to each plasma sample (50 µL) and mixed for 30 seconds. Then, the mixture was added to 150 µL acetonitrile for protein precipitation. Subsequently, the mixture was vortexed for 3 minutes and centrifuged at 13,000 g for 10 minutes. Finally, 100 µL clear supernatant was transferred into an autosampler vial and 1 µL injected into the UPLC-MS/MS system for analysis.
Method Validation
A complete validation of the bioanalytical assay was conducted in light of the regulatory principles of the Food and Drug Administration,16 which require assessment of selectivity, calibration curve, lower limit of quantification, accuracy, precision, matrix effect, recovery, and stability under various conditions.
Statistical Analysis
Following quantification of the analyte concentration, the mean plasma-eliglustat concentration–time curve was determined by Origin 8.0 (OriginLab, Northampton, MA, USA) and the pharmacokinetic parameters of eliglustat calculated by DAS (Drug and Statistics) software (version 2.0, Shanghai University of Traditional Chinese Medicine, China) in noncompartmental mode. Statistical comparisons of the main pharmacokinetic parameters within each group were carried out with SPSS 17.0 by one-way ANOVA. In all cases, P<0.05 was deemed to be of statistical significance.
Results
Method Development
Figure 1 indicates the ion mass spectra of eliglustat and IS in positive-ionization mode. Figure 2 shows typical chromatograms of blank plasma samples from six different batches, blank plasma samples spiked with eliglustat and IS, and a real rat plasma sample after oral administration. There was no interference from endogenous substances at the retention times of the analyte and IS, which were 1.59 and 1.56 minutes, respectively. At a concentration range of 1–1,500 ng/mL, the regression equation of eliglustat was y=9.72839×x±10.2905 (r2=0.9976). Sensitivity of the method was calculated by the lower limit of quantification and established as 1 ng/mLwithin a deviation of ±20%. Intra- and interday accuracy ranged from −11.0% to 12.3%, and precision was 2.7%–11.6% (Table 1). The recovery of eliglustat from the plasma matrix was >86.9% (Table 1). The matrix effect of eliglustat was calculated to be 92.1%–102.0%, showing no significant ion suppression or enhancement existed during the processing and detection procedure. In addition, this proved to be stable when plasma-eliglustat samples had been in the autosampler (4°C) for at least 4 hours and at room temperature for at least 3 hours, overthree complete freeze (−80°C)–thaw (room temperature) cycles, and at −80°C for at least 30 days. All these results were within the acceptable range, and demonstrated that the method was accurate and precise.
 |
Figure 2 Representative MRM chromatograms of eliglustat and pirfenidone in rat plasma samples: blank plasma (A); blank plasma spiked with standard solution (B); real plasma sample (C). |
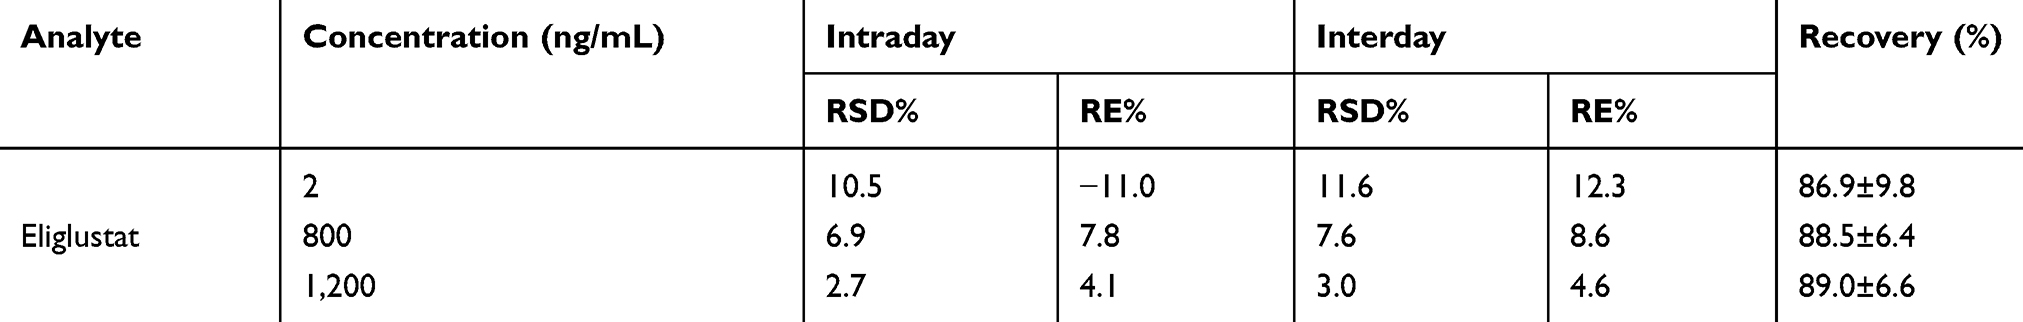 |
Table 1 Precision, Accuracy and Recovery of Eliglustat in Rat Plasma (n=6) |
Effect Of Amiodarone On The Pharmacokinetics Of Eliglustat
After a single oral administration of 10 mg/kg eliglustat, mean plasma concentration–time curves of eliglustat administered alone (group A) and in combination with amiodarone (group B) (Figure 3) and pharmacokinetic parameters from noncompartment model analysis (Table 2) were determined. From the results, when eliglustat was combined with amiodarone in group B, AUC0→t, AUC0→∞, and Cmax of eliglustat increased by 63.9%, 66.6%, and 87.1% (P<0.05), while eliglustat clearance (Cl) of in group B had a significant reduction of 34.8% (P<0.05). These changes in pharmacokinetic parameters indicated that amiodarone had a clear inhibitory effect on the metabolism of eliglustat.
 |
Figure 3 Mean plasma concentration–time curves of eliglustat in different treatment groups of rats. Group A, control (0.5% CMC-Na); group B, 60 mg/kg amiodarone; group C, 100 mg/kg quinidine (n=6). |
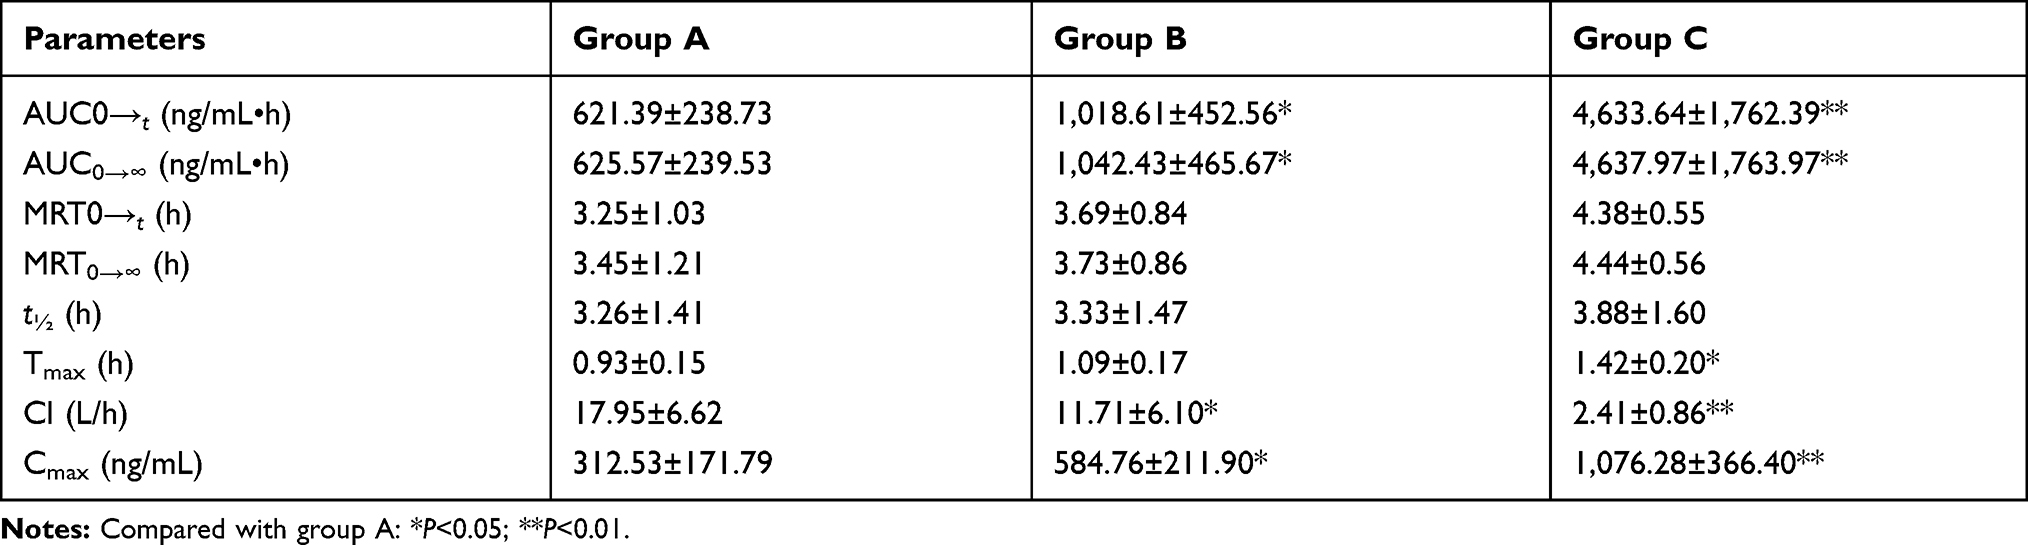 |
Table 2 Pharmacokinetic Parameters of Eliglustat in Different Treatment Groups of Rats. Group A, Control (0.5% CMC-Na); Group B, 60 mg/kg Amiodarone; Group C, 100 mg/kg Quinidine (n=6, mean ± SD) |
Effect Of Quinidine On The Pharmacokinetics Of Eliglustat
The mean plasma concentration–time curves of eliglustat administered alone (group A) and in combination with quinidine (group C) are also given in Figure 3, and pharmacokinetic parameters from noncompartment model analysis summarized in Table 2. For quinidine in group C, the main pharmacokinetic parameters (AUC0→t, AUC0→∞, and Cmax) of eliglustat increased by approximately 6.46-fold, 6.41-fold, and 2.44-fold, respectively (P<0.01) and Cl decreased by 86.6% (P<0.01). These results demonstrated that quinidine also had an inhibitory effect on eliglustat metabolism — even more.
Discussion
GD1 patients taking eliglustat should be queried about and tracked for concomitant-medication use at every visit by physicians, especially with regard to inhibitors of CYP2D6. Above therapeutic plasma concentrations of eliglustat, increases in PR, QRS, and QTc intervals on electrocardiography are predicted.2 Therefore, eliglustat is not recommended for patients with preexisting cardiovascular disease, long QT syndrome, or in combination with class IA or class III antiarrhythmic agents.2,6 However, it has been reported that the effect of a single supratherapeutic dose on QT/QTc interval was not considered clinically relevant. Also, long-term adverse-event profiles from four completed trials of oral eliglustat in adults with GD1 have reinforced a favorable safety profile of eliglustat.17 Until now, the influencfe of changes in class III (amiodarone) and class IA (quinidine) antiarrhythmic medications on pharmacokinetic parameters of eliglustat had not been characterized in detail. Therefore, the purpose of this study was to investigate drug–drug interactions between eliglustat and amiodarone/quinidine in rats.
In the present study, we developed and established a UPLC-MS/MS method for the determination of eliglustat in rat plasma. To the best of our knowledge, only one paper had described a bioanalytical method of determining eliglustat in plasma by HPLC prior, which required elaborate sample preparation (liquid–liquid extraction), low sensitivity (300 ng/mL), and long run time (12 minutes).18 We instead chose a simple protein-precipitation method using acetonitrile. High sensitivity (1 ng/mL) and short run time (3 min per sample) in this study ensured high throughput of the assay in sample analysis after a series of optimizations. The validated method was successfully applied to study of drug–drug interactions between eliglustat and amiodarone/quinidine in rats.
Amiodarone is a common antiarrhythmic drug and has an inhibitory effect on CYP2D6.10–12 Quinidine is also an antiarrhythmic drug and a long-established potent competitive inhibitor of CYP2D6.13–15 From the results of this study, all AUC0→t, AUC0→∞, and Cmax values for eliglustat in groups B and C were higher than those of the control group (group A), and Cl showed a significant reduction. Furthermore, we found that quinidine had more potent inhibition ability against eliglustat metabolism according to the main pharmacokinetic parameters (AUC0→t, AUC0→∞, Cl, and Cmax).
Because of the significant interactions between eliglustat with amiodarone/quinidine, our study can provide a novel direction for clinical medication and treatment of GD1 patients with eliglustat. The combination of eliglustat with amiodarone or quinidine should be avoided or monitored in the clinic, even when patients take these drugs at normal therapeutic doses, because the pharmacokinetics of eliglustat have been altered significantly. Moreover, clinicians and patients can understand better that exposure to eliglustat will be significantly increased and treatment-related adverse events of eliglustat more serious and frequent when amiodarone or quinidine is used in combination with eliglustat in GD1 patients. As this study was performed on few rats, further research should be done.
Conclusion
The presented eliglustat UPLC-MS/MS method was simple and reliable to determine the plasma concentration of eliglustat in rat plasma. The applicability of the method was demonstrated in a drug–drug interaction study between eliglustat and amiodarone/quinidine in rats, where both amiodarone and quinidine elevated the concentration of eliglustat and had an inhibitory effect on eliglustat metabolism. Clearly, further studies should be done on pharmacological changes with eliglustat in patients being treated with eliglustat and amiodarone/quinidine in the clinic.
Disclosure
The authors report no conflicts of interest in this work.
References
1. Grabowski GA, Andria G, Baldellou A, et al. Pediatric non-neuronopathic Gaucher disease: presentation, diagnosis and assessment. Consensus statements. Eur J Pediatr. 2004;163(2):58–66. doi:10.1007/s00431-003-1362-0
2. Poole RM. Eliglustat: first global approval. Drugs. 2014;74(15):1829–1836. doi:10.1007/s40265-014-0296-3
3. Charrow J, Fraga C, Gu X, et al. Once- versus twice-daily dosing of eliglustat in adults with Gaucher disease type 1: the Phase 3, randomized, double-blind EDGE trial. Mol Genet Metab. 2018;123(3):347–356. doi:10.1016/j.ymgme.2017.12.001
4. Becquemont L. Type 1 Gaucher disease (CYP2D6-eliglustat). Therapie. 2017;72(2):323–326. doi:10.1016/j.therap.2016.09.019
5. Scott LJ. Eliglustat: a review in Gaucher disease type 1. Drugs. 2015;75(14):1669–1678. doi:10.1007/s40265-015-0468-9
6. Balwani M, Burrow TA, Charrow J, et al. Recommendations for the use of eliglustat in the treatment of adults with Gaucher disease type 1 in the United States. Molecular Genetics and Metabolism. 2016;117(2):95–103. doi:10.1016/j.ymgme.2015.09.002
7. Belmatoug N, Di Rocco M, Fraga C, et al. Management and monitoring recommendations for the use of eliglustat in adults with type 1 Gaucher disease in Europe. European Journal of Internal Medicine. 2017;37:25–32. doi:10.1016/j.ejim.2016.07.011
8. Bennett LL, Turcotte K. Eliglustat tartrate for the treatment of adults with type 1 Gaucher disease. Drug Des Devel Ther. 2015;9:4639–4647. doi:10.2147/DDDT
9. Singh BN. Amiodarone: a multifaceted antiarrhythmic drug. Curr Cardiol Rep. 2006;8(5):349–355. doi:10.1007/s11886-006-0074-2
10. Jaruratanasirikul S, Hortiwakul R. The inhibitory effect of amiodarone and desethylamiodarone on dextromethorphan O-demethylation in human and rat liver microsomes. J Pharm Pharmacol. 1994;46(11):933–935. doi:10.1111/jphp.1994.46.issue-11
11. Fukumoto K, Kobayashi T, Tachibana K, et al. Effect of amiodarone on the serum concentration/dose ratio of metoprolol in patients with cardiac arrhythmia. Drug Metab Pharmacokinet. 2006;21(6):501–505. doi:10.2133/dmpk.21.501
12. Ohyama K, Nakajima M, Suzuki M, Shimada N, Yamazaki H, Yokoi T. Inhibitory effects of amiodarone and its N-deethylated metabolite on human cytochrome P450 activities: prediction of in vivo drug interactions. Br J Clin Pharmacol. 2000;49(3):244–253.
13. Branch RA, Adedoyin A, Frye RF, Wilson JW, Romkes M. In vivo modulation of CYP enzymes by quinidine and rifampin. Clin Pharmacol Ther. 2000;68(4):401–411. doi:10.1067/mcp.2000.110561
14. Ai CZ, Li Y, Wang YH, Chen YD, Yang L. Insight into the effects of chiral isomers quinidine and quinine on CYP2D6 inhibition. Bioorganic & Medicinal Chemistry Letters. 2009;19(3):803–806. doi:10.1016/j.bmcl.2008.12.016
15. Berka K, Anzenbacherova E, Hendrychova T, et al. Binding of quinidine radically increases the stability and decreases the flexibility of the cytochrome P450 2D6 active site. Journal of Inorganic Biochemistry. 2012;110:46–50. doi:10.1016/j.jinorgbio.2012.02.010
16. Center for Drug Evaluation and Research of the U.S. Department of Health and Human Services Food and Drug . Administration, Guidance for industry; Bioanalytical method validation. 2018. Available from: http://www.fda.gov/Drugs/GuidanceComplianceRegulatoryInformation/Guidances/ucm064964.htm.
17. Peterschmitt MJ, Freisens S, Underhill LH, Foster MC, Lewis G, Gaemers SJM. Long-term adverse event profile from four completed trials of oral eliglustat in adults with Gaucher disease type 1. Orphanet J Rare Dis. 2019;14(1):128. doi:10.1186/s13023-019-1085-6
18. Reddy VK, Swamy N, Rathod R, Sengupta P. A bioanalytical method for Eliglustat quantification in rat plasma. J Chromatogr Sci. 2019. doi:10.1093/chromsci/bmz033
 © 2019 The Author(s). This work is published and licensed by Dove Medical Press Limited. The full terms of this license are available at https://www.dovepress.com/terms.php and incorporate the Creative Commons Attribution - Non Commercial (unported, v3.0) License.
By accessing the work you hereby accept the Terms. Non-commercial uses of the work are permitted without any further permission from Dove Medical Press Limited, provided the work is properly attributed. For permission for commercial use of this work, please see paragraphs 4.2 and 5 of our Terms.
© 2019 The Author(s). This work is published and licensed by Dove Medical Press Limited. The full terms of this license are available at https://www.dovepress.com/terms.php and incorporate the Creative Commons Attribution - Non Commercial (unported, v3.0) License.
By accessing the work you hereby accept the Terms. Non-commercial uses of the work are permitted without any further permission from Dove Medical Press Limited, provided the work is properly attributed. For permission for commercial use of this work, please see paragraphs 4.2 and 5 of our Terms.