")
Back to Journals » Drug Design, Development and Therapy » Volume 8
Differential microRNA expression signatures and cell type-specific association with Taxol resistance in ovarian cancer cells
Authors Kim Y, Kim EY, Jeon D, Liu J, Kim H, Choi J, Ahn WS
Received 23 July 2013
Accepted for publication 2 October 2013
Published 24 February 2014 Volume 2014:8 Pages 293—314
DOI https://doi.org/10.2147/DDDT.S51969
Checked for plagiarism Yes
Review by Single anonymous peer review
Peer reviewer comments 4
Yong-Wan Kim,1 Eun Young Kim,1 Doin Jeon,1 Juinn-Lin Liu,2 Helena Suhyun Kim,3 Jin Woo Choi,4 Woong Shick Ahn5
1Cancer Research Institute of Medical Science, The Catholic University of Korea, Seoul, Republic of Korea; 2Brain Tumor Center, Department of Neuro-Oncology, The University of Texas MD Anderson Cancer Center, TX, USA; 3Cancer Rehab Laboratory, RH Healthcare Systems Inc, TX, USA; 4Harvard Medical School and Wellman Center for Photomedicine, Cambridge, MA, USA; 5Department of Obstetrics and Gynecology, The Catholic University of Korea, Seoul, Republic of Korea
Abstract: Paclitaxel (Taxol) resistance remains a major obstacle for the successful treatment of ovarian cancer. MicroRNAs (miRNAs) have oncogenic and tumor suppressor activity and are associated with poor prognosis phenotypes. miRNA screenings for this drug resistance are needed to estimate the prognosis of the disease and find better drug targets. miRNAs that were differentially expressed in Taxol-resistant ovarian cancer cells, compared with Taxol-sensitive cells, were screened by Illumina Human MicroRNA Expression BeadChips. Quantitative reverse transcription-polymerase chain reaction (qRT-PCR) was used to identify target genes of selected miRNAs. Kaplan–Meier survival analysis was applied to identify dysregulated miRNAs in ovarian cancer patients using data from The Cancer Genome Atlas. A total of 82 miRNAs were identified in ovarian carcinoma cells compared to normal ovarian cells. miR-141, miR-106a, miR-200c, miR-96, and miR-378 were overexpressed, and miR-411, miR-432, miR-494, miR-409-3p, and miR-655 were underexpressed in ovarian cancer cells. Seventeen miRNAs were overexpressed in Taxol-resistant cells, including miR-663, miR-622, and HS_188. Underexpressed miRNAs in Taxol-sensitive cells included miR-497, miR-187, miR-195, and miR-107. We further showed miR-663 and miR-622 as significant prognosis markers of the chemo-resistant patient group. In particular, the downregulation of the two miRNAs was associated with better survival, perhaps increasing the sensitivity of cancer cells to Taxol. In the chemo-sensitive patient group, only miR-647 could be a prognosis marker. These miRNAs inhibit several interacting genes of p53 networks, especially in TUOS-3 and TUOS-4, and showed cell line-specific inhibition effects. Taken together, the data indicate that the three miRNAs are closely associated with Taxol resistance and potentially better prognosis factors. Our results suggest that these miRNAs were successfully and reliably identified and would be used in the development of miRNA therapies in treating ovarian cancer.
Keywords: microRNA, ovarian cancer, Taxol resistance, Kaplan–Meier survival analysis
Introduction
Ovarian cancer is one of the deadliest malignancies, and is characterized by successive accumulation of multiple molecular alterations in the cells undergoing neoplastic transformation.1 At the time of diagnosis, most ovarian cancer patients have advanced stage disease (ie, stage III-IV) where the 5-year survival rate has remained unchanged for over 50 years partly due to the development of platinum and paclitaxel (Taxol; Bristol-Myers Squibb Co., New York, NY, USA) resistance.2,3 The nature of this drug resistance still remains a major obstacle for the successful treatment of ovarian cancer. Thus, screening for the drug-resistant factors is important in determining disease prognosis.
MicroRNAs (miRNAs) may have oncogene-like or tumor suppressor-like functions.4,5 Aberrant miRNA expressions have been found in many human cancers,6 and previous studies have focused on apoptosis,7 cell cycle,8 angiogenesis,9 epithelial-to-mesenchymal transition (EMT),10 and chemo-resistance.11 Upregulation of miR-451 increases cisplatin sensitivity of the non-small-cell lung cancer cell line (NSCLC) A549.12 miR-200c induces cisplatin chemoresistance in esophageal cancers through interaction with the AKT signaling pathway.13 miR-125b is upregulated in Taxol-resistant cells and targets the pro-apoptotic Bcl-2 antagonist killer 1 (Bak1), inhibiting apoptosis and causing a subsequent increase in the resistance to Taxol in cancer cells.14
These studies highlight the need to study miRNAs that are involved in drug resistance in ovarian cancers. However, conflicting data have been reported about their potential functions due to highly tissue-specific expression patterns.3 Using miRNA microarray analysis, for example, overexpression of miR-200 was reported as having association with poor or better prognosis in patients with ovarian cancer.15,16 Currently, there are no clinical implementations of differentially expressed miRNAs involved in the function of drug resistance in ovarian cancer, mainly because their validity has not yet been well established.
In this study, we employed miRNA expression profiling to identify differentially expressed miRNAs in Taxol-resistant ovarian cancer cells compared with Taxol-sensitive ovarian cancer cells. Ten profiling arrays were used and significant miRNAs were identified as prognosis markers through Kaplan–Meier survival analysis.17 For the confirmation of differential expression of miRNAs, quantitative real-time PCR (qRT-PCR) was performed for target miRNAs and showed a good agreement with the microarray assay. Also, Kaplan–Meier survival analyses as an integration-based approach were applied to identify dysregulated miRNAs in ovarian cancer using data from The Cancer Genome Atlas (TCGA).18 We first identified that three miRNAs, miR-663, miR-622, and miR-647, were significantly regulated in Taxol resistance. We also found that miRNA-663 and -622 increased the sensitivity of cancer cells to Taxol in ovarian cancer patients correlated with the better prognostic group. Our results could be used as a novel class of biomarkers for the further study of the molecular mechanism underlying Taxol resistance in ovarian cancer.
Materials and methods
Cell lines and culture
Sixteen human ovarian cancer cell lines and two human normal ovarian cell lines (IOSE386, IOSE397) were used in this study (Table 1). Most of the cell lines were kindly provided by Dr Hiroaki Itamochi,19 Department of Obstetrics and Gynecology, Tottori University, Tottori, Japan; IOSE386 and IOSE397 were from Dr Nelly Auersperg,20 Department of Obstetrics and Gynecology, University of British Columbia, Vancouver, BC, Canada; and SKOV3 was from Dr Ie-Ming Shih,21 Department of Gynecology and Obstetrics, The Johns Hopkins Hospital, Baltimore, MD, USA. Most of the cells were maintained in Roswell Park Memorial Institute (RPMI)-1640 medium (Sigma-Aldrich, St Louis, MO, USA) with 10% fetal bovine serum (FBS) in a humidified atmosphere containing 5% CO2 at 37°C. TUOS-3 and TUOS-4 cells were maintained in Dulbecco’s Modified Eagle Medium (DMEM)/F12 medium (Sigma-Aldrich) with 10% FBS, and in 5% CO2 at 37°C. IOSE386 and IOSE397 cells were maintained in DMEM medium with 10% FBS in 10% CO2 at 37°C. For the cell maintaining, both Taxol-sensitive and -resistant cell lines were used in their passage number ~15s.
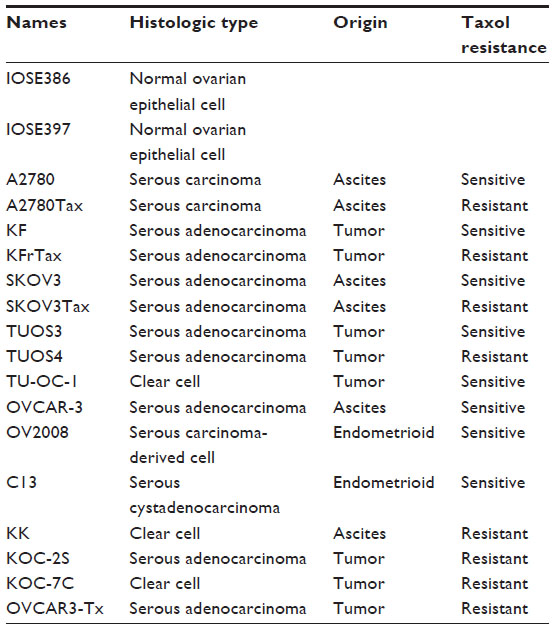 | Table 1 Characteristics of ovarian cancer cell lines |
Viability assay
To evaluate sensitivity to Taxol, the cells were washed with fresh medium and exposed to Taxol (10 nm, 50 nM, 100 nM, 200 nM, 500 nM, and 1,000 nM). The cells were then further incubated at 37°C for 3 days. After incubation with Taxol for 3 days, 100 μL of 3-(4,5-dimethylthiazol-2-yl)-2,5-diphenyltetrazolium bromide (MTT) solution (2 mg/mL) was added to each well and cultured for 4 hours. The viability assays was conducted as described previously.22 The insoluble product formed by viable cells was dissolved by the addition of 100 μL of dimethyl sulfoxide (DMSO) to each well for 10 minutes. The absorbance was measured with a SpectraMax 340 automated spectrophotometric microtiter plate reader (Molecular Devices, Sunnyvale, CA, USA) using a 570 nm filter. The morphological changes of the cells were determined by optical microscopy. A statistical difference of P<0.05 was considered significant.
miRNA expression profiling
Total RNA was extracted from cells using TRIzol reagent (Invitrogen, Carlsbad, CA, USA). Two hundred nanograms of total RNA from each cell line were labeled and hybridized on Human v2 MicroRNA Expression BeadChips (Illumina, San Diego, CA, USA), according to the manufacturer recommendations (Illumina MicroRNA Expression Profiling Assay Guide).23 The raw intensity of the Illumina v2 MicroRNA expression array was scanned and extracted using BeadScan (Illumina), with the data corrected by background subtraction in GenomeStudio (Illumina).24 The lumi package in the R-based Bioconductor Package was used to normalize the log2 transformed intensity data with the Quantile normalization algorithm. For data quality control, we excluded the probes with detection P>0.05 (the P-values were generated in BeadStudio software) across 75% of the samples. Probe mapping for Illumina MicroRNA Expression v2 BeadChips was based on miRBase (v.12.0; Faculty of Life Sciences, University of Manchester, Manchester, UK).25 For each comparison, we obtained the list of differentially expressed miRNA constrained by P<0.05 and then checked for candidates with at least 1.5-fold expression change. Hierarchical clustering based on the average linkage was employed. Using MiRTar (http://mirtar.mbc.nctu.edu.tw/human/) and PicTar (http://pictar.mdc-berlin.de/), we obtained the list of genes predicted to be targeted by the miRNAs identified from each comparison.
qRT-PCR analysis
Total RNA was isolated from cells according to the manufacturer’s recommendations using TRIzol and the Absolutely RNA kit from Stratagene (LaJolla, CA, USA). Total RNA (2 μg) was reverse transcribed in a total volume of 20 μL using 200 U of Superscript II reverse transcriptase (Invitrogen), 100 pmol oligo-dT, 0.5 mM dNTP, and 40 U RNasin (Promega, Madison, WI, USA). The resulting complementary (c)DNA was diluted 1:10 with nuclease-free water. Five microliters of diluted cDNA was used in subsequent PCR reactions. The PCR amplification protocol was 50°C for 2 minutes and 95°C for 10 minutes followed by 40 cycles of 95°C for 30 seconds, 60°C for 30 seconds, and 72°C for 30 seconds. The real-time PCR analysis was performed on a C1000™ Thermal Cycler (CFX 96™ Real-Time System, BioRad, Munich, Germany). All qRT-PCR reactions were carried out in triplicate. Relative quantification with the data obtained was performed according to the user’s manual. The results are presented as transcript levels relative to the levels in untreated control cells with average mRNA levels of internal control gene, glyceraldehyde-3-phosphate dehydrogenase, used as the normalization control. To verify changes in gene expression, real-time PCR was carried out on selected genes. All primers were designed based on nucleotide sequences retrieved from Genbank using the Primer Express software (Applied Biosystems, Foster City, CA, USA). The fold-change (ratio) in gene expression between cancer samples and normal samples was calculated by using threshold cycle (CT).22 All primer sequences are provided in Table S1.
qRT-PCR analysis of miRNA expression
qRT-PCR was performed on the selected miRNA candidates to validate the miRNA array results. The GenoExplorer miRNA First-Strand cDNA Core Kit (2002-50, GenoSensor Corporation, Tempe, AZ, USA) was used to generate miRNA first-strand complementary DNA. miRNA expression levels were measured using SYBR Green (Takara, Kyoto, Japan). miRNA-specific forward primers and a universal reverse primer were purchased (GenoSensor Corporation). The reaction conditions were 15 minutes of denaturation at 94°C followed by 45 cycles of 94°C for 30 seconds, 59°C for 15 seconds, and 72°C for 30 seconds. Melting curve analysis was used to assess the specificity of the amplified product. All qRT-PCR reactions were carried out in triplicate. Threshold cycle (CT) for each miRNA was obtained after normalizing to U6 snRNA Forward (5′-CTCGCTTCGGCAGCACA-3′) and Reverse (5′-AACGCTTCACGAATTTGC GT-3′).
Analysis of the TCGA data for ovarian cancer
Ovarian cancer TCGA miRNA microarray data of level 3 were obtained from the Data Access Matrix (http://tcga-data.nci.nih.gov/tcga/tcgaHome2.jsp).26 miRNA experiments were performed on the Agilent 8 × 15 K human miRNA-specific microarray V2 platform (Santa Clara, CA, USA) measuring the expression of 821 miRNAs. Five hundred and ninety-five TCGA miRNA data with clinical information were reprocessed using the R statistical computing platform and packages from the Bioconductor bioinformatics software project (http://www.r-project.org). Of these, we retained only 479 samples that had clinical information data. Two independent filters were applied to miRNAs to remove low-level signal intensity or not expression in ovarian cancer tissue. In the first, miRNAs with <10% “present” and “marginal” calls were removed. In the second, miRNAs containing >10% of accumulated zeros across samples were removed. miRNAs that were significantly changed were analyzed further. A t-test assessed whether the means of the two groups were statistically different from each other. Then, we performed unsupervised and supervised hierarchical clustering based on the most variably expressed miRNAs using the Euclidean distance as the similarity metric and the complete linkage method as the between-cluster distance metric.
Survival-associated miRNA analysis
The TCGA ovarian dataset consisted of 479 samples that had clinical information data with miRNA expression and of these, 90 patients were classified as chemo-resistant and 195 patients were categorized as chemo-sensitive. To identify miRNAs whose expression most strongly correlated with survival, each sample was assigned to two groups based on the expression of each miRNA: a low expression group and a high expression group. We then performed Kaplan–Meier survival analysis (Kaplan–Meier plots vs survival times, log-rank t-test <0.05) and estimated the survival distributions and used the log-rank test to assess the statistical significance of the differences between the stratified survival groups using GraphPad Prism (v5; GraphPad Software, San Diego, CA, USA).27,28
Results
Profiles of miRNAs in ovarian cancer cells and normal ovarian cells
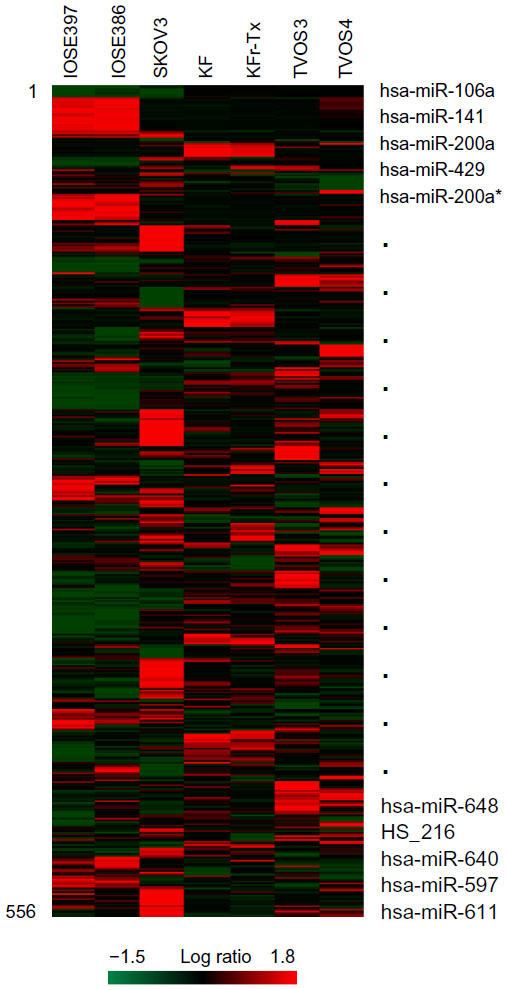
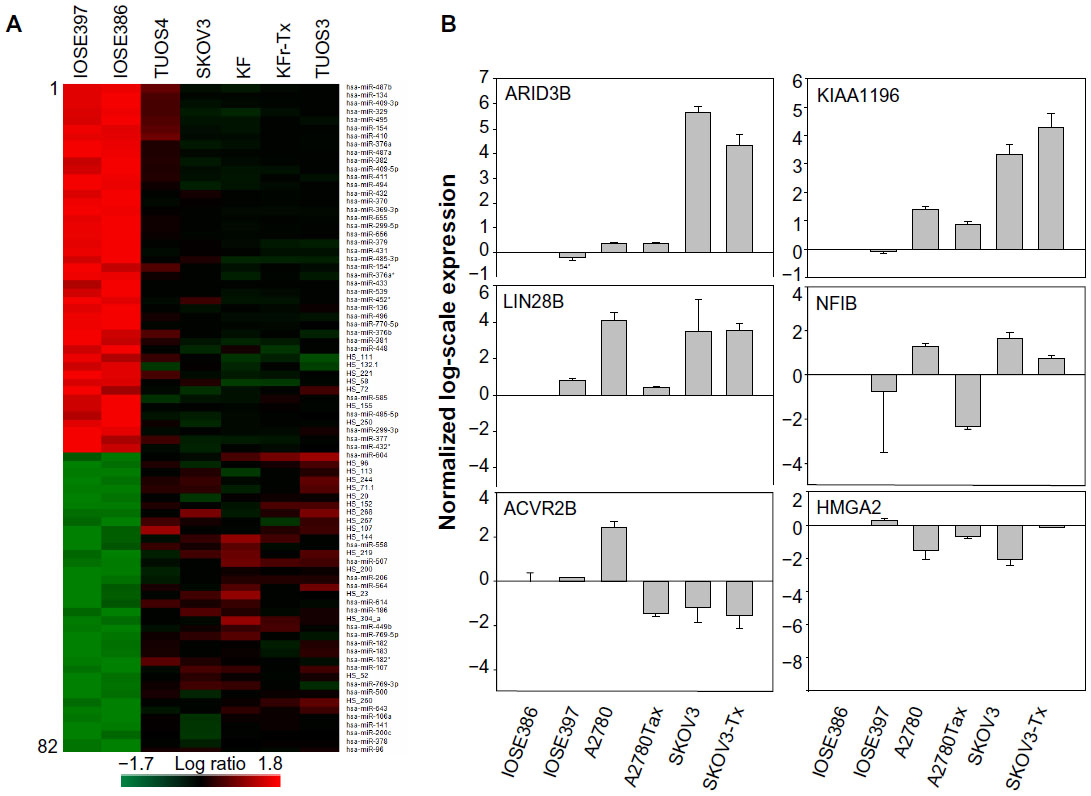
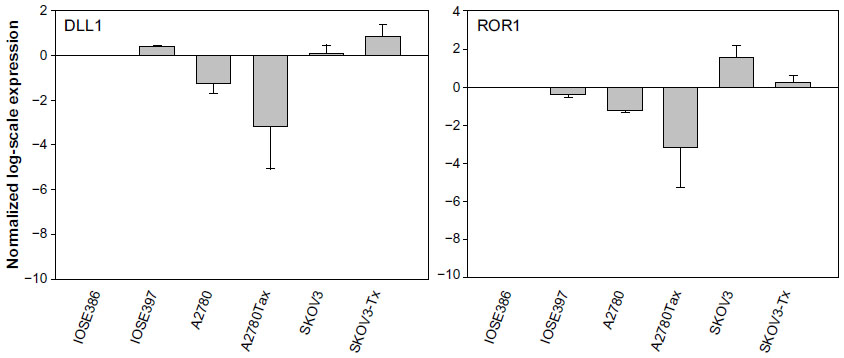
To identify genome-wide miRNA expression patterns that could be useful to classify ovarian cancer cells from normal ovarian cells, we first analyzed the Illumina miRNA bead array using five human ovarian cancer cell lines (KF, KFr-Tx, TUOS-3, TUOS-4, and SKOV3) and two human normal ovarian cell lines (IOSE386, IOSE397). The total RNA extracted from ovarian cancer cells and normal ovarian cells was hybridized with miRNA array chips. The expression-detection P-value of Illumina Expression BeadChips was used to quantify the number of miRNA detected in the cell lines, designed to test the null hypothesis that the expression intensity of a given miRNA is indistinguishable from the background intensity. Individual miRNAs were examined using the detection P-value metric provided by Illumina, in which the signal generated from each miRNA is compared to negative controls. miRNAs that did not reach this threshold were eliminated from the analysis. Among a total of 1,145 miRNAs profiled by the chips, 556 miRNAs passed the initial filters and were selected. We employed an unsupervised hierarchical clustering based on the variation of expression for each miRNA across the specimens (Figure S1 and Table S1). After this step, we selected only those miRNAs with P<0.01. This analysis identified 45 upregulated miRNAs and 37 downregulated miRNAs, compared with the control, and allowed the robust segregation of two groups (Figure S2A and Table S2). The clustering results demonstrated that the lists of differentially expressed miRNAs might serve as potential biomarkers in ovarian cancer detection. As shown in Table 2, the highly overexpressed miRNAs in the ovarian cancer cells included miR-141, miR-106a, miR-200c, miR-96, and miR-378. Highly underexpressed miRNAs in the ovarian cancer cells included miR-411, miR-432, miR-494, miR-409-3p, and miR-655. miRNAs can regulate a large number of target genes and several databases based on various algorithms are available for predicting the targets of selected miRNAs. MiRTar and PicTar were used to predict the target genes of the deregulated miRNAs with a mean fold-change >5.0. Table S3 lists the predicted targets among a large number of target genes. In order to validate the target gene expression, qRT-PCR was performed on several genes found to be targets of the miRNAs (Figure S2B) using each gene-specific primer pair. The expression ratio of cancer to normal cell IOSE386 was calculated by using CT and then was log2 transformed. While the absolute values were different, the trends were similar. ARID3B, KIAA1196, LIN28B, and NFIB were overexpressed in the ovarian cancer cells, while ACVR2B and HMGA2 were underexpressed in these cells. DLL1 and ROR1 were cell line-specific in these cells (Figure S3). These analyses demonstrated that ovarian cancer cells contain a large amount of detectable miRNAs that provide a valuable repertoire that could be used to discover drug-resistant miRNA as a biomarker signature for ovarian cancer.
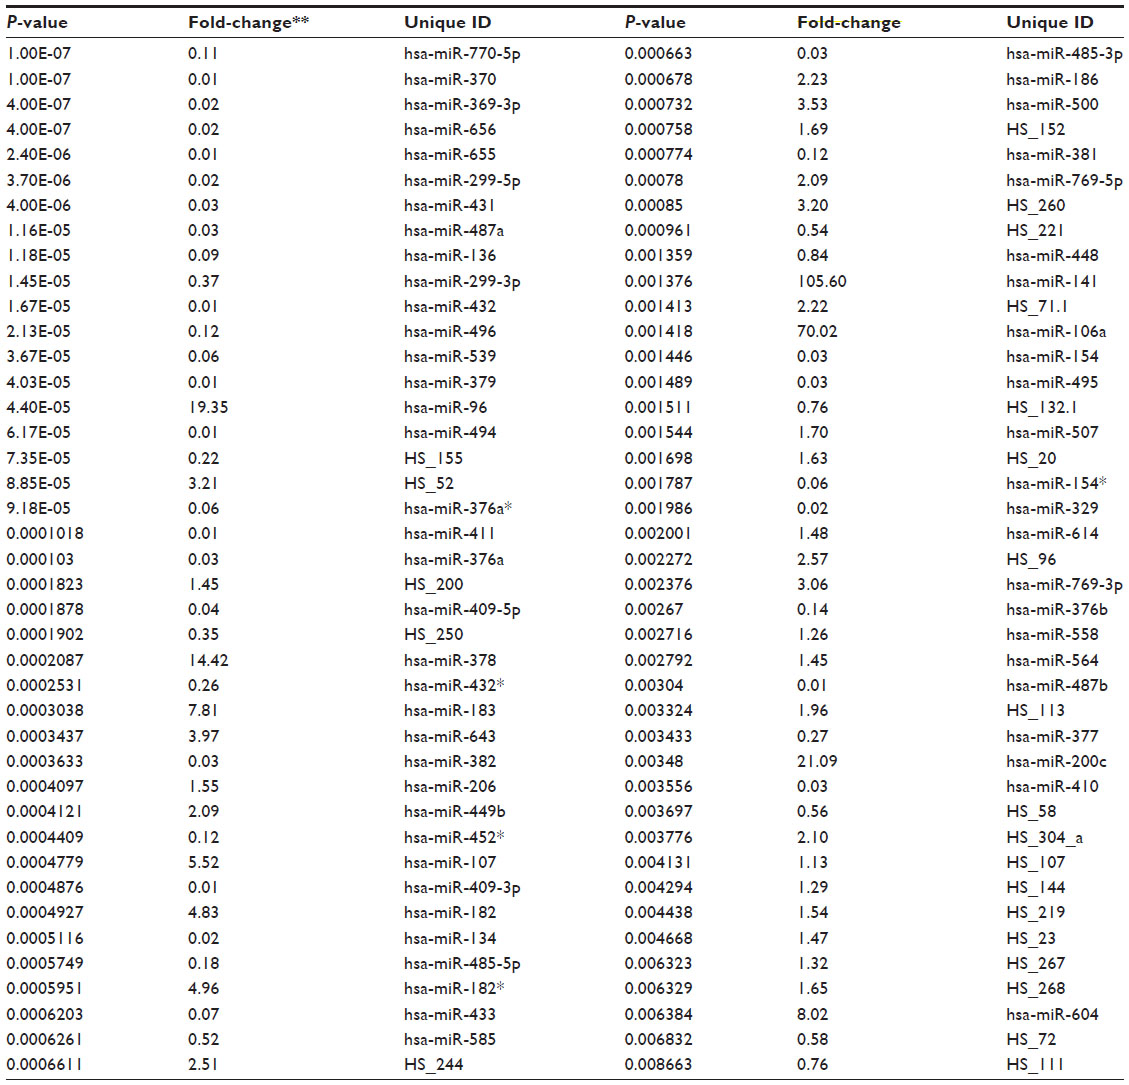 | Table 2 Differentially expressed miRNAs |
Profiles of miRNAs in Taxol-sensitive and -resistant ovarian cancer cells
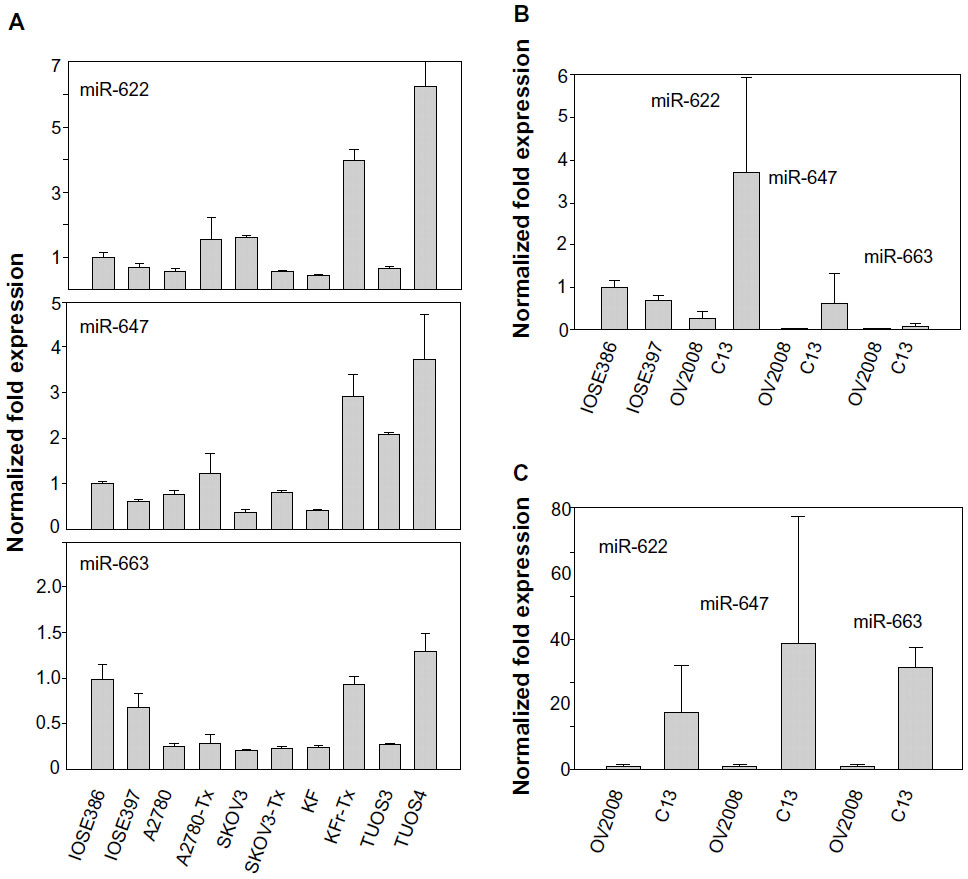
To search for the critical miRNAs involved in Taxol resistance, Taxol-sensitive versus Taxol-resistant miRNA expression comparisons were conducted for four ovarian cancer cell lines. Taxol resistance was confirmed using MTT assay. We showed growth inhibition effects of Taxol on several cell lines (Figure S4). Measurement of mitochondrial metabolic rate using MTT to indirectly reflect viable cell numbers has been widely applied. It could be suggested that the metabolic activity of the cells may not be changed by Taxol treatments which can cause considerable variation in results. We first analyzed the detection P-value of Illumina Expression BeadChips to determine differentially expressed changes in the Taxol-sensitive and -resistant ovarian cancer cells. Using this method, we identified 17 miRNAs at the significance level of P<0.05 (Table 3). This approach including seven upregulated and ten downregulated miRNAs, was able to robustly segregate two prognosis groups (Figure 1A). qRT-PCR was performed to confirm miRNA expression patterns in this study. As shown in Figure 1B, several miRNAs (miR-622, miR-647, and miR-663) confirmed the patterns obtained from the microarray and showed the consistency of the assays in KF/KFr-Tx and TUOS-3/TUOS-4. These three miRNAs were also confirmed to be upregulated in these Taxol-resistant cells, compared with normal IOSE386 and IOSE397 cells (Figure S5A). However, there was no significant regulation in A2780/A2780-Tx and SKOV3/SKOV3-Tx. Only miR-622 was upregulated in C13 Taxol-sensitive cells, compared with normal IOSE386 and IOSE397 cells (Figure S5B and C). The trend of expression alteration of these miRNAs showed a cell line-specific effect.
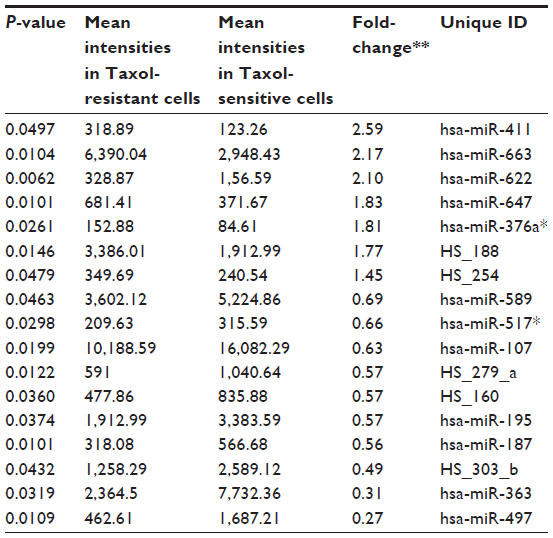 | Table 3 Differentially expressed miRNAs |
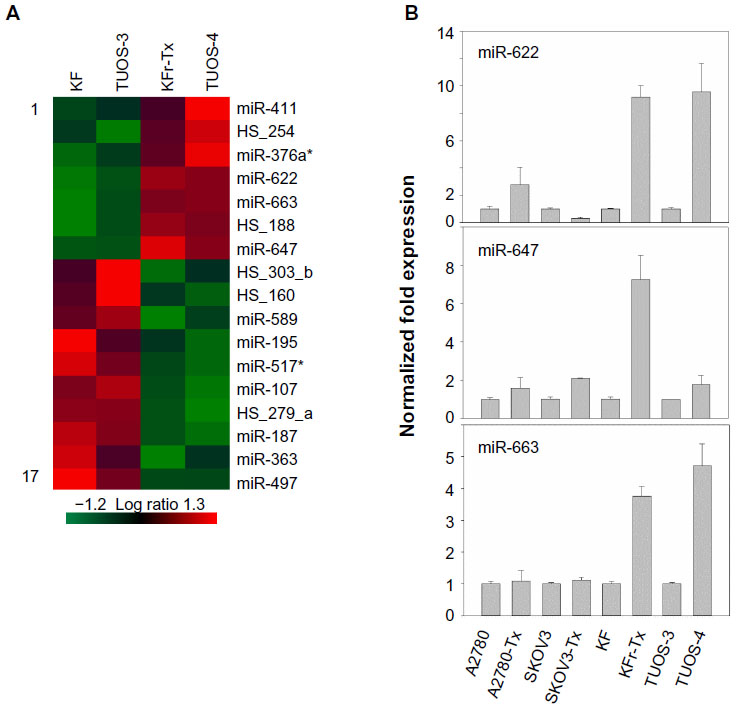 | Figure 1 Differential miRNA expression signatures between two Taxol-resistant cells and two Taxol-sensitive cells. |
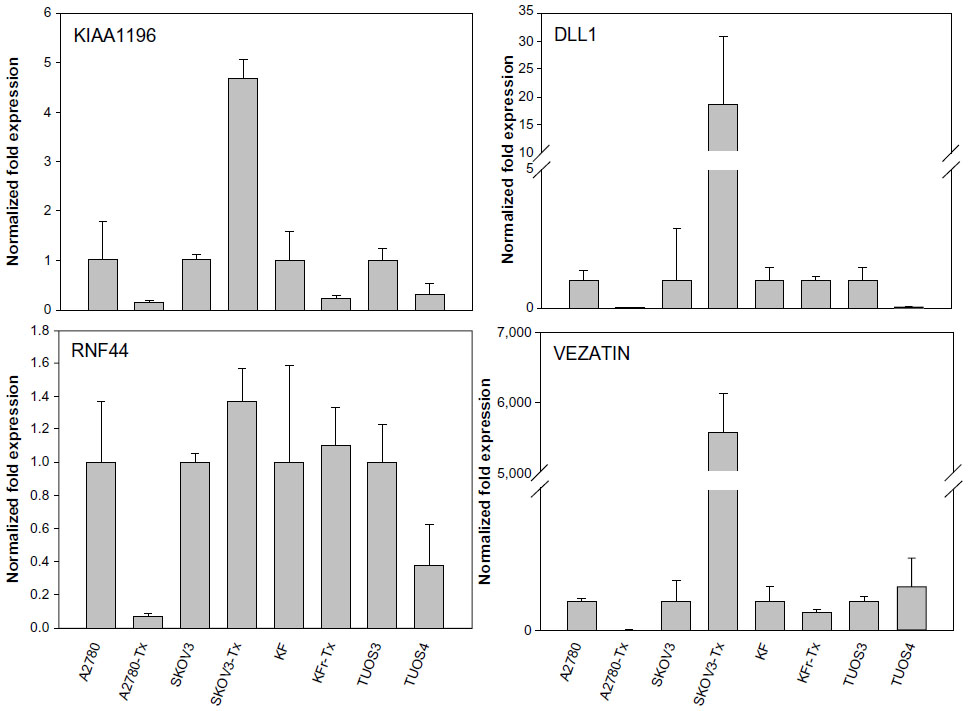
miR-663, miR-622, and HS_188, which were overexpressed in Taxol-resistant cells, might have oncogene-like functions.4,29,30 Of the underexpressed miRNAs, miR-497, miR-187, miR-195, and miR-107 might have tumor suppressor-like functions (detailed in the ‘Discussion’ section).5,31–34 Remarkably, there are only three miRNAs (miR-411, miR-376a*, and miR-107) overlapping from the differentially expressed 82 miRNAs. While miR-107 was underexpressed in the resistant cell lines compared to sensitive cells, it was overexpressed in the ovarian cancer cell lines compared to the normal ovarian cells. Both miR-411 and miR-376a* were overexpressed in the normal ovarian cells as shown in Table 2. As a result of this multiphase analysis, we selected a profile of 17 miRNAs to be the potential signature for Taxol resistance. Table S4 also lists the predicted targets among a large number of target genes according to miRTar for each differentially expressed miRNA. In order to validate the data, qRT-PCR was performed on several genes found to be targets of miRNAs. As shown in Figure 2, IQSEC2, HRG22, FLOT2, LYPLA2, and NFIB were underexpressed in the Taxol-resistant ovarian cancer cells, while PAPSS2 was overexpressed in the Taxol-sensitive ovarian cancer cells. The trend of the expression alteration of KIAA1196, DLL1, RNF44, and VEZATIN showed a cell line-specific effect (Figure S6), indicating that the correlation between miRNAs and Taxol resistance is not always consistent.
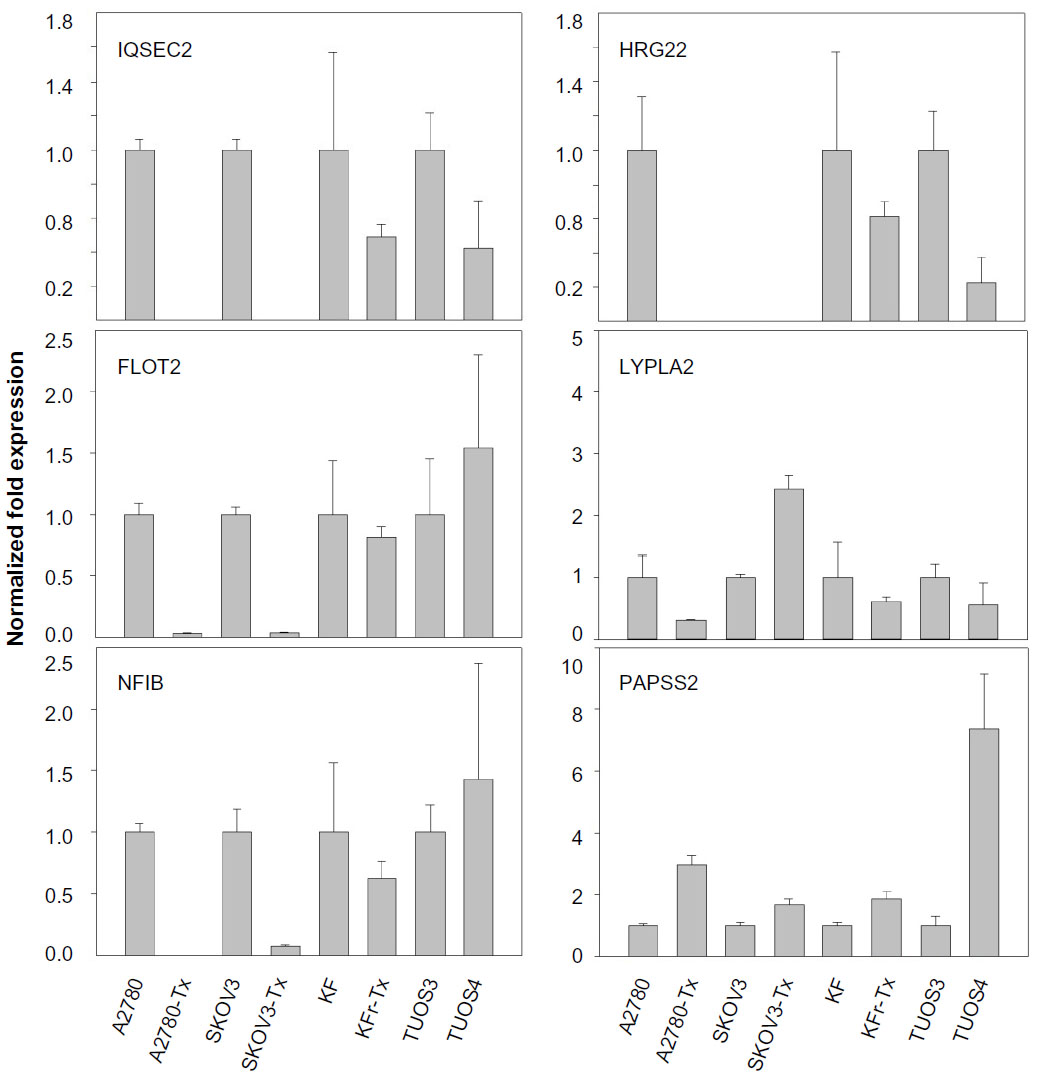 | Figure 2 Fold changes (Taxol-resistant ovarian cancer cells/parental Taxol-sensitive cells) in gene expression measured by qRT-PCR. |
Survival analysis for miRNAs correlated with Taxol resistance
The TCGA ovarian dataset consisted of 479 patients samples for which clinical information data concerning miRNA expression were available. The clinical data were available for the samples, including age, days to death, days to tumor progression, and age at initial pathologic diagnosis. To identify a biomarker signature of miRNAs whose expression most strongly correlated with survival, each patient sample was assigned to two groups based on the expression of each miRNA: a low expression group and a high expression group. We carried out survival analysis using the Kaplan–Meier plots and log-rank survival analyses in terms of up- and downregulated miRNAs. The significant difference in overall survival (P<0.05) between the up- and downregulation groups was observed in 142 miRNAs (Table S5). The overall survival was increased with upregulation of 34 miRNAs including miR-505, miR-652, miR-148a, and miR-let-7i (Figure 3A). On the other hand, overall survival was decreased with upregulation of 32 miRNAs including miR-320, miR-193b, miR-801, and miR-135a* (Figure 3B). These analyses demonstrate that several detectable miRNAs can be used to discover prognostic miRNA as a biomarker signature for ovarian cancer.
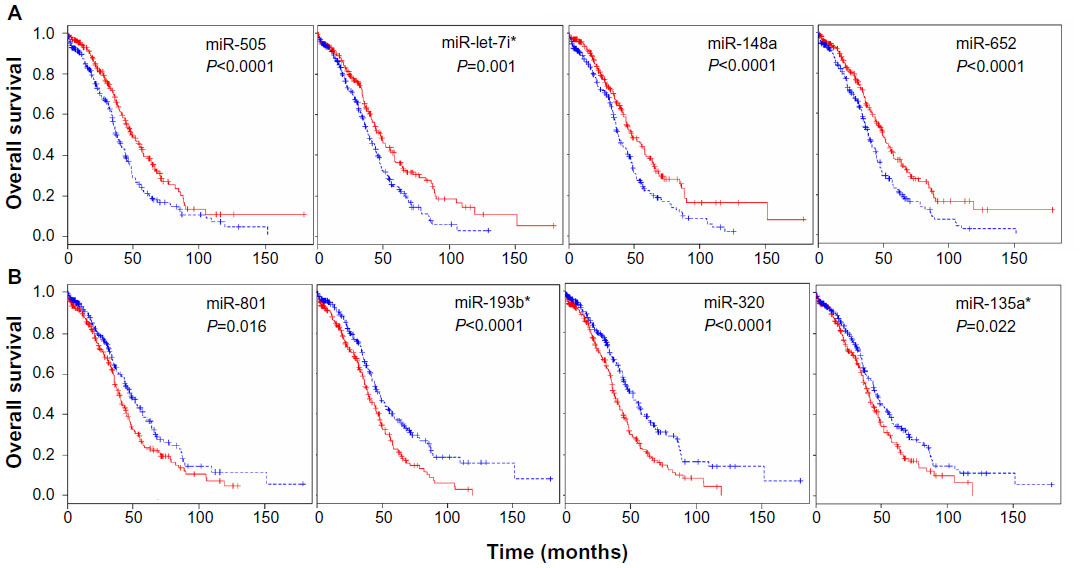 | Figure 3 miRNA expression-dominant groups correlated with survival. |
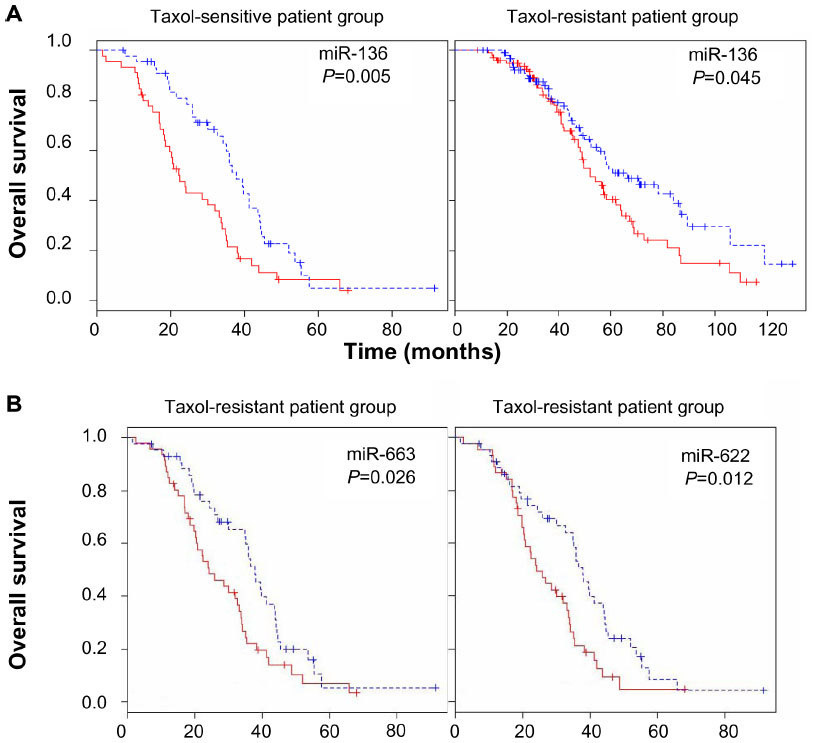
Survival analysis was also performed to identify miRNAs whose expression most strongly correlated with chemo-resistance. Following surgery, all patients received chemotherapy, which is considered the standard care for patients with advanced ovarian cancer. The patients showing either progression during chemotherapy or relapse within 6 months of treatment are considered chemo-resistant. Among the aforementioned 479 patients, 90 patients were classified as chemo-resistant and 195 patients were categorized as chemo-sensitive.35 The median survival of the chemo-sensitive group was markedly longer (43.72 months) than that of the chemo-resistant group (28.13 months). To consider chemo-resistance and miRNA expression simultaneously in the prediction of overall survival, Kaplan–Meier survival analysis was carried out with expression information of miRNAs and chemo-resistance information of the patients. The significant difference in overall survival (P<0.05) between up- and downregulation of miRNAs was observed in 129 miRNAs and 70 miRNAs in the sensitive and resistant patient groups, respectively (Table S6 and Table S7). In this analysis, only miR-136 showed longer survival with underexpression compared to overexpression in the sensitive and resistant group (Figure S7). In comparison with the miRNAs in Table 3, Kaplan–Meier analysis demonstrated the significant difference between over and underexpression of the resistant group in two miRNAs including miR-663, and miR-622 (Figure 4), while the expression difference of the two miRNAs showed no significant effects in the sensitive group. Only miR-647 showed slight significance between over- and underexpression in the sensitive group, while it showed no significance in the resistant group. Thus, in the case of miR-663 and miR-622, the less expressed, the longer the patient survived (more than 1 year of median survival) in the chemo-resistant group. Also, regarding miR-647, the more expressed, the longer the patient survived in the chemo-sensitive group. The differential expressions of the miRNAs are identified from the training dataset, but have not been validated with external dataset. Therefore, to have prediction power for Taxol resistance of ovarian cancer, we validated the prediction power of the differentially expressed miRNAs using cross validation using a smaller number of dataset (Figure S7). Taken together, the overall survival of patients carrying chemo-resistance markedly would be increased with a treatment for the underexpression of these two miRNAs, while the chemo-sensitive patients with overexpression of miR-647 would show good prognosis. These results suggest that the differential expressions of the miRNAs are reliable, and that several miRNAs may play a role in Taxol resistance of ovarian cancer cells.
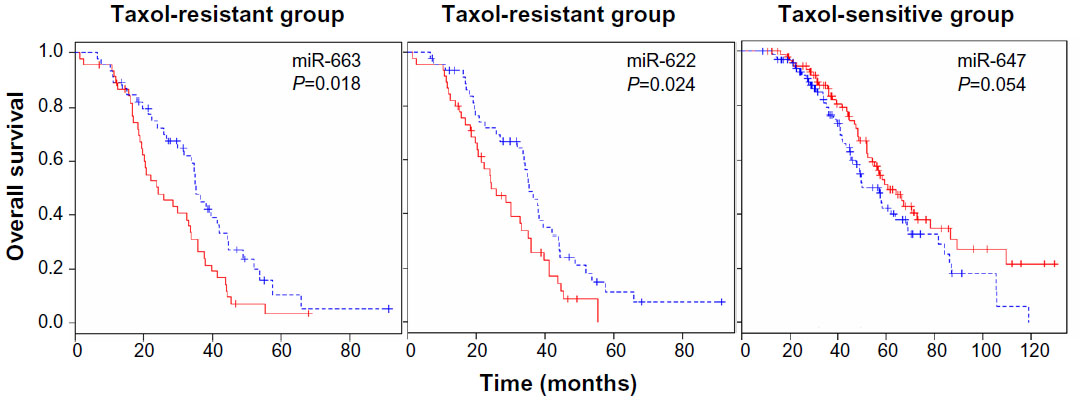 | Figure 4 miRNA expression-dominant groups correlated with Taxol resistance. |
Differential correlations of miR-663, miR-622, and miR-647 with p53 networks
We used TargetScan Context Score, in silico miRNA target prediction algorithms and identified targets of miR-663, miR-622, and miR-647. For each miRNA, we first identified the putative miRNA target sites predicted by the TargetScan miRNA target prediction database (context score ≤−0.5) (Table S8, Table S9 and Table S10) and found that there are several p53 interactors. It is well known that p53 acts as a key regulator of ovarian cancer. In order to investigate the connection between miRNAs targeting of p53 network and Taxol resistance, we first performed a Western blot for the basal level of p53 networks. As shown in Figure 5, Taxol resistance cells (A2780-Tx and KFr-Tx) reduced the basal expression of p53, while its interacting targets, including p21, Rb, and PTEN, were reduced only in A2780-Tx. p21 has higher expression in two Taxol-resistant ovarian cancer cells (KFr-TX and KOC-7C), suggesting that p21 expression can be regulated independently of p53. However, Taxol resistance did not enhance the basal expression of CDK2, Cyclin D1, and CDK4. The basal expression of MDM2 was only enhanced in A2780-Tx and KFr-Tx. p53-null SKOV-3 cells did not show any basal expression of p53 and its interacting targets, including p21 and Rb. This analysis showed that several proteins of p53 networks were differentially expressed in the Taxol-resistant cells compared to both parental Taxol-sensitive cells, suggesting that Taxol resistance selectively blocks the p53 networks and showed cell line-dependency. Thus, the p53 pathway as a molecular signature in the Taxol resistance showed a different feature of expression pattern of each of the interactors, suggesting different interaction patterns of the p53 networks in each ovarian cancer cell line.
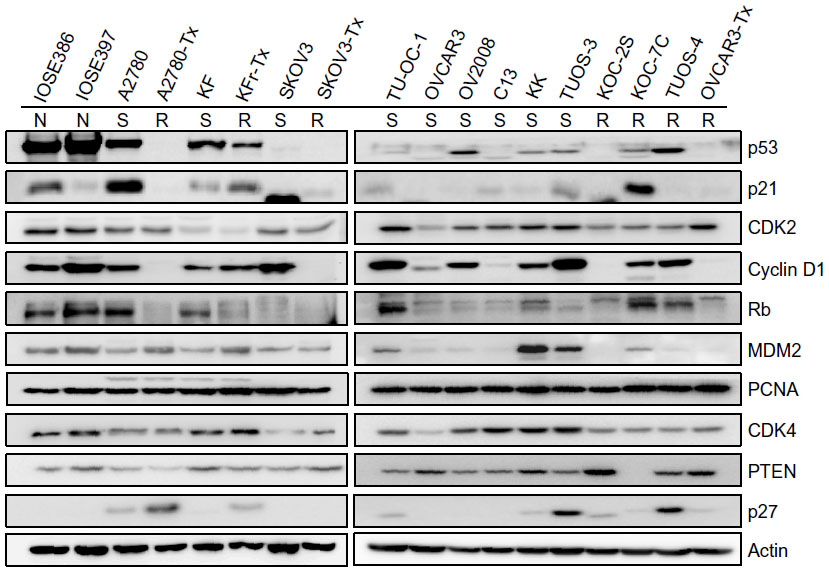 | Figure 5 Basal expression level of p53 signal transduction pathways in ovarian cancer cells. |
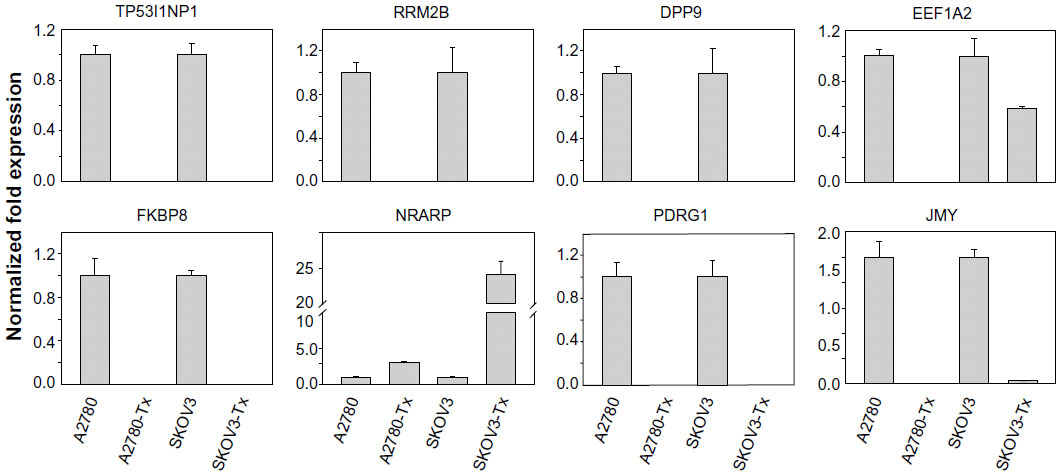
To investigate if there is any association in the interaction networks of p53 with three miRNAs in Taxol resistance, we selected several target genes of the miRNAs from the latest version of the TargetScan (Release 6.2) that can directly/indirectly interact with p53 (Table S11). Then, we performed qRT-PCR using each gene-specific primer pair. As shown in Figure 1B, three miRNAs were highly overexpressed in KFr-Tx and TUOS-4, compared to each parental sensitive cell line. While the absolute values were different, the inhibition effects of these miRNAs on the target genes were consistent, especially in TUOS-3 and TUOS-4 (Figure 6). TP53I1NP1, RRM2B, and DPP9 were downregulated in both KFr-Tx and TUOS-4. Several target genes were only downregulated in TUOS-4, while these were overexpressed in KFr-Tx. Thus, five target genes, including EEF1A2, FKBP8, NRARP, PDRG1, and JMY, were showing the cell line-specific inhibition effects of these miRNAs. It was noted that while three miRNAs were relatively overexpressed in A2780-Tx and SKOV3-Tx, as shown in Figure 1B, we could detect significant downregulation of these target genes in A2780-Tx and SKOV3-Tx (Figure S8) compared to each parental sensitive cell line. Taken together, the results showed cell line-specific inhibition of the highly interconnected network of p53 by the miRNAs, which suggested that the specific difference of the interconnections of p53 might have important roles in Taxol-resistance of subtype patients in ovarian cancer.
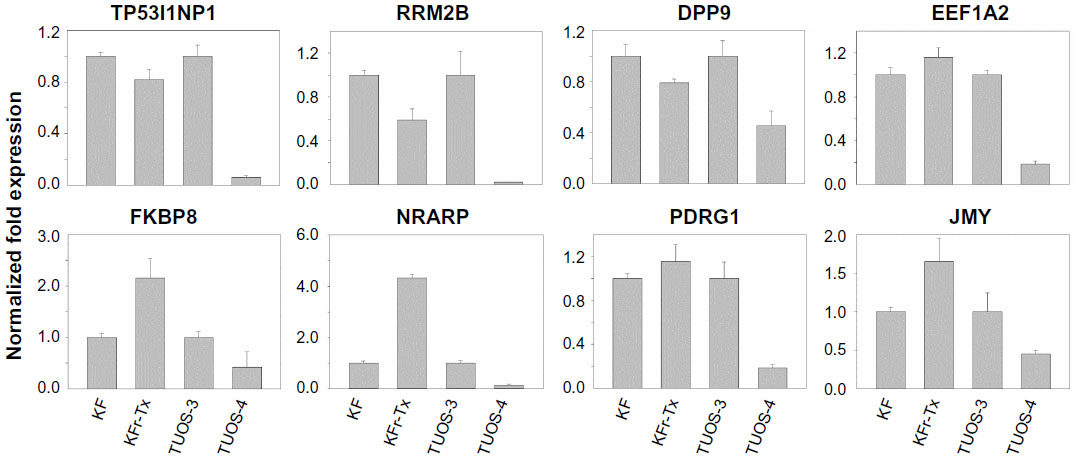 | Figure 6 Inhibition effects of target genes of three miRNA in KF/KFr-Tx and TUOS-3/TUOS-4. |
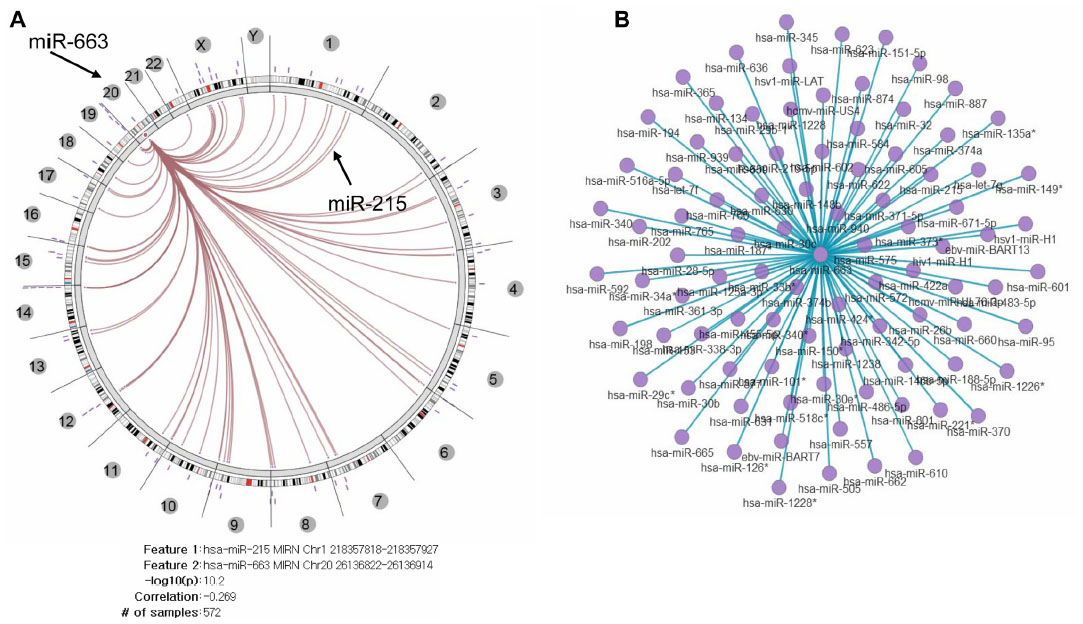
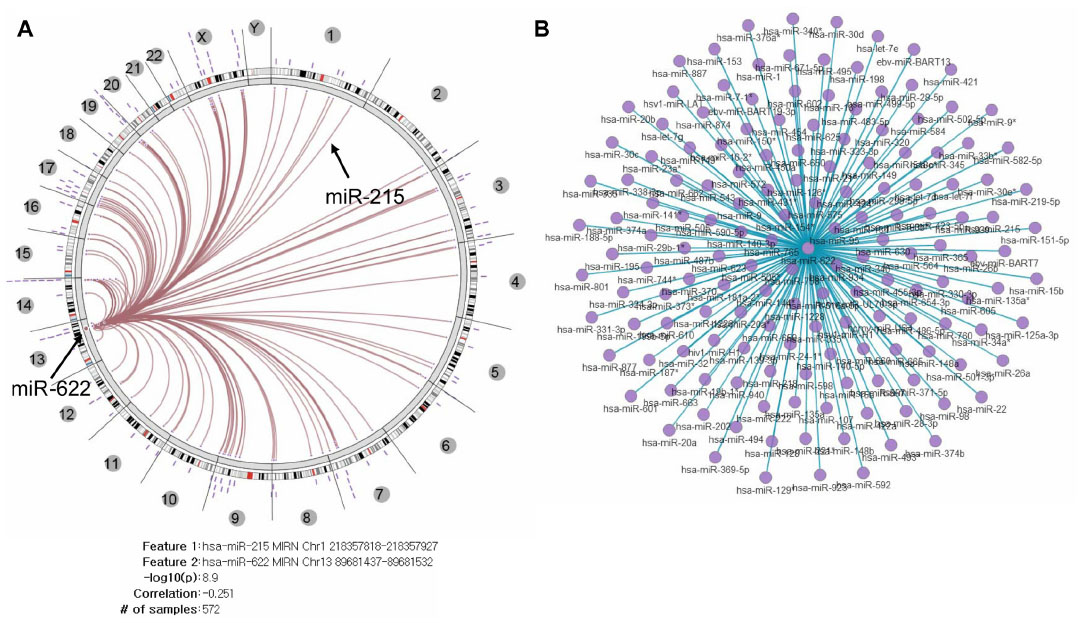
To investigate if there is an association pattern in the interaction networks of other miRNAs with three miRNAs in 572 TCGA ovarian cancer tissue samples, we used Regulome Explorer, which facilitates the integrative exploration of associations in clinical and molecular TCGA data by providing a wide-ranging view of connections between mutations, expression level changes, and clinical outcomes.36 The molecular data included all of the miRNA expression levels of high-throughput data. We selected two miRNA (miR-663 and miR-622) to explore any significant pairwise associations discovered within a heterogeneous dataset (Figures S9 and S10). In the large number of pairwise tests, miR-215 was selected as one of the most significant associations in a database for subsequent interactive exploration. The results of the miR-215 pairwise test include the number of samples used in the test, the Spearman correlation, and the –log10 (P-value). Integrated Circos plot shows a predicted regulatory relationship between a miRNA and a miRNA, suggesting that both miR-663 and miR-622 regulate tens of miRNAs.
Discussion
Ovarian cancer is the most common cause of death among gynecologic malignancies. The 5-year survival rate in ovarian cancer patients with early stage cancer is about 50%–95%, and 11% in the advanced stages (III/IV).37 Despite an initial response rate of 65%–80% to first-line chemotherapy, most ovarian carcinomas relapse. Acquired resistance to further chemotherapy is generally responsible for treatment failure. The alteration of miRNA regulation has been implicated in carcinogenesis and disease progression.38 Most miRNA expression profiling studies of ovarian cancer have searched for differentially expressed miRNAs as novel drug targets relative to the corresponding normal control.39,40 Several studies with large datasets have also sought to identify an intricate array of genomic changes that correlate with clinical outcome, to validate one specific change that occurs in the vast majority of all ovarian cancers.26,35 The possibility of miRNA expression profiles to predict outcomes in cancer patients has been shown.41 In particular, the miR-200 cluster has been associated with survival in ovarian cancer.16 Roles of miR-23a, -27a, -449b, -21, and -24-2* in response to chemotherapy in ovarian cancer tissues and cell lines have also been demonstrated and associated with chemo-responsiveness.42,43 Another study showed that expression of miR-27a is upregulated in the multidrug resistant (MDR) ovarian cancer cell line compared to its parental (A2780) cell line.44 These miRNAs may contribute to poor prognosis or chemotherapy resistance through their effect on their complexes. Some miRNAs, such as miR-29a, miR-31, miR-93, and miR-451, were found to be up- or downregulated in ovarian cancer cells characteristic of altered or Cisplatin-resistant phenotype.12,26,45,46 But, the detailed mechanisms underlying resistance to Taxol in ovarian cancer cells are not understood.14 Only a few miRNA profiles have been reported with a potential involvement of miRNAs in the development of chemoresistance using a panel of paclitaxel-resistant (A2780TAX, A2780TC1, and A2780TC3) and cisplatin-resistant (A2780CIS) cell lines and showed downregulation of miRNA-30c, miRNA-130a, and miRNA-335 in all the resistant cell lines.14,47 It was also reported that genotypic differences lead to tissue-specific expression patterns3 and cell line-specific effects of miRNAs in ovarian cancer.45
In this study, we aimed to examine the role of miRNAs in Taxol resistance and to identify an oncogenic or tumor suppressor-like function involved in Taxol resistance. We identified 17 differentially expressed miRNAs using a panel of Taxol-resistant ovarian cancer cells with their Taxol-sensitive parental cells, and large set of TCGA ovarian data. Our data suggests that seven upregulated miRNAs (including miRNA-411, miRNA-663, and miRNA-622) and ten downregulated miRNAs (including miRNA-497, miRNA-363, and miRNA-303b) found in the Taxol-resistant ovarian cancer cells could contribute to the sensitivity of ovarian cancer cells. We recently found that several of the miRNAs that are overexpressed in Taxol-resistant cells were reported as having oncogene-like functions, such as miR-663, miR-622, and HS_188.4,29,30 Of the underexpressed miRNAs, several were reported as having tumor suppressor-like functions, such as miR-497, miR-187, miR-195, and miR-107.5,31–34 These miRNAs were involved in various biological processes, including apoptosis, signal transduction, and immune response. For example, miR-663 is associated with cancer.48 It was demonstrated that miR-663 is upregulated in nasopharyngeal carcinoma cells, and functions as an oncogene by promoting cell growth and tumorigenesis.29 Furthermore, p21 was characterized as a direct and functional target of miR-663. Among differently expressed miRNAs in pancreatic adenocarcinoma compared with chronic pancreatitis, miR-622 has not been related to the diagnosis of pancreatic cancer and is one of the most differentially expressed miRNAs.4 The association of the expression level of HS_188 with survival in the signatures was shown as highly predictive of the survival of stage I NSCLC patients, demonstrating that miRNA expression signatures combined with stage information has high classification power to predict the survival of stage I NSCLC patients.30 On the other hand, the expression level of miR-497 in breast cancer tissues is greatly decreased when compared with those in the normal adjacent tissue.31 miR-497 has a similar function in tumor suppression in breast cancer that suppresses breast cancer cell proliferation and induces apoptosis. The tumor suppressor-like miR-187 is expressed at higher levels in ovarian cancers than in benign tumors.5 In patients with ovarian cancer, higher levels of miR-187 expression were paradoxically associated with better overall survival and recurrence-free survival, possibly through regulation of Dab2-mediated EMT. Downregulation of miR-195 has been observed in various types of cancers.49 The ectopic expression of miR-195 dramatically suppresses HCC cells to form colonies in vitro and to develop tumors in nude mice.32 Moreover, miR-195 could block the G1/S transition and have functional targets of miR-195, including cyclin D1, CDK6, and E2F3. It was also reported that miR-107 is a miRNA expressed by human colon cancer specimens and regulated by p53.34 Also, miR-107 could block hypoxic signaling by suppressing HIF-1β expression. These findings suggest that our in vitro study showed good consistency in oncogene-like and tumor suppressor-like functions, and the important role of those miRNAs in Taxol resistance with implications for cancer therapy.
Current methods of miRNA expression profiles provide several numbers of false positives. To narrow down the list of potential target of miRNAs, we used the intersection of the TCGA ovarian dataset, Kaplan–Meier plots, and log-rank survival analyses. An initial report from TCGA on high-grade serous ovarian adenocarcinomas presented a broad molecular signature of the disease relative to the corresponding normal control.35 We further investigated drug resistance-inducing miRNAs using the TCGA ovarian cancer clinical data (survival and recurrence status). Survival analysis based on miRNA expression profiles identified two groups showing a contrast in the expression pattern. One group including miR-505, miR-652, miR-148a, and miR-let-7i was upregulated with longer overall survival, while overall survival was increased with downregulation of miRNAs including miR-320, miR-193b, miR-801, and miR-135a*. This was consistent with the observation that miR-148a inhibits proliferation in ovarian cancer cells and acts as a candidate tumor suppressor.3,50 In a paclitaxel-resistant NSCLC cell line, established either in vitro or in vivo, blockage of miR-135a sensitized resistant cell lines to paclitaxel-induced cell death.51 These miRNAs might be utilized as potential targets in patients with serous ovarian cancer.
The survival analysis demonstrated the significant difference between over and underexpression of miRNAs in the resistant patient group. The overall survival of patients carrying chemo-resistance markedly increased with underexpression of several miRNAs. In particular, miRNA-663 and -622, which were upregulated in Taxol-resistant cancer cells in vitro showed better survival with downregulation, perhaps by increasing the sensitivity of cancer cells to Taxol. These miRNAs inhibit several interacting genes of p53 networks, especially in TUOS-3 and TUOS-4, and showed the cell line-specific inhibition effects. The most common subtype, high-grade serous carcinoma, is characterized by p53 mutations. Thus, p53 appears impaired in ovarian cancer cell lines. However, it was reported that the cisplatin (and Taxol)-sensitive cell line (KF), and three- and 30-fold cisplatin-resistant ovarian cancer cell lines (KFr and KFrP200) both showed no p53 mutation within exon 5, 6, 7, and 8.52 Thus, even though the expression level of p21 is not associated with p53 status in KF/KFr-Tx, it is likely that p53 was not impaired in the cells. Actually, p21 expression can be regulated independently of p53. It is consistent that miR-663 was found to be upregulated in nasopharyngeal carcinoma (NPC) cells compared with human immortalized nasopharyngeal epithelium cells, and p21 was characterized as a direct and functional target of miR-663 to promote the cellular G1/S transition. As p21 is regulated by p53-dependent and -independent mechanisms at the transcriptional level, we noted from the Western blot that miR-663 selectively blocks the p21 protein and shows cell line-dependency. The huge induction of p27 was noted in Taxol-resistant A2780-Tx. It was, however, reported that p27 expression can have an anti-apoptotic effect and prevent drug-induced apoptosis by DNA-damaging agents, such as cisplatin, leading to drug resistance.53 The effect of p27, therefore, may be cell or tissue specific.54 miR-663 also contributed to lung cancer cell proliferation by regulating TGFB1, P53, Bax, and Fas directly or indirectly.55 The overexpression of miR-663 was also reported in an induced multidrug-resistant MDA-MB-231/ADM cell line and the downregulation of miR-663 sensitized MDA-MB-231/ADM cells to both cyclophosphamide and docetaxel in breast cancer.56
miR-622 was associated with differentiation and lymphatic metastasis formation both in vitro and in vivo of human gastric cancer.57 miR-622 suppresses inhibitor of growth family, member 1 (ING1) expression that encodes a tumor suppressor protein which is a nuclear protein that physically interacts with the tumor suppressor protein p53 and is a component of the p53 signaling pathway.58 Several studies have implicated miR-622 to be involved in EMT, to be related to the stem-cell-like phenotype, and to be associated with a switch in paclitaxel responsiveness.59 Thus, it is logical to predict that the inhibition of these miRNAs may serve as a basis for the development of a potentially new therapeutic regimen against ovarian cancer. In the sensitive patient group, only miR-647 showed significance between over- and underexpression on overall survival. The chemo-sensitive patients with overexpression of miR-647 showed good prognosis. Although little is known about miR-647, this is one of the three genes in the predictive biomarker panel negatively associated with recurrence in prostate cancer,60 suggesting potential changes in DNA stability, PI3K signaling, p53 activity, apoptosis, and differentiation consistent with more aggressive disease. These results might implicate miRNA-associated chemo-resistance while the function of these miRNAs in ovarian cancer remains to be clarified.
Taken together, we found a set of miRNAs predictive of overall patient survival. As these miRNAs negatively or positively regulated predicted p53-related networks in a cell type-specific manner, the existence of a good classifier of Taxol resistance and cell line-specific miRNA function may play a role in the effects of chemo-preventive agents in ovarian cancer.
Acknowledgments
We deeply thank PhD student Pankaj Kumar Chaturvedi for his active advice and support. We are also indebted to PhD student Gantumur Battogtokh for his efforts.
Disclosure
This work was supported by the National Research Foundation of Korea (NRF) grant funded by the Korean government (MEST) (NRF-2012R1A2A1A03670430) and a grant (Industry-Academic Cooperation Foundation program) from the Diatech Korea Co. Ltd, Seoul, Republic of Korea. The funders had no role in study design, data collection and analysis, decision to publish, or preparation of the manuscript. The authors report no other conflicts of interest in this work.
References
Ahn JS, Moon SH, Kim J, Chung HM, Kim JK. Identification of differentially expressed genes in human embryonic stem cell-derived endothelial cells using suppression subtractive hybridization. Stem Cells Dev. 2010;19(8):1249–1256. | |
Meyn RE, Stephens LC, Hunter NR, Milas L. Kinetics of cisplatin-induced apoptosis in murine mammary and ovarian adenocarcinomas. Int J Cancer. 1995;60(5):725–729. | |
Miles GD, Seiler M, Rodriguez L, Rajagopal G, Bhanot G. Identifying microRNA/mRNA dysregulations in ovarian cancer. BMC Res Notes. 2012;5:164. | |
Schultz NA, Werner J, Willenbrock H, et al. MicroRNA expression profiles associated with pancreatic adenocarcinoma and ampullary adenocarcinoma. Mod Path. 2012;25(12):1609–1622. | |
Chao A, Lin CY, Lee YS, et al. Regulation of ovarian cancer progression by microRNA-187 through targeting Disabled homolog-2. Oncogene. 2012;31(6):764–775. | |
Bloomston M, Frankel WL, Petrocca F, et al. MicroRNA expression patterns to differentiate pancreatic adenocarcinoma from normal pancreas and chronic pancreatitis. JAMA. 2007;297(17):1901–1908. | |
Lee KH, Chen YL, Yeh SD, et al. MicroRNA-330 acts as tumor suppressor and induces apoptosis of prostate cancer cells through E2F1-mediated suppression of Akt phosphorylation. Oncogene. 2009;28(38):3360–3370. | |
Uhlmann S, Mannsperger H, Zhang JD, et al. Global microRNA level regulation of EGFR-driven cell-cycle protein network in breast cancer. Mol Syst Biol. 2012;8:570. | |
Krichevsky AM, Gabriely G. miR-21: a small multi-faceted RNA. J Cell Mol Med. 2009;13(1):39–53. | |
Singh A, Settleman J. EMT, cancer stem cells and drug resistance: an emerging axis of evil in the war on cancer. Oncogene. 2010;29(34):4741–4751. | |
Blower PE, Chung JH, Verducci JS, et al. MicroRNAs modulate the chemosensitivity of tumor cells. Mol Cancer Ther. 2008;7(1):1–9. | |
Bian HB, Pan X, Yang JS, Wang ZX, De W. Upregulation of microRNA-451 increases cisplatin sensitivity of non-small cell lung cancer cell line (A549). J Exp Clin Cancer Res. 2011;30:20. | |
Hamano R, Miyata H, Yamasaki M, et al. Overexpression of miR-200c induces chemoresistance in esophageal cancers mediated through activation of the Akt signaling pathway. Clin Cancer Res. 2011;17(9):3029–3038. | |
Zhou M, Liu Z, Zhao Y, et al. MicroRNA-125b confers the resistance of breast cancer cells to paclitaxel through suppression of pro-apoptotic Bcl-2 antagonist killer 1 (Bak1) expression. J Biol Chem. 2010;285(28):21496–21507. | |
Nam EJ, Yoon H, Kim SW, et al. MicroRNA expression profiles in serous ovarian carcinoma. Clin Cancer Res. 2008;14(9):2690–2695. | |
Hu X, Macdonald DM, Huettner PC, et al. A miR-200 microRNA cluster as prognostic marker in advanced ovarian cancer. Gynecol Oncol. 2009;114(3):457–464. | |
Phillips HS, Kharbanda S, Chen R, et al. Molecular subclasses of high-grade glioma predict prognosis, delineate a pattern of disease progression, and resemble stages in neurogenesis. Cancer Cell. 2006;9(3):157–173. | |
Kim YW, Kwon C, Liu JL, Kim SH, Kim S. Cancer association study of aminoacyl-tRNA synthetase signaling network in glioblastoma. PloS one. 2012;7(8):e40960. | |
Itamochi H, Oishi T, Shimada M, et al. Inhibiting the mTOR pathway synergistically enhances cytotoxicity in ovarian cancer cells induced by etoposide through upregulation of c-Jun. Clin Cancer Res. 2011;17(14):4742–4750. | |
Bazzaro M, Santillan A, Lin Z, et al. Myosin II co-chaperone general cell UNC-45 overexpression is associated with ovarian cancer, rapid proliferation, and motility. Am J Pathol. 2007;171(5):1640–1649. | |
Singer G, Oldt R 3rd, Cohen Y, et al. Mutations in BRAF and KRAS characterize the development of low-grade ovarian serous carcinoma. J Natl Cancer Inst. 2003;95(6):484–486. | |
Kim YW, Bae SM, Battogtokh G, Bang HJ, Ahn WS. Synergistic anti-tumor effects of combination of photodynamic therapy and arsenic compound in cervical cancer cells: in vivo and in vitro studies. PloS one. 2012;7(6):e38583. | |
Yan M, Xu H, Waddell N, et al. Enhanced RAD21 cohesin expression confers poor prognosis in BRCA2 and BRCAX, but not BRCA1 familial breast cancers. Breast Cancer Res. 2012;14(2):R69. | |
Pradervand S, Weber J, Thomas J, et al. Impact of normalization on miRNA microarray expression profiling. RNA. 2009;15(3):493–501. | |
Griffiths-Jones S, Saini HK, van Dongen S, Enright AJ. miRBase: tools for microRNA genomics. Nucleic Acids Res. 2008;36(Database issue):D154–D158. | |
Creighton CJ, Hernandez-Herrera A, Jacobsen A, et al. Integrated analyses of microRNAs demonstrate their widespread influence on gene expression in high-grade serous ovarian carcinoma. PloS one. 2012;7(3):e34546. | |
Ahmet I, Spangler E, Shukitt-Hale B, Joseph JA, Ingram DK, Talan M. Survival and cardioprotective benefits of long-term blueberry enriched diet in dilated cardiomyopathy following myocardial infarction in rats. PloS One. 2009;4(11):e7975. | |
Kim YW, Liu TJ, Koul D, et al. Identification of novel synergistic targets for rational drug combinations with PI3 kinase inhibitors using siRNA synthetic lethality screening against GBM. Neuro Oncol. 2011;13(4):367–375. | |
Yi C, Wang Q, Wang L, et al. MiR-663, a microRNA targeting p21(WAF1/CIP1), promotes the proliferation and tumorigenesis of nasopharyngeal carcinoma. Oncogene. 2012;31(41):4421–4433. | |
Lu Y, Govindan R, Wang L, et al. MicroRNA profiling and prediction of recurrence/relapse-free survival in stage I lung cancer. Carcinogenesis. 2012;33(5):1046–1054. | |
Li D, Zhao Y, Liu C, et al. Analysis of MiR-195 and MiR-497 expression, regulation and role in breast cancer. Clin Cancer Res. 2011;17(7):1722–1730. | |
Xu T, Zhu Y, Xiong Y, Ge YY, Yun JP, Zhuang SM. MicroRNA-195 suppresses tumorigenicity and regulates G1/S transition of human hepatocellular carcinoma cells. Hepatology. 2009;50(1):113–121. | |
Liu L, Chen L, Xu Y, Li R, Du X. microRNA-195 promotes apoptosis and suppresses tumorigenicity of human colorectal cancer cells. Biochem Biophys Res Commun. 2010;400(2):236–240. | |
Yamakuchi M, Lotterman CD, Bao C, et al. P53-induced microRNA-107 inhibits HIF-1 and tumor angiogenesis. Proc Natl Acad Sci U S A. 2010;107(14):6334–6339. | |
Network TCGAR. Integrated genomic analyses of ovarian carcinoma. Nature. 2011;474(7353):609–615. | |
Yang D, Sun Y, Hu L, et al. Integrated analyses identify a master microRNA regulatory network for the mesenchymal subtype in serous ovarian cancer. Cancer Cell. 2013;23(2):186–199. | |
Kim YW, Bae SM, Lim H, Kim YJ, Ahn WS. Development of multiplexed bead-based immunoassays for the detection of early stage ovarian cancer using a combination of serum biomarkers. PloS one. 2012;7(9):e44960. | |
Calin GA, Croce CM. MicroRNA signatures in human cancers. Nature Rev Cancer. 2006;6(11):857–866. | |
Wyman SK, Parkin RK, Mitchell PS, et al. Repertoire of microRNAs in epithelial ovarian cancer as determined by next generation sequencing of small RNA cDNA libraries. PloS One. 2009;4(4):e5311. | |
Bearfoot JL, Choong DY, Gorringe KL, Campbell IG. Genetic analysis of cancer-implicated MicroRNA in ovarian cancer. Clin Cancer Res. 2008;14(22):7246–7250. | |
Yu SL, Chen HY, Chang GC, et al. MicroRNA signature predicts survival and relapse in lung cancer. Cancer Cell. 2008;13(1):48–57. | |
Eitan R, Kushnir M, Lithwick-Yanai G, et al. Tumor microRNA expression patterns associated with resistance to platinum based chemotherapy and survival in ovarian cancer patients. Gynecol Oncol. 2009;114(2):253–259. | |
Zhao X, Yang L, Hu J. Down-regulation of miR-27a might inhibit proliferation and drug resistance of gastric cancer cells. J Exp Clin Cancer Res. 2011;30:55. | |
Zhu H, Wu H, Liu X, et al. Role of MicroRNA miR-27a and miR-451 in the regulation of MDR1/P-glycoprotein expression in human cancer cells. Biochem Pharmacol. 2008;76(5):582–588. | |
Creighton CJ, Fountain MD, Yu Z, et al. Molecular profiling uncovers a p53-associated role for microRNA-31 in inhibiting the proliferation of serous ovarian carcinomas and other cancers. Cancer Res. 2010;70(5):1906–1915. | |
Fu X, Tian J, Zhang L, Chen Y, Hao Q. Involvement of microRNA-93, a new regulator of PTEN/Akt signaling pathway, in regulation of chemotherapeutic drug cisplatin chemosensitivity in ovarian cancer cells. FEBS Letters. 2012;586(9):1279–1286. | |
Sorrentino A, Liu CG, Addario A, Peschle C, Scambia G, Ferlini C. Role of microRNAs in drug-resistant ovarian cancer cells. Gynecol Oncol. 2008;111(3):478–486. | |
Pan J, Hu H, Zhou Z, et al. Tumor-suppressive miR-663 gene induces mitotic catastrophe growth arrest in human gastric cancer cells. Oncol Rep. 2010;24(1):105–112. | |
Su H, Yang JR, Xu T, et al. MicroRNA-101, down-regulated in hepatocellular carcinoma, promotes apoptosis and suppresses tumorigenicity. Cancer Res. 2009;69(3):1135–1142. | |
Zhou X, Zhao F, Wang ZN, et al. Altered expression of miR-152 and miR-148a in ovarian cancer is related to cell proliferation. Oncol Rep. 2012;27(2):447–454. | |
Holleman A, Chung I, Olsen RR, et al. miR-135a contributes to paclitaxel resistance in tumor cells both in vitro and in vivo. Oncogene. 2011;30(43):4386–4398. | |
Sakamoto M, Kondo A, Kawasaki K, et al. Analysis of gene expression profiles associated with cisplatin resistance in human ovarian cancer cell lines and tissues using cDNA microarray. Human Cell. 2001;14(4):305–315. | |
Dimanche-Boitrel MT, Micheau O, Hammann A, et al. Contribution of the cyclin-dependent kinase inhibitor p27KIP1 to the confluence-dependent resistance of HT29 human colon carcinoma cells. Int J Cancer. 1998;77(5):796–802. | |
Eymin B, Haugg M, Droin N, Sordet O, Dimanche-Boitrel MT, Solary E. p27Kip1 induces drug resistance by preventing apoptosis upstream of cytochrome c release and procaspase-3 activation in leukemic cells. Oncogene. 1999;18(7):1411–1418. | |
Liu ZY, Zhang GL, Wang MM, Xiong YN, Cui HQ. MicroRNA-663 targets TGFB1 and regulates lung cancer proliferation. Asian Pac J Cancer Prev. 2011;12(11):2819–2823. | |
Hu H, Li S, Cui X, et al. The overexpression of hypomethylated miR-663 induces chemotherapy resistance in human breast cancer cells by targeting heparin sulfate proteoglycan 2 (HSPG2). J Biol Chem. 2013;288(16):10973–10985. | |
Guo XB, Jing CQ, Li LP, et al. Down-regulation of miR-622 in gastric cancer promotes cellular invasion and tumor metastasis by targeting ING1 gene. World J Gastroenterol. 2011;17(14):1895–1902. | |
Gunduz M, Demircan K, Gunduz E, Katase N, Tamamura R, Nagatsuka H. Potential usage of ING family members in cancer diagnostics and molecular therapy. Curr Drug Targets. 2009;10(5):465–476. | |
Riaz M, van Jaarsveld MT, Hollestelle A, et al. miRNA expression profiling of 51 human breast cancer cell lines reveals subtype and driver mutation-specific miRNAs. Breast Cancer Res. 2013;15(2):R33. | |
Long Q, Johnson BA, Osunkoya AO, et al. Protein-coding and microRNA biomarkers of recurrence of prostate cancer following radical prostatectomy. Am J Pathol. 2011;179(1):46–54. |
Supplementary material
 | Figure S1 Differential miRNA expression signatures between five ovarian cancer cells and two normal ovarian cells. |
 | Figure S2 Differential miRNA expression signatures between five ovarian cancer cells and two normal ovarian cells. |
 | Figure S3 Fold changes (log2[ovarian cancer cells/normal ovarian cells]) in gene expression measured by qRT-PCR. |
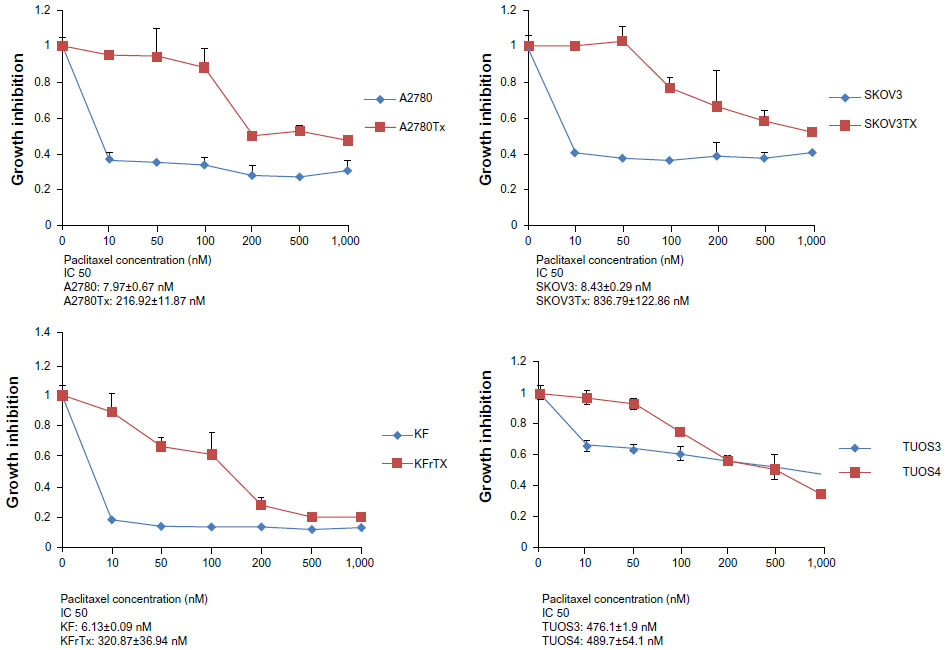 | Figure S4 Taxol resistance as confirmed by MTT assay. |
 | Figure S5 Fold changes (ovarian cancer cells/normal ovarian cells) in miRNA expression measured by qRT-PCR. |
 | Figure S6 Fold changes (Taxol-resistant ovarian cancer cells/parental Taxol-sensitive cells) in gene expression measured by qRT-PCR. |
 | Figure S7 miRNA expression-dominant groups correlated with survival in Taxol resistance. |
 | Figure S8 Inhibition effects of target genes of three miRNA in A2780/A2780-Tx and SKOV3/SKOV3-Tx. |
 | Figure S9 Integrated view of miR-663 regulated by miRNA. |
 | Figure S10 Integrated view of miR-622 regulated by miRNA. |
 © 2014 The Author(s). This work is published and licensed by Dove Medical Press Limited. The full terms of this license are available at https://www.dovepress.com/terms.php and incorporate the Creative Commons Attribution - Non Commercial (unported, v3.0) License.
By accessing the work you hereby accept the Terms. Non-commercial uses of the work are permitted without any further permission from Dove Medical Press Limited, provided the work is properly attributed. For permission for commercial use of this work, please see paragraphs 4.2 and 5 of our Terms.
© 2014 The Author(s). This work is published and licensed by Dove Medical Press Limited. The full terms of this license are available at https://www.dovepress.com/terms.php and incorporate the Creative Commons Attribution - Non Commercial (unported, v3.0) License.
By accessing the work you hereby accept the Terms. Non-commercial uses of the work are permitted without any further permission from Dove Medical Press Limited, provided the work is properly attributed. For permission for commercial use of this work, please see paragraphs 4.2 and 5 of our Terms.